
Nihat Cetinkaya 1
682 Posts

Nihat Cetinkaya 1
Report
Block User
Kendi işlemlerim ve çalışmalarım olup yatırım tavsiyesi içermez.
#bist #Crypto #Forex
0 Following
3 Followers
2 Liked
Posts
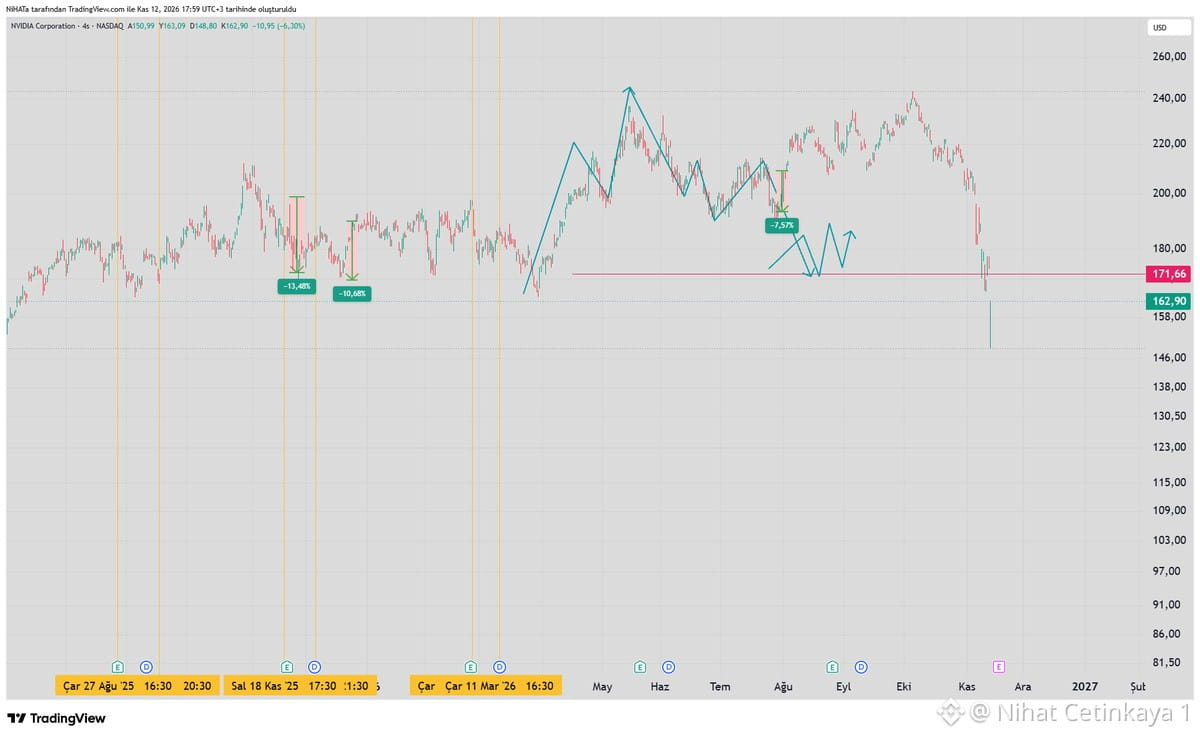
After doing this to #nvdia stock, whose CEO resigned, what wouldn’t they do to #bitcoin...
After doing this to #nvdia stock, whose CEO resigned, what wouldn’t they do to #bitcoin...
8
Is the Bitcoin Rally Over? Fed and Liquidity Pressures Continue
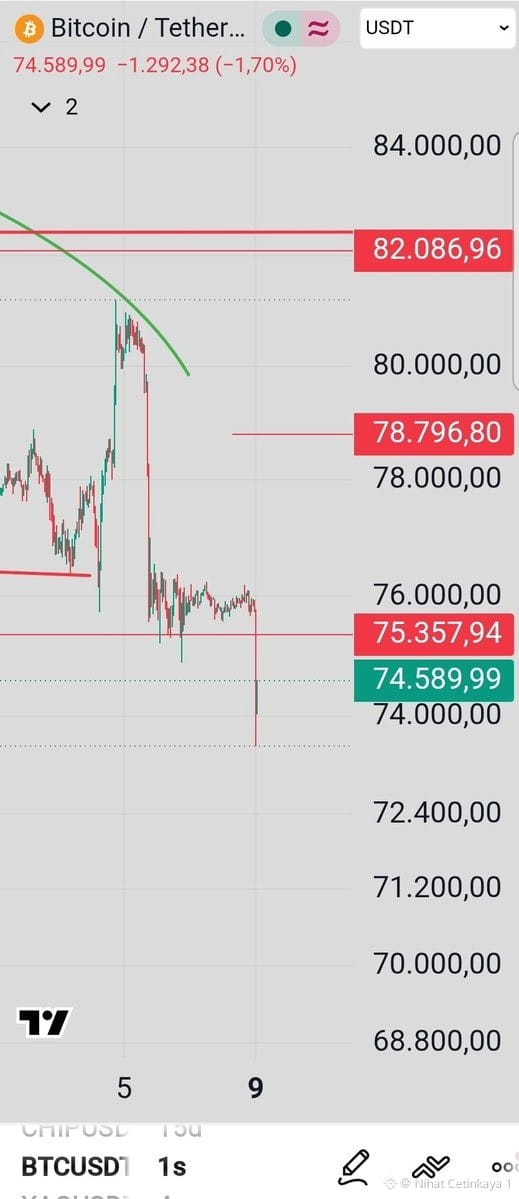
Bitcoin, which hit 80,000 last week, is around 73,500 $ today. Oil fell and the stock market recovered, but sell-offs in tech stocks also affected BTC.
We’ve fallen below the 76,000 support level. I think going long is risky until this level is reclaimed.
The source of the pressure: the Fed’s interest rate policy + ongoing liquidity problems.
My expectation: pressure may continue in the short term, but I’m still positive in the long term. It’s important not to be swayed by short-term movements.
Full video: https://t.co/LPwz739MCn
This is not investment advice.
#bitcoin #btc #crypto #fed #fedinterestrates #liquidity #cetinfinans
Is the Bitcoin Rally Over? Fed and Liquidity Pressures Continue
Bitcoin, which hit 80,000 last week, is around 73,500 $ today. Oil fell and the stock market recovered, but sell-offs in tech stocks also affected BTC.
We’ve fallen below the 76,000 support level. I think going long is risky until this level is reclaimed.
The source of the pressure: the Fed’s interest rate policy + ongoing liquidity problems.
My expectation: pressure may continue in the short term, but I’m still positive in the long term. It’s important not to be swayed by short-term movements.
Full video: https://t.co/LPwz739MCn
This is not investment advice.
#bitcoin #btc #crypto #fed #fedinterestrates #liquidity #cetinfinans
Bitcoin, which hit 80,000 last week, is around 73,500 $ today. Oil fell and the stock market recovered, but sell-offs in tech stocks also affected BTC.
We’ve fallen below the 76,000 support level. I think going long is risky until this level is reclaimed.
The source of the pressure: the Fed’s interest rate policy + ongoing liquidity problems.
My expectation: pressure may continue in the short term, but I’m still positive in the long term. It’s important not to be swayed by short-term movements.
Full video: https://t.co/LPwz739MCn
This is not investment advice.
#bitcoin #btc #crypto #fed #fedinterestrates #liquidity #cetinfinans
15
The CBRT announced its final Inflation Report of the year. Forecasts were raised.
End of 2026: 28% → 29.5%
Annual inflation was 29.77% in October.
I think the main issue is that rising oil and natural gas prices, driven by the energy war, are slowing disinflation.
Interest rate cuts may continue, but at a slower pace.
✅ The bright side
Underlying trend is falling (~1.7%)
Rent and services inflation is slowing
Demand is weak, and credit growth has fallen to ~20%
So the underlying trend is improving, but headline inflation is being held back by energy.
The policy rate is currently 36%.
Cuts may continue, but the steps will remain small.
The key data point will be November inflation, due to be announced in early December.
This is not investment advice.
The CBRT announced its final Inflation Report of the year. Forecasts were raised.
End of 2026: 28% → 29.5%
Annual inflation was 29.77% in October.
I think the main issue is that rising oil and natural gas prices, driven by the energy war, are slowing disinflation.
Interest rate cuts may continue, but at a slower pace.
✅ The bright side
Underlying trend is falling (~1.7%)
Rent and services inflation is slowing
Demand is weak, and credit growth has fallen to ~20%
So the underlying trend is improving, but headline inflation is being held back by energy.
The policy rate is currently 36%.
Cuts may continue, but the steps will remain small.
The key data point will be November inflation, due to be announced in early December.
This is not investment advice.
End of 2026: 28% → 29.5%
Annual inflation was 29.77% in October.
I think the main issue is that rising oil and natural gas prices, driven by the energy war, are slowing disinflation.
Interest rate cuts may continue, but at a slower pace.
✅ The bright side
Underlying trend is falling (~1.7%)
Rent and services inflation is slowing
Demand is weak, and credit growth has fallen to ~20%
So the underlying trend is improving, but headline inflation is being held back by energy.
The policy rate is currently 36%.
Cuts may continue, but the steps will remain small.
The key data point will be November inflation, due to be announced in early December.
This is not investment advice.
74
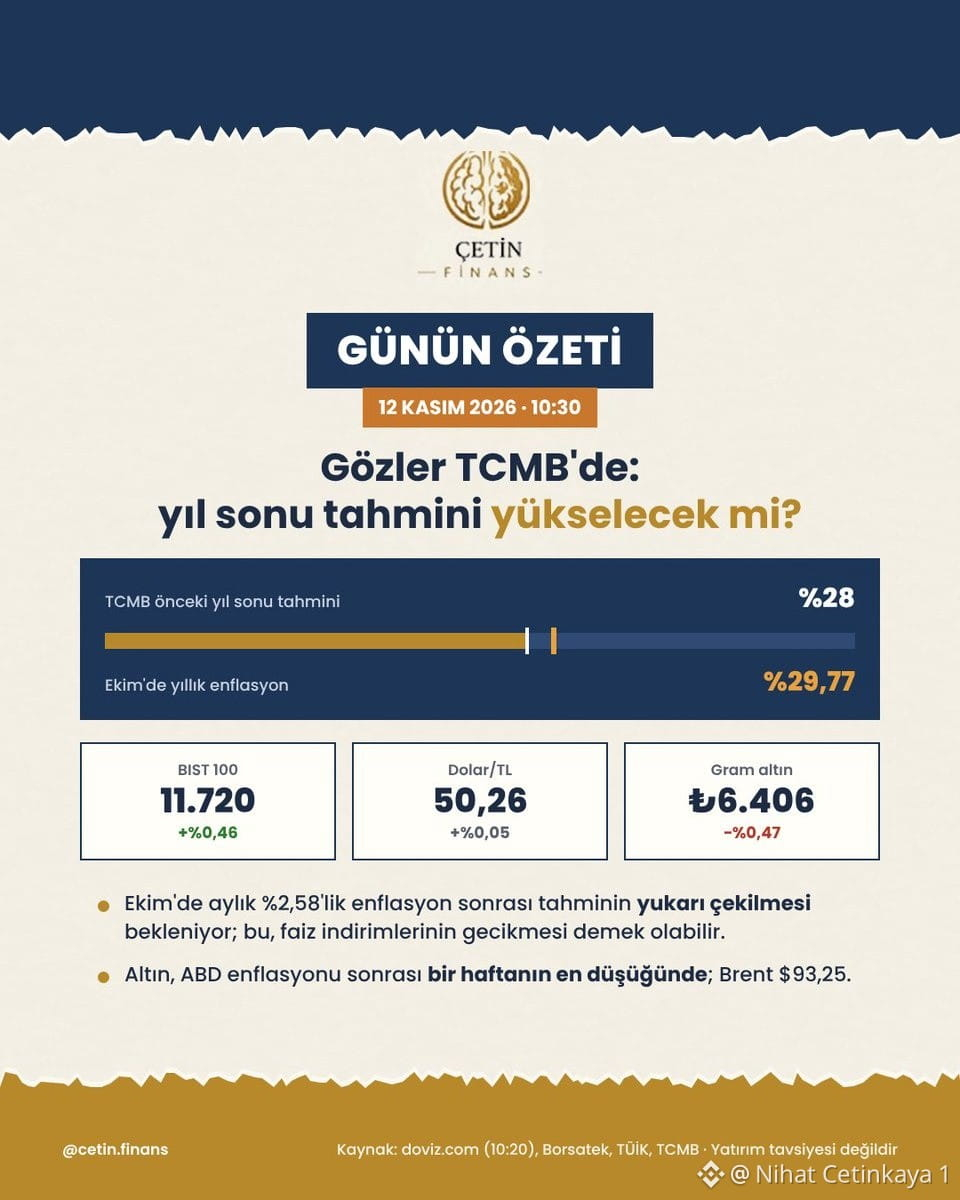
Eyes on the CBRT: Will the year-end inflation forecast rise?
The previous forecast was 28%; annual inflation in October came in at 29.77%. After the monthly figure of 2.58%, the forecast is expected to be revised upward.
This could mean interest rate cuts are delayed.
🥇 Gram gold ₺6,406. Gold has fallen to its lowest level in a week. #gramgold
Eyes on the CBRT: Will the year-end inflation forecast rise?
The previous forecast was 28%; annual inflation in October came in at 29.77%. After the monthly figure of 2.58%, the forecast is expected to be revised upward.
This could mean interest rate cuts are delayed.
🥇 Gram gold ₺6,406. Gold has fallen to its lowest level in a week. #gramgold
The previous forecast was 28%; annual inflation in October came in at 29.77%. After the monthly figure of 2.58%, the forecast is expected to be revised upward.
This could mean interest rate cuts are delayed.
🥇 Gram gold ₺6,406. Gold has fallen to its lowest level in a week. #gramgold
72
Good morning, everyone. How are the latest transactions? Where do we stand?
Good morning, everyone. How are the latest transactions? Where do we stand?
Doğuş Otomotiv: Cheap or a Trap?
Detailed analysis
If you sold all of Doğuş Otomotiv today, its assets would be worth nearly three times its market value. Despite that, it can’t find buyers in the market and move higher.
Technically, it should have reached the 185 target, but given the circumstances, that had an impact too. We were wrong on that part. No analysis can be right all the time; what matters is portfolio management and consistent returns.
The company appears to have posted a profit of 2.05 billion lira in nine months, but that includes 3.3 billion lira in “monetary gains.”
My calculation is simple. From 128 to 180 is roughly 40% upside, while a drop to 108 is about 16% downside. In other words, my downside risk is less than half my upside potential. But I’m not saying it will happen quickly.
#doas #stockanalysis
What I share reflects my own portfolio and analysis; it is not investment advice. Make your decision based on your own risk tolerance.
https://t.co/WwtSgIIAO6
Doğuş Otomotiv: Cheap or a Trap?
Detailed analysis
If you sold all of Doğuş Otomotiv today, its assets would be worth nearly three times its market value. Despite that, it can’t find buyers in the market and move higher.
Technically, it should have reached the 185 target, but given the circumstances, that had an impact too. We were wrong on that part. No analysis can be right all the time; what matters is portfolio management and consistent returns.
The company appears to have posted a profit of 2.05 billion lira in nine months, but that includes 3.3 billion lira in “monetary gains.”
My calculation is simple. From 128 to 180 is roughly 40% upside, while a drop to 108 is about 16% downside. In other words, my downside risk is less than half my upside potential. But I’m not saying it will happen quickly.
#doas #stockanalysis
What I share reflects my own portfolio and analysis; it is not investment advice. Make your decision based on your own risk tolerance.
https://t.co/WwtSgIIAO6
Detailed analysis
If you sold all of Doğuş Otomotiv today, its assets would be worth nearly three times its market value. Despite that, it can’t find buyers in the market and move higher.
Technically, it should have reached the 185 target, but given the circumstances, that had an impact too. We were wrong on that part. No analysis can be right all the time; what matters is portfolio management and consistent returns.
The company appears to have posted a profit of 2.05 billion lira in nine months, but that includes 3.3 billion lira in “monetary gains.”
My calculation is simple. From 128 to 180 is roughly 40% upside, while a drop to 108 is about 16% downside. In other words, my downside risk is less than half my upside potential. But I’m not saying it will happen quickly.
#doas #stockanalysis
What I share reflects my own portfolio and analysis; it is not investment advice. Make your decision based on your own risk tolerance.
https://t.co/WwtSgIIAO6
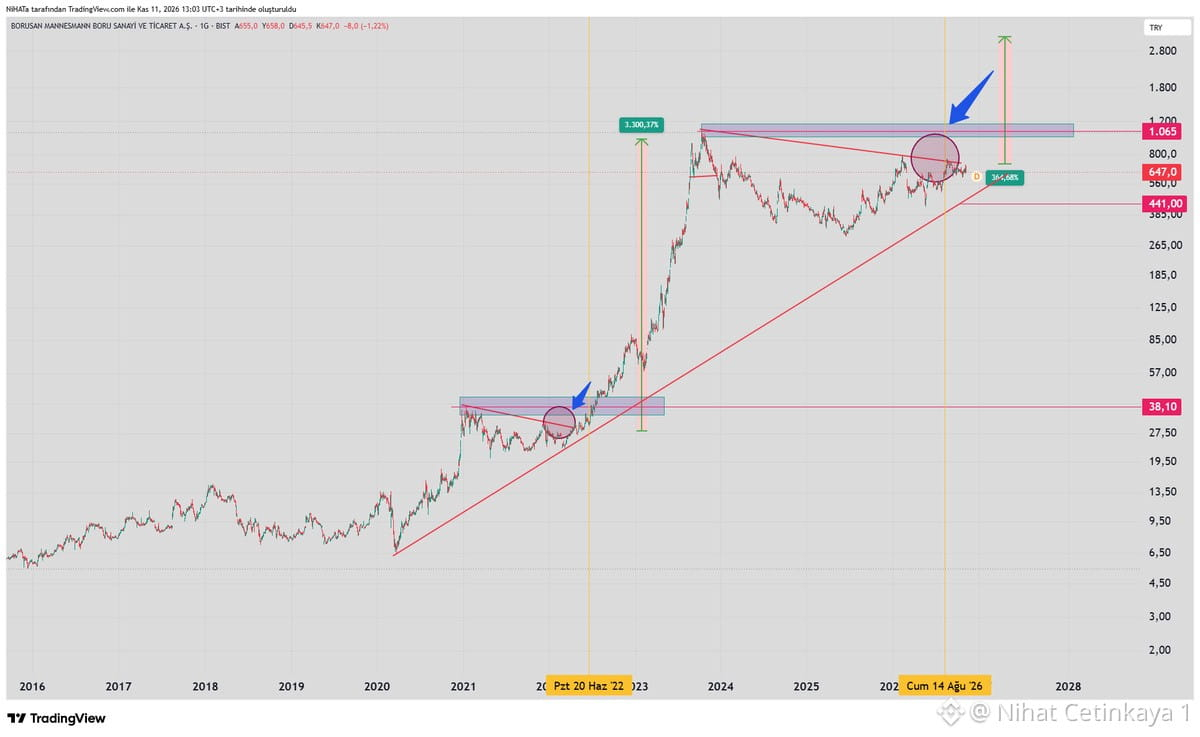
Brsan, we shared this in the past.
There doesn't seem to be an issue in the long term, but if I were buying, I'd start around 441 at the earliest.
For now, I don't want to take action before then. I've set an alert; if it triggers, we'll analyze it in detail on the next review list.
#brsan
Brsan, we shared this in the past.
There doesn't seem to be an issue in the long term, but if I were buying, I'd start around 441 at the earliest.
For now, I don't want to take action before then. I've set an alert; if it triggers, we'll analyze it in detail on the next review list.
#brsan
There doesn't seem to be an issue in the long term, but if I were buying, I'd start around 441 at the earliest.
For now, I don't want to take action before then. I've set an alert; if it triggers, we'll analyze it in detail on the next review list.
#brsan
If DOAS stockholders are here, let's do our analysis
#doas
If DOAS stockholders are here, let's do our analysis
#doas
#doas
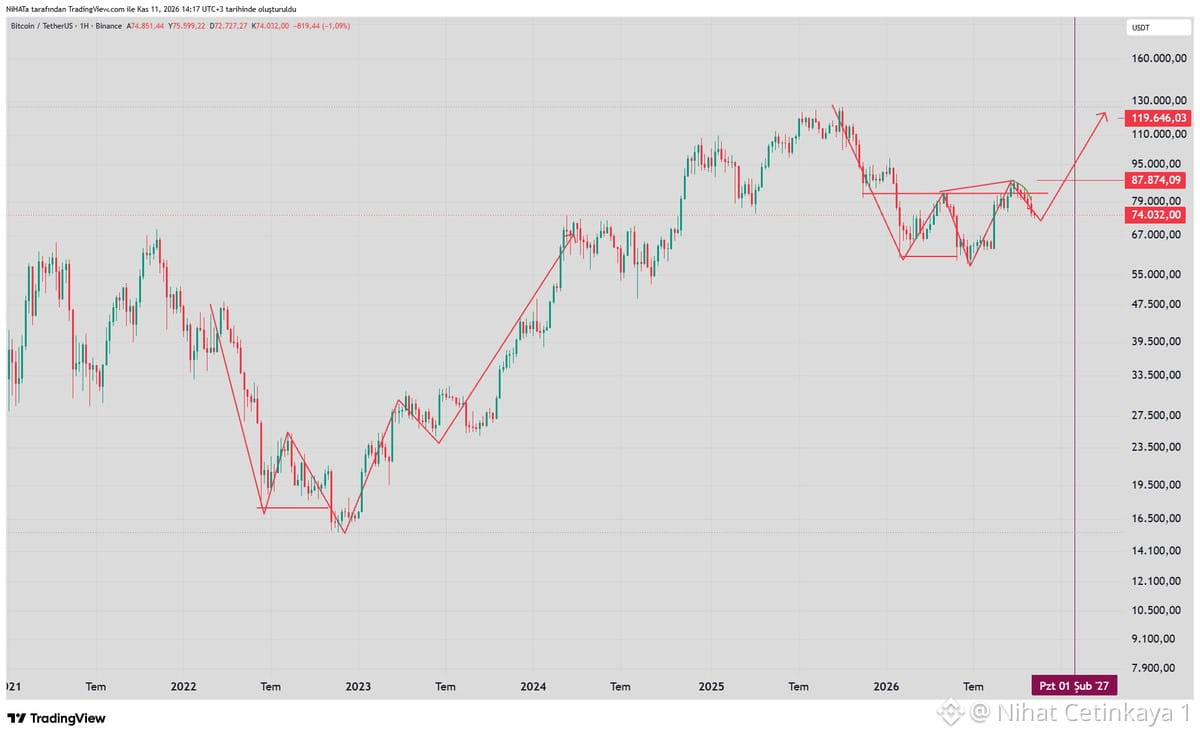
BTC Long-Term Analysis – A Similar Pattern Is Repeating
The same cyclical pattern is historically repeating on the chart.
In the previous major move, after liquidity was taken at the bottom, price broke out of a strong Order Block zone and the rally began.
A similar pattern is forming now.
Price dipped below the previous swing low area, clearing liquidity.
Although this move may seem “discouraging” to long-term investors, technically it has the same characteristics as previous cycles.
Short-term traders continue to battle in this area; buying and selling pressure is high, and volatility persists.
However, the bigger picture remains intact.
This is not investment advice, only an analysis of technical similarities.
#Bitcoin
BTC Long-Term Analysis – A Similar Pattern Is Repeating
The same cyclical pattern is historically repeating on the chart.
In the previous major move, after liquidity was taken at the bottom, price broke out of a strong Order Block zone and the rally began.
A similar pattern is forming now.
Price dipped below the previous swing low area, clearing liquidity.
Although this move may seem “discouraging” to long-term investors, technically it has the same characteristics as previous cycles.
Short-term traders continue to battle in this area; buying and selling pressure is high, and volatility persists.
However, the bigger picture remains intact.
This is not investment advice, only an analysis of technical similarities.
#Bitcoin
The same cyclical pattern is historically repeating on the chart.
In the previous major move, after liquidity was taken at the bottom, price broke out of a strong Order Block zone and the rally began.
A similar pattern is forming now.
Price dipped below the previous swing low area, clearing liquidity.
Although this move may seem “discouraging” to long-term investors, technically it has the same characteristics as previous cycles.
Short-term traders continue to battle in this area; buying and selling pressure is high, and volatility persists.
However, the bigger picture remains intact.
This is not investment advice, only an analysis of technical similarities.
#Bitcoin
34
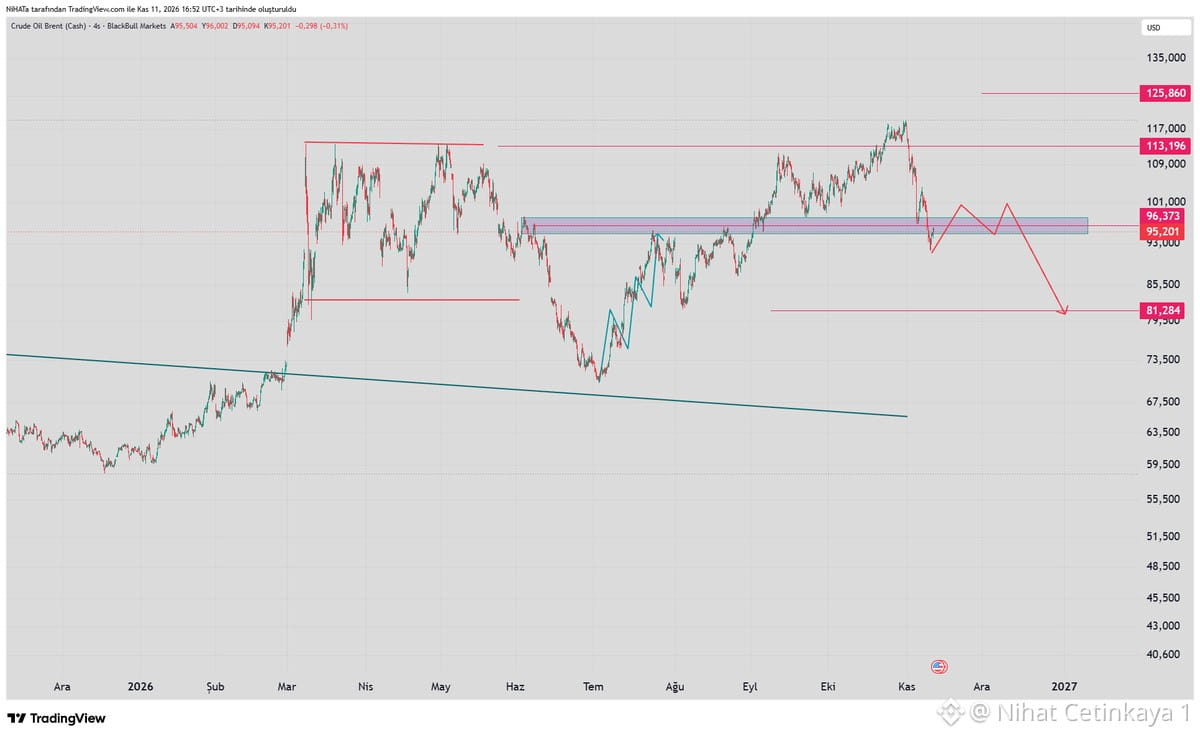
Good days are near #Gold hold on to your silver. My general expectation is a decline, but it could test $100 as a rebound; there's no need to panic. I think it will drop to $81.
The recovery in precious metals continues as the decline in oil prices eases inflation concerns.
The chart is here; let's also make a video about this.
#brent #gold #silver
Good days are near #Gold hold on to your silver. My general expectation is a decline, but it could test $100 as a rebound; there's no need to panic. I think it will drop to $81.
The recovery in precious metals continues as the decline in oil prices eases inflation concerns.
The chart is here; let's also make a video about this.
#brent #gold #silver
The recovery in precious metals continues as the decline in oil prices eases inflation concerns.
The chart is here; let's also make a video about this.
#brent #gold #silver
34
Good morning, friends. The workday has begun
What have you been up to ❓
Good morning, friends. The workday has begun
What have you been up to ❓
What have you been up to ❓
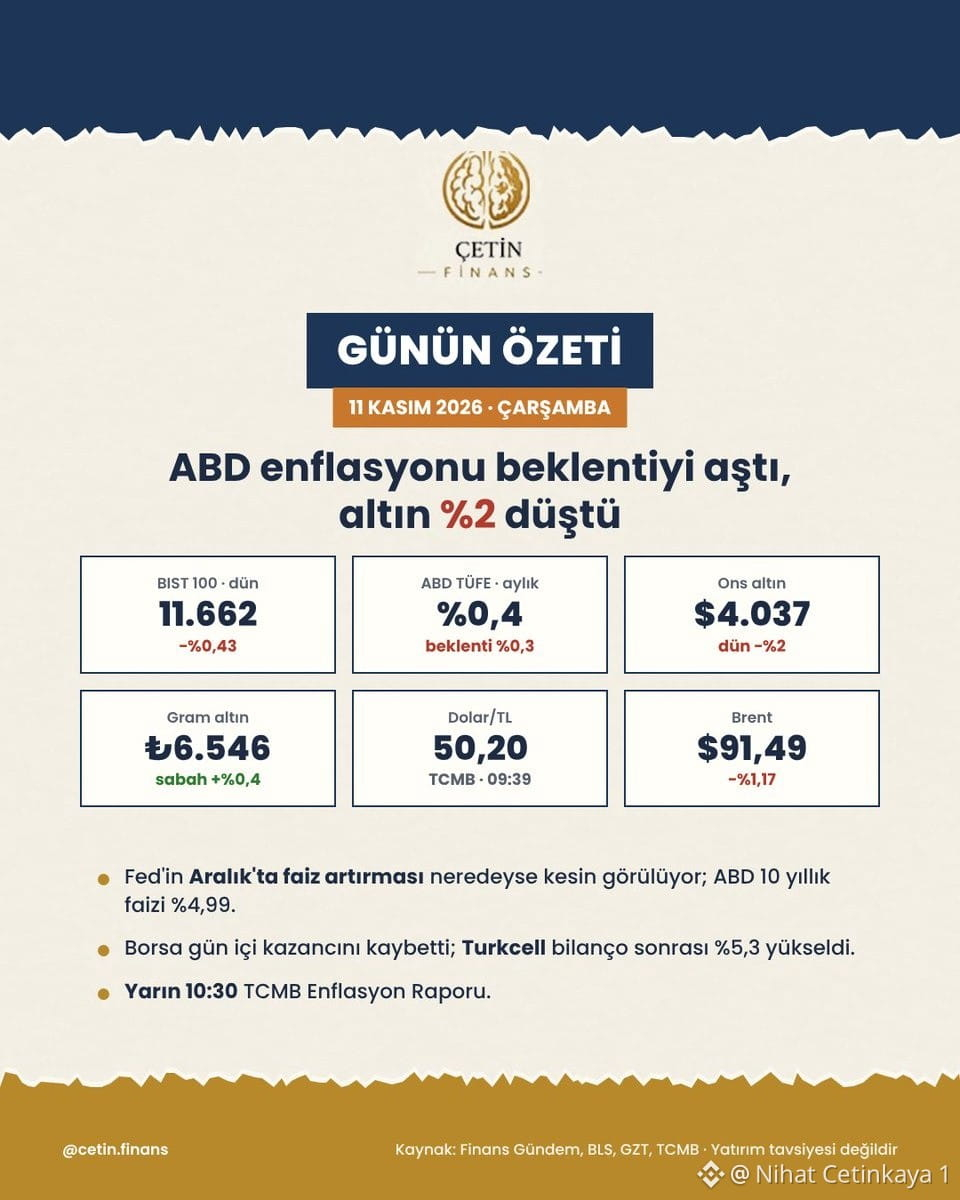
US inflation exceeded expectations, gold fell 2%.
US CPI rose 0.4% month over month in October (expected: 0.3%).
Gold per ounce $4,037 · gram ₺6,546
The BIST 100 closed at 11,662 yesterday, down 0.43%. Turkcell rose 5.3% following its earnings report.
Brent $91.49
The CBRT Inflation Report will be released tomorrow at 10:30.
#stocks #gold #inflation #fed #economy
This is not investment advice.
US inflation exceeded expectations, gold fell 2%.
US CPI rose 0.4% month over month in October (expected: 0.3%).
Gold per ounce $4,037 · gram ₺6,546
The BIST 100 closed at 11,662 yesterday, down 0.43%. Turkcell rose 5.3% following its earnings report.
Brent $91.49
The CBRT Inflation Report will be released tomorrow at 10:30.
#stocks #gold #inflation #fed #economy
This is not investment advice.
US CPI rose 0.4% month over month in October (expected: 0.3%).
Gold per ounce $4,037 · gram ₺6,546
The BIST 100 closed at 11,662 yesterday, down 0.43%. Turkcell rose 5.3% following its earnings report.
Brent $91.49
The CBRT Inflation Report will be released tomorrow at 10:30.
#stocks #gold #inflation #fed #economy
This is not investment advice.
39
Monthly inflation in the U.S. was reported at 0.4%. The expectation was 0.3%.
Everyone was expecting it to slow down this time, hoping it would come in at 0.3%.
But it came in at 0.4%. It was a little lower than the previous month's 0.6%, but not low enough to say things are starting to improve.
Prices are still rising; the pace of increases has just slowed a little.
Food and housing in particular are still a headache. Energy also came in high, though at least not as high as in September.
From the Fed's perspective, this isn't the kind of data that would make them feel they can relax.
They had previously held rates steady because inflation was high. With this figure, the likelihood of a rate hike in December seems to have grown even stronger.
The market had already priced this in to a large extent.
It's not bad news, but it's not good news either.
Inflation is still stubborn, and the Fed's job isn't done.
This could also put some pressure on the dollar.
Monthly inflation in the U.S. was reported at 0.4%. The expectation was 0.3%.
Everyone was expecting it to slow down this time, hoping it would come in at 0.3%.
But it came in at 0.4%. It was a little lower than the previous month's 0.6%, but not low enough to say things are starting to improve.
Prices are still rising; the pace of increases has just slowed a little.
Food and housing in particular are still a headache. Energy also came in high, though at least not as high as in September.
From the Fed's perspective, this isn't the kind of data that would make them feel they can relax.
They had previously held rates steady because inflation was high. With this figure, the likelihood of a rate hike in December seems to have grown even stronger.
The market had already priced this in to a large extent.
It's not bad news, but it's not good news either.
Inflation is still stubborn, and the Fed's job isn't done.
This could also put some pressure on the dollar.
Everyone was expecting it to slow down this time, hoping it would come in at 0.3%.
But it came in at 0.4%. It was a little lower than the previous month's 0.6%, but not low enough to say things are starting to improve.
Prices are still rising; the pace of increases has just slowed a little.
Food and housing in particular are still a headache. Energy also came in high, though at least not as high as in September.
From the Fed's perspective, this isn't the kind of data that would make them feel they can relax.
They had previously held rates steady because inflation was high. With this figure, the likelihood of a rate hike in December seems to have grown even stronger.
The market had already priced this in to a large extent.
It's not bad news, but it's not good news either.
Inflation is still stubborn, and the Fed's job isn't done.
This could also put some pressure on the dollar.
49
We Called the Rise in Gold: Is It Time to Buy?
People are already panicking, and on top of that, they’re doing everything they can to make people who are at a loss sell their holdings.
Last week, I identified 6,500 as an important level. When I was recording the video, gram gold hadn’t broken this level yet. It’s now around 6,600. 6,500 was the support we lost last week, and we’ve reclaimed it.
It’s normal for it to take a breather here in the short term. Support is at 6,500 per gram; resistance is at 6,800. DOES NOT CONSTITUTE INVESTMENT ADVICE.
#XAUSD #GRAMALTIN #PETROL
https://t.co/9ujHjWqdeA
We Called the Rise in Gold: Is It Time to Buy?
People are already panicking, and on top of that, they’re doing everything they can to make people who are at a loss sell their holdings.
Last week, I identified 6,500 as an important level. When I was recording the video, gram gold hadn’t broken this level yet. It’s now around 6,600. 6,500 was the support we lost last week, and we’ve reclaimed it.
It’s normal for it to take a breather here in the short term. Support is at 6,500 per gram; resistance is at 6,800. DOES NOT CONSTITUTE INVESTMENT ADVICE.
#XAUSD #GRAMALTIN #PETROL
https://t.co/9ujHjWqdeA
People are already panicking, and on top of that, they’re doing everything they can to make people who are at a loss sell their holdings.
Last week, I identified 6,500 as an important level. When I was recording the video, gram gold hadn’t broken this level yet. It’s now around 6,600. 6,500 was the support we lost last week, and we’ve reclaimed it.
It’s normal for it to take a breather here in the short term. Support is at 6,500 per gram; resistance is at 6,800. DOES NOT CONSTITUTE INVESTMENT ADVICE.
#XAUSD #GRAMALTIN #PETROL
https://t.co/9ujHjWqdeA
68
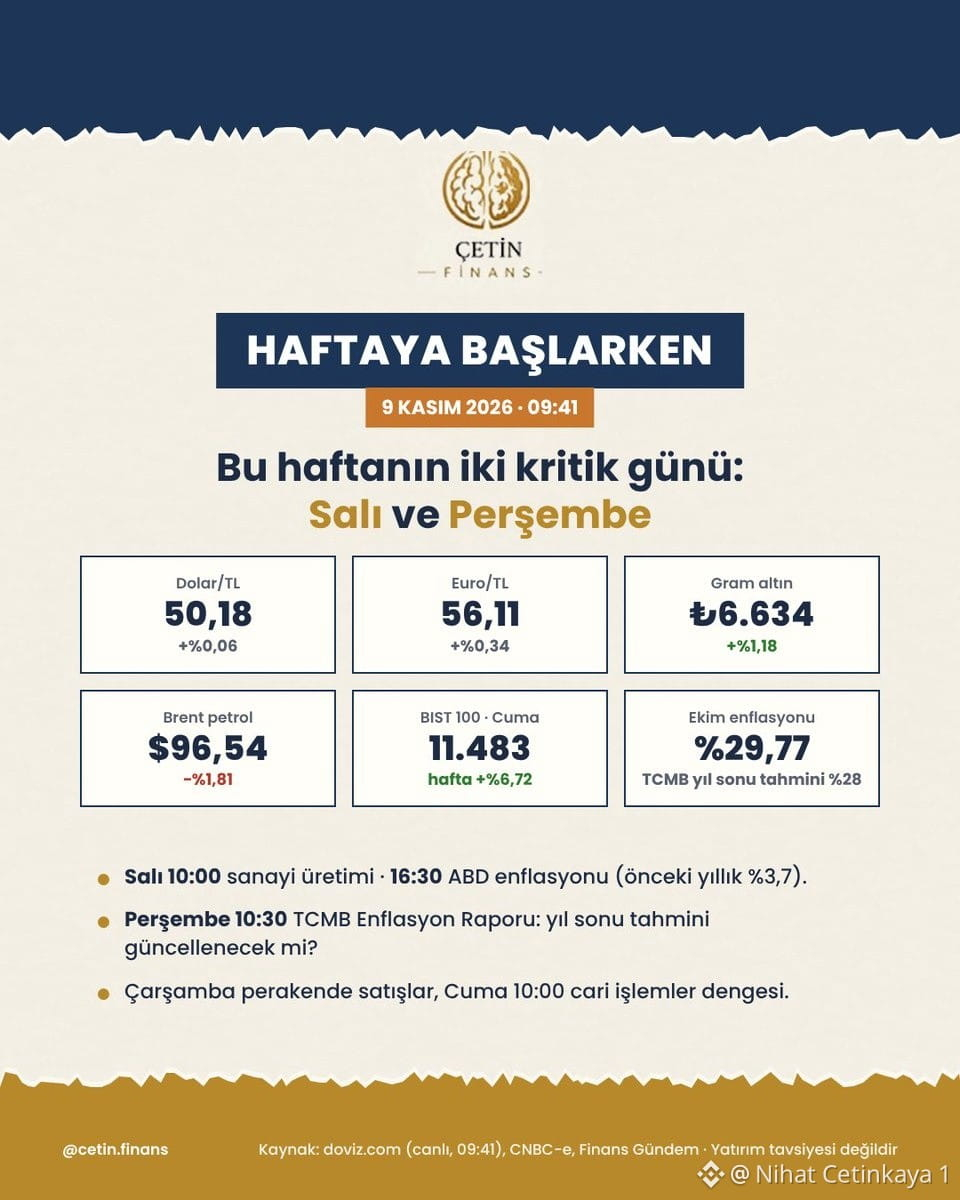
This week's two critical days are Tuesday and Thursday.
Tuesday 10:00 industrial production, 16:30 U.S. inflation
Thursday 10:30 CBRT Inflation Report
Friday 10:00 current account balance
#stockmarket #dollar #gold #inflation #cbrt
This is not investment advice.
This week's two critical days are Tuesday and Thursday.
Tuesday 10:00 industrial production, 16:30 U.S. inflation
Thursday 10:30 CBRT Inflation Report
Friday 10:00 current account balance
#stockmarket #dollar #gold #inflation #cbrt
This is not investment advice.
Tuesday 10:00 industrial production, 16:30 U.S. inflation
Thursday 10:30 CBRT Inflation Report
Friday 10:00 current account balance
#stockmarket #dollar #gold #inflation #cbrt
This is not investment advice.
Good morning! A new week, new expectations, new hopes. How are you, friends?
Good morning! A new week, new expectations, new hopes. How are you, friends?
Hey @grok @thesystemnext, take a look at this system. What features does it have, and what can we do on this platform?
Explain it step by step in a way everyone can understand. How is it different from other systems, and what are its advantages?
Hey @grok @thesystemnext, take a look at this system. What features does it have, and what can we do on this platform?
Explain it step by step in a way everyone can understand. How is it different from other systems, and what are its advantages?
Explain it step by step in a way everyone can understand. How is it different from other systems, and what are its advantages?
Bitcoin keeps pushing boundaries like there’s no tomorrow.
Let’s see whose tape has surfaced this time.
I know about the Nvidia news. Has anything else come out? #Bitcoin
Bitcoin keeps pushing boundaries like there’s no tomorrow.
Let’s see whose tape has surfaced this time.
I know about the Nvidia news. Has anything else come out? #Bitcoin
Let’s see whose tape has surfaced this time.
I know about the Nvidia news. Has anything else come out? #Bitcoin
28
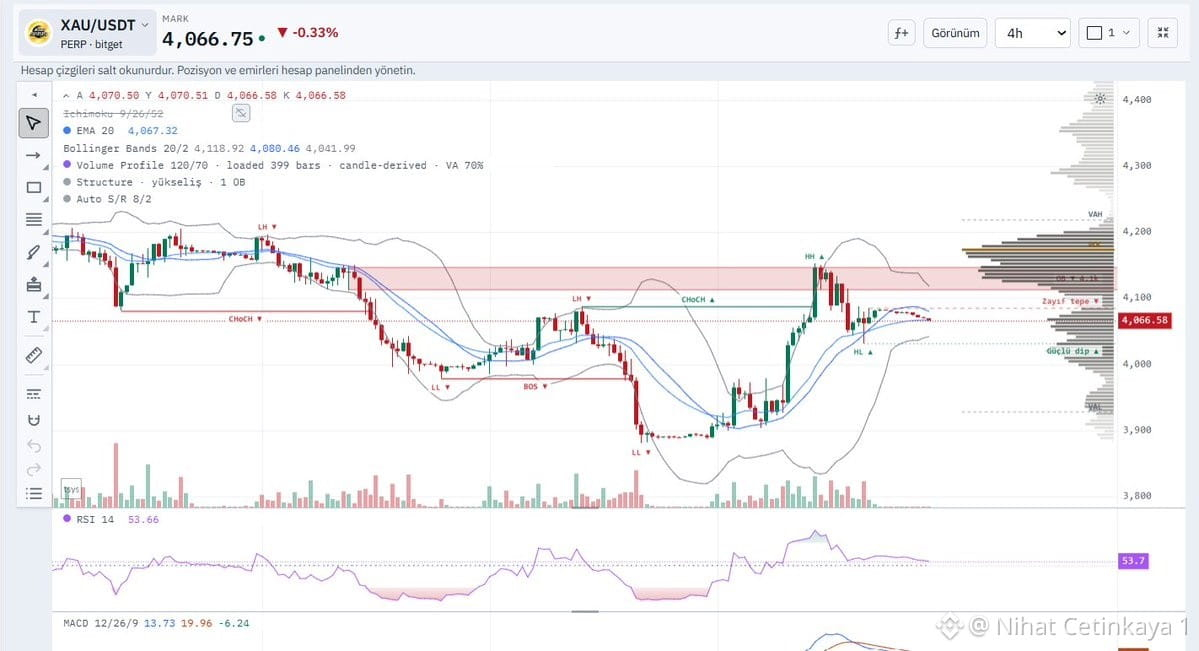
Gold (XAU/USDT) is currently around 4,068.
Overall direction: The daily structure is still bearish, but the 4-hour trend has turned bullish. So the larger trend is down, while there is a short-term recovery.
4,260–4,310: Daily seller zone.
4,350: Upper boundary of the volume zone
Support levels:
4,040– a strong low and a higher low on the 4-hour chart. The first buying reaction is expected here.
4,000: Psychological level.
3,880–3,900: Main support is here.
My expectation: Since 4-hour momentum has weakened, I expect a pullback to 4,040 first.
If there is a reaction from there, the price will retest 4,110–4,145. If it closes above 4,145, 4,170 opens up, followed by 4,260–4,300.
If 4,040 breaks, 4,000, then 3,880–3,900 come into focus.
Does not constitute investment advice; this is my own watchlist #gold
Gold (XAU/USDT) is currently around 4,068.
Overall direction: The daily structure is still bearish, but the 4-hour trend has turned bullish. So the larger trend is down, while there is a short-term recovery.
4,260–4,310: Daily seller zone.
4,350: Upper boundary of the volume zone
Support levels:
4,040– a strong low and a higher low on the 4-hour chart. The first buying reaction is expected here.
4,000: Psychological level.
3,880–3,900: Main support is here.
My expectation: Since 4-hour momentum has weakened, I expect a pullback to 4,040 first.
If there is a reaction from there, the price will retest 4,110–4,145. If it closes above 4,145, 4,170 opens up, followed by 4,260–4,300.
If 4,040 breaks, 4,000, then 3,880–3,900 come into focus.
Does not constitute investment advice; this is my own watchlist #gold
Overall direction: The daily structure is still bearish, but the 4-hour trend has turned bullish. So the larger trend is down, while there is a short-term recovery.
4,260–4,310: Daily seller zone.
4,350: Upper boundary of the volume zone
Support levels:
4,040– a strong low and a higher low on the 4-hour chart. The first buying reaction is expected here.
4,000: Psychological level.
3,880–3,900: Main support is here.
My expectation: Since 4-hour momentum has weakened, I expect a pullback to 4,040 first.
If there is a reaction from there, the price will retest 4,110–4,145. If it closes above 4,145, 4,170 opens up, followed by 4,260–4,300.
If 4,040 breaks, 4,000, then 3,880–3,900 come into focus.
Does not constitute investment advice; this is my own watchlist #gold
28
Binance France Is Shutting Down Operations and Closing Accounts
Binance France notified users by email that their accounts would be closed on December 31.
It was announced that a monthly maintenance fee would be deducted from assets that had not been withdrawn, starting November 29.
https://nihatcetinkaya.com/haber/binance-fransa-operasyonlarini-kapatarak-hesaplari-sonlandiriyor
Binance France Is Shutting Down Operations and Closing Accounts
Binance France notified users by email that their accounts would be closed on December 31.
It was announced that a monthly maintenance fee would be deducted from assets that had not been withdrawn, starting November 29.
https://nihatcetinkaya.com/haber/binance-fransa-operasyonlarini-kapatarak-hesaplari-sonlandiriyor
Binance France notified users by email that their accounts would be closed on December 31.
It was announced that a monthly maintenance fee would be deducted from assets that had not been withdrawn, starting November 29.
https://nihatcetinkaya.com/haber/binance-fransa-operasyonlarini-kapatarak-hesaplari-sonlandiriyor
42
Log in to explore more content
Join global crypto users on Binance Square
⚡️ Get latest and useful information about crypto.
💬 Trusted by the world’s largest crypto exchange.
👍 Discover real insights from verified creators.
Email / Phone number
Trending Topics
HuangExitNvidiaStrategyInFocus
9,394 views
310 Discussing
STOCKS | Nvidia’s Jensen Huang Resigns, Colette Kress Named as Interim CEO
Binance News
·4 Likes
·9.1k views
AnthropicRejectsIPODelayValuationinQuestion
569,724 views
4,691 Discussing
BitMineReports$6.3BNetLossForFiscal2026
1,856 views
68 Discussing