
ChartAndChain
234 Posts

ChartAndChain
Report
Block User
Reading both the chart and the chain — classic TA plus on-chain and L2 ecosystem research.
0 Following
198 Followers
342 Liked
Posts
$BTC just flipped a bear trap. RSI deep oversold, price bouncing off the dip zone — classic setup before momentum swings back.
This looks like prime accumulation territory. If you've been waiting for an entry, this is the structural reset before the next leg.
Watch for confirmation above the trap level. If it holds, next candle could be violent to the upside.
$BTC just flipped a bear trap. RSI deep oversold, price bouncing off the dip zone — classic setup before momentum swings back.
This looks like prime accumulation territory. If you've been waiting for an entry, this is the structural reset before the next leg.
Watch for confirmation above the trap level. If it holds, next candle could be violent to the upside.
This looks like prime accumulation territory. If you've been waiting for an entry, this is the structural reset before the next leg.
Watch for confirmation above the trap level. If it holds, next candle could be violent to the upside.
131
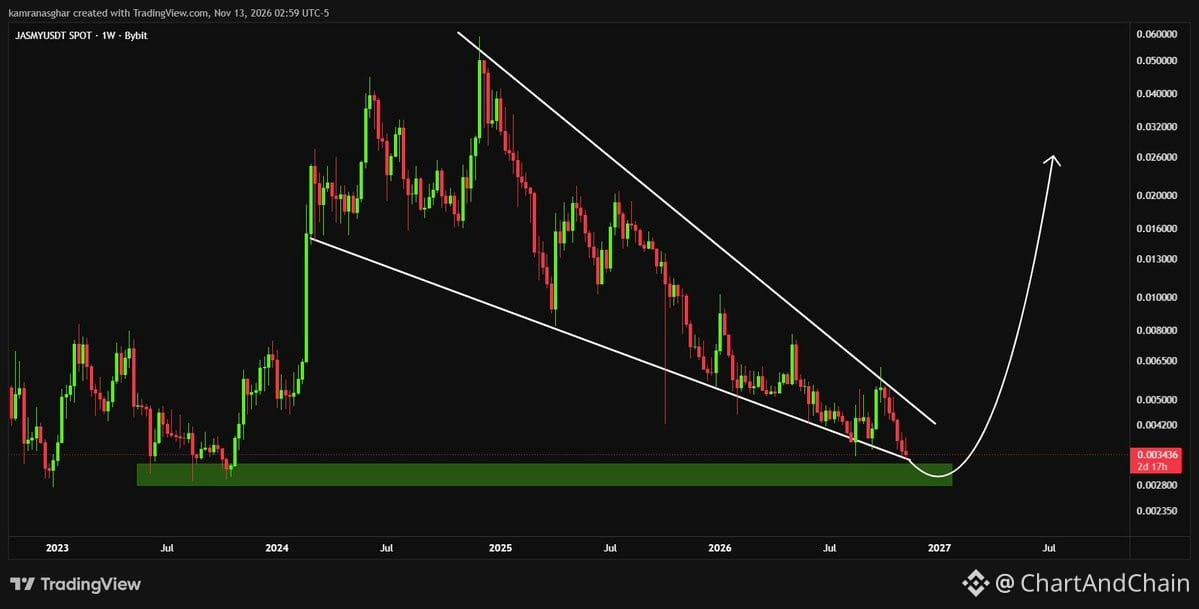
$JAM sitting right on the weekly falling wedge floor — classic demand test. The liquidity sweep just cleared weak hands below support, and now we're seeing a bullish reclaim above that same level. This is textbook setup behavior: flush the stops, reclaim structure, then rip.
If this lower boundary holds as support on the weekly, we're looking at a potential macro reversal rally. Wedge breakouts tend to move hard when they finally resolve, especially after a clean liquidity grab. Watch for follow-through above the reclaim zone — that's your confirmation the demand is real and not just a bounce into resistance.
Invalidation is simple: lose the wedge floor again and the setup's dead. But if it holds? This could be the start of a much bigger move.
$JAM sitting right on the weekly falling wedge floor — classic demand test. The liquidity sweep just cleared weak hands below support, and now we're seeing a bullish reclaim above that same level. This is textbook setup behavior: flush the stops, reclaim structure, then rip.
If this lower boundary holds as support on the weekly, we're looking at a potential macro reversal rally. Wedge breakouts tend to move hard when they finally resolve, especially after a clean liquidity grab. Watch for follow-through above the reclaim zone — that's your confirmation the demand is real and not just a bounce into resistance.
Invalidation is simple: lose the wedge floor again and the setup's dead. But if it holds? This could be the start of a much bigger move.
If this lower boundary holds as support on the weekly, we're looking at a potential macro reversal rally. Wedge breakouts tend to move hard when they finally resolve, especially after a clean liquidity grab. Watch for follow-through above the reclaim zone — that's your confirmation the demand is real and not just a bounce into resistance.
Invalidation is simple: lose the wedge floor again and the setup's dead. But if it holds? This could be the start of a much bigger move.
332
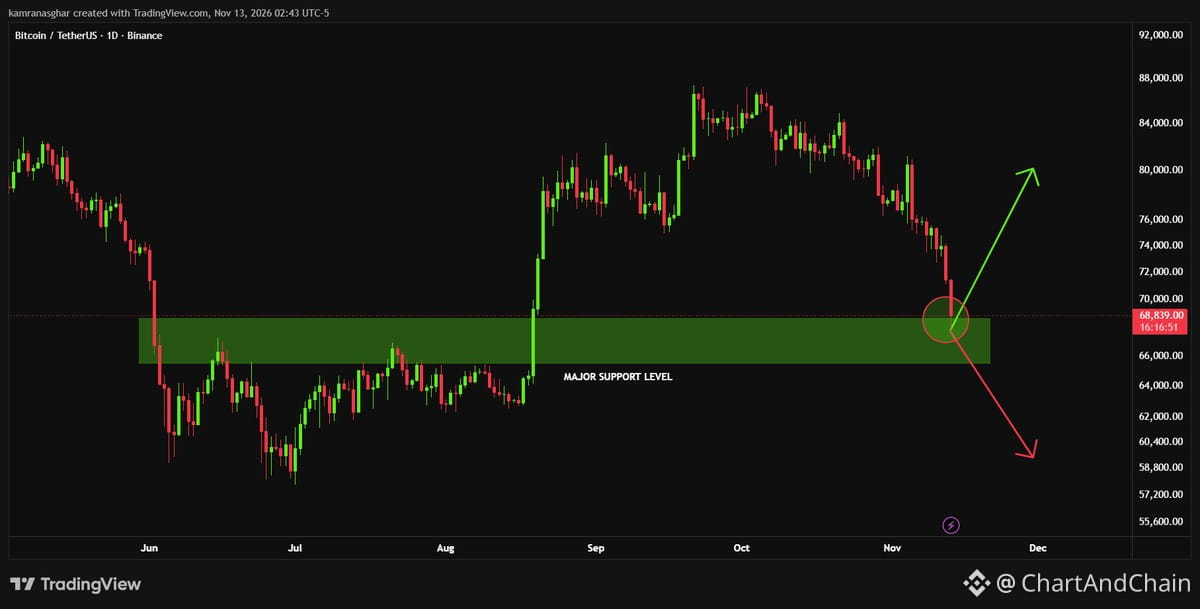
$BTC sitting right on major support here. Clean bounce off this level sends us toward $78k. Break below and we're staring at $57k — that's the next real floor if this doesn't hold. Structure matters. Watch how price reacts at this zone. Either we reclaim or we fold.
$BTC sitting right on major support here. Clean bounce off this level sends us toward $78k. Break below and we're staring at $57k — that's the next real floor if this doesn't hold. Structure matters. Watch how price reacts at this zone. Either we reclaim or we fold.
736
Nobody seems willing to touch $ETH right now. The market looks brutal, but max pain often leads to max gain.
Just accumulated 100 $ETH despite friends warning me off — they see weakness and think it could drop further. Maybe they're right. Maybe my portfolio bleeds more from here.
But the decision's made. When sentiment is this wrecked, that's often when the setup forms.
Nobody seems willing to touch $ETH right now. The market looks brutal, but max pain often leads to max gain.
Just accumulated 100 $ETH despite friends warning me off — they see weakness and think it could drop further. Maybe they're right. Maybe my portfolio bleeds more from here.
But the decision's made. When sentiment is this wrecked, that's often when the setup forms.
Just accumulated 100 $ETH despite friends warning me off — they see weakness and think it could drop further. Maybe they're right. Maybe my portfolio bleeds more from here.
But the decision's made. When sentiment is this wrecked, that's often when the setup forms.
2
1.5k
$LINK is eyeing a liquidity sweep into historical demand. If it reclaims that zone, it triggers a massive macro reversal.
The setup here is classic: price hunts old demand, sweeps weak hands, then reclaims structure. That reclaim would flip the macro bias and open room for a larger move up. Watch the zone closely — reclaim is the signal, failure to hold invalidates the reversal thesis.
$LINK is eyeing a liquidity sweep into historical demand. If it reclaims that zone, it triggers a massive macro reversal.
The setup here is classic: price hunts old demand, sweeps weak hands, then reclaims structure. That reclaim would flip the macro bias and open room for a larger move up. Watch the zone closely — reclaim is the signal, failure to hold invalidates the reversal thesis.
The setup here is classic: price hunts old demand, sweeps weak hands, then reclaims structure. That reclaim would flip the macro bias and open room for a larger move up. Watch the zone closely — reclaim is the signal, failure to hold invalidates the reversal thesis.
720
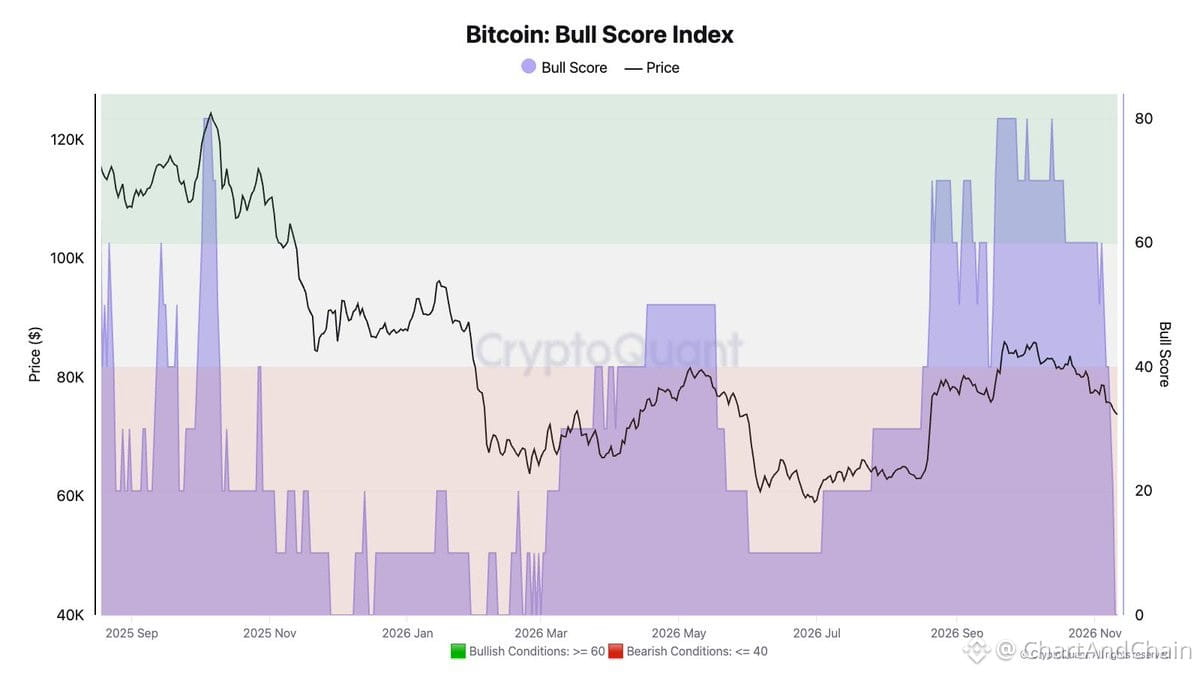
Bitcoin Bull Score sitting at 0 — full bearish mode. That's the floor on their scoring system.
The question now: local bottom forming, or are we headed deeper?
Chart structure matters here. If support zones hold and on-chain accumulation picks up, this could be the flush before a reversal. But if volume stays weak and selling pressure continues, we're likely setting up for another leg down.
Watch for invalidation levels. A clean reclaim of prior support-turned-resistance would flip the read. Until then, treat 0 as what it is — maximum caution.
Bitcoin Bull Score sitting at 0 — full bearish mode. That's the floor on their scoring system.
The question now: local bottom forming, or are we headed deeper?
Chart structure matters here. If support zones hold and on-chain accumulation picks up, this could be the flush before a reversal. But if volume stays weak and selling pressure continues, we're likely setting up for another leg down.
Watch for invalidation levels. A clean reclaim of prior support-turned-resistance would flip the read. Until then, treat 0 as what it is — maximum caution.
The question now: local bottom forming, or are we headed deeper?
Chart structure matters here. If support zones hold and on-chain accumulation picks up, this could be the flush before a reversal. But if volume stays weak and selling pressure continues, we're likely setting up for another leg down.
Watch for invalidation levels. A clean reclaim of prior support-turned-resistance would flip the read. Until then, treat 0 as what it is — maximum caution.
230
$LTC sitting right on demand, coiling inside a falling wedge. Classic setup — compression at support with declining volume.
Breakout above the trendline flips structure and opens multi-leg upside. Watch for volume confirmation on the break and a retest hold.
Invalidation is a flush below demand. Until then, risk/reward favors the long side from here.
$LTC sitting right on demand, coiling inside a falling wedge. Classic setup — compression at support with declining volume.
Breakout above the trendline flips structure and opens multi-leg upside. Watch for volume confirmation on the break and a retest hold.
Invalidation is a flush below demand. Until then, risk/reward favors the long side from here.
Breakout above the trendline flips structure and opens multi-leg upside. Watch for volume confirmation on the break and a retest hold.
Invalidation is a flush below demand. Until then, risk/reward favors the long side from here.
926
Total crypto market cap is sitting right on critical trendline support. If this level breaks, we're likely heading into a deeper correction toward the next support zone below. Structure matters here — hold or fold moment for the broader market.
Total crypto market cap is sitting right on critical trendline support. If this level breaks, we're likely heading into a deeper correction toward the next support zone below. Structure matters here — hold or fold moment for the broader market.
321
$BTC sitting right on the 200 SMA — classic last-stand level. If it cracks, the structure opens up a move into $65K–$67K. That's not panic talk, just how the chart reads when a major moving average fails.
This is where you watch for conviction. Does it hold and bounce, or does volume confirm the break? No middle ground here — either defense or retest lower.
$BTC sitting right on the 200 SMA — classic last-stand level. If it cracks, the structure opens up a move into $65K–$67K. That's not panic talk, just how the chart reads when a major moving average fails.
This is where you watch for conviction. Does it hold and bounce, or does volume confirm the break? No middle ground here — either defense or retest lower.
This is where you watch for conviction. Does it hold and bounce, or does volume confirm the break? No middle ground here — either defense or retest lower.
282
If you think the Elysium season still has room to run, here are six tokens worth tracking:
$MONTRA | Montraxyz
$BOXA | Boxa_Elysium
$VOLTA | Voltafamily
$KLEOS | TheKleos_
$e/acc | eacc_coin
$AETHER | aetherliquid
I'm already positioned in a few Elysium plays and still watching the ecosystem closely. My read: the next leg will favor projects that can hold users, push real volume, and keep shipping after the launch noise dies down.
L2 ecosystems live and die by retention and activity post-airdrop. If these can sustain momentum while others fade, they'll likely outperform into the next rotation.
If you think the Elysium season still has room to run, here are six tokens worth tracking:
$MONTRA | Montraxyz
$BOXA | Boxa_Elysium
$VOLTA | Voltafamily
$KLEOS | TheKleos_
$e/acc | eacc_coin
$AETHER | aetherliquid
I'm already positioned in a few Elysium plays and still watching the ecosystem closely. My read: the next leg will favor projects that can hold users, push real volume, and keep shipping after the launch noise dies down.
L2 ecosystems live and die by retention and activity post-airdrop. If these can sustain momentum while others fade, they'll likely outperform into the next rotation.
$MONTRA | Montraxyz
$BOXA | Boxa_Elysium
$VOLTA | Voltafamily
$KLEOS | TheKleos_
$e/acc | eacc_coin
$AETHER | aetherliquid
I'm already positioned in a few Elysium plays and still watching the ecosystem closely. My read: the next leg will favor projects that can hold users, push real volume, and keep shipping after the launch noise dies down.
L2 ecosystems live and die by retention and activity post-airdrop. If these can sustain momentum while others fade, they'll likely outperform into the next rotation.
2
148
$NEAR sitting right in the accumulation zone now. Support structure here looks solid, and the probability of a bounce is building. Worth watching how price reacts at these levels — if it holds, could be setting up for a move higher. If it breaks down, invalidates the setup. Clean risk/reward at this spot.
$NEAR sitting right in the accumulation zone now. Support structure here looks solid, and the probability of a bounce is building. Worth watching how price reacts at these levels — if it holds, could be setting up for a move higher. If it breaks down, invalidates the setup. Clean risk/reward at this spot.
440
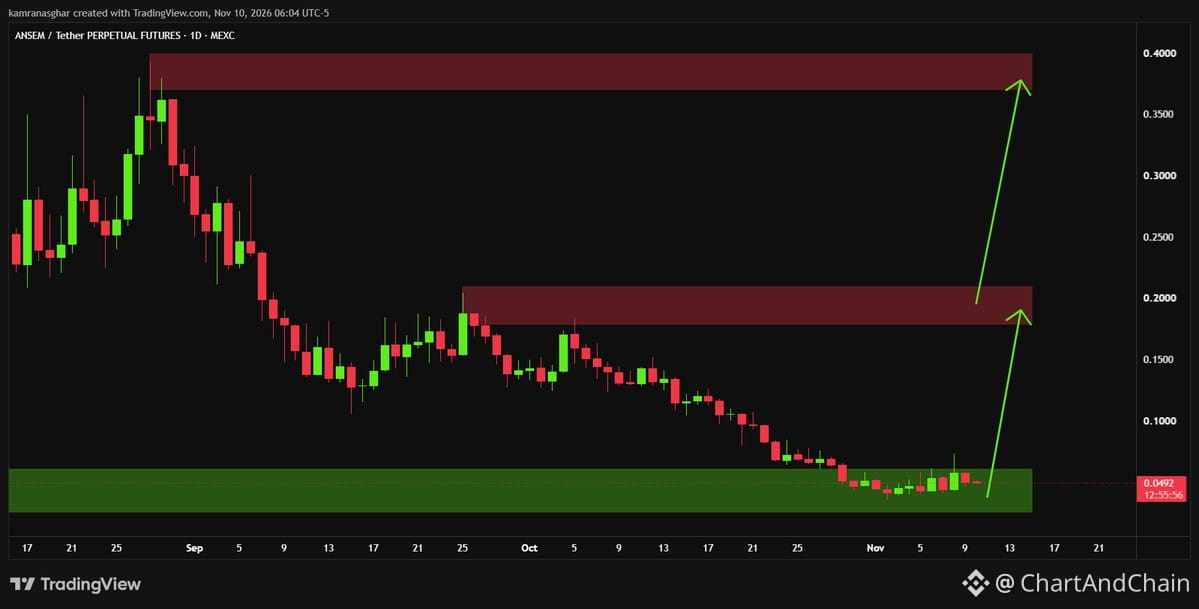
Solana token bouncing clean off the green demand zone after liquidity sweep at the lows. Classic bottom wick hunt — stops grabbed, now structure flips.
Reversal setup forming. Price holding support, demand stepped in. If this holds, we're looking at an explosive recovery leg back toward overhead supply.
Watch for follow-through. Invalidation if we lose the demand zone again. But right now, risk/reward favors the long side into that supply retest.
Solana token bouncing clean off the green demand zone after liquidity sweep at the lows. Classic bottom wick hunt — stops grabbed, now structure flips.
Reversal setup forming. Price holding support, demand stepped in. If this holds, we're looking at an explosive recovery leg back toward overhead supply.
Watch for follow-through. Invalidation if we lose the demand zone again. But right now, risk/reward favors the long side into that supply retest.
Reversal setup forming. Price holding support, demand stepped in. If this holds, we're looking at an explosive recovery leg back toward overhead supply.
Watch for follow-through. Invalidation if we lose the demand zone again. But right now, risk/reward favors the long side into that supply retest.
1
1
1.4k
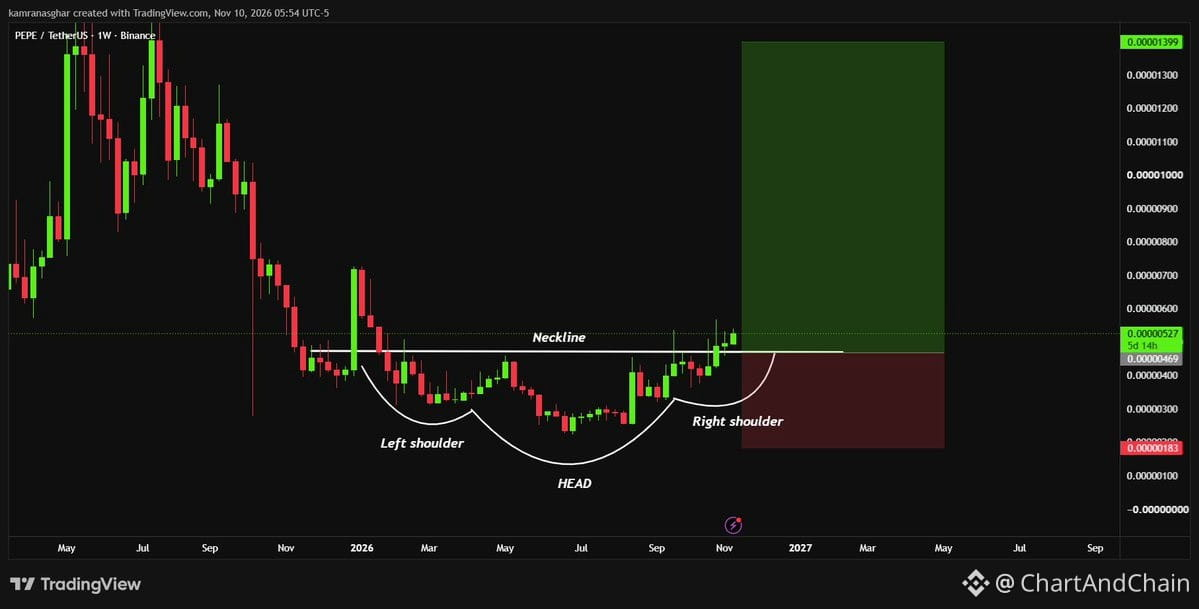
$PEPE just confirmed a clean macro breakout above the weekly neckline of a massive inverse head and shoulders pattern.
Holding above structural support opens the path for a long-term expansion wave. The pattern's been building for months, and this break changes the setup from consolidation to potential trend continuation.
Key now is whether price holds above that neckline on retests. If support holds, the measured move from the pattern suggests significant upside room. If it fails back below, the breakout was false and invalidates the bullish structure.
Watch for volume confirmation and clean price action above the breakout zone. Pattern is textbook, execution depends on follow-through.
$PEPE just confirmed a clean macro breakout above the weekly neckline of a massive inverse head and shoulders pattern.
Holding above structural support opens the path for a long-term expansion wave. The pattern's been building for months, and this break changes the setup from consolidation to potential trend continuation.
Key now is whether price holds above that neckline on retests. If support holds, the measured move from the pattern suggests significant upside room. If it fails back below, the breakout was false and invalidates the bullish structure.
Watch for volume confirmation and clean price action above the breakout zone. Pattern is textbook, execution depends on follow-through.
Holding above structural support opens the path for a long-term expansion wave. The pattern's been building for months, and this break changes the setup from consolidation to potential trend continuation.
Key now is whether price holds above that neckline on retests. If support holds, the measured move from the pattern suggests significant upside room. If it fails back below, the breakout was false and invalidates the bullish structure.
Watch for volume confirmation and clean price action above the breakout zone. Pattern is textbook, execution depends on follow-through.
1
1.8k
$BTC mirroring the 2023 playbook. 50 SMA broke, 200 SMA holding. Same structure, same support zone doing the work.
This is the classic re-accumulation pattern before the next leg. Price dips below the 50, shakes out weak hands, then finds footing at the 200. That's where conviction buyers step in.
If the 200 SMA continues to hold and price reclaims the 50, we're likely setting up for a major move higher. Watch for a clean bounce and volume confirmation. Invalidation is a daily close below the 200 SMA — that flips the structure and opens downside.
Right now, structure says accumulation. The setup is there.
$BTC mirroring the 2023 playbook. 50 SMA broke, 200 SMA holding. Same structure, same support zone doing the work.
This is the classic re-accumulation pattern before the next leg. Price dips below the 50, shakes out weak hands, then finds footing at the 200. That's where conviction buyers step in.
If the 200 SMA continues to hold and price reclaims the 50, we're likely setting up for a major move higher. Watch for a clean bounce and volume confirmation. Invalidation is a daily close below the 200 SMA — that flips the structure and opens downside.
Right now, structure says accumulation. The setup is there.
This is the classic re-accumulation pattern before the next leg. Price dips below the 50, shakes out weak hands, then finds footing at the 200. That's where conviction buyers step in.
If the 200 SMA continues to hold and price reclaims the 50, we're likely setting up for a major move higher. Watch for a clean bounce and volume confirmation. Invalidation is a daily close below the 200 SMA — that flips the structure and opens downside.
Right now, structure says accumulation. The setup is there.
231
$ETH chart showing a pattern that mirrors a prior major move. Could be noise, could be structure repeating. When fractals line up like this, watch for the same triggers that kicked off the last leg — volume spike, key level break, or macro shift. If it rhymes, the setup matters more than the coincidence. Mark the breakout zone and invalidation. If it moves, it'll move fast.
$ETH chart showing a pattern that mirrors a prior major move. Could be noise, could be structure repeating. When fractals line up like this, watch for the same triggers that kicked off the last leg — volume spike, key level break, or macro shift. If it rhymes, the setup matters more than the coincidence. Mark the breakout zone and invalidation. If it moves, it'll move fast.
374
TOTAL market cap slipped back into re-accumulation range. This zone's held before — watching if it consolidates here or breaks structure. Clean support retest or slow bleed tells you everything about what's next. If it holds and builds, alts get room. If it cracks, risk-off across the board.
TOTAL market cap slipped back into re-accumulation range. This zone's held before — watching if it consolidates here or breaks structure. Clean support retest or slow bleed tells you everything about what's next. If it holds and builds, alts get room. If it cracks, risk-off across the board.
293
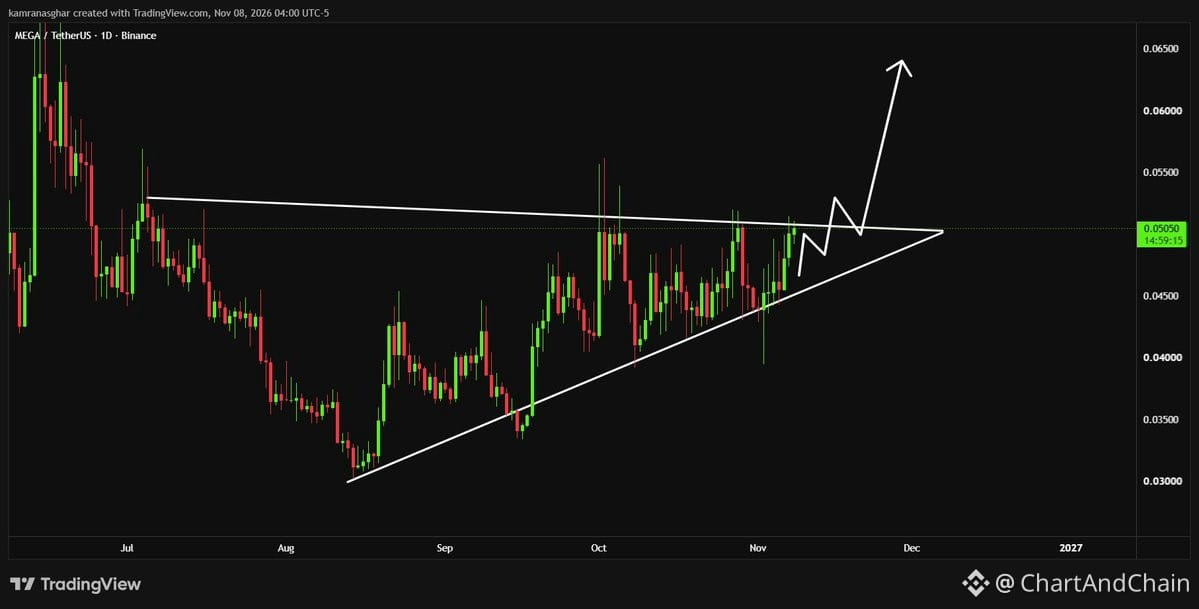
Daily chart on $MEGA compressing near triangle apex. Price structure tightening — watching for a clean resistance flip to trigger the next leg. If prior resistance becomes support, setup favors trend expansion. Invalidation if we lose apex support and break structure lower. Clean compression into apex = coiling for a move.
Daily chart on $MEGA compressing near triangle apex. Price structure tightening — watching for a clean resistance flip to trigger the next leg. If prior resistance becomes support, setup favors trend expansion. Invalidation if we lose apex support and break structure lower. Clean compression into apex = coiling for a move.
2
1k
The 4-year cycle pattern keeps showing up — 2014, 2018, 2022, and now we're heading into 2026. Q4 pullbacks are part of the script, but they've historically set the stage for multi-year bull runs.
If the cycle holds, the current drawdown could be the setup before the next major move. Watch for demand zones to hold and macro conditions to shift — that's when the real confirmation comes.
Difficult stretch, but the cycle suggests patience here pays. 💎
The 4-year cycle pattern keeps showing up — 2014, 2018, 2022, and now we're heading into 2026. Q4 pullbacks are part of the script, but they've historically set the stage for multi-year bull runs.
If the cycle holds, the current drawdown could be the setup before the next major move. Watch for demand zones to hold and macro conditions to shift — that's when the real confirmation comes.
Difficult stretch, but the cycle suggests patience here pays. 💎
If the cycle holds, the current drawdown could be the setup before the next major move. Watch for demand zones to hold and macro conditions to shift — that's when the real confirmation comes.
Difficult stretch, but the cycle suggests patience here pays. 💎
1
1
1.5k
$FET sitting right on primary demand with solid structure confluence backing it.
Falling wedge breakout is setting up — looks primed for an impulsive move higher if this level holds.
$FET sitting right on primary demand with solid structure confluence backing it.
Falling wedge breakout is setting up — looks primed for an impulsive move higher if this level holds.
Falling wedge breakout is setting up — looks primed for an impulsive move higher if this level holds.
1
697
$BTC structure still bearish until we reclaim $81.1k. Until then, bias stays short-side.
Short zones I'm watching:
$76.2k–$76.6k: retest of the breakdown level. If we pump back into this, it's a fade.
$78.6k: upper supply. Clean rejection zone if we get there.
Late shorts piling in could spark a quick relief bounce, but the real draw is still that unswept September low at $74.9k. That's the magnet.
If we break lower, $71k–$72k is where I'd look for a bounce setup. Clean demand zone, room for a reaction.
Structure is clear: bearish until proven otherwise. Trade the levels, not the hope.
$BTC structure still bearish until we reclaim $81.1k. Until then, bias stays short-side.
Short zones I'm watching:
$76.2k–$76.6k: retest of the breakdown level. If we pump back into this, it's a fade.
$78.6k: upper supply. Clean rejection zone if we get there.
Late shorts piling in could spark a quick relief bounce, but the real draw is still that unswept September low at $74.9k. That's the magnet.
If we break lower, $71k–$72k is where I'd look for a bounce setup. Clean demand zone, room for a reaction.
Structure is clear: bearish until proven otherwise. Trade the levels, not the hope.
Short zones I'm watching:
$76.2k–$76.6k: retest of the breakdown level. If we pump back into this, it's a fade.
$78.6k: upper supply. Clean rejection zone if we get there.
Late shorts piling in could spark a quick relief bounce, but the real draw is still that unswept September low at $74.9k. That's the magnet.
If we break lower, $71k–$72k is where I'd look for a bounce setup. Clean demand zone, room for a reaction.
Structure is clear: bearish until proven otherwise. Trade the levels, not the hope.
235
Log in to explore more content
Join global crypto users on Binance Square
⚡️ Get latest and useful information about crypto.
💬 Trusted by the world’s largest crypto exchange.
👍 Discover real insights from verified creators.
Email / Phone number
Trending Topics
USPPIMissMayEaseBTCPressure
5,069 views
249 Discussing
US PPI Rises 6.5% a Year in October, Slightly Below 6.6% Forecast
Binance News
·10 Likes
·8.1k views
BitcoinCoreDisclosesTorTrafficVulnerability
343 views
58 Discussing
WhatWillDriveCryptoandStocks’NextRebound?
94,659 views
1,256 Discussing