
Gas哥
104 Posts

Gas哥
 Square Verified
Frequent Trader
7.8 Years
47 Following
18 Followers
12 Liked
Posts
See translation
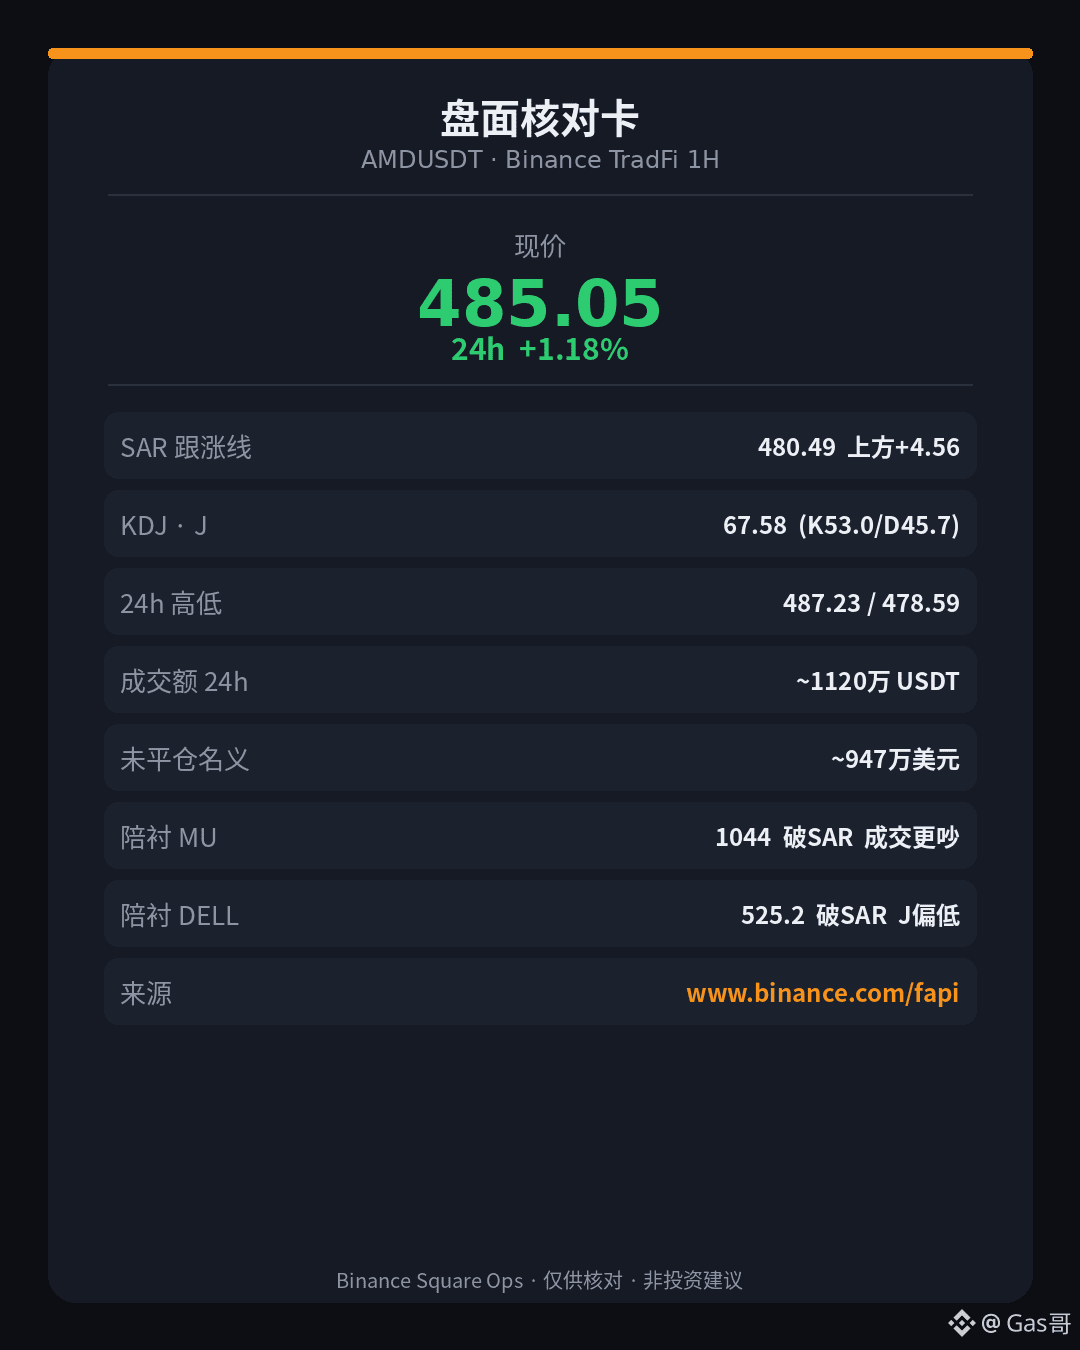
数据中心营收同比翻了一倍多,这张成绩单够硬;夜盘合约刚站上跟涨线,J值已经偏热——亮眼是财报,烫手是动能,别焊成「现在就能追」。
主标 $AMD :币安TradFi永续现价约485.05,24小时红约1.18%,成交额大约1120万USDT。跟涨线(SAR)约480.49,价在它上面大约4.56——短线支撑暂时还在。动能J值67.58(K53.00/D45.72),像踩油门偏猛,不是超卖反弹那一类。24小时高487.23、低478.59;近两天高点就在487一带,头顶压力很近。未平仓约1.95万张,按标记价折名义大约947万美元;资金费率约0。站上跟涨线是事实,J偏热也是事实,两件事别混着读。
陪衬对照:$MU 现价约1044.13,24小时涨约2.42%,成交额约1.35亿USDT——大概是AMD的12倍,明显更吵。跟涨线约1045.44,价已经掉到它下面大约1.31;J值68.95,同样偏热。$DELL 现价约525.20,24小时几乎平盘约+0.16%,成交约568万;跟涨线约526.56,价在下方约1.36;J值29.38,动能更冷。同属硬件链:AMD刚站线、MU成交最吵却破线、DELL更安静——成交吵不代表结构同向。
新闻侧可核:AMD官方新闻稿 / SEC EX-99.1(2026-08-04)——2026财年二季度营收约115亿美元(同比约+50%);数据中心分部约67亿美元(同比约+107%),占公司营收约58%。非GAAP毛利率约56%,稀释EPS约1.66美元。公司指引三季度营收约130亿美元(正负3亿),非GAAP毛利率约56%。同稿还披露与Anthropic的合作:计划在Helios机柜部署至多约2吉瓦的MI450系列GPU。财报与指引是存量+预期;夜盘1小时站线,只能说明短线位置,不能直接翻译成「指引已经定价完」。
看到下一根确认K再说;没看到就先放着。
主标 $AMD :币安TradFi永续现价约485.05,24小时红约1.18%,成交额大约1120万USDT。跟涨线(SAR)约480.49,价在它上面大约4.56——短线支撑暂时还在。动能J值67.58(K53.00/D45.72),像踩油门偏猛,不是超卖反弹那一类。24小时高487.23、低478.59;近两天高点就在487一带,头顶压力很近。未平仓约1.95万张,按标记价折名义大约947万美元;资金费率约0。站上跟涨线是事实,J偏热也是事实,两件事别混着读。
陪衬对照:$MU 现价约1044.13,24小时涨约2.42%,成交额约1.35亿USDT——大概是AMD的12倍,明显更吵。跟涨线约1045.44,价已经掉到它下面大约1.31;J值68.95,同样偏热。$DELL 现价约525.20,24小时几乎平盘约+0.16%,成交约568万;跟涨线约526.56,价在下方约1.36;J值29.38,动能更冷。同属硬件链:AMD刚站线、MU成交最吵却破线、DELL更安静——成交吵不代表结构同向。
新闻侧可核:AMD官方新闻稿 / SEC EX-99.1(2026-08-04)——2026财年二季度营收约115亿美元(同比约+50%);数据中心分部约67亿美元(同比约+107%),占公司营收约58%。非GAAP毛利率约56%,稀释EPS约1.66美元。公司指引三季度营收约130亿美元(正负3亿),非GAAP毛利率约56%。同稿还披露与Anthropic的合作:计划在Helios机柜部署至多约2吉瓦的MI450系列GPU。财报与指引是存量+预期;夜盘1小时站线,只能说明短线位置,不能直接翻译成「指引已经定价完」。
看到下一根确认K再说;没看到就先放着。
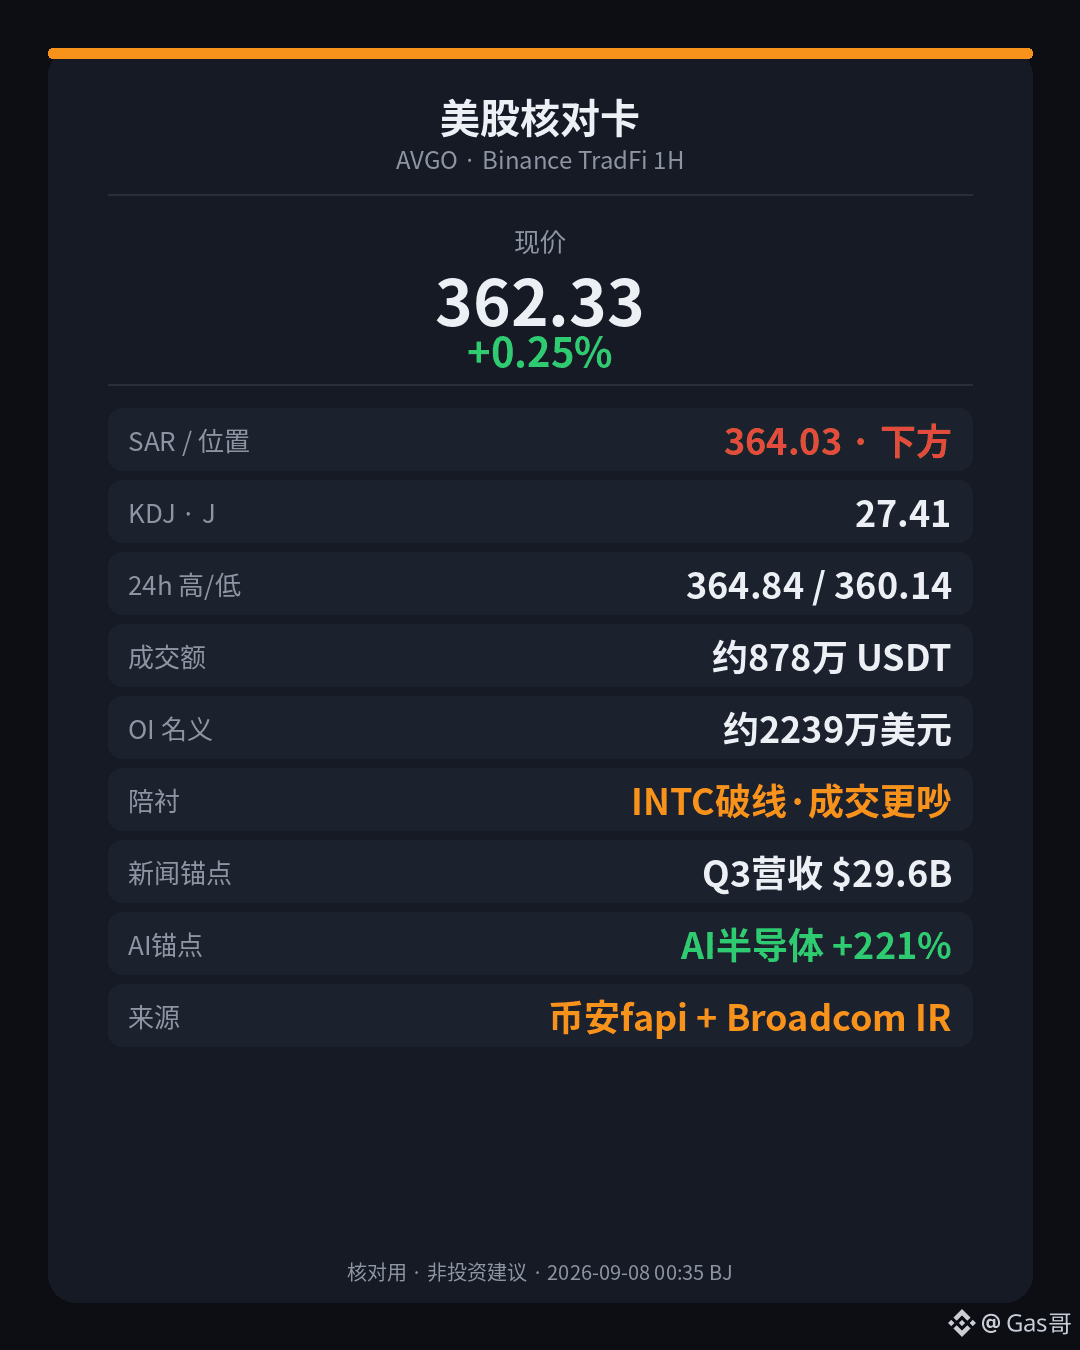
AI semiconductor revenue on the ledger more than doubled year-over-year, but in the 1-hour chart the price even first stepped through the follow-up line—what stands out is the earnings report, what breaks is the price action. Don’t weld them into one thing.
Main contract $AVGO : Binance TradFi perpetual mark price around 362.33, still up about 0.25% over the past 24 hours, with trading volume roughly 8.78 million USDT. The follow-up line (SAR) is around 364.03, and price has already dropped about 1.7 below it—short-term support has been broken. Momentum J value is 27.41 (K33.47/D36.50); it’s not oversold, but the “throttle” has clearly loosened. 24-hour high 364.84, low 360.14; the recent two-day high is about 364.84—overhead pressure is right in front of you. Open interest about 61.8k contracts; notional value at the mark price about $22.39 million. Funding rate about 0. (Position thickness is still there, but price is grinding below the follow-up line.)
Side-by-side comparison: $INTC current price around 97.88, up about 0.78% in 24 hours, trading volume about 49.27 million—roughly more than 5 times AVGO, and it’s noisier. The follow-up line is around 99.09, and price is about 1.2 below it; J value is 21.10. Both are semiconductor contracts: INTC is busier in trading, AVGO’s earnings narrative is “harder,” yet on both sides they’ve both broken the follow-up line—high volume doesn’t necessarily mean the structure is strong.
News you can verify: Broadcom’s official/PR Newswire disclosure on 2026-09-02 said that for fiscal 2026 Q3 (as of August 2), revenue was about $29.6 billion (YoY about +86%). CEO Hock Tan’s words: AI semiconductor revenue about $16.7 billion (YoY +221%, QoQ +54%), and the company expects AI semiconductors in Q4 to be about $21.7 billion (YoY +236%). The company guidance for total revenue in Q4 is about $34.8 billion (YoY +93%); quarterly dividend is $0.65 per share, record date September 21 and payment date September 30. Earnings numbers are the existing results; even if guidance looks great, it doesn’t mean the 1-hour structure has already held.
The upside move you see, and the persistence the market is willing to give, are often not the same thing.
Main contract $AVGO : Binance TradFi perpetual mark price around 362.33, still up about 0.25% over the past 24 hours, with trading volume roughly 8.78 million USDT. The follow-up line (SAR) is around 364.03, and price has already dropped about 1.7 below it—short-term support has been broken. Momentum J value is 27.41 (K33.47/D36.50); it’s not oversold, but the “throttle” has clearly loosened. 24-hour high 364.84, low 360.14; the recent two-day high is about 364.84—overhead pressure is right in front of you. Open interest about 61.8k contracts; notional value at the mark price about $22.39 million. Funding rate about 0. (Position thickness is still there, but price is grinding below the follow-up line.)
Side-by-side comparison: $INTC current price around 97.88, up about 0.78% in 24 hours, trading volume about 49.27 million—roughly more than 5 times AVGO, and it’s noisier. The follow-up line is around 99.09, and price is about 1.2 below it; J value is 21.10. Both are semiconductor contracts: INTC is busier in trading, AVGO’s earnings narrative is “harder,” yet on both sides they’ve both broken the follow-up line—high volume doesn’t necessarily mean the structure is strong.
News you can verify: Broadcom’s official/PR Newswire disclosure on 2026-09-02 said that for fiscal 2026 Q3 (as of August 2), revenue was about $29.6 billion (YoY about +86%). CEO Hock Tan’s words: AI semiconductor revenue about $16.7 billion (YoY +221%, QoQ +54%), and the company expects AI semiconductors in Q4 to be about $21.7 billion (YoY +236%). The company guidance for total revenue in Q4 is about $34.8 billion (YoY +93%); quarterly dividend is $0.65 per share, record date September 21 and payment date September 30. Earnings numbers are the existing results; even if guidance looks great, it doesn’t mean the 1-hour structure has already held.
The upside move you see, and the persistence the market is willing to give, are often not the same thing.
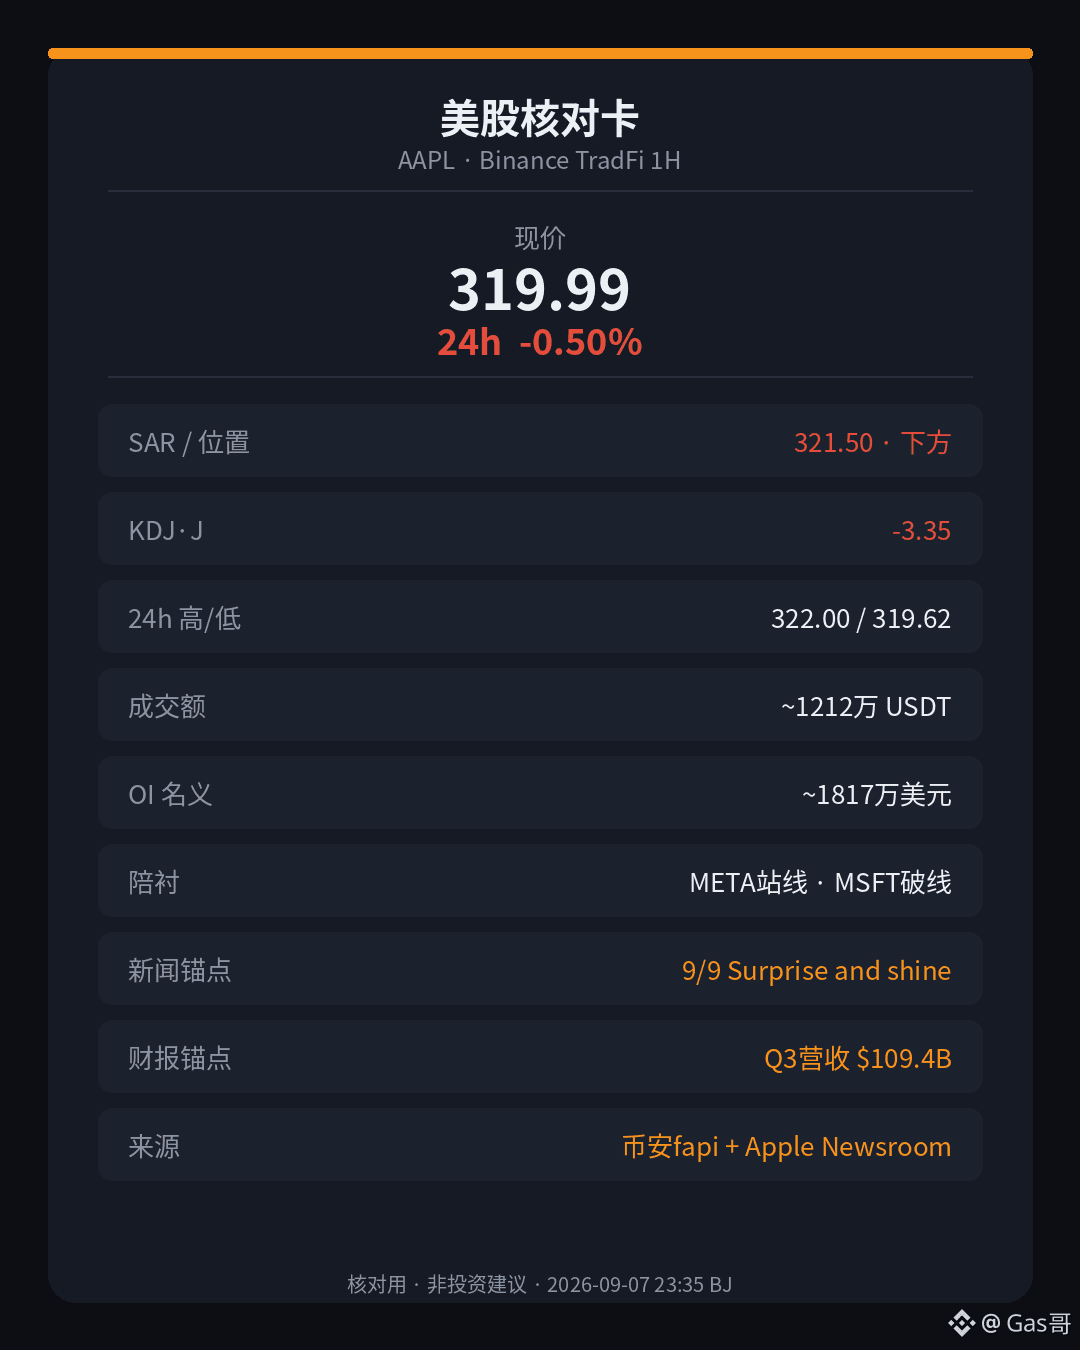
It’s less than two days until Apple’s “Surprise and shine” event, yet the contract side has already cooled the momentum—narrative is heating up, but the 1-hour K chart isn’t buying in.
Main mark $AAPL : Binance TradFi perpetual’s current price is about 319.99, down about 0.50% over the past 24 hours, with trading volume around 12.12 million USDT. The trailing buy line (SAR) is roughly 321.50, and price has already slipped to about 1.5 below it—short-term support has been broken. The momentum J value is -3.35 (K 24.97 / D 39.13); selling looks rather fierce, like the throttle was released and the car is still sliding. Over the last 24 hours, the high was 322.00 and the low 319.62; the recent two-day high is about 322.15, with overhead resistance right in sight. Open interest is about 56,800 contracts; based on the mark price, the notional is roughly $18.17 million. The funding rate is about 0. The position is still chunky, but price is grinding below the trailing buy line.
Side-by-side comparison: $META is at about 612.52, down about 0.30% in 24 hours, with volume around 4.21 million—its size is roughly one-third of AAPL’s. The trailing buy line is about 611.93; price is still hovering above it by only about 0.6, with very thin room left. The J value is 12.97, which is even cooler. $MSFT is at about 498.15, down about 0.82% over 24 hours, with volume around 4.10 million; the trailing buy line is about 500.27, and price is about 2.1 below it, with a J value of 18.01. Among the three large-cap US tech contract pairs, only META is barely holding above the trailing buy line; both AAPL and MSFT have already broken the line—belonging to the same sector doesn’t mean they share the same structure.
News check you can verify: Apple’s official Newsroom (2026-07-30) disclosed that for fiscal Q3 2026, through June 27, revenue was about $109.4 billion (YoY about +16%); iPhone about $54.25 billion (YoY about +22%); Greater China about $18.82 billion (YoY about +22%). The company has confirmed a special event titled “Surprise and shine” on September 9 at 10:00 AM Pacific Time (Apple event page / Apple TV live stream). Public reporting and analysis (e.g., Bloomberg and supply-chain inferences) suggests September may focus on only the Pro lineup plus a foldable device, with the standard tier possibly delayed until spring 2027—this is media inference, not an official Apple product list. Don’t just weld “the countdown to the event” directly into “the stock must go up.”
Earnings figures are a set of past results; breaking the line before the event and the J value turning negative are another layer of the order-book story. Cold indicators don’t mean you should copy; a lively event also doesn’t automatically confirm the trend.
Main mark $AAPL : Binance TradFi perpetual’s current price is about 319.99, down about 0.50% over the past 24 hours, with trading volume around 12.12 million USDT. The trailing buy line (SAR) is roughly 321.50, and price has already slipped to about 1.5 below it—short-term support has been broken. The momentum J value is -3.35 (K 24.97 / D 39.13); selling looks rather fierce, like the throttle was released and the car is still sliding. Over the last 24 hours, the high was 322.00 and the low 319.62; the recent two-day high is about 322.15, with overhead resistance right in sight. Open interest is about 56,800 contracts; based on the mark price, the notional is roughly $18.17 million. The funding rate is about 0. The position is still chunky, but price is grinding below the trailing buy line.
Side-by-side comparison: $META is at about 612.52, down about 0.30% in 24 hours, with volume around 4.21 million—its size is roughly one-third of AAPL’s. The trailing buy line is about 611.93; price is still hovering above it by only about 0.6, with very thin room left. The J value is 12.97, which is even cooler. $MSFT is at about 498.15, down about 0.82% over 24 hours, with volume around 4.10 million; the trailing buy line is about 500.27, and price is about 2.1 below it, with a J value of 18.01. Among the three large-cap US tech contract pairs, only META is barely holding above the trailing buy line; both AAPL and MSFT have already broken the line—belonging to the same sector doesn’t mean they share the same structure.
News check you can verify: Apple’s official Newsroom (2026-07-30) disclosed that for fiscal Q3 2026, through June 27, revenue was about $109.4 billion (YoY about +16%); iPhone about $54.25 billion (YoY about +22%); Greater China about $18.82 billion (YoY about +22%). The company has confirmed a special event titled “Surprise and shine” on September 9 at 10:00 AM Pacific Time (Apple event page / Apple TV live stream). Public reporting and analysis (e.g., Bloomberg and supply-chain inferences) suggests September may focus on only the Pro lineup plus a foldable device, with the standard tier possibly delayed until spring 2027—this is media inference, not an official Apple product list. Don’t just weld “the countdown to the event” directly into “the stock must go up.”
Earnings figures are a set of past results; breaking the line before the event and the J value turning negative are another layer of the order-book story. Cold indicators don’t mean you should copy; a lively event also doesn’t automatically confirm the trend.
Verified
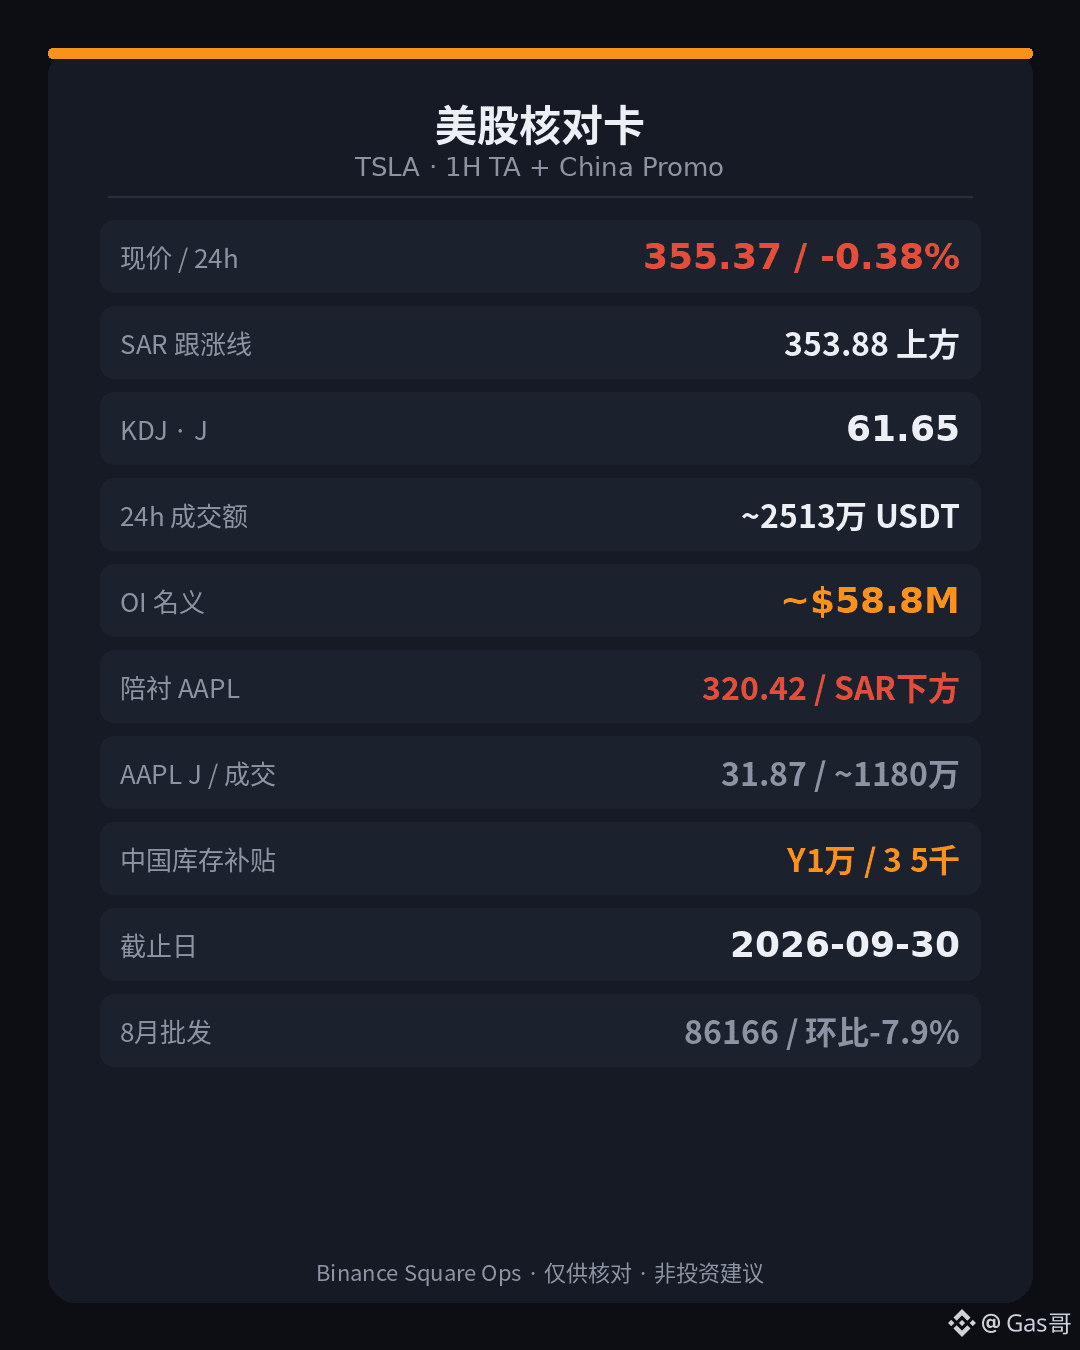
In the microstructure of the trading board—whether to hold the “follow-up line” or break it—on the news side, what’s noisier is China’s end-of-quarter inventory clearance subsidy. Don’t weld these two things directly into a single causal chain.
Main line $TSLA : The Binance TradFi perpetual mark price is around 355.37, down about 0.38% over 24 hours, with turnover around 25.13 million USDT. The follow-up line (SAR) is about 353.88, and the price is still capped on top of it by roughly 1.5—short-term strength/weakness hasn’t flipped bearish; it’s just that the remaining room is thin. Momentum J is 61.65 (K 47.61 / D 40.58): somewhat warm but not hot—more like the accelerator is halfway pressed and the market is just grinding. The 24-hour high is 356.86, low 353.88; the recent two days’ high is about 357.3, with overhead resistance right in front of you. Open interest is about 165,400 contracts; on the mark price that’s roughly a notional of about $58.77 million. The funding rate is about 0. The position thickness is still there, but the price action is rather dull.
Supporting case $AAPL : Spot is around 320.42, down about 0.43% over 24 hours, with turnover around 11.8 million USDT—its size is about half of TSLA. The follow-up line is about 321.66; the price has already dropped below it by roughly 1.2—short-term support has been breached. Momentum J is 31.87, which is colder. Open interest is about 56,700 contracts; notional is on the order of about $18.15 million. Same US equities large-cap tech contracts, but one is still pressing on the follow-up line while the other already broke the line. Same direction doesn’t mean the same structure.
What can be verified on the news side: multiple reports cite Tesla China’s official announcement on September 7—inventory vehicles are limited to delivery by September 30 to receive cash subsidies. Model Y inventory units across the board get about RMB 10,000, and Model 3 inventory units across the board get about RMB 5,000 (there are also some insurance/financial incentives; details are subject to the official guidance). This is a quarter-end push-for-volume narrative, not the long/short instruction implied by this 1-hour K.
CPC (CPCA) compilation: In August, Tesla China’s wholesale volume was about 86,166 vehicles, up about +3.57% year over year, and down about -7.92% month over month—ending the prior three consecutive months of month-over-month growth. Company IR: In Q2 2026, global deliveries exceeded 480,000 (about 480,126). Separately, there are public reports that NHTSA opened an audit inquiry for the Cybercab certification process under AQ26002 (around early September). Regulatory-noise on the side, but still not equal to the current contract order flow direction.
So don’t translate “China subsidy landing” straight into “Tesla’s trend has already been confirmed for the next leg.” The promotion is a sales fact; the follow-up line has thin remaining room, and AAPL broke first—these are two different layers of accounting on the board.
The follow-up line level has already spoken. Whether the quarter-end subsidies can change the trend is another question.
Main line $TSLA : The Binance TradFi perpetual mark price is around 355.37, down about 0.38% over 24 hours, with turnover around 25.13 million USDT. The follow-up line (SAR) is about 353.88, and the price is still capped on top of it by roughly 1.5—short-term strength/weakness hasn’t flipped bearish; it’s just that the remaining room is thin. Momentum J is 61.65 (K 47.61 / D 40.58): somewhat warm but not hot—more like the accelerator is halfway pressed and the market is just grinding. The 24-hour high is 356.86, low 353.88; the recent two days’ high is about 357.3, with overhead resistance right in front of you. Open interest is about 165,400 contracts; on the mark price that’s roughly a notional of about $58.77 million. The funding rate is about 0. The position thickness is still there, but the price action is rather dull.
Supporting case $AAPL : Spot is around 320.42, down about 0.43% over 24 hours, with turnover around 11.8 million USDT—its size is about half of TSLA. The follow-up line is about 321.66; the price has already dropped below it by roughly 1.2—short-term support has been breached. Momentum J is 31.87, which is colder. Open interest is about 56,700 contracts; notional is on the order of about $18.15 million. Same US equities large-cap tech contracts, but one is still pressing on the follow-up line while the other already broke the line. Same direction doesn’t mean the same structure.
What can be verified on the news side: multiple reports cite Tesla China’s official announcement on September 7—inventory vehicles are limited to delivery by September 30 to receive cash subsidies. Model Y inventory units across the board get about RMB 10,000, and Model 3 inventory units across the board get about RMB 5,000 (there are also some insurance/financial incentives; details are subject to the official guidance). This is a quarter-end push-for-volume narrative, not the long/short instruction implied by this 1-hour K.
CPC (CPCA) compilation: In August, Tesla China’s wholesale volume was about 86,166 vehicles, up about +3.57% year over year, and down about -7.92% month over month—ending the prior three consecutive months of month-over-month growth. Company IR: In Q2 2026, global deliveries exceeded 480,000 (about 480,126). Separately, there are public reports that NHTSA opened an audit inquiry for the Cybercab certification process under AQ26002 (around early September). Regulatory-noise on the side, but still not equal to the current contract order flow direction.
So don’t translate “China subsidy landing” straight into “Tesla’s trend has already been confirmed for the next leg.” The promotion is a sales fact; the follow-up line has thin remaining room, and AAPL broke first—these are two different layers of accounting on the board.
The follow-up line level has already spoken. Whether the quarter-end subsidies can change the trend is another question.
On Friday, the spot closed around 1740—then that one move jumped about 12%. But in the contract market, it has turned red in the past 24 hours first. Don’t just treat weekend sentiment as if the rally is still accelerating.
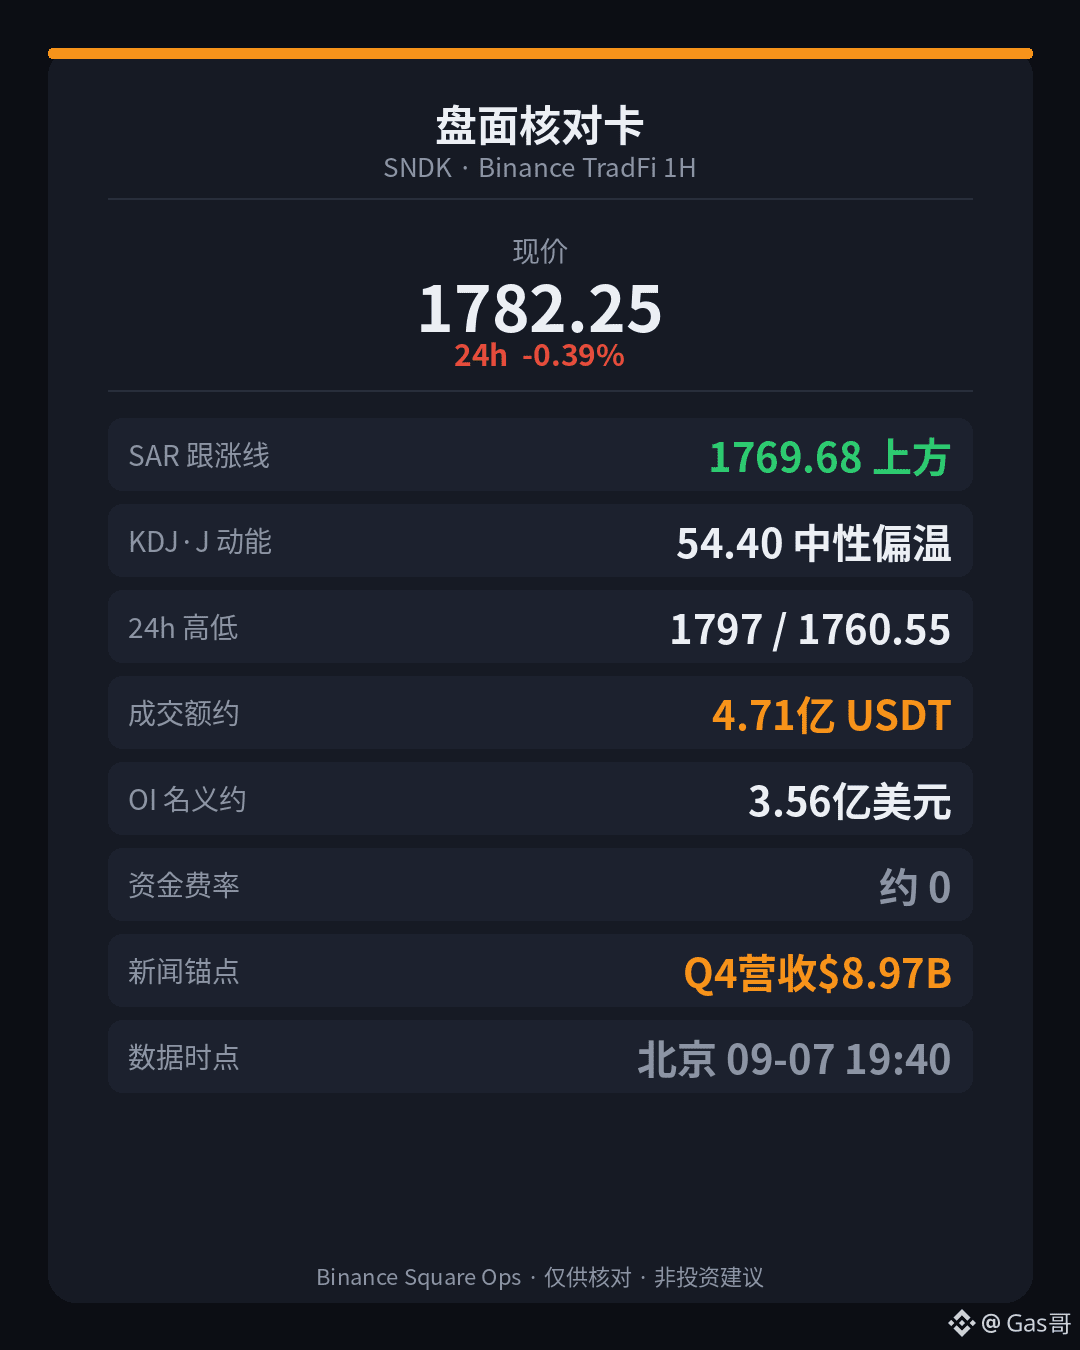
Main headline $SNDK : Binance TradFi perpetual spot price is about 1782.25, down about 0.39% over 24 hours, with trading volume around 471 million USDT. The following line (SAR) is about 1769.68, and price is still sitting about 12.6% above it—short-term support hasn’t broken; it’s just that the rise is losing speed. Momentum J value is 54.40 (K 62.75 / D 66.93). Not scorching, not cold—more like the throttle has been dialed back one notch and it’s still in the process of fine-tuning. 24-hour high 1797, low 1760.55. Open interest is about 200k lots; based on the mark price, the notional value is roughly $356 million. Funding rate is about 0—there’s money stacked up in this contract, but the price fluctuations are calmer than that quiet candle on Friday.
On the news side, what can be verified: Sandisk’s website earnings report (2026-08-05) states that for fiscal year 2026, Q4 revenue is about $8.97 billion, up about +51% quarter-over-quarter; non-GAAP diluted EPS is $39.25. Full-year revenue is about $20.25 billion. Guidance for fiscal year 2027 Q1 is about $10.3B to $10.8B. In addition, a 9/6 recap by Motley Fool (and others) also mentions TrendForce’s narrative of raising its outlook for NAND industry revenue—that’s an industry research report framing, not a directional instruction from the 1-hour K line we’re discussing. Also: U.S. Eastern time spot on 9/4 closed around 1740, up about 11.9% that day—this is a publicly available market summary and can coexist with the current contract market’s slight dip over the past 24 hours.
In one sentence: The earnings figures and Friday’s big spot surge are facts; translating “NAND is still tight” directly into “SNDK’s 1-hour candle should be chased” doesn’t hold.
If 1760 breaks, then we talk about the next step; right now it’s too early.
Main headline $SNDK : Binance TradFi perpetual spot price is about 1782.25, down about 0.39% over 24 hours, with trading volume around 471 million USDT. The following line (SAR) is about 1769.68, and price is still sitting about 12.6% above it—short-term support hasn’t broken; it’s just that the rise is losing speed. Momentum J value is 54.40 (K 62.75 / D 66.93). Not scorching, not cold—more like the throttle has been dialed back one notch and it’s still in the process of fine-tuning. 24-hour high 1797, low 1760.55. Open interest is about 200k lots; based on the mark price, the notional value is roughly $356 million. Funding rate is about 0—there’s money stacked up in this contract, but the price fluctuations are calmer than that quiet candle on Friday.
On the news side, what can be verified: Sandisk’s website earnings report (2026-08-05) states that for fiscal year 2026, Q4 revenue is about $8.97 billion, up about +51% quarter-over-quarter; non-GAAP diluted EPS is $39.25. Full-year revenue is about $20.25 billion. Guidance for fiscal year 2027 Q1 is about $10.3B to $10.8B. In addition, a 9/6 recap by Motley Fool (and others) also mentions TrendForce’s narrative of raising its outlook for NAND industry revenue—that’s an industry research report framing, not a directional instruction from the 1-hour K line we’re discussing. Also: U.S. Eastern time spot on 9/4 closed around 1740, up about 11.9% that day—this is a publicly available market summary and can coexist with the current contract market’s slight dip over the past 24 hours.
In one sentence: The earnings figures and Friday’s big spot surge are facts; translating “NAND is still tight” directly into “SNDK’s 1-hour candle should be chased” doesn’t hold.
If 1760 breaks, then we talk about the next step; right now it’s too early.
The official website has just reported a billion-level growth, yet on the chart the main headline indicator has already broken below the follow-up line first—don’t treat the earnings narrative as the instruction manual for this 1-hour K chart.
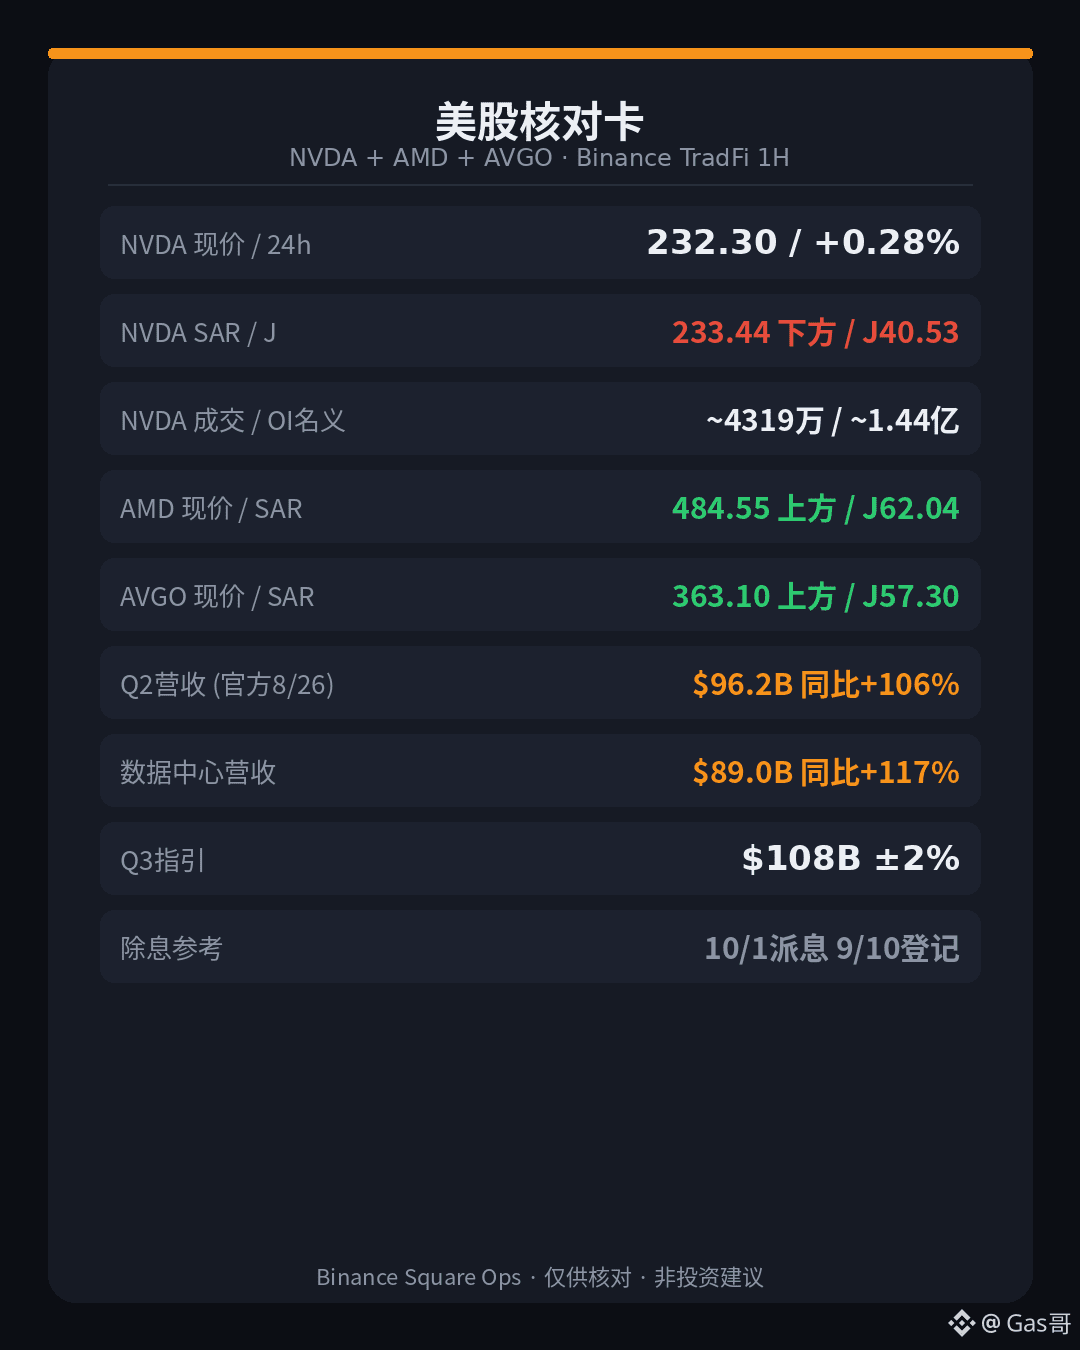
Main headline: $NVDA . On Binance TradFi perpetuals, the current price is around 232.30, up about 0.28% over 24 hours, with trading volume of roughly 43.19 million USDT. The follow-up line (SAR) is around 233.44; the price is already down about 1.14 below it—meaning that short-term support has been breached. Momentum J is 40.53 (K63.53/D75.03). It’s not icy cold or overheated—more like the throttle was eased a notch and it’s still grinding. The 24-hour high is 233.44, the low is 231.17. Open interest is about 620,000 contracts; converted at the mark price, the notional is roughly $144 million. The funding rate is about 0.
Two supporting coins in the same track are still holding above their lines: $AMD at about 484.55, up about 1.32% in 24 hours; SAR around 483.69, leaving roughly 0.86 above it; J about 62.04, slightly warmer; volume about $9.88 million; notional OI about $9.51 million level. $AVGO at about 363.10, up about 0.37% in 24 hours; SAR around 361.91, about 1.19 above it; J about 57.30; volume about $8.76 million; notional OI about $22.29 million.
Trading activity and positioning thickness still favor NVDA more, but in terms of short-term structure it actually broke the line first—at this moment, the scale and the strength are not in sync.
What can be verified on the news side: NVIDIA’s official press release (2026-08-26) states that for fiscal year 2027’s second quarter, revenue is $9.62 billion, up +106% year over year; data center revenue is $8.90 billion, up +117% YoY; gross margin is about 75%. For third-quarter guidance, revenue is expected to be around $108 billion (±2%), and the guidance does not include revenue from China data center computing business. The next quarterly cash dividend is $0.25 per share, scheduled to be paid on October 1 and recorded on September 10. Reports from CNBC and others on the earnings call also mention that the CFO gave an outlook for around 70% revenue growth in fiscal 2028—that is the management’s framing, not a directional instruction from this 1-hour K line.
In one sentence: “Billion-level revenue” and the guidance are facts. But translating “the guidance is very firm” directly into “NVDA’s 1-hour line should be chased right now” doesn’t hold.
What the chart gives you is a clue, not an order.
Main headline: $NVDA . On Binance TradFi perpetuals, the current price is around 232.30, up about 0.28% over 24 hours, with trading volume of roughly 43.19 million USDT. The follow-up line (SAR) is around 233.44; the price is already down about 1.14 below it—meaning that short-term support has been breached. Momentum J is 40.53 (K63.53/D75.03). It’s not icy cold or overheated—more like the throttle was eased a notch and it’s still grinding. The 24-hour high is 233.44, the low is 231.17. Open interest is about 620,000 contracts; converted at the mark price, the notional is roughly $144 million. The funding rate is about 0.
Two supporting coins in the same track are still holding above their lines: $AMD at about 484.55, up about 1.32% in 24 hours; SAR around 483.69, leaving roughly 0.86 above it; J about 62.04, slightly warmer; volume about $9.88 million; notional OI about $9.51 million level. $AVGO at about 363.10, up about 0.37% in 24 hours; SAR around 361.91, about 1.19 above it; J about 57.30; volume about $8.76 million; notional OI about $22.29 million.
Trading activity and positioning thickness still favor NVDA more, but in terms of short-term structure it actually broke the line first—at this moment, the scale and the strength are not in sync.
What can be verified on the news side: NVIDIA’s official press release (2026-08-26) states that for fiscal year 2027’s second quarter, revenue is $9.62 billion, up +106% year over year; data center revenue is $8.90 billion, up +117% YoY; gross margin is about 75%. For third-quarter guidance, revenue is expected to be around $108 billion (±2%), and the guidance does not include revenue from China data center computing business. The next quarterly cash dividend is $0.25 per share, scheduled to be paid on October 1 and recorded on September 10. Reports from CNBC and others on the earnings call also mention that the CFO gave an outlook for around 70% revenue growth in fiscal 2028—that is the management’s framing, not a directional instruction from this 1-hour K line.
In one sentence: “Billion-level revenue” and the guidance are facts. But translating “the guidance is very firm” directly into “NVDA’s 1-hour line should be chased right now” doesn’t hold.
What the chart gives you is a clue, not an order.
SNDK is more active on the trading volume chart, but MU is hotter on the momentum chart—the two storage standards are currently out of sync.
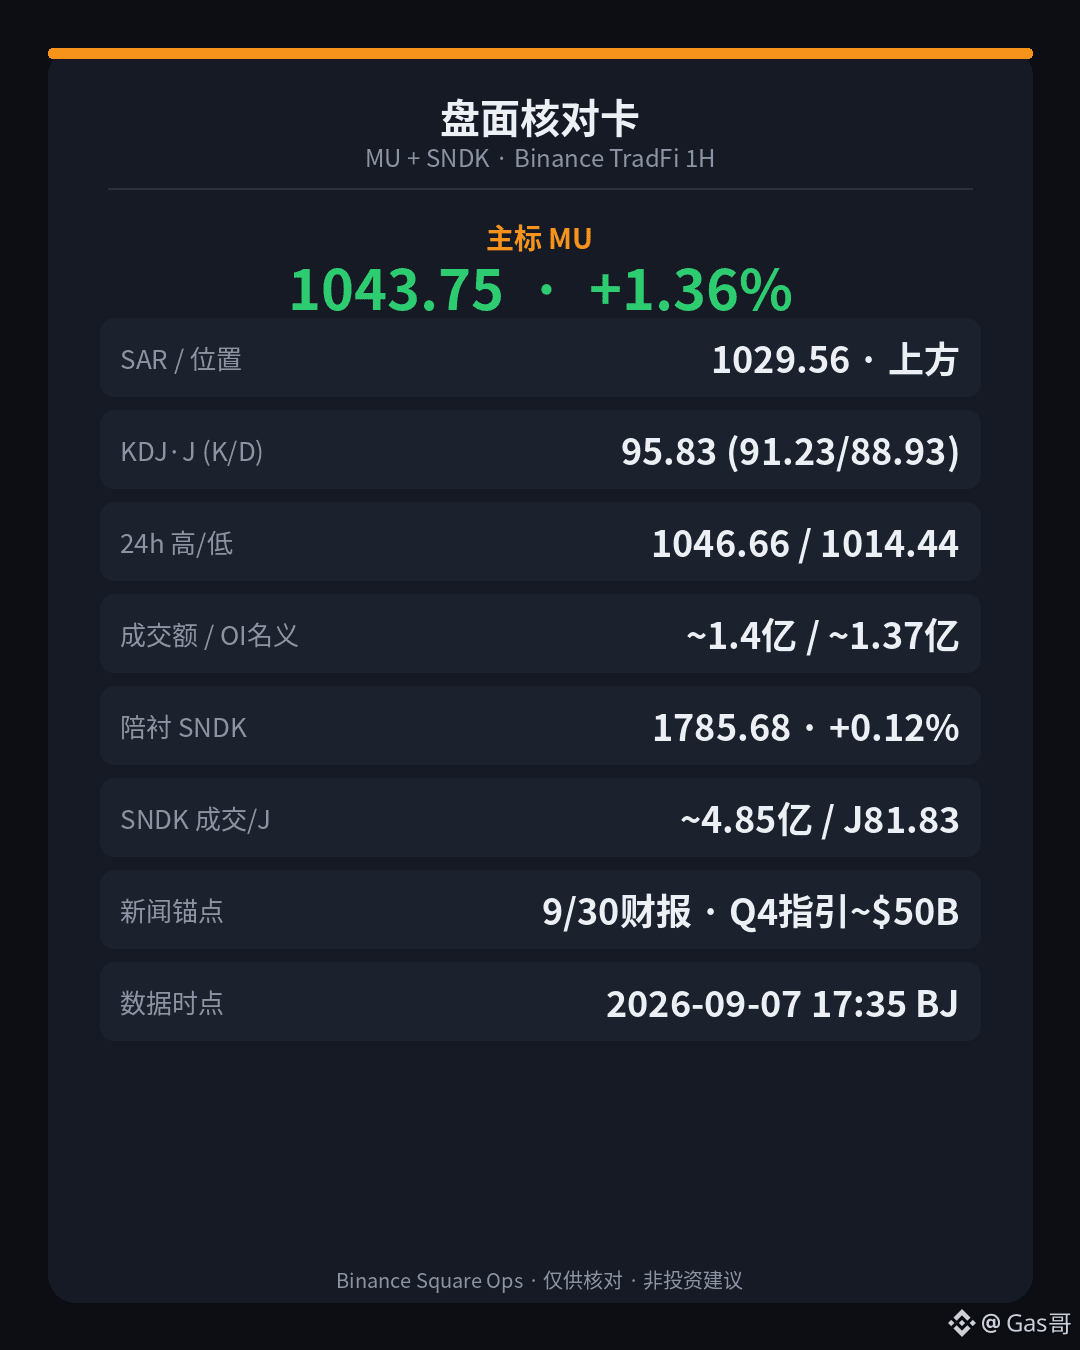
Main index $MU : Binance TradeFi Perpetual is currently priced at approximately $1043.75, up about 1.36% in the last 24 hours, with a trading volume of approximately $140 million. The SAR (Specific Absolute Range) is around $1029.56, and the price is still about $14 above it—short-term support hasn't been broken. The momentum J value is 95.83 (K 91.23/D 88.93), indicating excessive upward momentum. The 24-hour high is $1046.66 and the low is $1014.44; the recent two-day high is around $1046.66, and the current price is hovering near the intraday high. Open interest is approximately 131,300 contracts, with a nominal value of approximately $137 million at the mark price; the funding rate is approximately +0.015% per contract, meaning long positions are slightly incurring costs.
SNDK: Currently priced at approximately 1785.68, almost flat in the last 24 hours (+0.12%), but with a trading volume of approximately $485 million—more than three times that of MU. The upside target is around 1767.59, with an upside potential of approximately 18; the J-value is 81.83, slightly bullish, but not as overheated as MU. Open interest is approximately 199,500 contracts, with a nominal value of approximately $356 million; funding rate is approximately 0. More money is concentrated in SanDisk contracts, resulting in less price volatility.
News verifiable: Public market data shows a collective surge in the storage sector on September 4th (Eastern Time)—MU closed at approximately 1016.59, up approximately 6.1% for the day, and SNDK closed at approximately 1740, up approximately 11.9% for the day. At the company level, Micron previously gave revenue guidance of approximately $50 billion (±1 billion) for Q4 of fiscal year 2026, with a non-GAAP gross margin of approximately 86%. The market is awaiting the earnings report on September 30th to see if the AI storage gap story can continue. Motley Fool and other publications also monitored this earnings report on September 6th.
Therefore, don't directly translate "MU's momentum surge" as "the storage cycle has confirmed its next move." The current surge is a fact in the market; the narrative premium before the earnings report is another factor.
Right now, it's more like waiting for the September 30th results, rather than betting on the direction of this one-hour chart.
Main index $MU : Binance TradeFi Perpetual is currently priced at approximately $1043.75, up about 1.36% in the last 24 hours, with a trading volume of approximately $140 million. The SAR (Specific Absolute Range) is around $1029.56, and the price is still about $14 above it—short-term support hasn't been broken. The momentum J value is 95.83 (K 91.23/D 88.93), indicating excessive upward momentum. The 24-hour high is $1046.66 and the low is $1014.44; the recent two-day high is around $1046.66, and the current price is hovering near the intraday high. Open interest is approximately 131,300 contracts, with a nominal value of approximately $137 million at the mark price; the funding rate is approximately +0.015% per contract, meaning long positions are slightly incurring costs.
SNDK: Currently priced at approximately 1785.68, almost flat in the last 24 hours (+0.12%), but with a trading volume of approximately $485 million—more than three times that of MU. The upside target is around 1767.59, with an upside potential of approximately 18; the J-value is 81.83, slightly bullish, but not as overheated as MU. Open interest is approximately 199,500 contracts, with a nominal value of approximately $356 million; funding rate is approximately 0. More money is concentrated in SanDisk contracts, resulting in less price volatility.
News verifiable: Public market data shows a collective surge in the storage sector on September 4th (Eastern Time)—MU closed at approximately 1016.59, up approximately 6.1% for the day, and SNDK closed at approximately 1740, up approximately 11.9% for the day. At the company level, Micron previously gave revenue guidance of approximately $50 billion (±1 billion) for Q4 of fiscal year 2026, with a non-GAAP gross margin of approximately 86%. The market is awaiting the earnings report on September 30th to see if the AI storage gap story can continue. Motley Fool and other publications also monitored this earnings report on September 6th.
Therefore, don't directly translate "MU's momentum surge" as "the storage cycle has confirmed its next move." The current surge is a fact in the market; the narrative premium before the earnings report is another factor.
Right now, it's more like waiting for the September 30th results, rather than betting on the direction of this one-hour chart.
It was still red by more than three points over 24 hours, but the trend-following line has already turned back above it — this LAB move is about location, not the face-saving part of the percentage change.
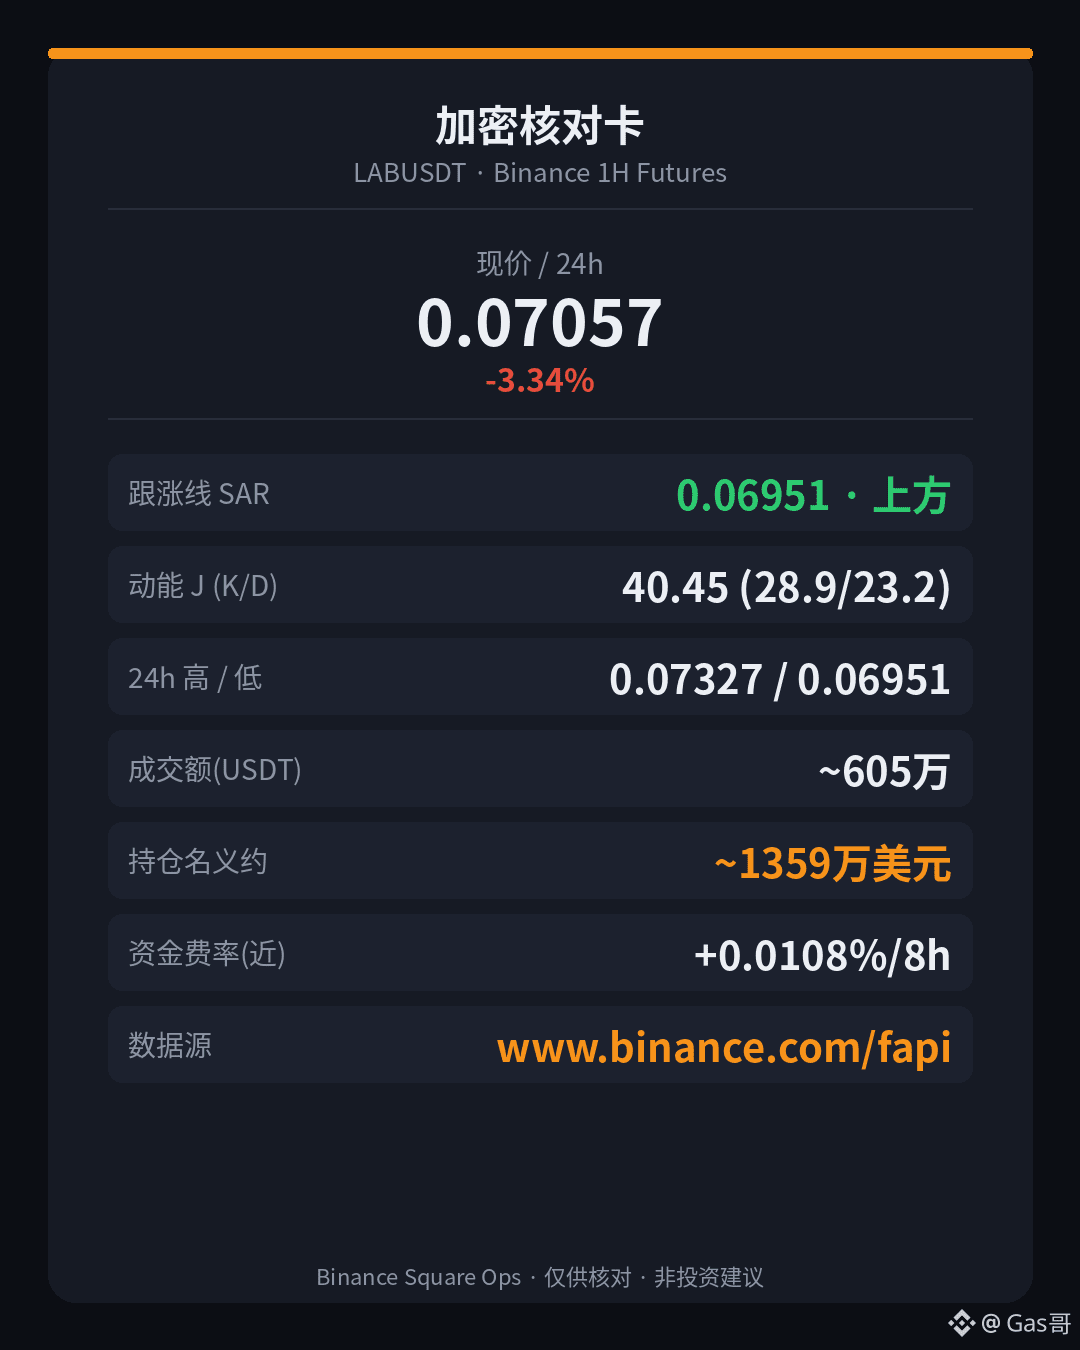
Main symbol $LAB : current price 0.07057, down about 3.34% over 24 hours. Binance USDT-margined futures trading volume is roughly 6.05 million USDT, so liquidity is on the thin side. The trend-following line (SAR) is at 0.06951, and price has just moved back above it by about 0.00106 — it was still below that line an hour ago, so this 1-hour candle has reclaimed short-term support first. Momentum J is 40.45 (K 28.93 / D 23.16), neither hot nor cold, like the throttle has only just been lifted halfway, not an aggressive oversold rebound. 24-hour high is 0.07327 and low is 0.06951; the two-day high is about 0.07601, so there is still some overhead gap to fill.
Funding / positioning side (futures dashboard, not narrative): open interest is about 193 million coins, which converts to roughly 13.6 million USD in notional value at the mark price. The latest funding rate is about +0.0108% / 8 hours, so longs are paying a little, but not heavily. Compared with other large contracts on the same screen: HYPE has roughly 790 million USD in volume and about 380 million USD in notional open interest, while ZEC has around 3.4 billion USD in volume — LAB’s line reclaim can be noted, but the scale is not in the same league at all. On the macro side, public reports citing SoSoValue said U.S. spot Bitcoin ETFs saw about 987 million USD in net inflows for the week ending September 5, with about 3.8 billion USD over the past three weeks. Money is flowing first into the BTC channel; that does not automatically mean smaller futures contracts get the same depth of flow.
So don’t directly translate “it just got back above the trend-following line” into “the downtrend is fully over.” The line now under price is a new fact; thin trading and open interest are also facts.
If price falls back below the trend-following line around 0.0695, the story will have to be rewritten once again.
Main symbol $LAB : current price 0.07057, down about 3.34% over 24 hours. Binance USDT-margined futures trading volume is roughly 6.05 million USDT, so liquidity is on the thin side. The trend-following line (SAR) is at 0.06951, and price has just moved back above it by about 0.00106 — it was still below that line an hour ago, so this 1-hour candle has reclaimed short-term support first. Momentum J is 40.45 (K 28.93 / D 23.16), neither hot nor cold, like the throttle has only just been lifted halfway, not an aggressive oversold rebound. 24-hour high is 0.07327 and low is 0.06951; the two-day high is about 0.07601, so there is still some overhead gap to fill.
Funding / positioning side (futures dashboard, not narrative): open interest is about 193 million coins, which converts to roughly 13.6 million USD in notional value at the mark price. The latest funding rate is about +0.0108% / 8 hours, so longs are paying a little, but not heavily. Compared with other large contracts on the same screen: HYPE has roughly 790 million USD in volume and about 380 million USD in notional open interest, while ZEC has around 3.4 billion USD in volume — LAB’s line reclaim can be noted, but the scale is not in the same league at all. On the macro side, public reports citing SoSoValue said U.S. spot Bitcoin ETFs saw about 987 million USD in net inflows for the week ending September 5, with about 3.8 billion USD over the past three weeks. Money is flowing first into the BTC channel; that does not automatically mean smaller futures contracts get the same depth of flow.
So don’t directly translate “it just got back above the trend-following line” into “the downtrend is fully over.” The line now under price is a new fact; thin trading and open interest are also facts.
If price falls back below the trend-following line around 0.0695, the story will have to be rewritten once again.
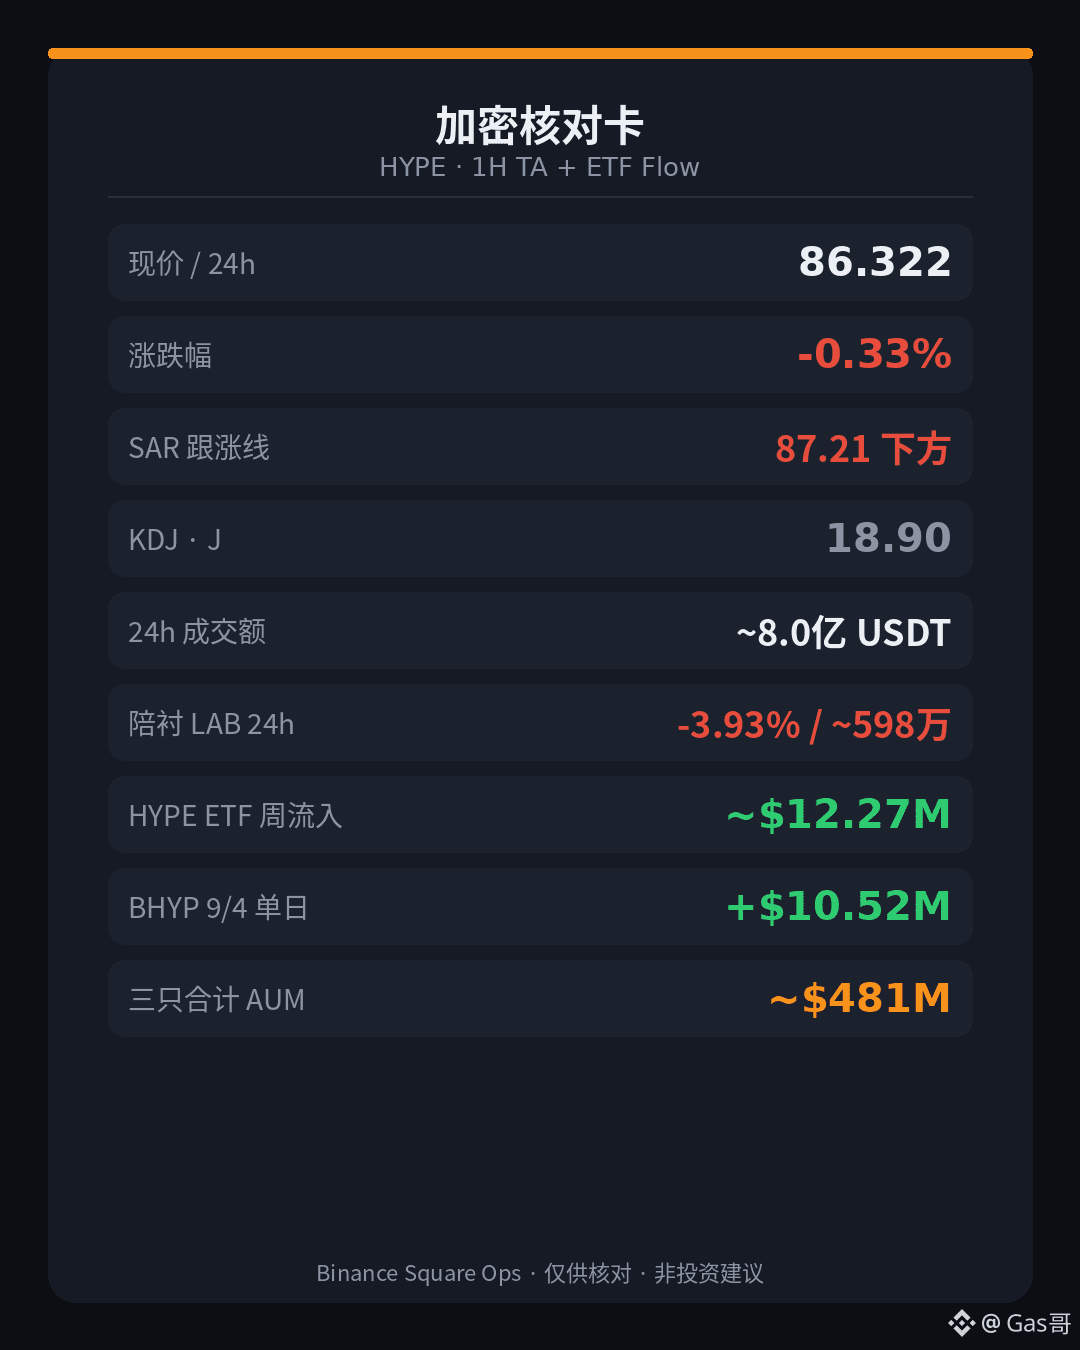
U.S. spot HYPE ETF saw a net inflow of about $12.27 million last week, but the chart first broke below the follow-up line — a hot channel does not automatically mean the 1-hour chart is hot too.
Main ticker $HYPE : current price 86.322, down about 0.33% in the last 24 hours. Binance USDT-margined futures trading volume is around $800 million, so liquidity is not thin. The follow-up line (SAR) is at 87.21, and price has fallen about 0.90 below it — short-term support has been broken. Momentum J value is 18.90 (K 23.95 / D 26.47), which is relatively cool, like the throttle has been eased quite a bit. 24-hour high 89.67, low 86.00; the high over the past two days is also around 89.67, so it has pulled back from the intraday high.
By comparison, another same-cycle moving contract $LAB : current price 0.06993, down about 3.93% in the last 24 hours, with volume around 5.98 million USDT. It also fell below the follow-up line (SAR around 0.07065), and its J value of 11.69 is even colder. Both are below the line, but their scale and narrative are not on the same level: one is supported by a spot ETF channel, while the other looks more like pure derivatives noise.
On the fund flow side, public reports citing SoSoValue said that for the week ending Sept. 4 Eastern Time (8/31–9/4), U.S. spot HYPE ETFs had total net inflows of about $12.27 million; among them, Bitwise BHYP alone saw about +$10.52 million on 9/4. The three products (BHYP/HYPG/THYP) had combined net assets of about $481 million, with historical cumulative net inflows of roughly $357 million. The channel has depth; but this 1-hour candle has already broken support and momentum is relatively weak — do not directly translate “institutions are still flowing in” into “price must reclaim the line in the short term.”
In one sentence: weekly ETF inflows are confirmed; “hot channel = short-term must hold support” is not.
Main ticker $HYPE : current price 86.322, down about 0.33% in the last 24 hours. Binance USDT-margined futures trading volume is around $800 million, so liquidity is not thin. The follow-up line (SAR) is at 87.21, and price has fallen about 0.90 below it — short-term support has been broken. Momentum J value is 18.90 (K 23.95 / D 26.47), which is relatively cool, like the throttle has been eased quite a bit. 24-hour high 89.67, low 86.00; the high over the past two days is also around 89.67, so it has pulled back from the intraday high.
By comparison, another same-cycle moving contract $LAB : current price 0.06993, down about 3.93% in the last 24 hours, with volume around 5.98 million USDT. It also fell below the follow-up line (SAR around 0.07065), and its J value of 11.69 is even colder. Both are below the line, but their scale and narrative are not on the same level: one is supported by a spot ETF channel, while the other looks more like pure derivatives noise.
On the fund flow side, public reports citing SoSoValue said that for the week ending Sept. 4 Eastern Time (8/31–9/4), U.S. spot HYPE ETFs had total net inflows of about $12.27 million; among them, Bitwise BHYP alone saw about +$10.52 million on 9/4. The three products (BHYP/HYPG/THYP) had combined net assets of about $481 million, with historical cumulative net inflows of roughly $357 million. The channel has depth; but this 1-hour candle has already broken support and momentum is relatively weak — do not directly translate “institutions are still flowing in” into “price must reclaim the line in the short term.”
In one sentence: weekly ETF inflows are confirmed; “hot channel = short-term must hold support” is not.
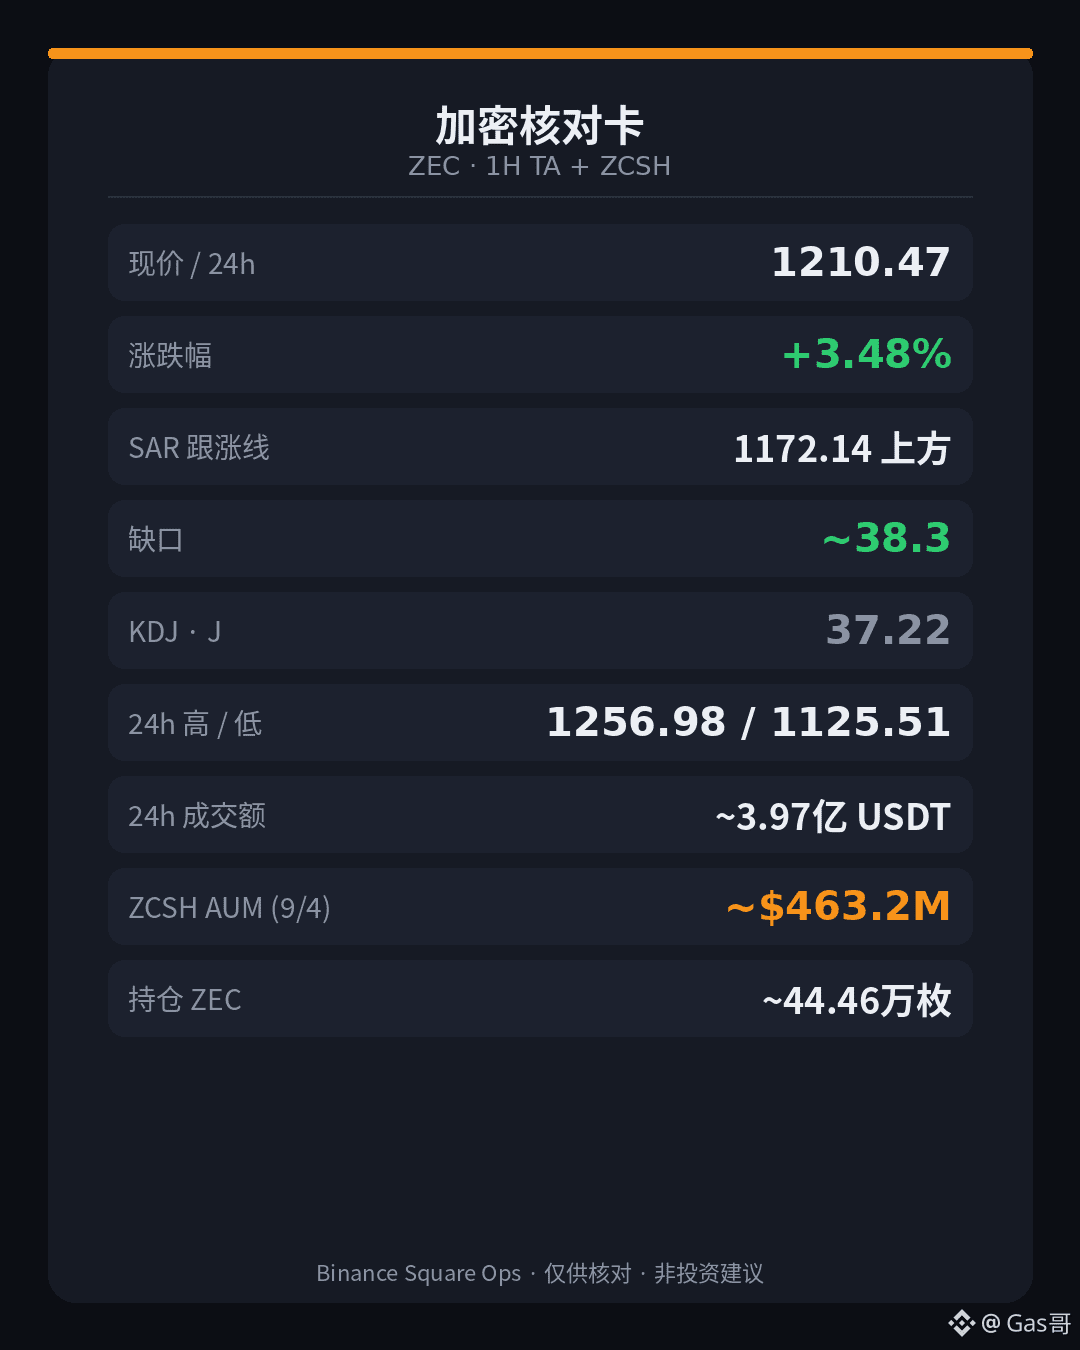
Many people are watching the break above 1200, but I care more about whether momentum is keeping up — the price is standing on the line, but the accelerator doesn’t feel hot.
Main symbol $ZEC : current price 1210.47, up about 3.48% over 24 hours. Binance spot trading volume is roughly 397 million USDT, so liquidity is not thin. The follow-trend line (SAR) is at 1172.14, and the price is still about 38 above it — short-term strength/weakness remains biased bullish, not just barely holding the line. The momentum J value is 37.22 (K 38.09 / D 38.53), neither cold nor hot, like the gas pedal pressed halfway, not fully matching the green gain. 24-hour high 1256.98, low 1125.51; highs over the past two days have also clustered near 1256.98, so overhead resistance is right in front of us, and there is still some distance from the intraday high.
On the channel side, the privacy narrative is smooth, but what can actually be verified is the depth of positions. Grayscale ZCSH (launched on NYSE Arca on 8/25, the first U.S. spot ZEC channel) disclosed on its official website as of about 9/4: non-GAAP AUM of about 463.2 million USD, holdings of about 444,600 ZEC, and about 5.5493 million shares. At the open, AUM was around the 305 million USD level; now the scale is thicker — the rise reflects both the increase in coin price and the growth in positions. The etfllama list updates are somewhat lagging; this piece is based on the official disclosure, not on forcing old figures to fit.
Today’s note records only the numbers, with no heroic storytelling.
Main symbol $ZEC : current price 1210.47, up about 3.48% over 24 hours. Binance spot trading volume is roughly 397 million USDT, so liquidity is not thin. The follow-trend line (SAR) is at 1172.14, and the price is still about 38 above it — short-term strength/weakness remains biased bullish, not just barely holding the line. The momentum J value is 37.22 (K 38.09 / D 38.53), neither cold nor hot, like the gas pedal pressed halfway, not fully matching the green gain. 24-hour high 1256.98, low 1125.51; highs over the past two days have also clustered near 1256.98, so overhead resistance is right in front of us, and there is still some distance from the intraday high.
On the channel side, the privacy narrative is smooth, but what can actually be verified is the depth of positions. Grayscale ZCSH (launched on NYSE Arca on 8/25, the first U.S. spot ZEC channel) disclosed on its official website as of about 9/4: non-GAAP AUM of about 463.2 million USD, holdings of about 444,600 ZEC, and about 5.5493 million shares. At the open, AUM was around the 305 million USD level; now the scale is thicker — the rise reflects both the increase in coin price and the growth in positions. The etfllama list updates are somewhat lagging; this piece is based on the official disclosure, not on forcing old figures to fit.
Today’s note records only the numbers, with no heroic storytelling.
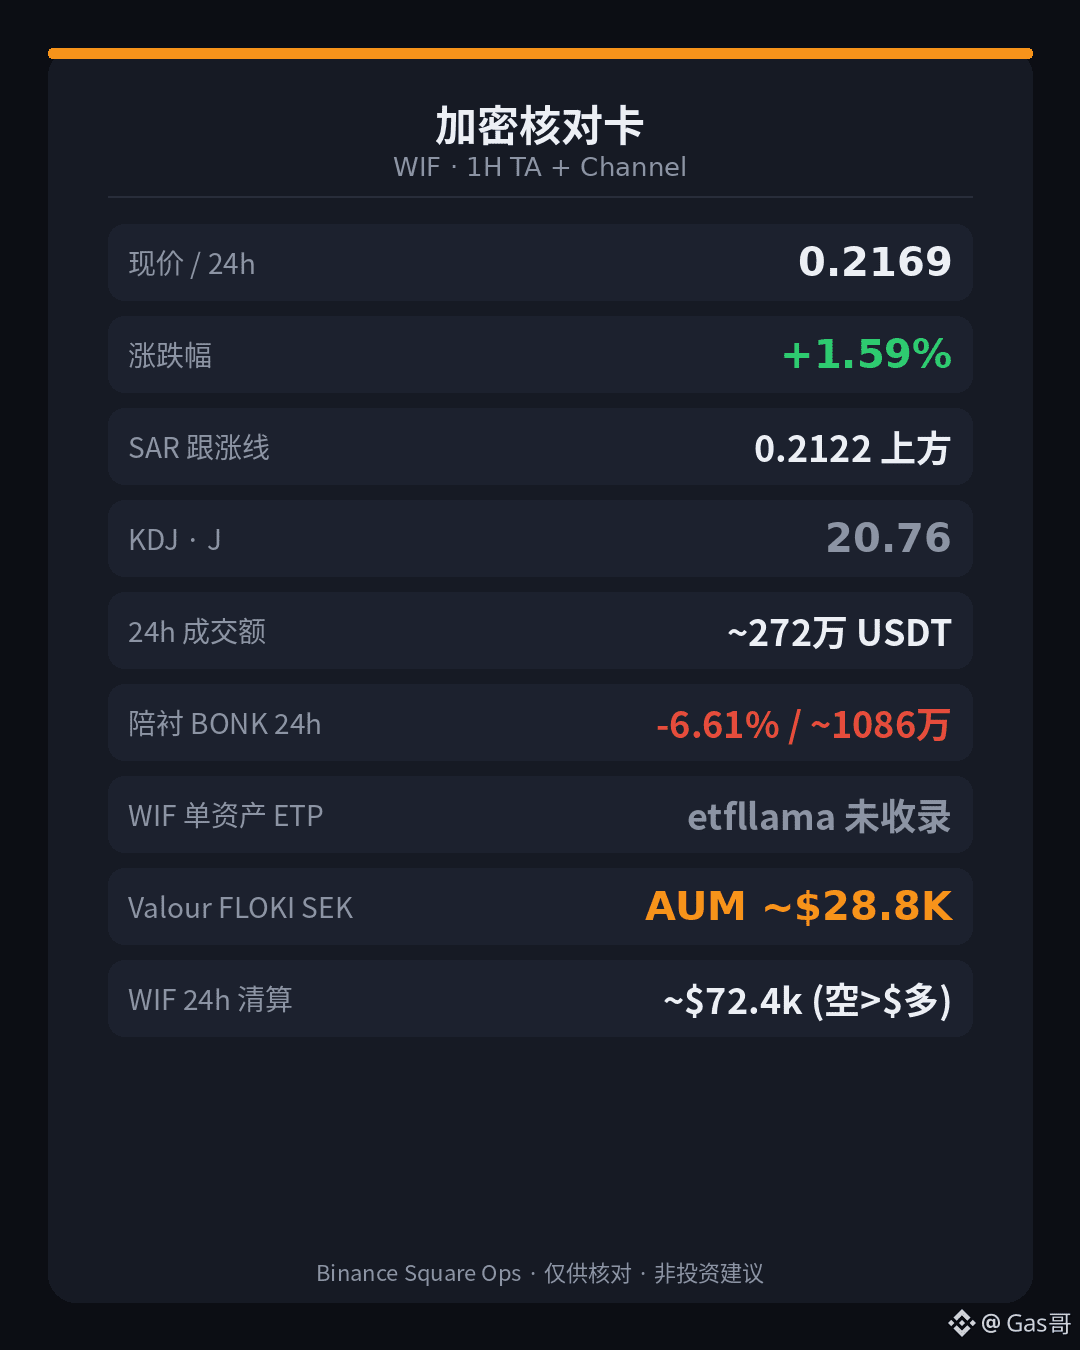
The bigger one trading in the same sector is getting dumped, while the green one is oddly quiet—don’t read “meme is moving” as the same thing.
Main name $WIF : current price 0.2169, up about 1.59% over the past 24 hours, with Binance spot volume around 2.72 million USDT. The follow-trend line (SAR) is at 0.2122, so price is still about 0.0047 above it—the short-term strength reference has not flipped bearish. Momentum J value is 20.76 (K35.67/D43.13), which is on the cool side but not frozen, like the throttle was eased halfway but it is still climbing. 24-hour high 0.2224, low 0.2081; the highs over the past two days have also been around 0.2224, so overhead pressure is close at hand.
By comparison in the same lane, $BONK : current price 0.00000311, down about 6.61% over 24 hours, with volume around 10.86 million USDT—roughly four times WIF’s. It has already broken below the follow-trend line, and its J value of 9.28 is also quite cold. One is holding above the line with a green candle and thinner volume; the other has broken the line in the red with much heavier trading.
On the channel side, the etfllama list (as of about 9/5) does not show a WIF single-asset ETF/ETP; in the same sector, Valour FLOKI SEK AUM is about 288,000 USD, Valour PEPE SEK is about 501,000 USD, and DOGE-related products do have channels. Solana staking ETFs can be very large (for example, BSOL is around the 960 million USD level), but that is SOL, not WIF. On the funding-noise side, Coinalyze shows WIF total liquidations over the past 24 hours at about 72,400 USD, with about 50,900 USD in shorts and about 21,500 USD in longs—so the scale is not large.
Same direction does not mean same risk; do not mix up this layer.
Main name $WIF : current price 0.2169, up about 1.59% over the past 24 hours, with Binance spot volume around 2.72 million USDT. The follow-trend line (SAR) is at 0.2122, so price is still about 0.0047 above it—the short-term strength reference has not flipped bearish. Momentum J value is 20.76 (K35.67/D43.13), which is on the cool side but not frozen, like the throttle was eased halfway but it is still climbing. 24-hour high 0.2224, low 0.2081; the highs over the past two days have also been around 0.2224, so overhead pressure is close at hand.
By comparison in the same lane, $BONK : current price 0.00000311, down about 6.61% over 24 hours, with volume around 10.86 million USDT—roughly four times WIF’s. It has already broken below the follow-trend line, and its J value of 9.28 is also quite cold. One is holding above the line with a green candle and thinner volume; the other has broken the line in the red with much heavier trading.
On the channel side, the etfllama list (as of about 9/5) does not show a WIF single-asset ETF/ETP; in the same sector, Valour FLOKI SEK AUM is about 288,000 USD, Valour PEPE SEK is about 501,000 USD, and DOGE-related products do have channels. Solana staking ETFs can be very large (for example, BSOL is around the 960 million USD level), but that is SOL, not WIF. On the funding-noise side, Coinalyze shows WIF total liquidations over the past 24 hours at about 72,400 USD, with about 50,900 USD in shorts and about 21,500 USD in longs—so the scale is not large.
Same direction does not mean same risk; do not mix up this layer.
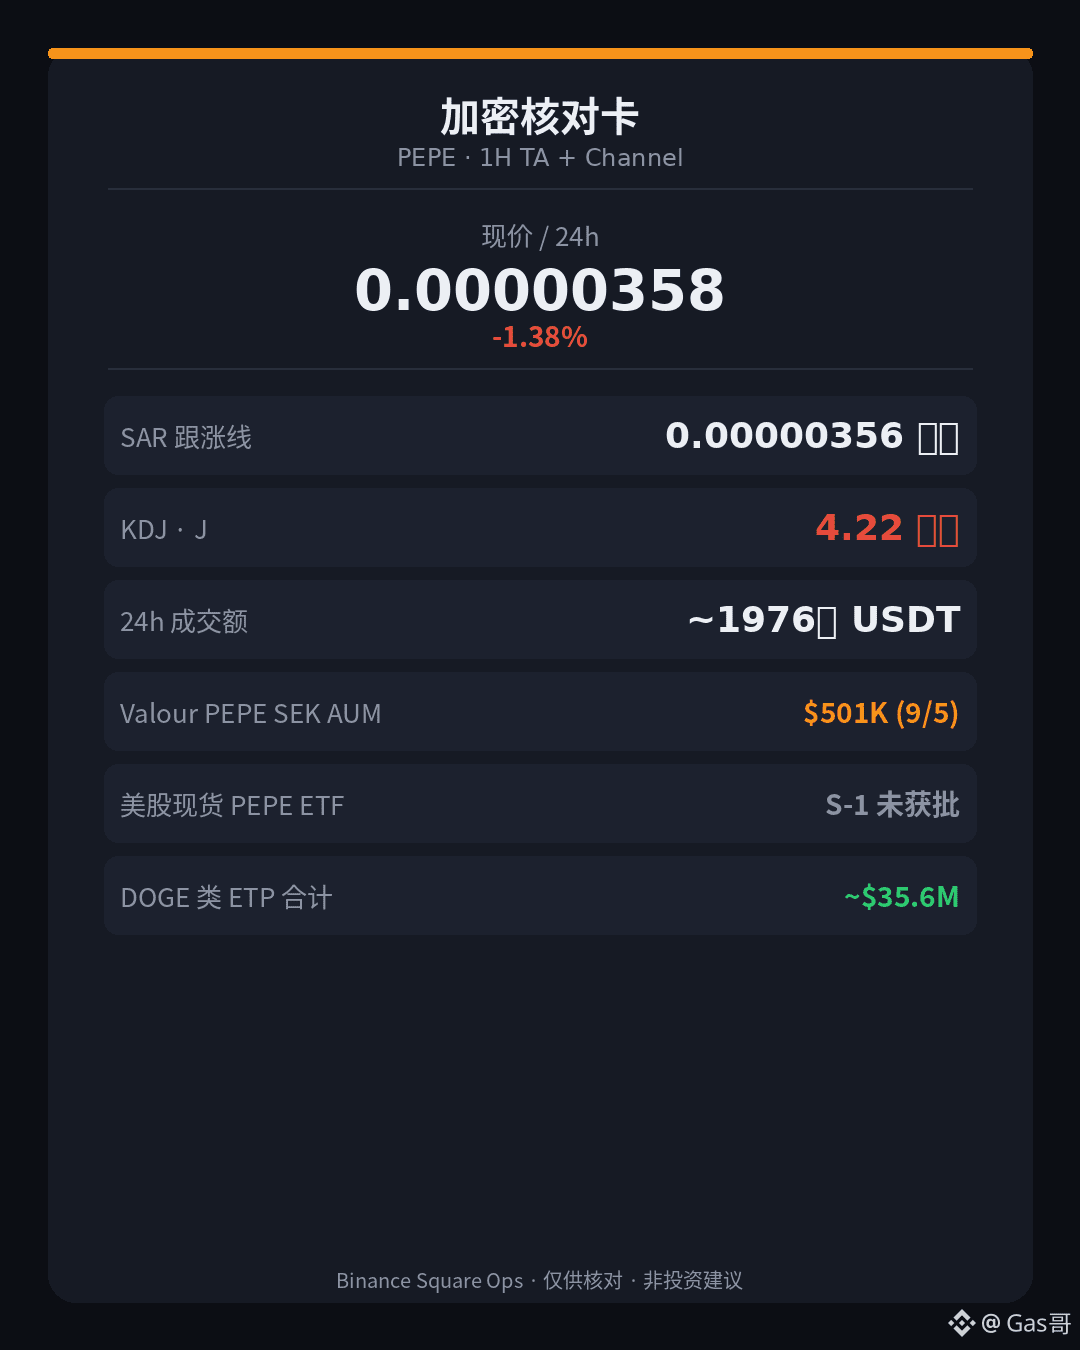
The U.S. spot PEPE ETF is still waiting in the SEC queue, while the European channel’s AUM is only about $500,000 — the narrative is much bigger than the positioning.
First, look at the headline. $PEPE is currently at 0.00000358, down about 1.38% in the past 24 hours, with trading volume of about 19.76 million USDT. The follow-trend line (SAR) is around 0.00000356, and the price is still just barely holding above it — short-term strength/weakness reference has not completely turned bearish, but it is almost grinding right on the line. The momentum J value is 4.22 (K 33.18 / D 47.66), already extremely cold, like the accelerator has been let off completely. 24-hour high 0.00000367, low 0.00000353; the high over the past two days is around 0.00000371, so it has pulled back quite a bit from above.
Comparing two other tokens in the same sector: $DOGE is currently at 0.08955, down about 1.22% over 24 hours, with even stronger trading volume (about 86.63 million USDT), and it is still above the follow-trend line (SAR around 0.08843), but its J value has dropped to -1.94, showing a stronger oversold feel. $WIF is currently at 0.2153, up about 0.61% over 24 hours, standing above the line (SAR around 0.2116), and its J value of 3.29 is also quite cold. The structure of these three meme tokens is similar: the line has not broken yet, but the momentum has already cooled.
On the fund-flow side, according to public data from etfllama: as of around September 5, the AUM of PEPE-related ETPs such as Europe’s Valour Pepe SEK was about $501,000, with net inflows of about $888,000 over the past 7 days and about $1.24 million over the past 30 days — still a "micro-channel" in scale. In the U.S., Canary Capital’s spot PEPE ETF S-1 is still under SEC review (submitted on April 8, 2026), and has not been approved, nor does it have official product AUM. By comparison, DOGE-like ETFs/ETPs in the same scope total about $35.56 million — DOGE at least already has channel depth, while PEPE is still more of an "application narrative" than "institutional positioning already in place."
Final blank space: the numbers are here; make your own judgment.
First, look at the headline. $PEPE is currently at 0.00000358, down about 1.38% in the past 24 hours, with trading volume of about 19.76 million USDT. The follow-trend line (SAR) is around 0.00000356, and the price is still just barely holding above it — short-term strength/weakness reference has not completely turned bearish, but it is almost grinding right on the line. The momentum J value is 4.22 (K 33.18 / D 47.66), already extremely cold, like the accelerator has been let off completely. 24-hour high 0.00000367, low 0.00000353; the high over the past two days is around 0.00000371, so it has pulled back quite a bit from above.
Comparing two other tokens in the same sector: $DOGE is currently at 0.08955, down about 1.22% over 24 hours, with even stronger trading volume (about 86.63 million USDT), and it is still above the follow-trend line (SAR around 0.08843), but its J value has dropped to -1.94, showing a stronger oversold feel. $WIF is currently at 0.2153, up about 0.61% over 24 hours, standing above the line (SAR around 0.2116), and its J value of 3.29 is also quite cold. The structure of these three meme tokens is similar: the line has not broken yet, but the momentum has already cooled.
On the fund-flow side, according to public data from etfllama: as of around September 5, the AUM of PEPE-related ETPs such as Europe’s Valour Pepe SEK was about $501,000, with net inflows of about $888,000 over the past 7 days and about $1.24 million over the past 30 days — still a "micro-channel" in scale. In the U.S., Canary Capital’s spot PEPE ETF S-1 is still under SEC review (submitted on April 8, 2026), and has not been approved, nor does it have official product AUM. By comparison, DOGE-like ETFs/ETPs in the same scope total about $35.56 million — DOGE at least already has channel depth, while PEPE is still more of an "application narrative" than "institutional positioning already in place."
Final blank space: the numbers are here; make your own judgment.
The one with the thicker channel has seen its momentum freeze first, while the one that rose more sharply broke its line first — SUI and NEAR, don’t line them up by percentage gain or loss.
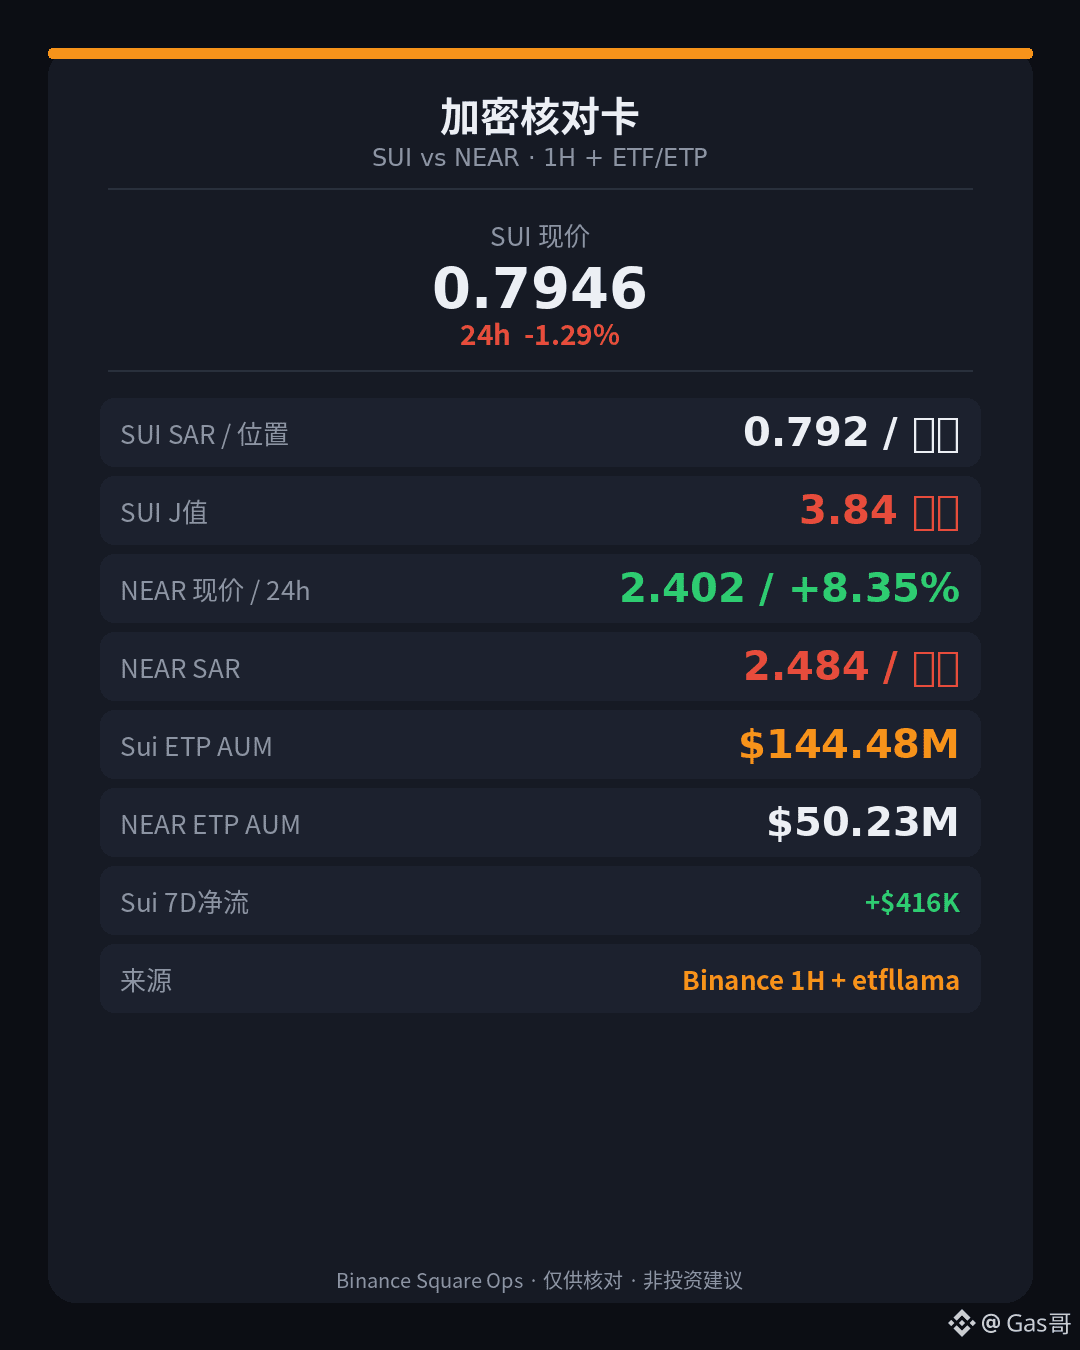
First, look at the main symbol. $SUI is priced at 0.7946, down about 1.29% over the past 24 hours, with trading volume around 58.73 million USDT. The trend-following line (SAR) is near 0.792, and price is still barely above it by about 0.0026 — short-term strength/weakness reference has not fully turned bearish, but it is almost grinding right on the line. The momentum J value is 3.84 (K 35.12 / D 50.76), already cold to the point of freezing, like the throttle has been let off completely. The 24-hour high is 0.8233 and the low is 0.782; it just touched the area around 0.823 at the top and then pulled back a bit.
By comparison, $NEAR : current price 2.402, but it is up about 8.35% over 24 hours, with even stronger volume (about 90.37 million USDT). Yet it has already fallen below the trend-following line (SAR around 2.484, with price about 0.082 below it), and its J value of 21.5 is also cold. One is in the red but still hugging the line, with frozen momentum; the other is in the green but has broken support — percentage change and structure are not the same thing.
On the capital side, according to public data from etfllama: global Sui-related ETFs/ETPs have total AUM of about 144.5 million USD, with net inflows of about 416,000 USD over the past 7 days and about 12,000 USD net outflow over the past day (mainly from Canary SUIS). Under the same methodology, NEAR-related products total about 50.23 million USD, with about 5,000 USD net inflow over the past 7 days and 0 over the past day. The SUI channel is roughly three times the size of NEAR’s, but the short-term chart is not stronger — a thicker channel does not mean stronger momentum right now.
This section only confirms structure, not sentiment.
First, look at the main symbol. $SUI is priced at 0.7946, down about 1.29% over the past 24 hours, with trading volume around 58.73 million USDT. The trend-following line (SAR) is near 0.792, and price is still barely above it by about 0.0026 — short-term strength/weakness reference has not fully turned bearish, but it is almost grinding right on the line. The momentum J value is 3.84 (K 35.12 / D 50.76), already cold to the point of freezing, like the throttle has been let off completely. The 24-hour high is 0.8233 and the low is 0.782; it just touched the area around 0.823 at the top and then pulled back a bit.
By comparison, $NEAR : current price 2.402, but it is up about 8.35% over 24 hours, with even stronger volume (about 90.37 million USDT). Yet it has already fallen below the trend-following line (SAR around 2.484, with price about 0.082 below it), and its J value of 21.5 is also cold. One is in the red but still hugging the line, with frozen momentum; the other is in the green but has broken support — percentage change and structure are not the same thing.
On the capital side, according to public data from etfllama: global Sui-related ETFs/ETPs have total AUM of about 144.5 million USD, with net inflows of about 416,000 USD over the past 7 days and about 12,000 USD net outflow over the past day (mainly from Canary SUIS). Under the same methodology, NEAR-related products total about 50.23 million USD, with about 5,000 USD net inflow over the past 7 days and 0 over the past day. The SUI channel is roughly three times the size of NEAR’s, but the short-term chart is not stronger — a thicker channel does not mean stronger momentum right now.
This section only confirms structure, not sentiment.
DOT spot rose more than 7% in a day, but the momentum J value dropped from the 70s this morning to the 50s — the gains are still being refreshed, but the accelerator has already eased off.
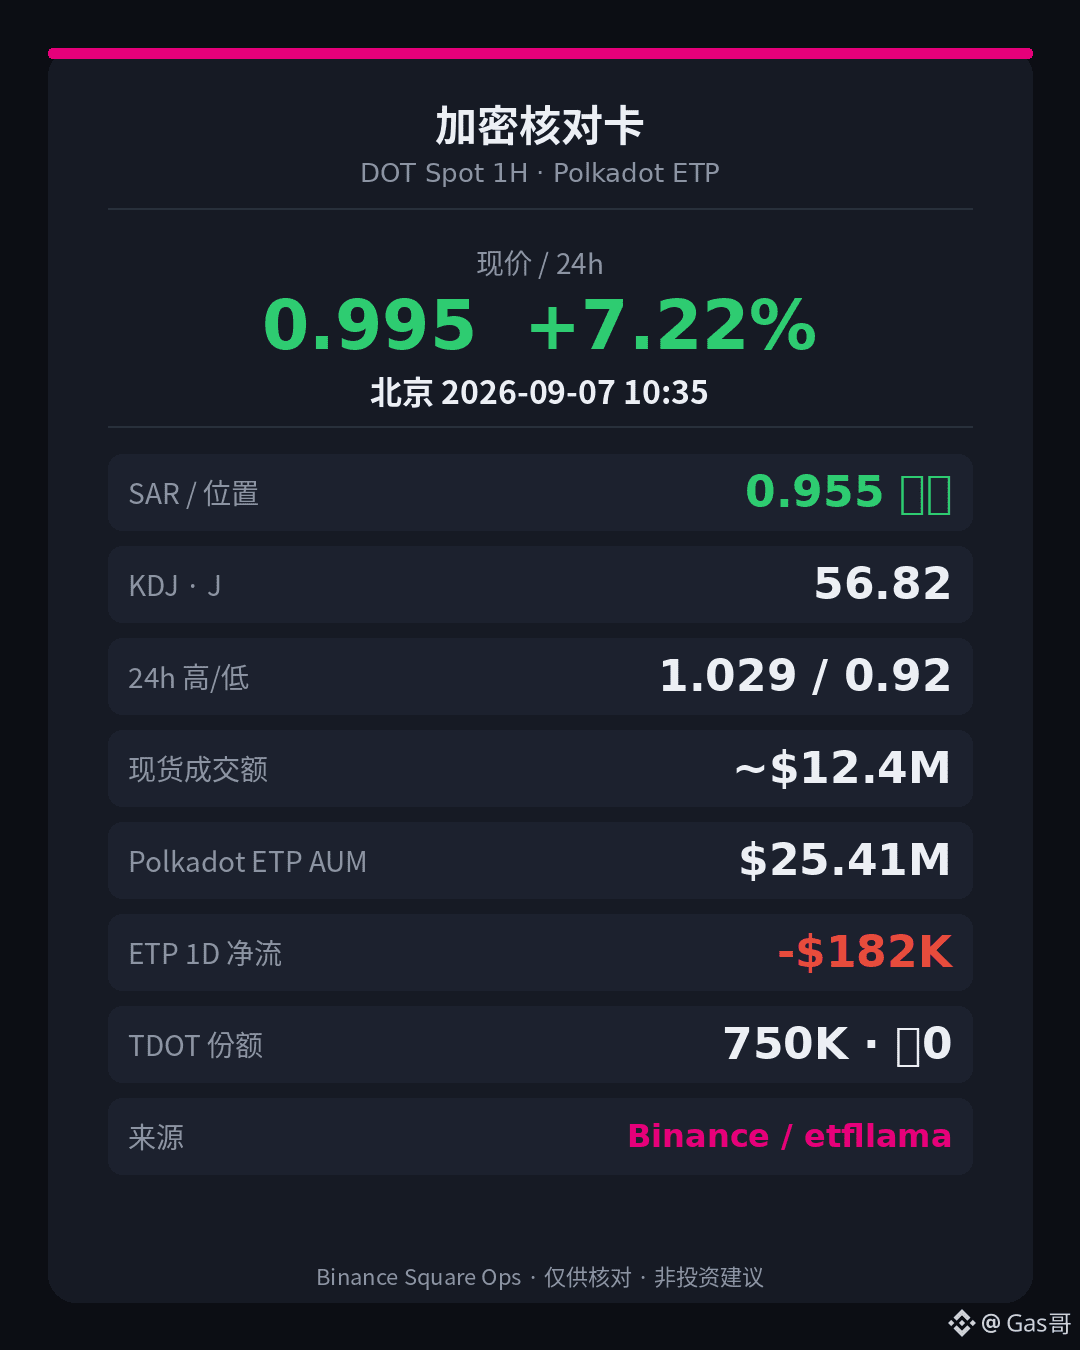
$DOT is currently priced at 0.995, up about 7.22% over 24 hours, with trading volume around 12.4 million USDT. The trend-following line (SAR) is near 0.955, and the price is still about 0.04 above it — short-term strength still leans bullish. The momentum J value is 56.82 (K 62.92 / D 65.97), clearly cooler than the overheated state from an hour ago; it looks more like a pullback after stepping on the gas than a continued surge. The 24-hour high reached 1.029, and the low was 0.92; it just touched the area around 1.029 overhead, but has not held above it.
On the capital side, according to etfllama (as of around 9/5): global Polkadot-related ETFs/ETPs have total AUM of about $25.41 million; net outflows over the past day were about $182,000, while the past 7 days still show a cumulative net inflow of about $174,000. In the U.S. channel, TDOT (21Shares) has AUM of about $8.08 million, with shares locked at 750,000; net inflows over 1 day / 7 days / 30 days are all zero — AUM is moving with the coin price, not because new money is coming in. Looking back to the March seed-scale level of about $11 million, the size still has not returned to the starting point.
Both rises and falls are normal; the key is not to read one move as a trend reversal.
$DOT is currently priced at 0.995, up about 7.22% over 24 hours, with trading volume around 12.4 million USDT. The trend-following line (SAR) is near 0.955, and the price is still about 0.04 above it — short-term strength still leans bullish. The momentum J value is 56.82 (K 62.92 / D 65.97), clearly cooler than the overheated state from an hour ago; it looks more like a pullback after stepping on the gas than a continued surge. The 24-hour high reached 1.029, and the low was 0.92; it just touched the area around 1.029 overhead, but has not held above it.
On the capital side, according to etfllama (as of around 9/5): global Polkadot-related ETFs/ETPs have total AUM of about $25.41 million; net outflows over the past day were about $182,000, while the past 7 days still show a cumulative net inflow of about $174,000. In the U.S. channel, TDOT (21Shares) has AUM of about $8.08 million, with shares locked at 750,000; net inflows over 1 day / 7 days / 30 days are all zero — AUM is moving with the coin price, not because new money is coming in. Looking back to the March seed-scale level of about $11 million, the size still has not returned to the starting point.
Both rises and falls are normal; the key is not to read one move as a trend reversal.
The spot rally is making a lot of noise, but the U.S. market channel has seen almost no new money this week — for this LINK move, don’t read a green candle as institutions aggressively loading up.
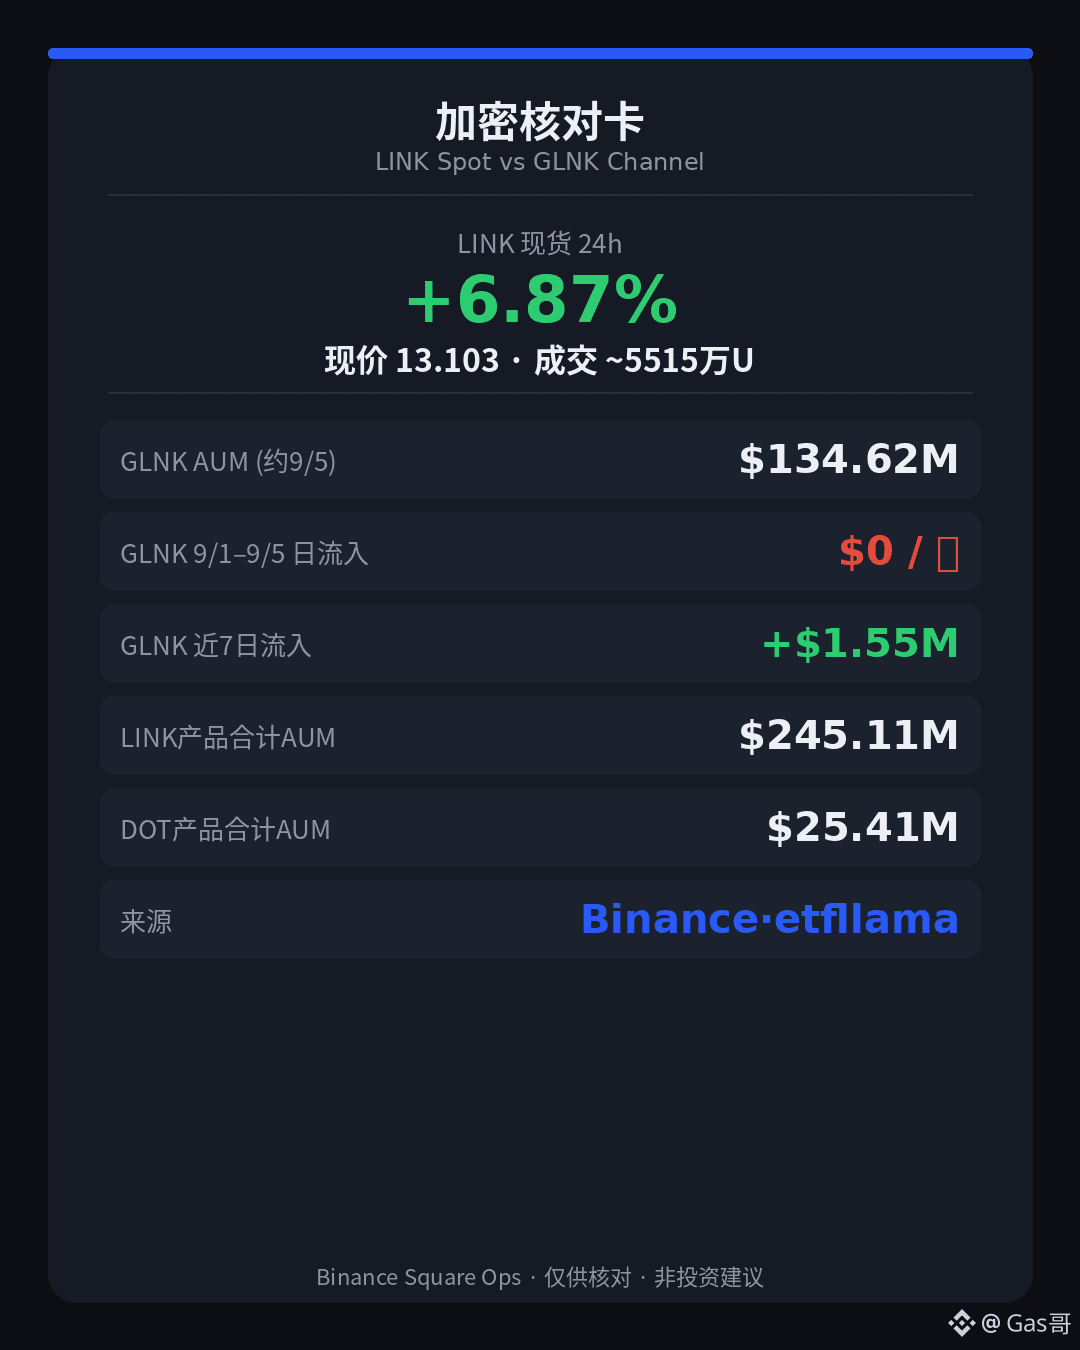
First, the main chart. $LINK is currently at 13.103, up about 6.87% over 24 hours, with turnover of roughly 55.15 million USDT. The trend-following line (SAR) is around 12.28, and price is about 0.82 above it — short-term strength still leans bullish. The momentum J value is 81.74 (K 80.03 / D 79.17), overheated, but slightly cooler than the previous round when it was pressing into the 90s. The 24-hour high is 13.356 and the low is 12.073; the recent two-day high is about 13.356, so the ceiling is right in front of us.
Two nearby comparisons: $DOT is currently 0.994, also up about 7.34% over 24 hours, sitting above the SAR line (around 0.952), with J at 74.44, still hot, and volume around 12.14 million — same direction of gains, but with a thinner market. $BTC is around 79942, nearly flat over 24 hours (-0.05%); although it is still above SAR (around 79517), its J value has fallen to about 42, so momentum has cooled first. Altcoins are surging while the broader market is resting — not the same story.
On the资金 side, according to publicly available ETF tracking data (etfllama, as of around Sept. 5): the Grayscale Chainlink Trust ETF (GLNK) has AUM of about $134.6 million, with zero daily net inflows from Sept. 1 to Sept. 5; net inflows over the past 7 days were about $1.55 million (mainly from the Aug. 29 entry), and over the past 30 days about +$12.19 million. Total AUM across global Chainlink-related ETFs/ETPs is roughly $245 million; using the same measure, Polkadot-related products total about $25.41 million — nearly an order of magnitude smaller. There is channel depth, but that does not mean this week’s spot rally is being carried by the channel.
Let time confirm the next candle; that is more useful than guessing the top.
First, the main chart. $LINK is currently at 13.103, up about 6.87% over 24 hours, with turnover of roughly 55.15 million USDT. The trend-following line (SAR) is around 12.28, and price is about 0.82 above it — short-term strength still leans bullish. The momentum J value is 81.74 (K 80.03 / D 79.17), overheated, but slightly cooler than the previous round when it was pressing into the 90s. The 24-hour high is 13.356 and the low is 12.073; the recent two-day high is about 13.356, so the ceiling is right in front of us.
Two nearby comparisons: $DOT is currently 0.994, also up about 7.34% over 24 hours, sitting above the SAR line (around 0.952), with J at 74.44, still hot, and volume around 12.14 million — same direction of gains, but with a thinner market. $BTC is around 79942, nearly flat over 24 hours (-0.05%); although it is still above SAR (around 79517), its J value has fallen to about 42, so momentum has cooled first. Altcoins are surging while the broader market is resting — not the same story.
On the资金 side, according to publicly available ETF tracking data (etfllama, as of around Sept. 5): the Grayscale Chainlink Trust ETF (GLNK) has AUM of about $134.6 million, with zero daily net inflows from Sept. 1 to Sept. 5; net inflows over the past 7 days were about $1.55 million (mainly from the Aug. 29 entry), and over the past 30 days about +$12.19 million. Total AUM across global Chainlink-related ETFs/ETPs is roughly $245 million; using the same measure, Polkadot-related products total about $25.41 million — nearly an order of magnitude smaller. There is channel depth, but that does not mean this week’s spot rally is being carried by the channel.
Let time confirm the next candle; that is more useful than guessing the top.
The same narrative of a spot ETF channel for U.S. equities: AVAX and LINK are separated by nearly an order of magnitude — both are in the green, but the thickness is not the same.
First, look at the main chart. $AVAX is currently at 7.924, up about 4.06% over 24 hours, with trading volume around 20.16 million USDT. The following line (SAR) is at 7.5868, and price is still above it by about 0.34 — short-term strength remains tilted bullish. The momentum J value is 98.94 (K 83.54 / D 75.84), which is already overheated, like the accelerator pressed through the floor, and price has just touched the near two-day high of about 7.962. 24-hour high: 7.962, low: 7.532.
Next, look at $LINK : current price 13.259, up about 9.34% over 24 hours, with even stronger volume (about 54 million USDT), and also above the following line (SAR around 12.24). The J value of 94.29 is likewise overheated. Both sides are green, both are above the line, and both have overheated momentum, but the capital pool is on a very different scale.
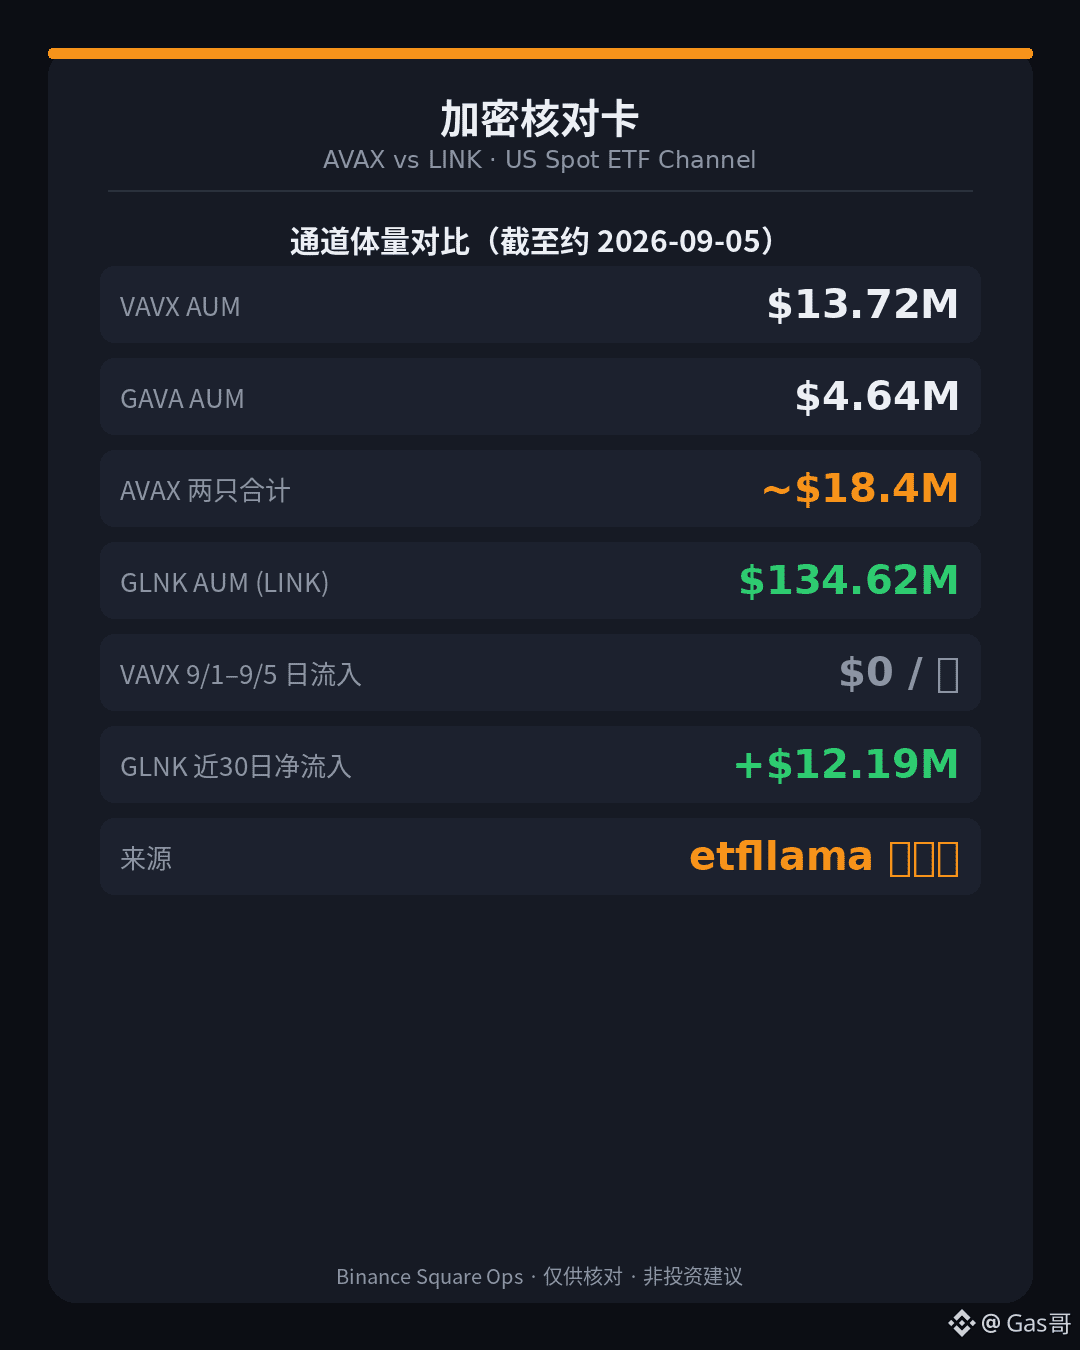
On the funding side, according to publicly tracked ETF data (as of around Sept. 5): VanEck Avalanche ETF (VAVX) has AUM of about $13.72 million, with daily net inflows of 0 from Sept. 1 to 5, and about $789,000 in net inflows over the past 30 days; Grayscale Avalanche Staking ETF (GAVA) has AUM of about $4.64 million, and about $180,000 in net outflows over the past 30 days. Combined, the two are roughly in the $18 million range. By contrast, Grayscale Chainlink Trust ETF (GLNK), using the same metric, has AUM of about $134.6 million and roughly $12.19 million in net inflows over the past 30 days — the channel size is more than an order of magnitude larger. In addition, according to an SEC 8-K: on Aug. 6, GAVA amended its trust agreement and began distributing staking net cash income to unit holders at a frequency of no less than quarterly — the rules are getting thicker, but the scale is still thin.
There is a lot of short-term noise; first filter out the narrative, then look at the positioning.
First, look at the main chart. $AVAX is currently at 7.924, up about 4.06% over 24 hours, with trading volume around 20.16 million USDT. The following line (SAR) is at 7.5868, and price is still above it by about 0.34 — short-term strength remains tilted bullish. The momentum J value is 98.94 (K 83.54 / D 75.84), which is already overheated, like the accelerator pressed through the floor, and price has just touched the near two-day high of about 7.962. 24-hour high: 7.962, low: 7.532.
Next, look at $LINK : current price 13.259, up about 9.34% over 24 hours, with even stronger volume (about 54 million USDT), and also above the following line (SAR around 12.24). The J value of 94.29 is likewise overheated. Both sides are green, both are above the line, and both have overheated momentum, but the capital pool is on a very different scale.
On the funding side, according to publicly tracked ETF data (as of around Sept. 5): VanEck Avalanche ETF (VAVX) has AUM of about $13.72 million, with daily net inflows of 0 from Sept. 1 to 5, and about $789,000 in net inflows over the past 30 days; Grayscale Avalanche Staking ETF (GAVA) has AUM of about $4.64 million, and about $180,000 in net outflows over the past 30 days. Combined, the two are roughly in the $18 million range. By contrast, Grayscale Chainlink Trust ETF (GLNK), using the same metric, has AUM of about $134.6 million and roughly $12.19 million in net inflows over the past 30 days — the channel size is more than an order of magnitude larger. In addition, according to an SEC 8-K: on Aug. 6, GAVA amended its trust agreement and began distributing staking net cash income to unit holders at a frequency of no less than quarterly — the rules are getting thicker, but the scale is still thin.
There is a lot of short-term noise; first filter out the narrative, then look at the positioning.
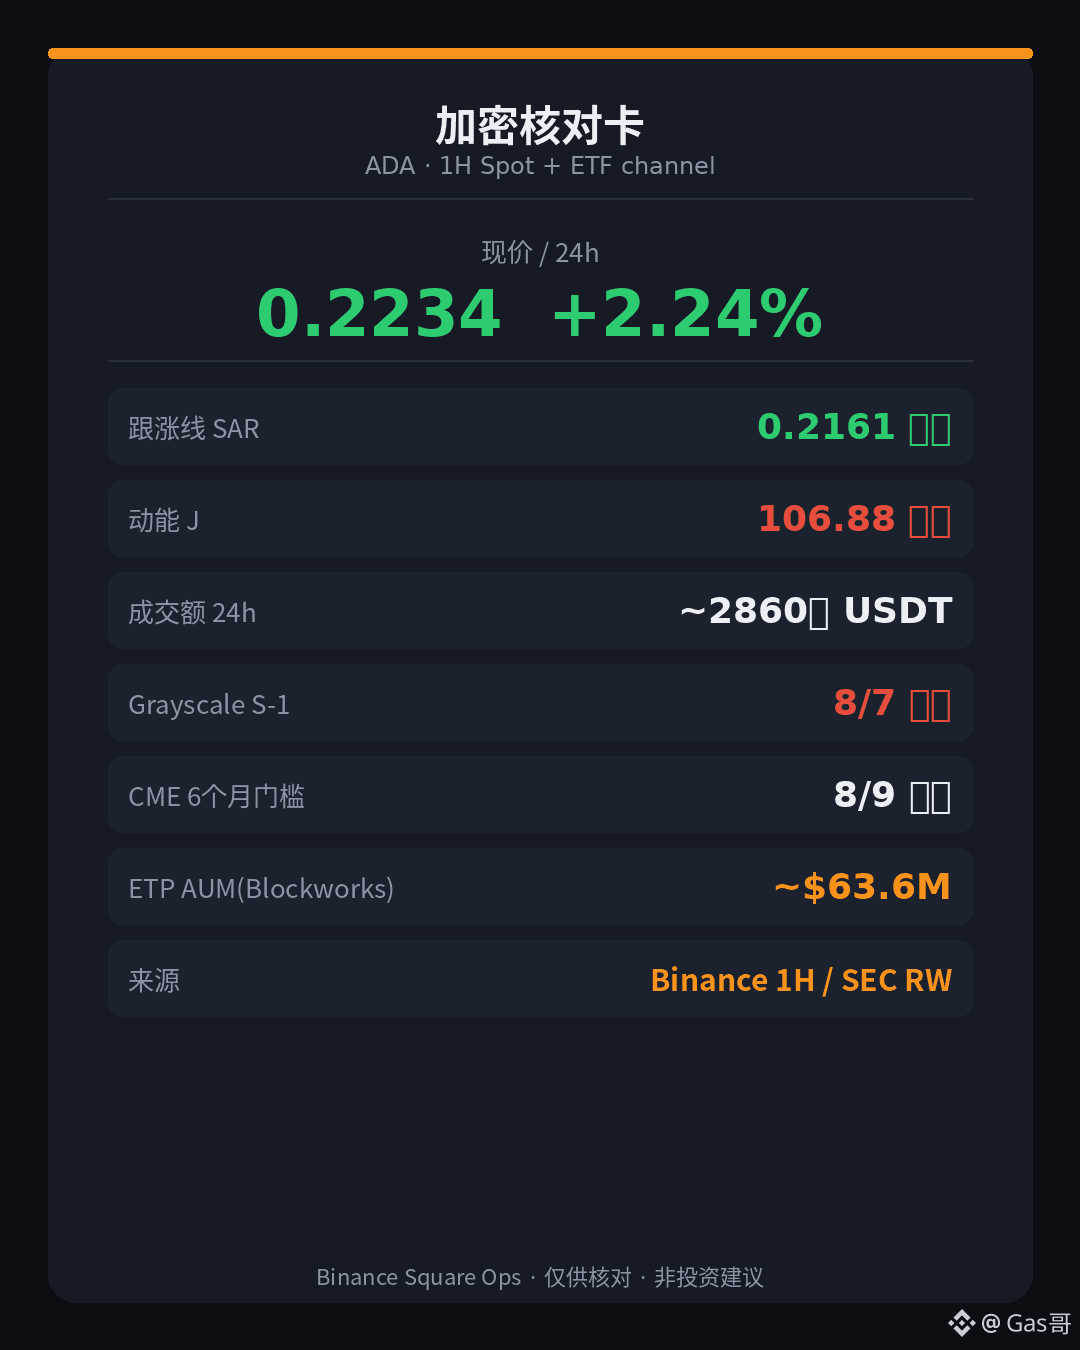
The chart has already turned green and moved above the follow-the-trend line, but the dedicated U.S. spot channel is still empty — this ADA rally is hot in price, not in the channel.
First, the chart. $ADA is currently at 0.2234, up about 2.24% over 24 hours, with trading volume around 28.6 million USDT. The follow-the-trend line (SAR) is at 0.2161, putting price about 0.0073 above it — a short-term bullish shift. The momentum J value is 106.88 (K 82.22 / D 69.89), which is overheated, like the gas pedal being floored, and price is now brushing against the past two days' high of about 0.2238. The 24-hour high is 0.2238 and the low is 0.2154.
The funding and regulatory side is more striking: according to an SEC public filing, Grayscale withdrew the Form S-1 registration for the Grayscale Cardano Trust ETF on August 7, 2026 (file number 333-289948), saying it no longer intended to issue shares under that registration; two days later, on August 9, ADA had just reached the six-month threshold for CME-regulated futures. The channel qualification had arrived, but the dedicated spot application was left empty first. Public reports citing Blockworks say that as of around September 4, Cardano-related ETF/ETP assets were about 63.6 million USD, up roughly 14.6 million USD over the past 30 days — there is scale, but nowhere near the level of U.S. spot BTC; another report said T. Rowe Price's active crypto ETF (TKNZ) has included ADA, with a weight of about 0.44% (roughly 72,500 USD, based on fund net assets of about 16.47 million USD), so the exposure is very thin.
There can be excitement, but position size is another matter.
First, the chart. $ADA is currently at 0.2234, up about 2.24% over 24 hours, with trading volume around 28.6 million USDT. The follow-the-trend line (SAR) is at 0.2161, putting price about 0.0073 above it — a short-term bullish shift. The momentum J value is 106.88 (K 82.22 / D 69.89), which is overheated, like the gas pedal being floored, and price is now brushing against the past two days' high of about 0.2238. The 24-hour high is 0.2238 and the low is 0.2154.
The funding and regulatory side is more striking: according to an SEC public filing, Grayscale withdrew the Form S-1 registration for the Grayscale Cardano Trust ETF on August 7, 2026 (file number 333-289948), saying it no longer intended to issue shares under that registration; two days later, on August 9, ADA had just reached the six-month threshold for CME-regulated futures. The channel qualification had arrived, but the dedicated spot application was left empty first. Public reports citing Blockworks say that as of around September 4, Cardano-related ETF/ETP assets were about 63.6 million USD, up roughly 14.6 million USD over the past 30 days — there is scale, but nowhere near the level of U.S. spot BTC; another report said T. Rowe Price's active crypto ETF (TKNZ) has included ADA, with a weight of about 0.44% (roughly 72,500 USD, based on fund net assets of about 16.47 million USD), so the exposure is very thin.
There can be excitement, but position size is another matter.
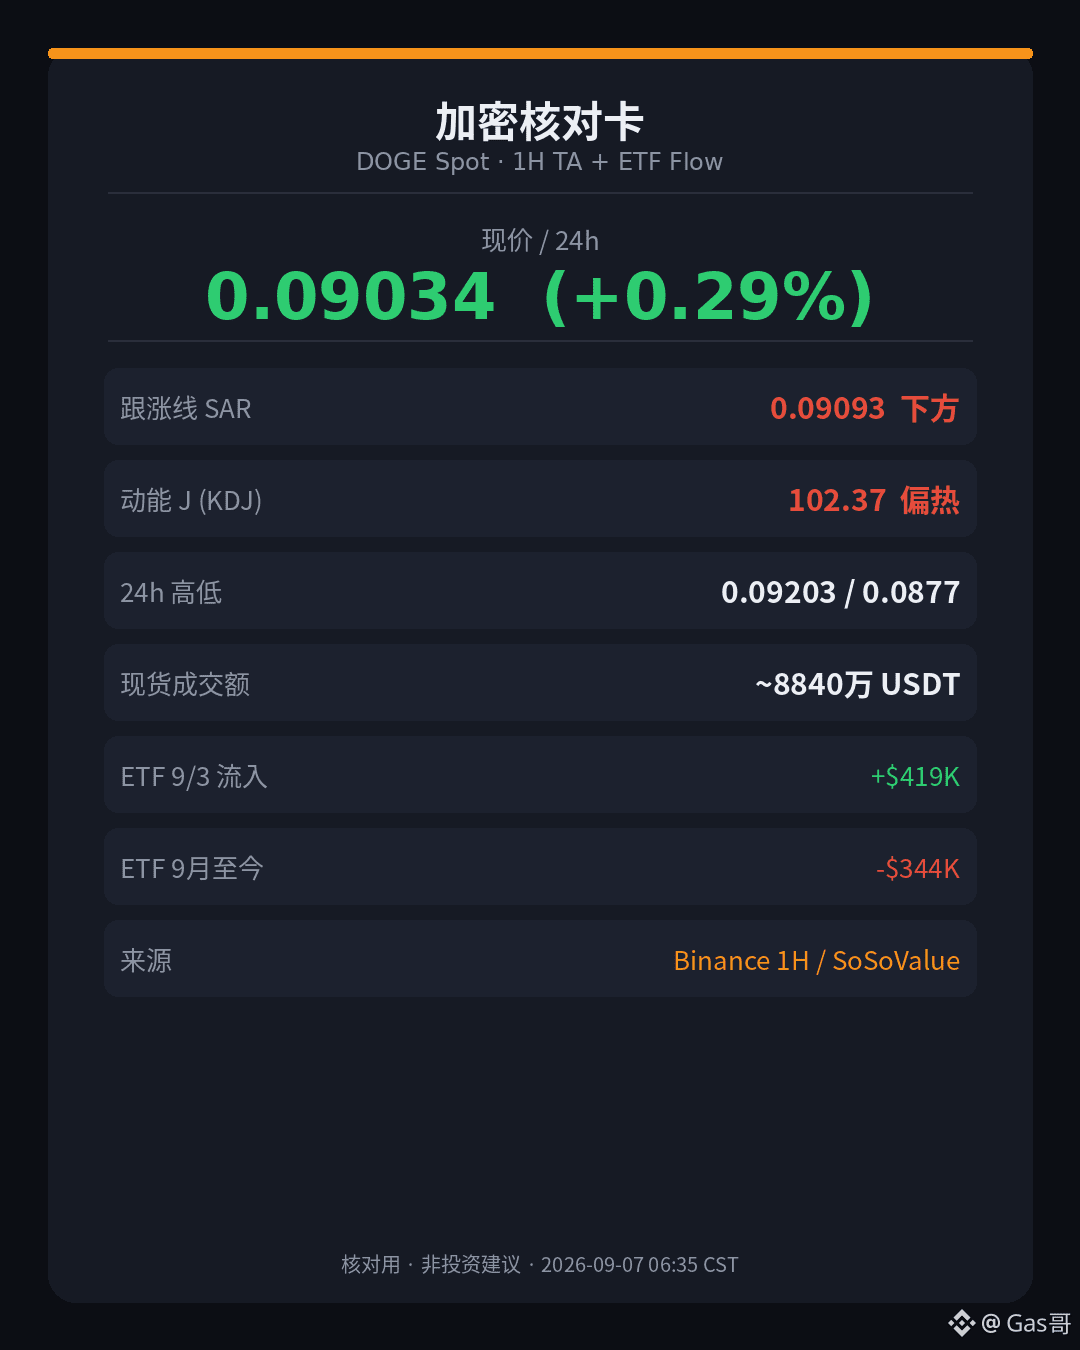
Binance spot can still trade over 80 million more in a single day, while the U.S. spot DOGE ETF is still seeing net outflows in September — the market can be hot, but that does not mean the institutional channel is hot too.
First, the main chart. $DOGE is currently priced at 0.09034, up about 0.29% over the past 24 hours, with trading volume around 88.4 million USDT. The trailing stop line (SAR) is at 0.09093, and the price is still below it by about 0.00059 — short-term support has not been reclaimed. Momentum J is 102.37 (K79.48/D68.03), already overheated, like the accelerator is floored while price only gives a slight green candle. The 24-hour high is 0.09203 and low is 0.0877; the two-day high is about 0.09515, so overhead resistance is still there.
A quick look at the same sector’s $WIF : current price 0.2153, up about 0.89% in 24 hours, and it is instead above the trailing stop line (SAR around 0.2090). Its J value of 85.24 is also overheated. Both meme coins are moving, but the structure is different: one is green but has broken support and is overheated; the other is green and still grinding above the line.
On the capital side, public reports citing SoSoValue show that the U.S. spot DOGE ETF recorded about $419,000 in net inflows on September 3, after a net outflow of about $763,000 on September 2, and net inflows of 0 on September 4; so far in September, it still has a cumulative net outflow of about $344,000. Since launch, cumulative net inflows are only around $12.09 million, and holdings are only about 0.09% of circulating supply. The channel exists, but the force is very thin.
In one sentence: the ETF channel has been established; "institutions are rushing into DOGE" is not.
First, the main chart. $DOGE is currently priced at 0.09034, up about 0.29% over the past 24 hours, with trading volume around 88.4 million USDT. The trailing stop line (SAR) is at 0.09093, and the price is still below it by about 0.00059 — short-term support has not been reclaimed. Momentum J is 102.37 (K79.48/D68.03), already overheated, like the accelerator is floored while price only gives a slight green candle. The 24-hour high is 0.09203 and low is 0.0877; the two-day high is about 0.09515, so overhead resistance is still there.
A quick look at the same sector’s $WIF : current price 0.2153, up about 0.89% in 24 hours, and it is instead above the trailing stop line (SAR around 0.2090). Its J value of 85.24 is also overheated. Both meme coins are moving, but the structure is different: one is green but has broken support and is overheated; the other is green and still grinding above the line.
On the capital side, public reports citing SoSoValue show that the U.S. spot DOGE ETF recorded about $419,000 in net inflows on September 3, after a net outflow of about $763,000 on September 2, and net inflows of 0 on September 4; so far in September, it still has a cumulative net outflow of about $344,000. Since launch, cumulative net inflows are only around $12.09 million, and holdings are only about 0.09% of circulating supply. The channel exists, but the force is very thin.
In one sentence: the ETF channel has been established; "institutions are rushing into DOGE" is not.
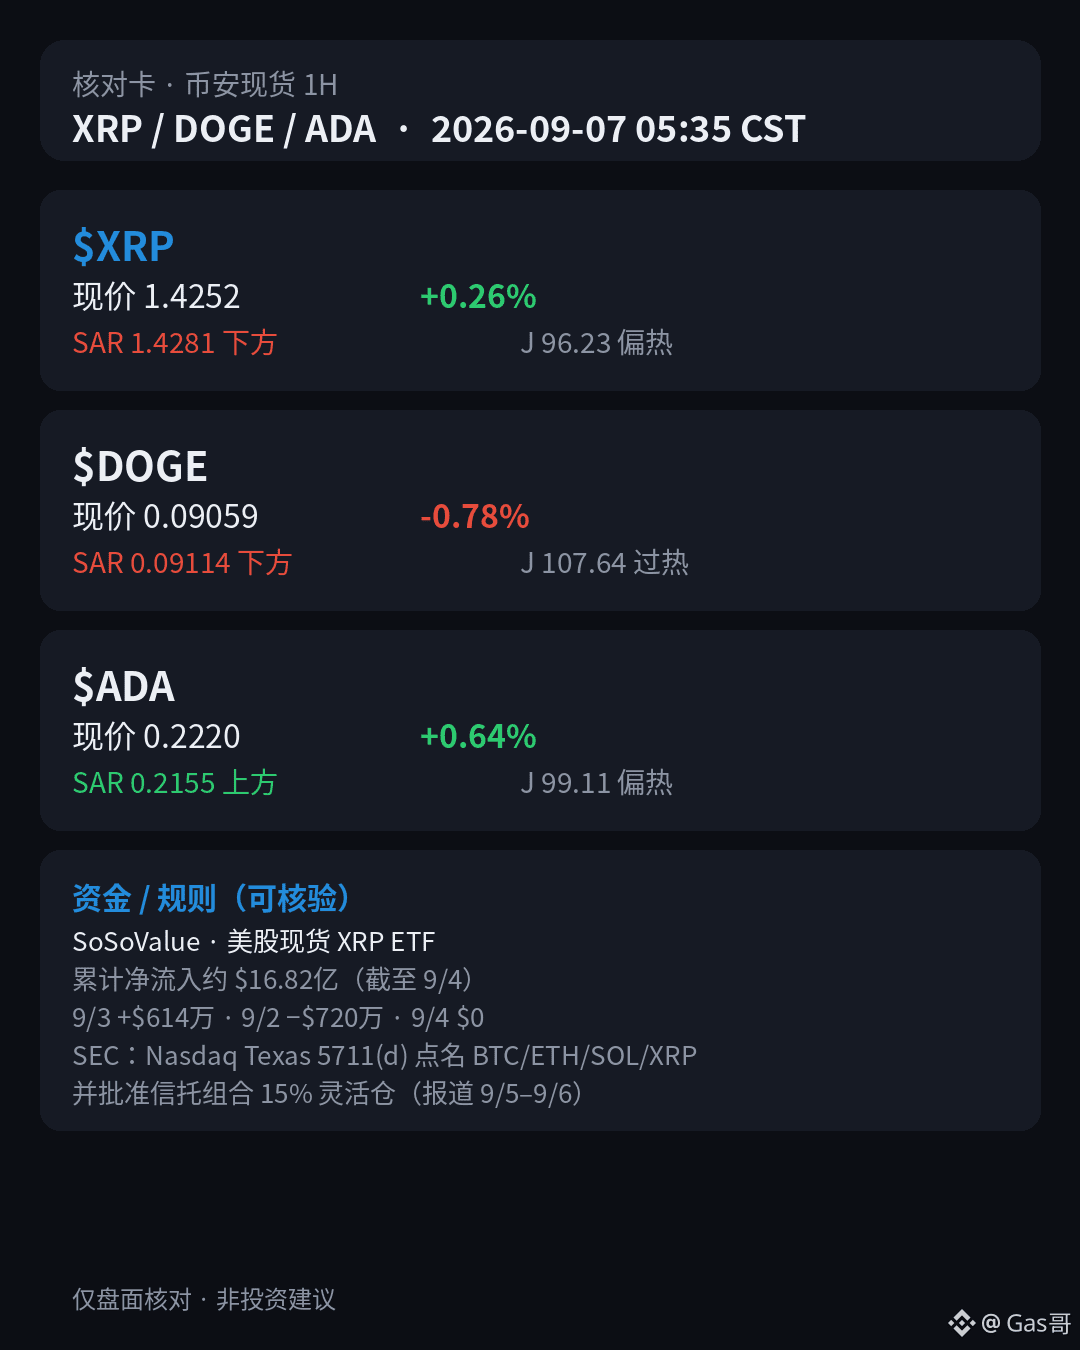
The rules have put XRP on the ETF whitelist, but the price is still grinding below the follow-trend line — the label is there, but the position hasn’t automatically followed.
Focus on $XRP . Current price is 1.4252, up only 0.26% over 24 hours, with trading volume of about $100 million. The follow-trend line (SAR) is at 1.4281, so price is about 0.003 below it — short-term strength hasn’t flipped bullish yet. The momentum J value is 96.23 (K 69.64 / D 56.35), already overheated, like the accelerator is pressed hard while price still hasn’t recovered its position. The 24-hour high is 1.4327, low is 1.398; the highs over the past two days have also been around 1.4327, so overhead resistance is right in front of the face.
The two nearby tickers show different structures. $DOGE is currently at 0.09059, down 0.78% over 24 hours, with trading also around $95 million; it has also fallen below the follow-trend line (SAR about 0.09114), while J has surged to 107.64, making the overheat even more obvious — the drop isn’t large, but the momentum is twisting. $ADA is currently at 0.222, up 0.64% over 24 hours, with trading volume around $29 million; it is still above the follow-trend line (SAR about 0.2155), and J around 99.11 is also overheated. All three tickers are in a “hot momentum” state, but only ADA’s structure remains on the bullish side.
On the capital and regulatory side: according to SoSoValue, cumulative net inflows into U.S.-listed spot XRP ETFs are about $1.682 billion (as of September 4); net inflow on September 3 was about $6.14 million, September 2 saw a net outflow of about $7.2 million, and September 4 was disclosed as zero. In addition, according to public reports, the SEC recently approved amendments related to Nasdaq Texas Rule 5711(d), listing BTC, ETH, SOL, and XRP as examples of digital assets currently meeting commodity trust listing standards, and allowing trust portfolios to keep up to 15% flexibility in allocation. Being regulation-friendly does not mean the spot price will immediately reclaim the follow-trend line — same direction does not mean same risk; don’t mix that up.
Focus on $XRP . Current price is 1.4252, up only 0.26% over 24 hours, with trading volume of about $100 million. The follow-trend line (SAR) is at 1.4281, so price is about 0.003 below it — short-term strength hasn’t flipped bullish yet. The momentum J value is 96.23 (K 69.64 / D 56.35), already overheated, like the accelerator is pressed hard while price still hasn’t recovered its position. The 24-hour high is 1.4327, low is 1.398; the highs over the past two days have also been around 1.4327, so overhead resistance is right in front of the face.
The two nearby tickers show different structures. $DOGE is currently at 0.09059, down 0.78% over 24 hours, with trading also around $95 million; it has also fallen below the follow-trend line (SAR about 0.09114), while J has surged to 107.64, making the overheat even more obvious — the drop isn’t large, but the momentum is twisting. $ADA is currently at 0.222, up 0.64% over 24 hours, with trading volume around $29 million; it is still above the follow-trend line (SAR about 0.2155), and J around 99.11 is also overheated. All three tickers are in a “hot momentum” state, but only ADA’s structure remains on the bullish side.
On the capital and regulatory side: according to SoSoValue, cumulative net inflows into U.S.-listed spot XRP ETFs are about $1.682 billion (as of September 4); net inflow on September 3 was about $6.14 million, September 2 saw a net outflow of about $7.2 million, and September 4 was disclosed as zero. In addition, according to public reports, the SEC recently approved amendments related to Nasdaq Texas Rule 5711(d), listing BTC, ETH, SOL, and XRP as examples of digital assets currently meeting commodity trust listing standards, and allowing trust portfolios to keep up to 15% flexibility in allocation. Being regulation-friendly does not mean the spot price will immediately reclaim the follow-trend line — same direction does not mean same risk; don’t mix that up.
The broader market capital is still revolving around the BTC spot ETF story, while BNB itself has already taken a step back — the channel is there, but that doesn’t mean the coin price will simply follow orders.
First, look at the market. $BNB is currently priced at 749.58, down about 2.96% over the past 24 hours, with trading volume around the $135 million range. The follow-trend line (SAR) is at 740.84, and the price is still above it, so the short-term trend hasn’t completely broken down; the J momentum value is about 59.98, neither hot nor cold, more like a digestion phase rather than the kind of all-out acceleration seen in the previous round. The 24-hour high reached 772.81, the low was 740.24, and now it is stuck in the middle.
Next, take a look at $SOL : the current price is 105.45, up about 1.92% over 24 hours, with even stronger turnover (about 274 million). But it has already fallen below the follow-trend line (SAR around 106.88), and the J value is only 12.09, leaning oversold — price is up, but the short-term support has broken. The two are both making noise, but the structure is not the same: one is in the red but has broken support, while the other is green but still grinding above the line.
On the capital side, according to public reports citing SoSoValue: as of the week of September 5, U.S. spot Bitcoin ETFs saw a weekly net inflow of about $987 million, bringing the total over the past three weeks to about $3.8 billion, one of the strongest three-week inflow stretches so far in 2026. Money is first pouring into the BTC channel, but that does not automatically mean BNB will absorb the same level of strength in sync. On the BNB side, the institutional channel (such as VanEck’s VBNB) already launched earlier, but in the short term the price is still correcting at its own pace.
So don’t directly translate “ETF narrative is hot” into “BNB should follow higher.” First see whether the follow-trend line can hold and whether volume can keep up; for SOL, watch whether the breakdown turns into continued weakness or whether the oversold condition leads to a rebound first.
First, look at the market. $BNB is currently priced at 749.58, down about 2.96% over the past 24 hours, with trading volume around the $135 million range. The follow-trend line (SAR) is at 740.84, and the price is still above it, so the short-term trend hasn’t completely broken down; the J momentum value is about 59.98, neither hot nor cold, more like a digestion phase rather than the kind of all-out acceleration seen in the previous round. The 24-hour high reached 772.81, the low was 740.24, and now it is stuck in the middle.
Next, take a look at $SOL : the current price is 105.45, up about 1.92% over 24 hours, with even stronger turnover (about 274 million). But it has already fallen below the follow-trend line (SAR around 106.88), and the J value is only 12.09, leaning oversold — price is up, but the short-term support has broken. The two are both making noise, but the structure is not the same: one is in the red but has broken support, while the other is green but still grinding above the line.
On the capital side, according to public reports citing SoSoValue: as of the week of September 5, U.S. spot Bitcoin ETFs saw a weekly net inflow of about $987 million, bringing the total over the past three weeks to about $3.8 billion, one of the strongest three-week inflow stretches so far in 2026. Money is first pouring into the BTC channel, but that does not automatically mean BNB will absorb the same level of strength in sync. On the BNB side, the institutional channel (such as VanEck’s VBNB) already launched earlier, but in the short term the price is still correcting at its own pace.
So don’t directly translate “ETF narrative is hot” into “BNB should follow higher.” First see whether the follow-trend line can hold and whether volume can keep up; for SOL, watch whether the breakdown turns into continued weakness or whether the oversold condition leads to a rebound first.
Log in to explore more content