
加密打工人
965 Posts

加密打工人
 Square Verified
Report
Block User
从 996 金融狗逃进 Web3 的中年危机选手
边带娃边挖链上 Alpha
每天喝咖啡看 K 线 吐槽政策
不喊单,只分享我自己会投的坑
真实人,真实亏,真实赚
合作 DM
Frequent Trader
8.4 Years
417 Following
11.2K+ Followers
1.0K+ Liked
Posts
All
Quotes
Live
·
--
$PENGU current price 0.007512
Watch the Pudgy Penguins line this afternoon 🐧
Project highlights
PENGU is the token of Pudgy Penguins, a top NFT brand on Solana. Backed by major offline toy distribution in the U.S. (including Walmart, Target, etc.), it’s one of the few Web3 consumer brands that has truly broken into the mainstream. The team has also launched Abstract, a consumer-grade L2, aiming to channel on-chain gaming and social traffic into the PENGU ecosystem.
Data snapshot
Down 1.78% in the past 24h. Current price: 0.007512. Trading volume: about 6.47 million USDT. Intraday range: 0.007287–0.00767. Volume has contracted and the price is consolidating; it hasn’t broken below the previous low yet.
Opportunity
Brand awareness plus physical retail is a moat other MEMEs don’t have. If Abstract mainnet continues to see user growth, PENGU will have narrative catalysts. Suitable for setting entries on pullbacks and waiting for sentiment to recover.
Risk warning
NFT and MEME assets are extremely volatile and are clearly affected by the broader market and Binance’s listing/Alpha schedule. Be sure to control position size—don’t chase.
$PENGU $SOL #币安Alpha #NFT #Altcoins
$PENGU current price 0.007512
Watch the Pudgy Penguins line this afternoon 🐧
Project highlights
PENGU is the token of Pudgy Penguins, a top NFT brand on Solana. Backed by major offline toy distribution in the U.S. (including Walmart, Target, etc.), it’s one of the few Web3 consumer brands that has truly broken into the mainstream. The team has also launched Abstract, a consumer-grade L2, aiming to channel on-chain gaming and social traffic into the PENGU ecosystem.
Data snapshot
Down 1.78% in the past 24h. Current price: 0.007512. Trading volume: about 6.47 million USDT. Intraday range: 0.007287–0.00767. Volume has contracted and the price is consolidating; it hasn’t broken below the previous low yet.
Opportunity
Brand awareness plus physical retail is a moat other MEMEs don’t have. If Abstract mainnet continues to see user growth, PENGU will have narrative catalysts. Suitable for setting entries on pullbacks and waiting for sentiment to recover.
Risk warning
NFT and MEME assets are extremely volatile and are clearly affected by the broader market and Binance’s listing/Alpha schedule. Be sure to control position size—don’t chase.
$PENGU $SOL #币安Alpha #NFT #Altcoins
Watch the Pudgy Penguins line this afternoon 🐧
Project highlights
PENGU is the token of Pudgy Penguins, a top NFT brand on Solana. Backed by major offline toy distribution in the U.S. (including Walmart, Target, etc.), it’s one of the few Web3 consumer brands that has truly broken into the mainstream. The team has also launched Abstract, a consumer-grade L2, aiming to channel on-chain gaming and social traffic into the PENGU ecosystem.
Data snapshot
Down 1.78% in the past 24h. Current price: 0.007512. Trading volume: about 6.47 million USDT. Intraday range: 0.007287–0.00767. Volume has contracted and the price is consolidating; it hasn’t broken below the previous low yet.
Opportunity
Brand awareness plus physical retail is a moat other MEMEs don’t have. If Abstract mainnet continues to see user growth, PENGU will have narrative catalysts. Suitable for setting entries on pullbacks and waiting for sentiment to recover.
Risk warning
NFT and MEME assets are extremely volatile and are clearly affected by the broader market and Binance’s listing/Alpha schedule. Be sure to control position size—don’t chase.
$PENGU $SOL #币安Alpha #NFT #Altcoins


125
·
--
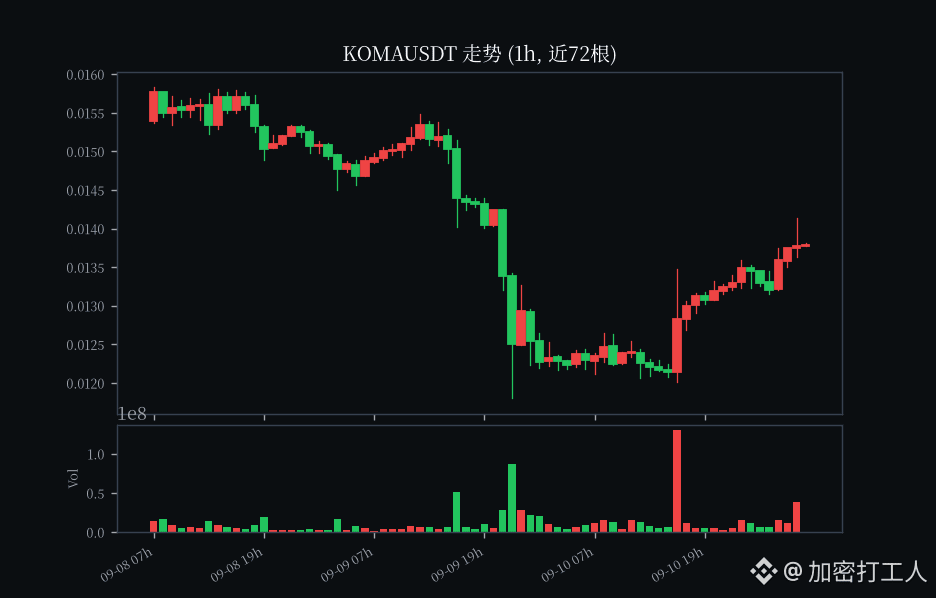
$KOMA current price $0.0138
Up 11% in a day—looks pretty wild, huh? 😏 Don’t get shaken around
This week, it’s actually only up 2%. It fell 27% from the previous high of 0.019
Just a weak rebound—volume didn’t keep up either (only 4.8 million in 24h)
No fundamentals to support the meme run; I’ll short it first 💀
$KOMA current price $0.0138
Up 11% in a day—looks pretty wild, huh? 😏 Don’t get shaken around
This week, it’s actually only up 2%. It fell 27% from the previous high of 0.019
Just a weak rebound—volume didn’t keep up either (only 4.8 million in 24h)
No fundamentals to support the meme run; I’ll short it first 💀
Up 11% in a day—looks pretty wild, huh? 😏 Don’t get shaken around
This week, it’s actually only up 2%. It fell 27% from the previous high of 0.019
Just a weak rebound—volume didn’t keep up either (only 4.8 million in 24h)
No fundamentals to support the meme run; I’ll short it first 💀
148
·
--
$AAPLB current price 325.6
Today is up slightly by 2.67%. The price spent the day ranging between 316 and 326, consolidating. Volume is still decent.
To be honest, I’ve always been quite comfortable holding Apple. What makes me feel most secure is the services business—things like the App Store, iCloud, and Apple Music. They don’t look flashy, but every year they keep moving upward. It’s real cash-flow.
The iPhone upgrade cycle is also coming soon. A lot of people around me have been using the same device for two or three years. Demand will eventually surface.
The 4H chart looks like it’s trying to probe higher. It’s not too far from the previous high.
What do you all think of this stock? Quick reminder as well: U.S. stock market volatility is high, so keep your position size in check.
$AAPLB $MSFTB $QQQB #美股 #bStocks #Technology stocks
$AAPLB current price 325.6
Today is up slightly by 2.67%. The price spent the day ranging between 316 and 326, consolidating. Volume is still decent.
To be honest, I’ve always been quite comfortable holding Apple. What makes me feel most secure is the services business—things like the App Store, iCloud, and Apple Music. They don’t look flashy, but every year they keep moving upward. It’s real cash-flow.
The iPhone upgrade cycle is also coming soon. A lot of people around me have been using the same device for two or three years. Demand will eventually surface.
The 4H chart looks like it’s trying to probe higher. It’s not too far from the previous high.
What do you all think of this stock? Quick reminder as well: U.S. stock market volatility is high, so keep your position size in check.
$AAPLB $MSFTB $QQQB #美股 #bStocks #Technology stocks
Today is up slightly by 2.67%. The price spent the day ranging between 316 and 326, consolidating. Volume is still decent.
To be honest, I’ve always been quite comfortable holding Apple. What makes me feel most secure is the services business—things like the App Store, iCloud, and Apple Music. They don’t look flashy, but every year they keep moving upward. It’s real cash-flow.
The iPhone upgrade cycle is also coming soon. A lot of people around me have been using the same device for two or three years. Demand will eventually surface.
The 4H chart looks like it’s trying to probe higher. It’s not too far from the previous high.
What do you all think of this stock? Quick reminder as well: U.S. stock market volatility is high, so keep your position size in check.
$AAPLB $MSFTB $QQQB #美股 #bStocks #Technology stocks


265
·
--
$ASTER current price 0.7
Binance Alpha board is a bit dull today. ASTER is down slightly by 2.64% over 24h. It’s quoted at 0.7, trading in a narrow range of 0.691–0.73 all day, with volume around $9.62 million. Buying interest isn’t that strong.
Looking at both the 1h and 4h charts, it’s consolidating sideways overall, and I haven’t seen a clear direction yet. In the short term, it seems more like it’s waiting for news. The board’s momentum is rather cold—at a time like this, chasing higher isn’t as good as waiting for a pullback.
Today, which Alpha coin are you more bullish on? Let’s chat in the comments👇
Risk notice: The Alpha board can be volatile and has thin liquidity. The above is just market commentary, not investment advice. Please manage your position size.
$ASTER $SOL $BNB #币安Alpha #刷分 #Altcoin
$ASTER current price 0.7
Binance Alpha board is a bit dull today. ASTER is down slightly by 2.64% over 24h. It’s quoted at 0.7, trading in a narrow range of 0.691–0.73 all day, with volume around $9.62 million. Buying interest isn’t that strong.
Looking at both the 1h and 4h charts, it’s consolidating sideways overall, and I haven’t seen a clear direction yet. In the short term, it seems more like it’s waiting for news. The board’s momentum is rather cold—at a time like this, chasing higher isn’t as good as waiting for a pullback.
Today, which Alpha coin are you more bullish on? Let’s chat in the comments👇
Risk notice: The Alpha board can be volatile and has thin liquidity. The above is just market commentary, not investment advice. Please manage your position size.
$ASTER $SOL $BNB #币安Alpha #刷分 #Altcoin
Binance Alpha board is a bit dull today. ASTER is down slightly by 2.64% over 24h. It’s quoted at 0.7, trading in a narrow range of 0.691–0.73 all day, with volume around $9.62 million. Buying interest isn’t that strong.
Looking at both the 1h and 4h charts, it’s consolidating sideways overall, and I haven’t seen a clear direction yet. In the short term, it seems more like it’s waiting for news. The board’s momentum is rather cold—at a time like this, chasing higher isn’t as good as waiting for a pullback.
Today, which Alpha coin are you more bullish on? Let’s chat in the comments👇
Risk notice: The Alpha board can be volatile and has thin liquidity. The above is just market commentary, not investment advice. Please manage your position size.
$ASTER $SOL $BNB #币安Alpha #刷分 #Altcoin


554
·
--
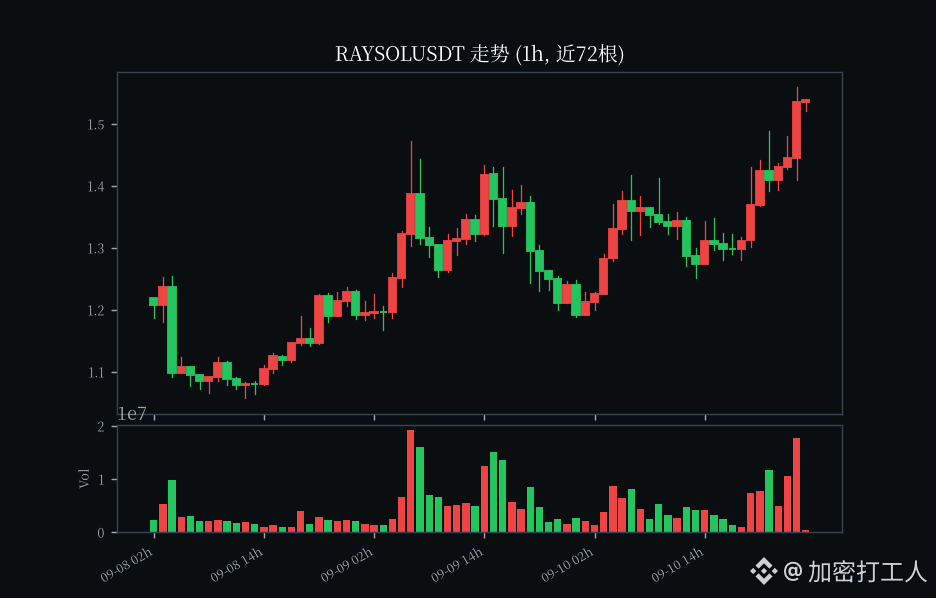
$RAYSOL current price $1.52
In one week it went from 0.80 to 1.55—almost a 2x move 😏 It then surged another 28% in 24h. Today it pushed up to 1.5588 with a massive upper wick; right after that, volume shrank to 340k. Profit-takers didn’t stay—after all, they ran. The funding rate is still negative at -0.036%. Even the shorts are betting it’s near the end. Public unlock data is limited, but at this point I directly went short $RAYSOL—short first in respect 🔥
$RAYSOL current price $1.52
In one week it went from 0.80 to 1.55—almost a 2x move 😏 It then surged another 28% in 24h. Today it pushed up to 1.5588 with a massive upper wick; right after that, volume shrank to 340k. Profit-takers didn’t stay—after all, they ran. The funding rate is still negative at -0.036%. Even the shorts are betting it’s near the end. Public unlock data is limited, but at this point I directly went short $RAYSOL —short first in respect 🔥
In one week it went from 0.80 to 1.55—almost a 2x move 😏 It then surged another 28% in 24h. Today it pushed up to 1.5588 with a massive upper wick; right after that, volume shrank to 340k. Profit-takers didn’t stay—after all, they ran. The funding rate is still negative at -0.036%. Even the shorts are betting it’s near the end. Public unlock data is limited, but at this point I directly went short $RAYSOL —short first in respect 🔥
551
·
--
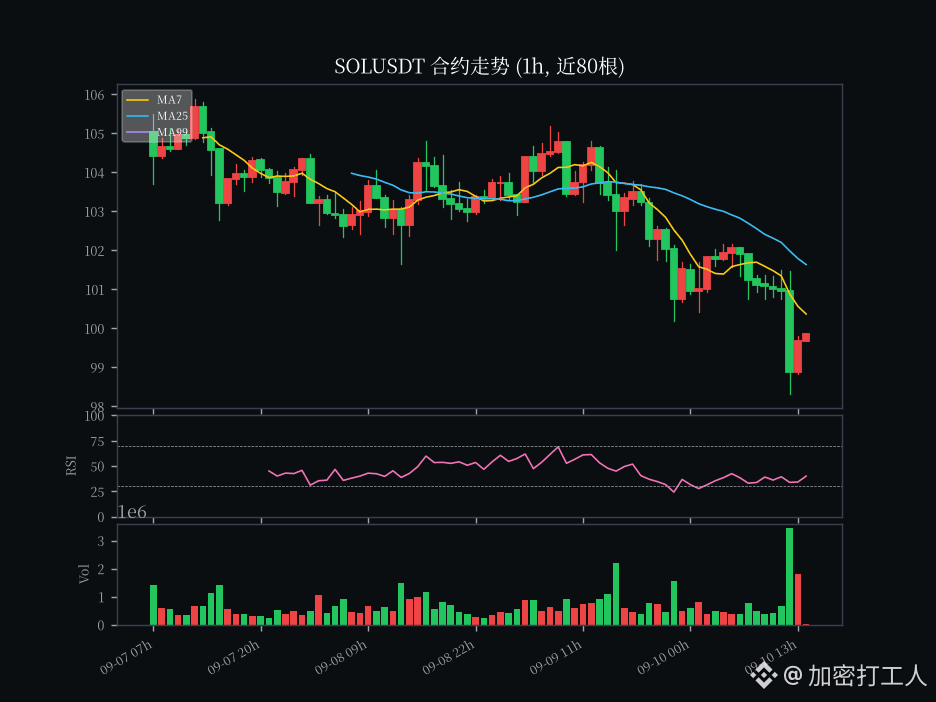
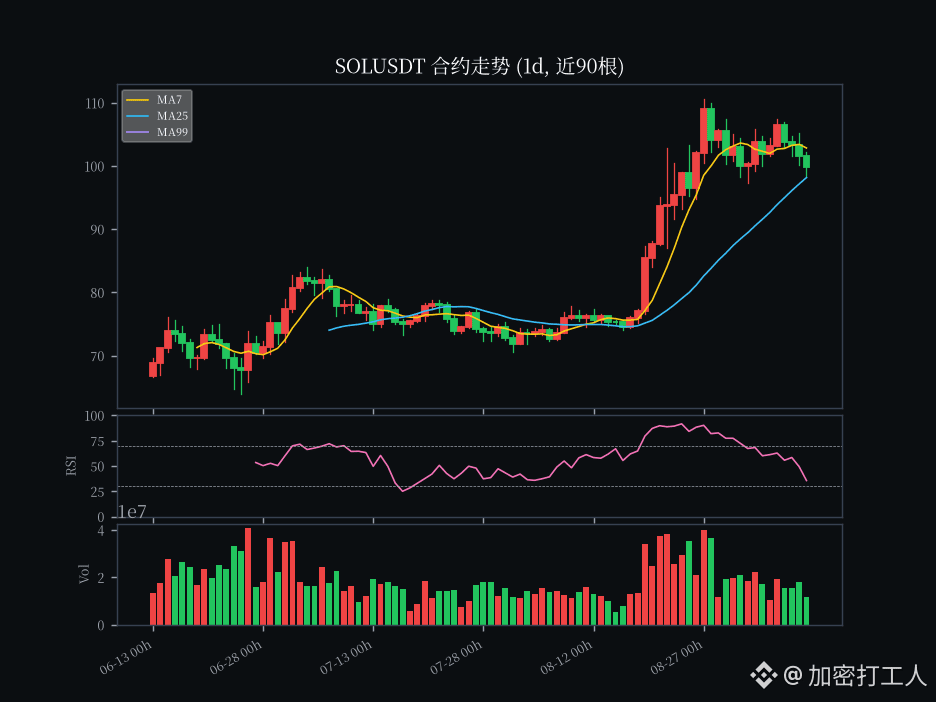
$SOL Current price 99.84, 24h -3.75%, trading volume about 2.05 billion USDT (24h perpetual quote, about 20.23 million SOL; spot quote about 250 million); 24h high 104.13 / low 98.33.
In the piece I wrote on 09-07, I said it was a "healthy pullback after a sharp spike near 105, with longs proactively de-leveraging." But today that momentum didn’t get picked up—it directly broke through 105. From 104.13 drifting down to the low 98.33, it closed at 99.84, down 3.75% in 24h. That’s weaker than Bitcoin (-1.37%) and Ether (-2.2%), making it the worst among the mainstream tonight. Volume of 2.05 billion is close to two-tenths more than the 1.75 billion on 09-07; it’s a "breakdown on volume," not a low-volume shakeout.
Relative strength is completely extinguished: SOL/BTC is -1.52% today, and it has been weak for two straight days. Funds now recognize Bitcoin and don’t recognize SOL.
📊 Technicals
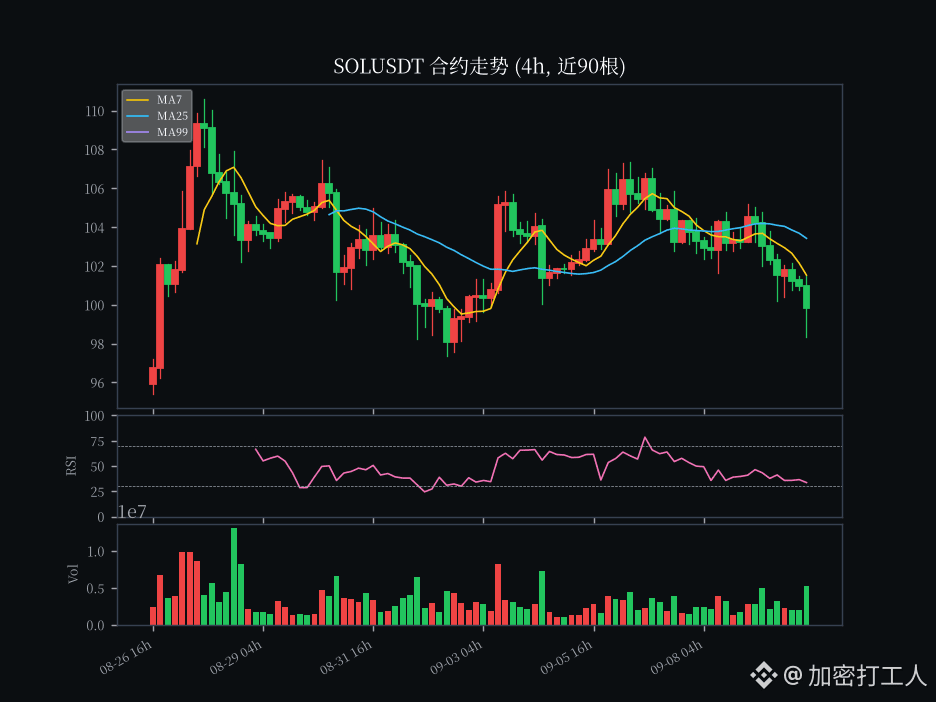
A downward setup across three timeframes: daily loss of MA7, 4h momentum turning bearish, and 1h double over-sold. The 1h close is 99.8—pressured by MA7 (100.36), MA25 (101.63), and MA50 (102.68). RSI is 35.25 entering oversold. MACD histogram is -0.156 (dif -0.823, compressing dea -0.667), with green bars widening. The 4h close is 99.8—MA7 (101.52), MA25 (103.42), and MA50 (102.95) all capped, acting as resistance on top. RSI is 34.09 oversold. MACD histogram -0.405, flipping bearish and turning downward. The 1d close is 99.82—breaking below MA7 (102.84), a short-lived gate, with MA25 (98.16) above it like a ceiling; RSI cools to 55.33. MACD histogram is -1.095 (dif 4.57, dea 5.67), turning fully green—110.6-day volume-spike needle and now daily momentum has fully flipped negative.
The mid-term structure hasn’t collapsed: the daily MA50 (86.37) is far below your feet, and the 70→110 primary breakout line hasn’t been broken. As long as 98.16 (daily MA25) holds, this is just a "pullback in the middle," not a full reversal.
Key levels: 98.33 (today’s low) is the first line below. If that’s lost, it goes straight to 98.16 (the real daily MA25 lifeline). A further break of 95 (prior consolidation) / 87 (1d near the 20-day low) would be where things get ugly in the medium term. On top, resistance sits at 100.36 (1h MA7) / 101.63 (1h MA25). Only after reclaiming 102.84 (1d MA7) can you really talk about a stop to the selloff; 104.13 (today’s high) is the real short-term ceiling.
💧 Derivatives & sentiment
Funding rate -1.661e-05 (8h, dailyized about -0.005%): it continues to stay negative. Shorts are paying the premium, while leverage is actively cooling down. Open interest is 8,051,578 SOL (about 804 million USDT), slightly higher than 09-07. Price is falling and OI isn’t dropping—longs are hard-carrying with unrealized losses, and the liquidation-trigger chain is tighter than it was back then. Net long squeeze: global long/short ratio 2.2819 (longs 69.53%), more crowded than 09-07’s 1.97. The "top trader" count for tonight’s interface 404 isn’t included in the dataset. Taker buy/sell ratio is 0.93—there’s more主动 selling pressure than buying (buy 8.59m / sell 9.24m), so flow is slightly bearish. Fear&Greed is 69 (greed), easing down from about 74 over the past week to 69.
📰 News / catalysts
The news/search channels aren’t giving precise TVL/active address values, so they’re not written in (not available in exact form). Using CoinGecko’s SOL market cap of about 58.5 billion and total market turnover about 3.5 billion for 24h—the order of magnitude matches. There’s no SOL-specific "bomb" on the chart; the move from 104 to 98 looks more like the trend pullback after the 110.6 top + relative-strength fade + Bitcoin breaking below 78k dragging the system, rather than a single-point negative catalyst. Tomorrow (9/11) US August CPI is the biggest variable; volatility will likely be amplified.
👉 My view
Read it as: the pullback from the 105 level (as of 09-07) has evolved into a formal step-down with daily MA25 (98-100). It differs from that "healthy pullback" narrative—now it’s a volume-backed breakdown, not de-leveraging.
99.84 losing the 1d MA7, with 4h/1h fully oversold, and the daily MACD histogram of -1.095 turning negative—so short-selling is "real." But I’m not chasing shorts to kill the drop. Because daily MA25 (98.16) hasn’t broken, daily MA50 (86.37) is far away, and this is a slow retreat rather than a collapse. In the 98-100 area, technical dead-cat bounces are possible. If you have positions, keep a stop-loss below 98.33. If it breaks and confirms short weakness, withdraw first—global longs at 69.53% are crowded net long; if 98 falls, those leveraged longs become liquidation trigger material.
If you don’t have positions, don’t short 99. Wait for two signals: (1) reclaim 101.63 (1h MA25) with volume and it doesn’t turn back; (2) 1h MACD flips red confirming stabilization; or alternatively (3) pull back to 98.16 without breaking it, then consider a light entry.
For the medium term, the structure (daily long posture, MA50 at 86 at the floor) isn’t broken, but with the 110.6 double top and consecutive green daily candles, we should treat this first as a "98-100 defense battle." No rushing—keep position size small, and wait for CPI to land and the daily chart to turn red before confirming that the uptrend is back.
Risk warning: SOL’s volatility and leverage density are far higher than Bitcoin’s and Ether’s; downside needle moves and liquidity risks are greater. With global 69% net long crowded, once 98 breaks it can trigger a chain liquidation. The funding rate/OI/long-short ratio are only the current snapshot. CPI tomorrow will amplify volatility.
For reference only; not investment advice.
$SOL $BTC $ETH #SOL #行情分析 #合约 #Alt-season
$SOL Current price 99.84, 24h -3.75%, trading volume about 2.05 billion USDT (24h perpetual quote, about 20.23 million SOL; spot quote about 250 million); 24h high 104.13 / low 98.33.
In the piece I wrote on 09-07, I said it was a "healthy pullback after a sharp spike near 105, with longs proactively de-leveraging." But today that momentum didn’t get picked up—it directly broke through 105. From 104.13 drifting down to the low 98.33, it closed at 99.84, down 3.75% in 24h. That’s weaker than Bitcoin (-1.37%) and Ether (-2.2%), making it the worst among the mainstream tonight. Volume of 2.05 billion is close to two-tenths more than the 1.75 billion on 09-07; it’s a "breakdown on volume," not a low-volume shakeout.
Relative strength is completely extinguished: SOL/BTC is -1.52% today, and it has been weak for two straight days. Funds now recognize Bitcoin and don’t recognize SOL.
📊 Technicals
A downward setup across three timeframes: daily loss of MA7, 4h momentum turning bearish, and 1h double over-sold. The 1h close is 99.8—pressured by MA7 (100.36), MA25 (101.63), and MA50 (102.68). RSI is 35.25 entering oversold. MACD histogram is -0.156 (dif -0.823, compressing dea -0.667), with green bars widening. The 4h close is 99.8—MA7 (101.52), MA25 (103.42), and MA50 (102.95) all capped, acting as resistance on top. RSI is 34.09 oversold. MACD histogram -0.405, flipping bearish and turning downward. The 1d close is 99.82—breaking below MA7 (102.84), a short-lived gate, with MA25 (98.16) above it like a ceiling; RSI cools to 55.33. MACD histogram is -1.095 (dif 4.57, dea 5.67), turning fully green—110.6-day volume-spike needle and now daily momentum has fully flipped negative.
The mid-term structure hasn’t collapsed: the daily MA50 (86.37) is far below your feet, and the 70→110 primary breakout line hasn’t been broken. As long as 98.16 (daily MA25) holds, this is just a "pullback in the middle," not a full reversal.
Key levels: 98.33 (today’s low) is the first line below. If that’s lost, it goes straight to 98.16 (the real daily MA25 lifeline). A further break of 95 (prior consolidation) / 87 (1d near the 20-day low) would be where things get ugly in the medium term. On top, resistance sits at 100.36 (1h MA7) / 101.63 (1h MA25). Only after reclaiming 102.84 (1d MA7) can you really talk about a stop to the selloff; 104.13 (today’s high) is the real short-term ceiling.
💧 Derivatives & sentiment
Funding rate -1.661e-05 (8h, dailyized about -0.005%): it continues to stay negative. Shorts are paying the premium, while leverage is actively cooling down. Open interest is 8,051,578 SOL (about 804 million USDT), slightly higher than 09-07. Price is falling and OI isn’t dropping—longs are hard-carrying with unrealized losses, and the liquidation-trigger chain is tighter than it was back then. Net long squeeze: global long/short ratio 2.2819 (longs 69.53%), more crowded than 09-07’s 1.97. The "top trader" count for tonight’s interface 404 isn’t included in the dataset. Taker buy/sell ratio is 0.93—there’s more主动 selling pressure than buying (buy 8.59m / sell 9.24m), so flow is slightly bearish. Fear&Greed is 69 (greed), easing down from about 74 over the past week to 69.
📰 News / catalysts
The news/search channels aren’t giving precise TVL/active address values, so they’re not written in (not available in exact form). Using CoinGecko’s SOL market cap of about 58.5 billion and total market turnover about 3.5 billion for 24h—the order of magnitude matches. There’s no SOL-specific "bomb" on the chart; the move from 104 to 98 looks more like the trend pullback after the 110.6 top + relative-strength fade + Bitcoin breaking below 78k dragging the system, rather than a single-point negative catalyst. Tomorrow (9/11) US August CPI is the biggest variable; volatility will likely be amplified.
👉 My view
Read it as: the pullback from the 105 level (as of 09-07) has evolved into a formal step-down with daily MA25 (98-100). It differs from that "healthy pullback" narrative—now it’s a volume-backed breakdown, not de-leveraging.
99.84 losing the 1d MA7, with 4h/1h fully oversold, and the daily MACD histogram of -1.095 turning negative—so short-selling is "real." But I’m not chasing shorts to kill the drop. Because daily MA25 (98.16) hasn’t broken, daily MA50 (86.37) is far away, and this is a slow retreat rather than a collapse. In the 98-100 area, technical dead-cat bounces are possible. If you have positions, keep a stop-loss below 98.33. If it breaks and confirms short weakness, withdraw first—global longs at 69.53% are crowded net long; if 98 falls, those leveraged longs become liquidation trigger material.
If you don’t have positions, don’t short 99. Wait for two signals: (1) reclaim 101.63 (1h MA25) with volume and it doesn’t turn back; (2) 1h MACD flips red confirming stabilization; or alternatively (3) pull back to 98.16 without breaking it, then consider a light entry.
For the medium term, the structure (daily long posture, MA50 at 86 at the floor) isn’t broken, but with the 110.6 double top and consecutive green daily candles, we should treat this first as a "98-100 defense battle." No rushing—keep position size small, and wait for CPI to land and the daily chart to turn red before confirming that the uptrend is back.
Risk warning: SOL’s volatility and leverage density are far higher than Bitcoin’s and Ether’s; downside needle moves and liquidity risks are greater. With global 69% net long crowded, once 98 breaks it can trigger a chain liquidation. The funding rate/OI/long-short ratio are only the current snapshot. CPI tomorrow will amplify volatility.
For reference only; not investment advice.
$SOL $BTC $ETH #SOL #行情分析 #合约 #Alt-season
In the piece I wrote on 09-07, I said it was a "healthy pullback after a sharp spike near 105, with longs proactively de-leveraging." But today that momentum didn’t get picked up—it directly broke through 105. From 104.13 drifting down to the low 98.33, it closed at 99.84, down 3.75% in 24h. That’s weaker than Bitcoin (-1.37%) and Ether (-2.2%), making it the worst among the mainstream tonight. Volume of 2.05 billion is close to two-tenths more than the 1.75 billion on 09-07; it’s a "breakdown on volume," not a low-volume shakeout.
Relative strength is completely extinguished: SOL/BTC is -1.52% today, and it has been weak for two straight days. Funds now recognize Bitcoin and don’t recognize SOL.
📊 Technicals
A downward setup across three timeframes: daily loss of MA7, 4h momentum turning bearish, and 1h double over-sold. The 1h close is 99.8—pressured by MA7 (100.36), MA25 (101.63), and MA50 (102.68). RSI is 35.25 entering oversold. MACD histogram is -0.156 (dif -0.823, compressing dea -0.667), with green bars widening. The 4h close is 99.8—MA7 (101.52), MA25 (103.42), and MA50 (102.95) all capped, acting as resistance on top. RSI is 34.09 oversold. MACD histogram -0.405, flipping bearish and turning downward. The 1d close is 99.82—breaking below MA7 (102.84), a short-lived gate, with MA25 (98.16) above it like a ceiling; RSI cools to 55.33. MACD histogram is -1.095 (dif 4.57, dea 5.67), turning fully green—110.6-day volume-spike needle and now daily momentum has fully flipped negative.
The mid-term structure hasn’t collapsed: the daily MA50 (86.37) is far below your feet, and the 70→110 primary breakout line hasn’t been broken. As long as 98.16 (daily MA25) holds, this is just a "pullback in the middle," not a full reversal.
Key levels: 98.33 (today’s low) is the first line below. If that’s lost, it goes straight to 98.16 (the real daily MA25 lifeline). A further break of 95 (prior consolidation) / 87 (1d near the 20-day low) would be where things get ugly in the medium term. On top, resistance sits at 100.36 (1h MA7) / 101.63 (1h MA25). Only after reclaiming 102.84 (1d MA7) can you really talk about a stop to the selloff; 104.13 (today’s high) is the real short-term ceiling.
💧 Derivatives & sentiment
Funding rate -1.661e-05 (8h, dailyized about -0.005%): it continues to stay negative. Shorts are paying the premium, while leverage is actively cooling down. Open interest is 8,051,578 SOL (about 804 million USDT), slightly higher than 09-07. Price is falling and OI isn’t dropping—longs are hard-carrying with unrealized losses, and the liquidation-trigger chain is tighter than it was back then. Net long squeeze: global long/short ratio 2.2819 (longs 69.53%), more crowded than 09-07’s 1.97. The "top trader" count for tonight’s interface 404 isn’t included in the dataset. Taker buy/sell ratio is 0.93—there’s more主动 selling pressure than buying (buy 8.59m / sell 9.24m), so flow is slightly bearish. Fear&Greed is 69 (greed), easing down from about 74 over the past week to 69.
📰 News / catalysts
The news/search channels aren’t giving precise TVL/active address values, so they’re not written in (not available in exact form). Using CoinGecko’s SOL market cap of about 58.5 billion and total market turnover about 3.5 billion for 24h—the order of magnitude matches. There’s no SOL-specific "bomb" on the chart; the move from 104 to 98 looks more like the trend pullback after the 110.6 top + relative-strength fade + Bitcoin breaking below 78k dragging the system, rather than a single-point negative catalyst. Tomorrow (9/11) US August CPI is the biggest variable; volatility will likely be amplified.
👉 My view
Read it as: the pullback from the 105 level (as of 09-07) has evolved into a formal step-down with daily MA25 (98-100). It differs from that "healthy pullback" narrative—now it’s a volume-backed breakdown, not de-leveraging.
99.84 losing the 1d MA7, with 4h/1h fully oversold, and the daily MACD histogram of -1.095 turning negative—so short-selling is "real." But I’m not chasing shorts to kill the drop. Because daily MA25 (98.16) hasn’t broken, daily MA50 (86.37) is far away, and this is a slow retreat rather than a collapse. In the 98-100 area, technical dead-cat bounces are possible. If you have positions, keep a stop-loss below 98.33. If it breaks and confirms short weakness, withdraw first—global longs at 69.53% are crowded net long; if 98 falls, those leveraged longs become liquidation trigger material.
If you don’t have positions, don’t short 99. Wait for two signals: (1) reclaim 101.63 (1h MA25) with volume and it doesn’t turn back; (2) 1h MACD flips red confirming stabilization; or alternatively (3) pull back to 98.16 without breaking it, then consider a light entry.
For the medium term, the structure (daily long posture, MA50 at 86 at the floor) isn’t broken, but with the 110.6 double top and consecutive green daily candles, we should treat this first as a "98-100 defense battle." No rushing—keep position size small, and wait for CPI to land and the daily chart to turn red before confirming that the uptrend is back.
Risk warning: SOL’s volatility and leverage density are far higher than Bitcoin’s and Ether’s; downside needle moves and liquidity risks are greater. With global 69% net long crowded, once 98 breaks it can trigger a chain liquidation. The funding rate/OI/long-short ratio are only the current snapshot. CPI tomorrow will amplify volatility.
For reference only; not investment advice.
$SOL $BTC $ETH #SOL #行情分析 #合约 #Alt-season
1
446
·
--
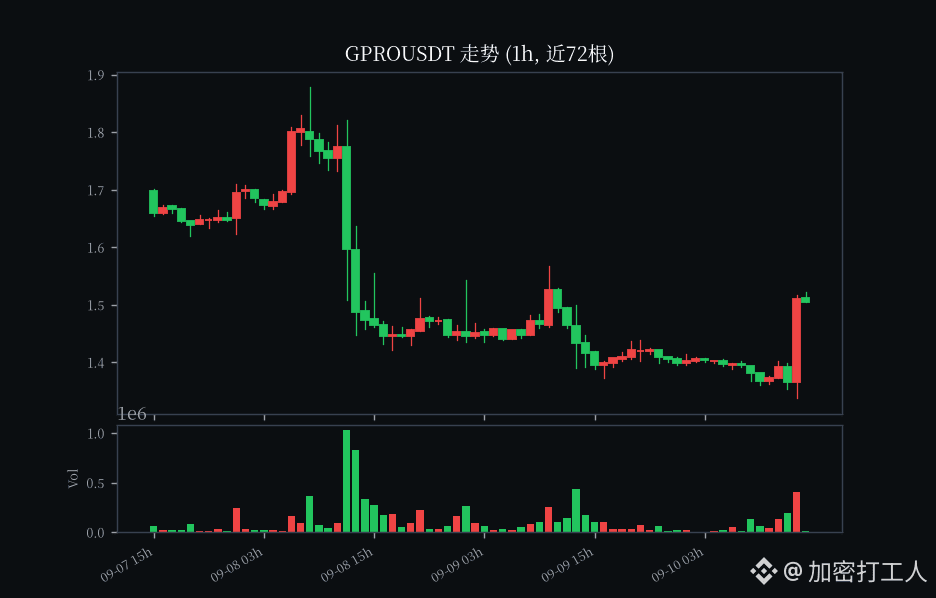
$GPRO current price $1.51, dumped all the way back 26% from the high of 2.057 📉
Today’s rebound of +5.3% is still only with volume around 2.5 million USDT—so thin it’s pitiful
Price-volume divergence; it’s basically just a dead-cat bounce
In 7 days it’s already turned green to red (-5.9%); the bulls don’t have any steam left
The profitable positions are all waiting to make an exit. I’m short $GPRO—this pullback, I’m not taking it 😏
$GPRO current price $1.51, dumped all the way back 26% from the high of 2.057 📉
Today’s rebound of +5.3% is still only with volume around 2.5 million USDT—so thin it’s pitiful
Price-volume divergence; it’s basically just a dead-cat bounce
In 7 days it’s already turned green to red (-5.9%); the bulls don’t have any steam left
The profitable positions are all waiting to make an exit. I’m short $GPRO —this pullback, I’m not taking it 😏
Today’s rebound of +5.3% is still only with volume around 2.5 million USDT—so thin it’s pitiful
Price-volume divergence; it’s basically just a dead-cat bounce
In 7 days it’s already turned green to red (-5.9%); the bulls don’t have any steam left
The profitable positions are all waiting to make an exit. I’m short $GPRO —this pullback, I’m not taking it 😏
536
·
--
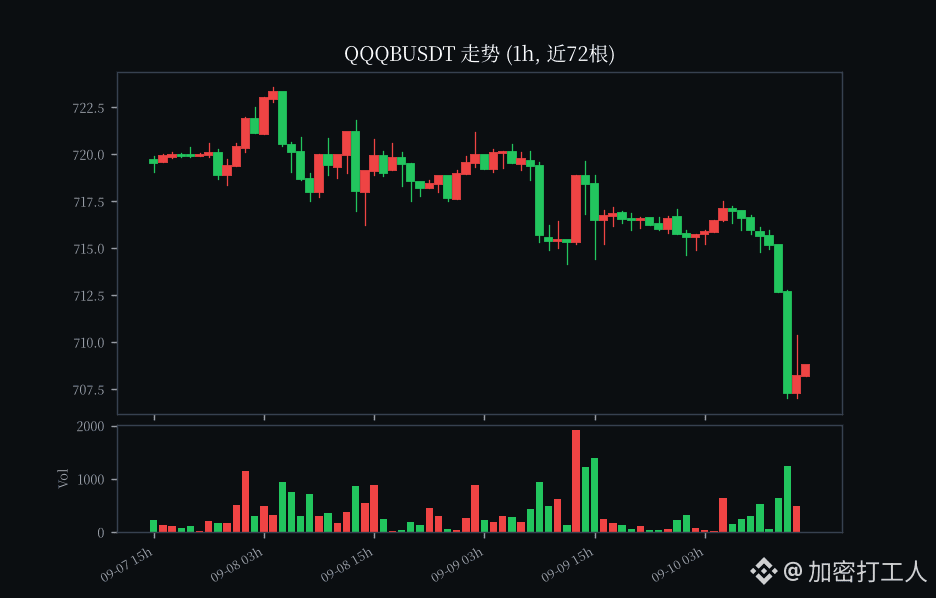
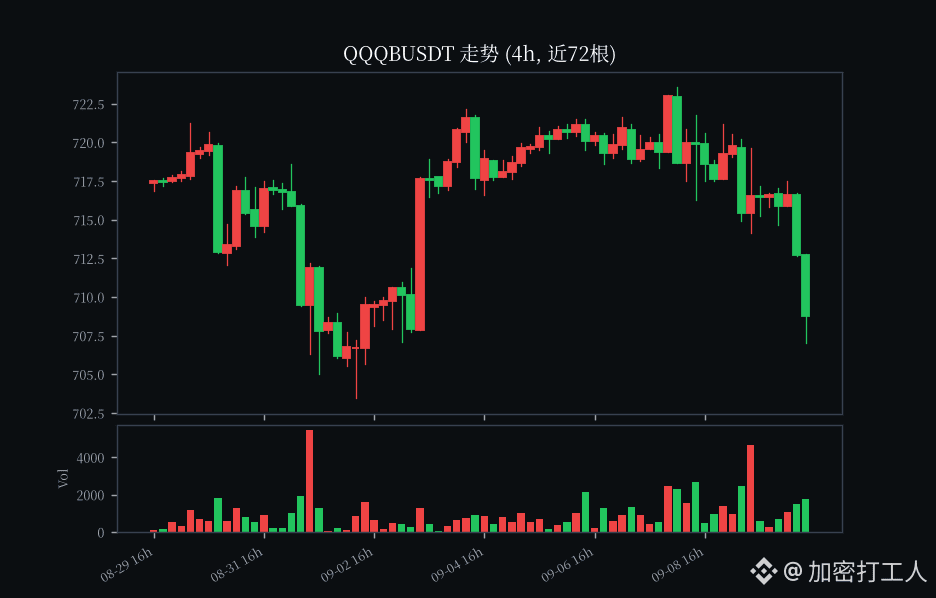
$QQQB current price 708.57, down slightly about 1.4% today; the whole day has been ranging between 707 and 719, and it’s currently trading right along the lower band.
Let me share my own thoughts. In this recent pullback in the Nasdaq, I think the main driver is that interest-rate cut expectations have been re-priced again, plus tech stocks have rallied too hard—some people are taking profits, but it’s not exactly panic-level.
For the few heavy-weight names in the Nasdaq 100, AI capex is still really strong, and the earnings guidance from several major companies is also holding up; the foundation hasn’t broken.
From a more bullish angle, I see two points: first, the big tech companies’ AI infrastructure investment hasn’t really stopped, and the visibility is pretty high; second, this month’s FOMC decision is likely to remain dovish, which provides some support for growth stock valuations.
In the short term, it may just grind here—whether it can hold around the 707 area matters to me a lot. What do you think of this stock? For reference only. US stocks can be volatile, so mind your position sizing.
$QQQB $NVDAB #美股 #bStocks #Nasdaq
$QQQB current price 708.57, down slightly about 1.4% today; the whole day has been ranging between 707 and 719, and it’s currently trading right along the lower band.
Let me share my own thoughts. In this recent pullback in the Nasdaq, I think the main driver is that interest-rate cut expectations have been re-priced again, plus tech stocks have rallied too hard—some people are taking profits, but it’s not exactly panic-level.
For the few heavy-weight names in the Nasdaq 100, AI capex is still really strong, and the earnings guidance from several major companies is also holding up; the foundation hasn’t broken.
From a more bullish angle, I see two points: first, the big tech companies’ AI infrastructure investment hasn’t really stopped, and the visibility is pretty high; second, this month’s FOMC decision is likely to remain dovish, which provides some support for growth stock valuations.
In the short term, it may just grind here—whether it can hold around the 707 area matters to me a lot. What do you think of this stock? For reference only. US stocks can be volatile, so mind your position sizing.
$QQQB $NVDAB #美股 #bStocks #Nasdaq
Let me share my own thoughts. In this recent pullback in the Nasdaq, I think the main driver is that interest-rate cut expectations have been re-priced again, plus tech stocks have rallied too hard—some people are taking profits, but it’s not exactly panic-level.
For the few heavy-weight names in the Nasdaq 100, AI capex is still really strong, and the earnings guidance from several major companies is also holding up; the foundation hasn’t broken.
From a more bullish angle, I see two points: first, the big tech companies’ AI infrastructure investment hasn’t really stopped, and the visibility is pretty high; second, this month’s FOMC decision is likely to remain dovish, which provides some support for growth stock valuations.
In the short term, it may just grind here—whether it can hold around the 707 area matters to me a lot. What do you think of this stock? For reference only. US stocks can be volatile, so mind your position sizing.
$QQQB $NVDAB #美股 #bStocks #Nasdaq
300
·
--
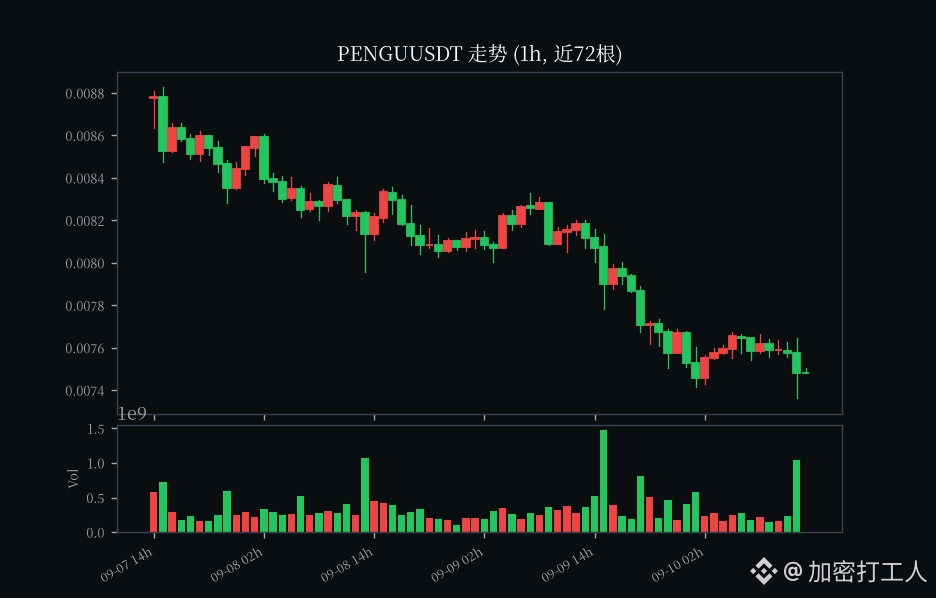
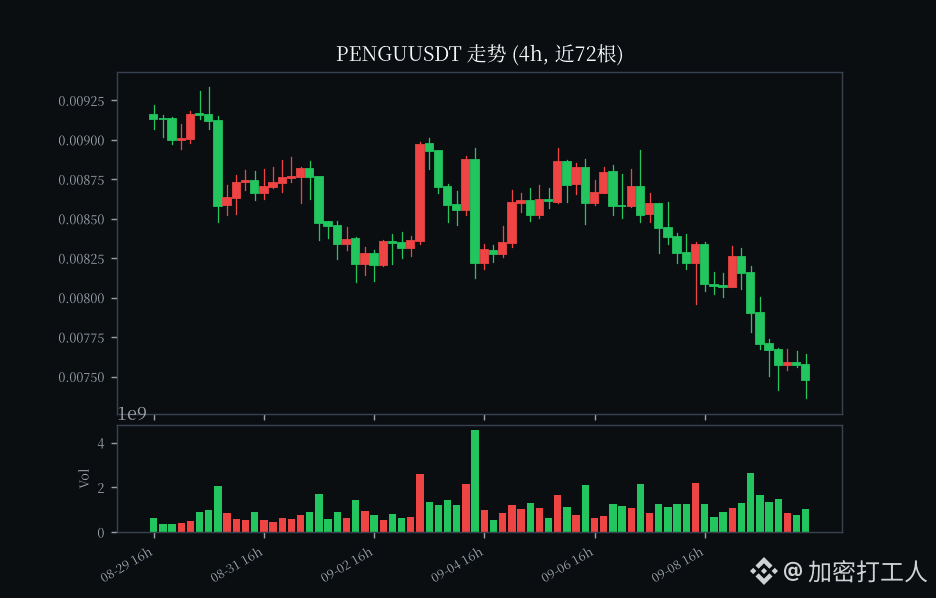
$PENGU current price 0.007503
The late-night farming strategy is here 🐧 PENGU Today’s 24h is down 8.34%, current price 0.007503, volume about 10.33 million. In Alpha, it’s a low-priced active coin, very suitable for farming airdrop points by selling short.
How to operate: place small orders in batches—don’t go all-in at once. If you want to farm points, keep having trades every day; accumulating Alpha points is more stable than chasing pumps.
Risk reminder: small-cap coins move a lot. 0.0074 is the 24h low—if it breaks, don’t stubbornly hold; keep your position size at a level you can sleep at.
Tonight, are you farming points or waiting for a new coin? Chat in the comments below 👇
$PENGU $BTC #币安Alpha #刷分 #shady coin
$PENGU current price 0.007503
The late-night farming strategy is here 🐧 PENGU Today’s 24h is down 8.34%, current price 0.007503, volume about 10.33 million. In Alpha, it’s a low-priced active coin, very suitable for farming airdrop points by selling short.
How to operate: place small orders in batches—don’t go all-in at once. If you want to farm points, keep having trades every day; accumulating Alpha points is more stable than chasing pumps.
Risk reminder: small-cap coins move a lot. 0.0074 is the 24h low—if it breaks, don’t stubbornly hold; keep your position size at a level you can sleep at.
Tonight, are you farming points or waiting for a new coin? Chat in the comments below 👇
$PENGU $BTC #币安Alpha #刷分 #shady coin
The late-night farming strategy is here 🐧 PENGU Today’s 24h is down 8.34%, current price 0.007503, volume about 10.33 million. In Alpha, it’s a low-priced active coin, very suitable for farming airdrop points by selling short.
How to operate: place small orders in batches—don’t go all-in at once. If you want to farm points, keep having trades every day; accumulating Alpha points is more stable than chasing pumps.
Risk reminder: small-cap coins move a lot. 0.0074 is the 24h low—if it breaks, don’t stubbornly hold; keep your position size at a level you can sleep at.
Tonight, are you farming points or waiting for a new coin? Chat in the comments below 👇
$PENGU $BTC #币安Alpha #刷分 #shady coin
439
·
--
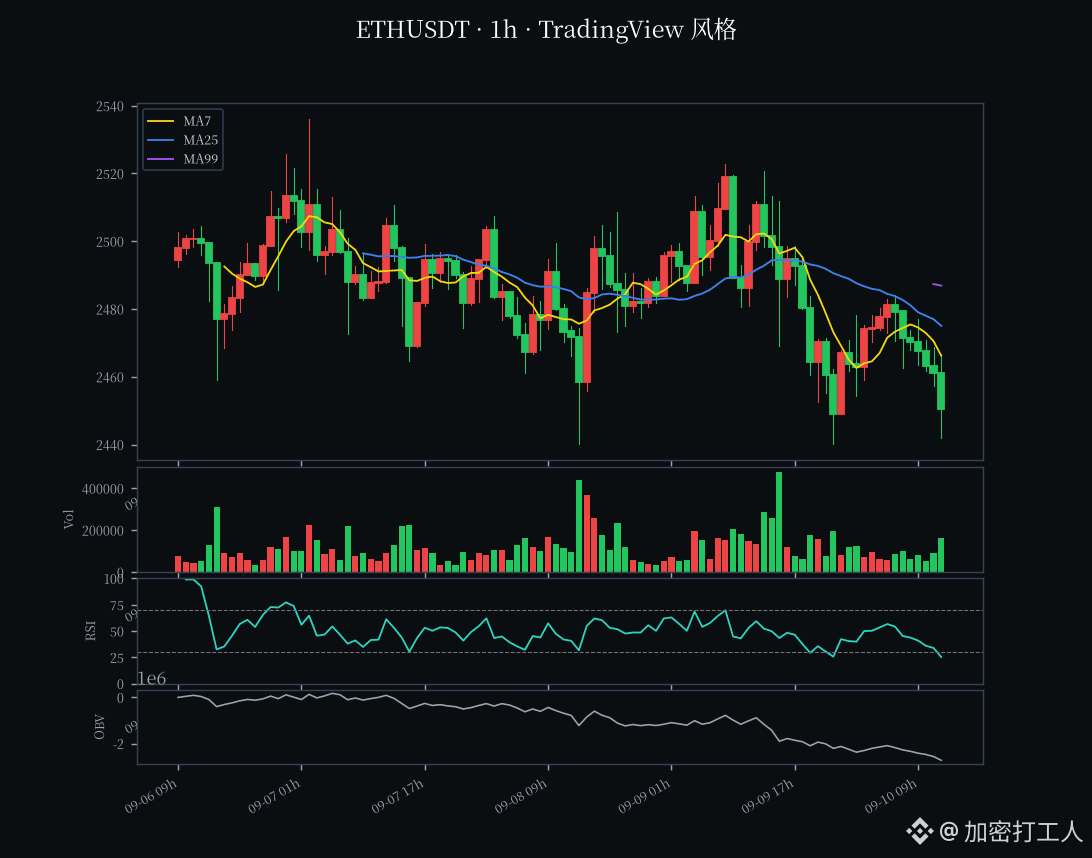
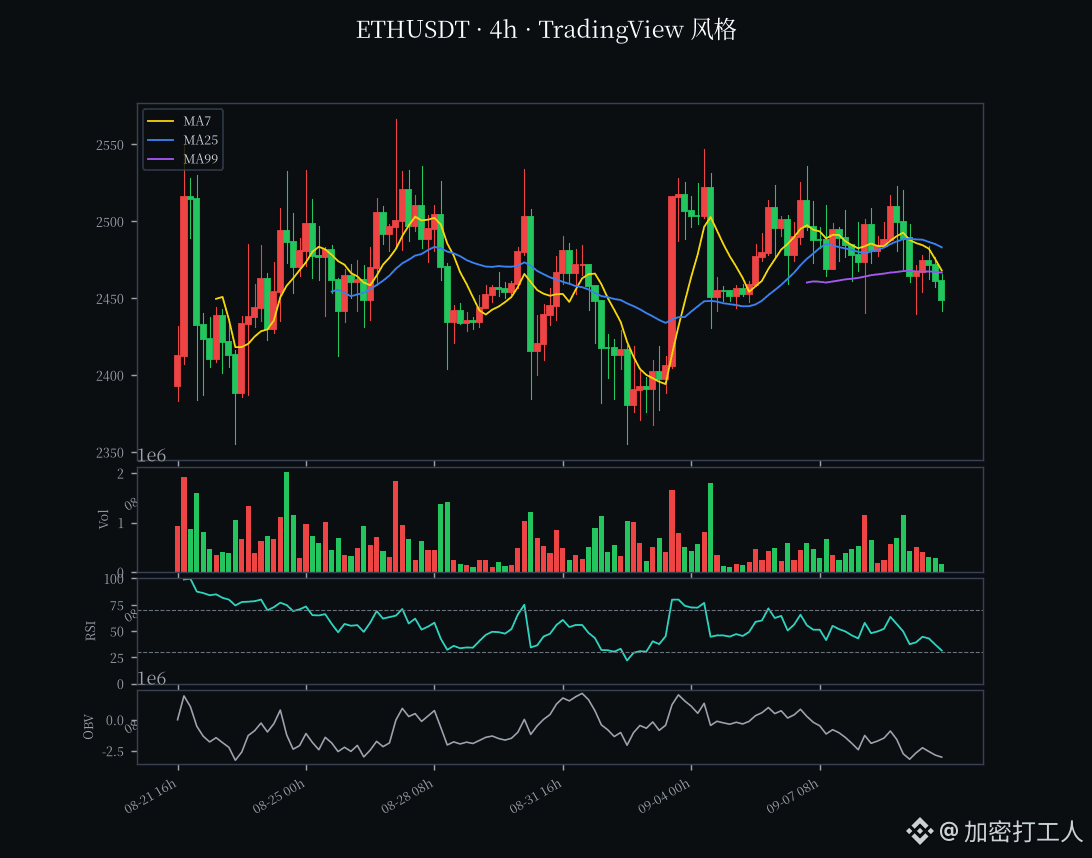
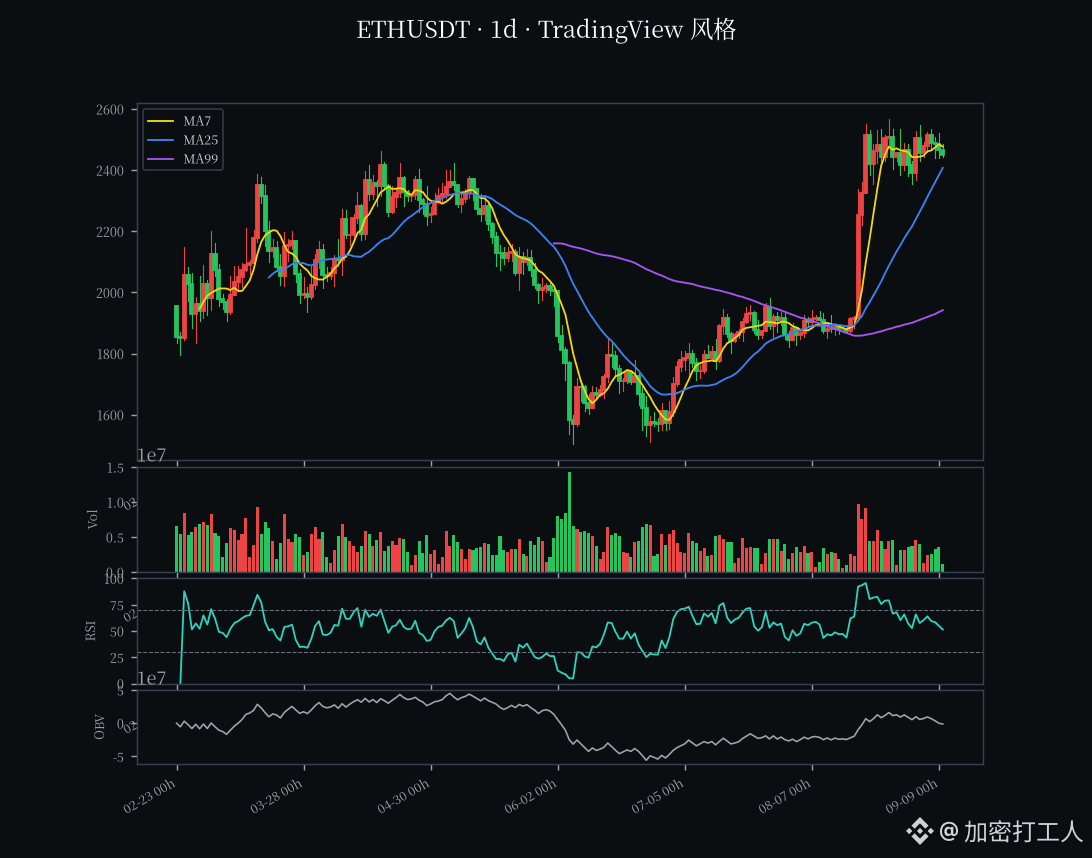
$ETH current price 2445.67, -2.20% in 24h. Volume about 7.9 billion USDT (24h perpetual quote, about 3.23 million ETH); 24h high 2520.58 / low 2440.09.
Last night’s article I wrote was “2430–2440 platform defended for the second time, and the pullback was repaired.” Today this candle swallowed that retracement. During the day, once it touched 2520 it turned soft; it was still a short step away from the two old resistance lines at 2536/2547. It then bled back all the way to 2440.09, closing at 2445.67, down 2.20% over 24h. The volume of 7.9B versus 6.62B last night increased by nearly 20%—it’s “volume on a pullback,” meaning bids above 2520 couldn’t hold it.
ETH/BTC 0.031563, +0.15% in 24h. Relative strength hasn’t been thrown off by BTC; this drawdown is the pullback from the 2520 move—not BTC dragging everything down (BTC also broke 78k tonight, but ETH at 2440 is still holding).
📊 Technicals
Three timeframes: “daily losing MA7, 4h momentum turns bearish, 1h capped under the moving-average cluster,” swapping the setup from “last night’s 4h turned red.” 1D close at 2446, breaking below MA7 (2476); only MA25 (2407) is propping. RSI 44.2 is weak; MACD histogram -20.40 (dif 92.11 over dea 112.52)—the deepest dip since 2566, cooling that is now accelerating.
4h close at 2447, with MA7 (2468) / MA25 (2483) / MA50 (2471) / MA99 (2467) all pressing overhead. RSI 40.2 is weak; MACD histogram -4.85 (dif -4.04 below dea +0.81) flips bearish. The near-20 low at 2440.09 is the neck at the edge of the chart.
1h close at 2450, capped by MA7 (2466) / MA25 (2475) / MA50 (2483) / MA99 (2487). RSI 50.8 is neutral but slightly weak; green histogram -1.29.
Key levels: Resistance above—2476 (1D MA7) / 2483 (4h MA25) immediate pressure. Only if it breaks above 2520.58 (today’s high) / 2522.75 (near 4h high) can it reach the hard top at 2566.4.
Support: 2440.09 (today’s low) is the key line. If that fails and 2407 (1D MA25) is lost, then a further break below 2355 (1D near-20 low) would make the medium-term ugly. Tonight, 2440 is being tested for the third time (09-07 and 09-09 both held).
💧 Derivatives & sentiment
Funding rate 3.54e-06 (8h, dailyized about +0.001%)—healthy, close to the ground. Open interest 2.2899M ETH (about 5.6B USDT). Price is down 2.2% while OI doesn’t move; the longs are hard-carrying unrealized losses without reducing position. Net long is crowded at a historical level: global long/short ratio 2.7439 (long 73.29%), more crowded than 2.43 on 09-09 and 2.24 on 09-07. Retail net longs hit a weekly high; top trader 1.5312 (long 60.49%)—whales are bullish, but not as extreme as retail. Taker buy/sell ratio 0.7142—active selling pressure is on top (buy 4674 / sell 6544), so flow is bearish.
Fear & Greed: 69 (Greed).
📰 News & macro
The news/search channels didn’t provide usable inputs; ETF net flows, staking ratio, and the exact Gas value weren’t obtained—no made-up numbers. I didn’t see any ETH “hard bomb” event. The drop from 2520 looks more like the technical sell pressure confirmation after 2566 topped + profit-taking from the 09-09 pullback.
Macro tomorrow (9/11) US August CPI is the biggest variable; volatility will amplify around the data.
👉 My view
Read it as: “The 09-09 pullback was blocked back by 2520, and the 2440 key defense is being tested for the third time,” essentially flipping last night’s “defend the pullback.” Losing 2445 breaks daily MA7 and makes 4h formally turn bearish; the daily candle histogram at -20.4 accelerates the downside. The pullback is real, and the global 73.29% net-long crowding looks like a timed bomb—if 2440 breaks, it can trigger a cascade of long-liquidations.
But don’t chase a short below 2440. MA25 (2407) is underfoot; MA50 (2148) is far below. This is more likely a slow retreat than a full breakdown. From 2407 to 2440, you can still get mean-reversion bounces. If you have orders, place stops below 2440.09; if it breaks and shows short weakness, withdraw first. If you don’t have a position, don’t short at 2445—wait for two signals: (1) a volume-supported reclaim of 2476 (1D MA7) with no backslide, and (2) 4h MACD flipping back to green. Or if it retests 2407–2440 without breaking down and stabilizes, then consider taking a light position.
The medium-term structure (daily MA bull trend; MA50 2148 as the floor) hasn’t broken. But with the 2566 double top and continuously deepening green on the daily, treat this first as “the third defense battle around 2440”—don’t overtrade. Keep position size small and wait for CPI to land + the daily to flip red/green.
Risk warning: ETH is highly volatile and leverage is dense; pullback needles and liquidity risks aren’t low. The global 73% net-long crowding, once 2440 fails, can easily trigger chain liquidations. Funding/long-short ratio are only a current snapshot. CPI tomorrow will amplify volatility.
For reference only; not investment advice.
$ETH $BTC $SOL #ETH #行情分析 #合约 #Ethereum
$ETH current price 2445.67, -2.20% in 24h. Volume about 7.9 billion USDT (24h perpetual quote, about 3.23 million ETH); 24h high 2520.58 / low 2440.09.
Last night’s article I wrote was “2430–2440 platform defended for the second time, and the pullback was repaired.” Today this candle swallowed that retracement. During the day, once it touched 2520 it turned soft; it was still a short step away from the two old resistance lines at 2536/2547. It then bled back all the way to 2440.09, closing at 2445.67, down 2.20% over 24h. The volume of 7.9B versus 6.62B last night increased by nearly 20%—it’s “volume on a pullback,” meaning bids above 2520 couldn’t hold it.
ETH/BTC 0.031563, +0.15% in 24h. Relative strength hasn’t been thrown off by BTC; this drawdown is the pullback from the 2520 move—not BTC dragging everything down (BTC also broke 78k tonight, but ETH at 2440 is still holding).
📊 Technicals
Three timeframes: “daily losing MA7, 4h momentum turns bearish, 1h capped under the moving-average cluster,” swapping the setup from “last night’s 4h turned red.” 1D close at 2446, breaking below MA7 (2476); only MA25 (2407) is propping. RSI 44.2 is weak; MACD histogram -20.40 (dif 92.11 over dea 112.52)—the deepest dip since 2566, cooling that is now accelerating.
4h close at 2447, with MA7 (2468) / MA25 (2483) / MA50 (2471) / MA99 (2467) all pressing overhead. RSI 40.2 is weak; MACD histogram -4.85 (dif -4.04 below dea +0.81) flips bearish. The near-20 low at 2440.09 is the neck at the edge of the chart.
1h close at 2450, capped by MA7 (2466) / MA25 (2475) / MA50 (2483) / MA99 (2487). RSI 50.8 is neutral but slightly weak; green histogram -1.29.
Key levels: Resistance above—2476 (1D MA7) / 2483 (4h MA25) immediate pressure. Only if it breaks above 2520.58 (today’s high) / 2522.75 (near 4h high) can it reach the hard top at 2566.4.
Support: 2440.09 (today’s low) is the key line. If that fails and 2407 (1D MA25) is lost, then a further break below 2355 (1D near-20 low) would make the medium-term ugly. Tonight, 2440 is being tested for the third time (09-07 and 09-09 both held).
💧 Derivatives & sentiment
Funding rate 3.54e-06 (8h, dailyized about +0.001%)—healthy, close to the ground. Open interest 2.2899M ETH (about 5.6B USDT). Price is down 2.2% while OI doesn’t move; the longs are hard-carrying unrealized losses without reducing position. Net long is crowded at a historical level: global long/short ratio 2.7439 (long 73.29%), more crowded than 2.43 on 09-09 and 2.24 on 09-07. Retail net longs hit a weekly high; top trader 1.5312 (long 60.49%)—whales are bullish, but not as extreme as retail. Taker buy/sell ratio 0.7142—active selling pressure is on top (buy 4674 / sell 6544), so flow is bearish.
Fear & Greed: 69 (Greed).
📰 News & macro
The news/search channels didn’t provide usable inputs; ETF net flows, staking ratio, and the exact Gas value weren’t obtained—no made-up numbers. I didn’t see any ETH “hard bomb” event. The drop from 2520 looks more like the technical sell pressure confirmation after 2566 topped + profit-taking from the 09-09 pullback.
Macro tomorrow (9/11) US August CPI is the biggest variable; volatility will amplify around the data.
👉 My view
Read it as: “The 09-09 pullback was blocked back by 2520, and the 2440 key defense is being tested for the third time,” essentially flipping last night’s “defend the pullback.” Losing 2445 breaks daily MA7 and makes 4h formally turn bearish; the daily candle histogram at -20.4 accelerates the downside. The pullback is real, and the global 73.29% net-long crowding looks like a timed bomb—if 2440 breaks, it can trigger a cascade of long-liquidations.
But don’t chase a short below 2440. MA25 (2407) is underfoot; MA50 (2148) is far below. This is more likely a slow retreat than a full breakdown. From 2407 to 2440, you can still get mean-reversion bounces. If you have orders, place stops below 2440.09; if it breaks and shows short weakness, withdraw first. If you don’t have a position, don’t short at 2445—wait for two signals: (1) a volume-supported reclaim of 2476 (1D MA7) with no backslide, and (2) 4h MACD flipping back to green. Or if it retests 2407–2440 without breaking down and stabilizes, then consider taking a light position.
The medium-term structure (daily MA bull trend; MA50 2148 as the floor) hasn’t broken. But with the 2566 double top and continuously deepening green on the daily, treat this first as “the third defense battle around 2440”—don’t overtrade. Keep position size small and wait for CPI to land + the daily to flip red/green.
Risk warning: ETH is highly volatile and leverage is dense; pullback needles and liquidity risks aren’t low. The global 73% net-long crowding, once 2440 fails, can easily trigger chain liquidations. Funding/long-short ratio are only a current snapshot. CPI tomorrow will amplify volatility.
For reference only; not investment advice.
$ETH $BTC $SOL #ETH #行情分析 #合约 #Ethereum
Last night’s article I wrote was “2430–2440 platform defended for the second time, and the pullback was repaired.” Today this candle swallowed that retracement. During the day, once it touched 2520 it turned soft; it was still a short step away from the two old resistance lines at 2536/2547. It then bled back all the way to 2440.09, closing at 2445.67, down 2.20% over 24h. The volume of 7.9B versus 6.62B last night increased by nearly 20%—it’s “volume on a pullback,” meaning bids above 2520 couldn’t hold it.
ETH/BTC 0.031563, +0.15% in 24h. Relative strength hasn’t been thrown off by BTC; this drawdown is the pullback from the 2520 move—not BTC dragging everything down (BTC also broke 78k tonight, but ETH at 2440 is still holding).
📊 Technicals
Three timeframes: “daily losing MA7, 4h momentum turns bearish, 1h capped under the moving-average cluster,” swapping the setup from “last night’s 4h turned red.” 1D close at 2446, breaking below MA7 (2476); only MA25 (2407) is propping. RSI 44.2 is weak; MACD histogram -20.40 (dif 92.11 over dea 112.52)—the deepest dip since 2566, cooling that is now accelerating.
4h close at 2447, with MA7 (2468) / MA25 (2483) / MA50 (2471) / MA99 (2467) all pressing overhead. RSI 40.2 is weak; MACD histogram -4.85 (dif -4.04 below dea +0.81) flips bearish. The near-20 low at 2440.09 is the neck at the edge of the chart.
1h close at 2450, capped by MA7 (2466) / MA25 (2475) / MA50 (2483) / MA99 (2487). RSI 50.8 is neutral but slightly weak; green histogram -1.29.
Key levels: Resistance above—2476 (1D MA7) / 2483 (4h MA25) immediate pressure. Only if it breaks above 2520.58 (today’s high) / 2522.75 (near 4h high) can it reach the hard top at 2566.4.
Support: 2440.09 (today’s low) is the key line. If that fails and 2407 (1D MA25) is lost, then a further break below 2355 (1D near-20 low) would make the medium-term ugly. Tonight, 2440 is being tested for the third time (09-07 and 09-09 both held).
💧 Derivatives & sentiment
Funding rate 3.54e-06 (8h, dailyized about +0.001%)—healthy, close to the ground. Open interest 2.2899M ETH (about 5.6B USDT). Price is down 2.2% while OI doesn’t move; the longs are hard-carrying unrealized losses without reducing position. Net long is crowded at a historical level: global long/short ratio 2.7439 (long 73.29%), more crowded than 2.43 on 09-09 and 2.24 on 09-07. Retail net longs hit a weekly high; top trader 1.5312 (long 60.49%)—whales are bullish, but not as extreme as retail. Taker buy/sell ratio 0.7142—active selling pressure is on top (buy 4674 / sell 6544), so flow is bearish.
Fear & Greed: 69 (Greed).
📰 News & macro
The news/search channels didn’t provide usable inputs; ETF net flows, staking ratio, and the exact Gas value weren’t obtained—no made-up numbers. I didn’t see any ETH “hard bomb” event. The drop from 2520 looks more like the technical sell pressure confirmation after 2566 topped + profit-taking from the 09-09 pullback.
Macro tomorrow (9/11) US August CPI is the biggest variable; volatility will amplify around the data.
👉 My view
Read it as: “The 09-09 pullback was blocked back by 2520, and the 2440 key defense is being tested for the third time,” essentially flipping last night’s “defend the pullback.” Losing 2445 breaks daily MA7 and makes 4h formally turn bearish; the daily candle histogram at -20.4 accelerates the downside. The pullback is real, and the global 73.29% net-long crowding looks like a timed bomb—if 2440 breaks, it can trigger a cascade of long-liquidations.
But don’t chase a short below 2440. MA25 (2407) is underfoot; MA50 (2148) is far below. This is more likely a slow retreat than a full breakdown. From 2407 to 2440, you can still get mean-reversion bounces. If you have orders, place stops below 2440.09; if it breaks and shows short weakness, withdraw first. If you don’t have a position, don’t short at 2445—wait for two signals: (1) a volume-supported reclaim of 2476 (1D MA7) with no backslide, and (2) 4h MACD flipping back to green. Or if it retests 2407–2440 without breaking down and stabilizes, then consider taking a light position.
The medium-term structure (daily MA bull trend; MA50 2148 as the floor) hasn’t broken. But with the 2566 double top and continuously deepening green on the daily, treat this first as “the third defense battle around 2440”—don’t overtrade. Keep position size small and wait for CPI to land + the daily to flip red/green.
Risk warning: ETH is highly volatile and leverage is dense; pullback needles and liquidity risks aren’t low. The global 73% net-long crowding, once 2440 fails, can easily trigger chain liquidations. Funding/long-short ratio are only a current snapshot. CPI tomorrow will amplify volatility.
For reference only; not investment advice.
$ETH $BTC $SOL #ETH #行情分析 #合约 #Ethereum
1
218
·
--
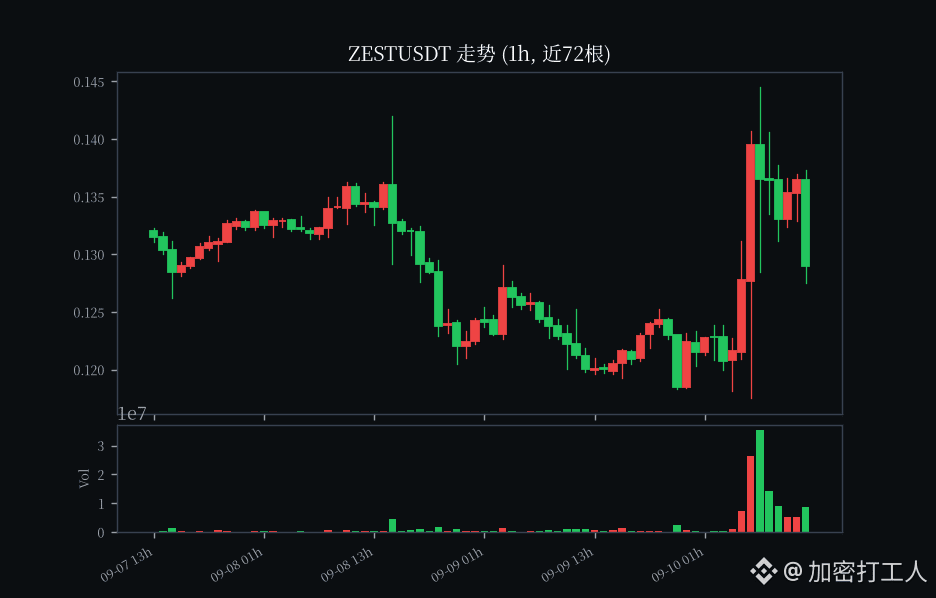
$ZEST Current price\$0.129, down hard from the 0.177 peak all the way—down 27%⚠️ The profit-taking positions are all clustered right at the top, ready to run
Next Tuesday, 25 million tokens will be unlocked and dumped—while volume is only 16 million USDT, it can’t hold 💀
Funding rate is 0.01%, almost zero—there’s no confidence left on the long side
I’m shorting $ZEST—shorting first as a sign of respect 😏
$ZEST Current price\$0.129, down hard from the 0.177 peak all the way—down 27%⚠️ The profit-taking positions are all clustered right at the top, ready to run
Next Tuesday, 25 million tokens will be unlocked and dumped—while volume is only 16 million USDT, it can’t hold 💀
Funding rate is 0.01%, almost zero—there’s no confidence left on the long side
I’m shorting $ZEST —shorting first as a sign of respect 😏
Next Tuesday, 25 million tokens will be unlocked and dumped—while volume is only 16 million USDT, it can’t hold 💀
Funding rate is 0.01%, almost zero—there’s no confidence left on the long side
I’m shorting $ZEST —shorting first as a sign of respect 😏
132
·
--
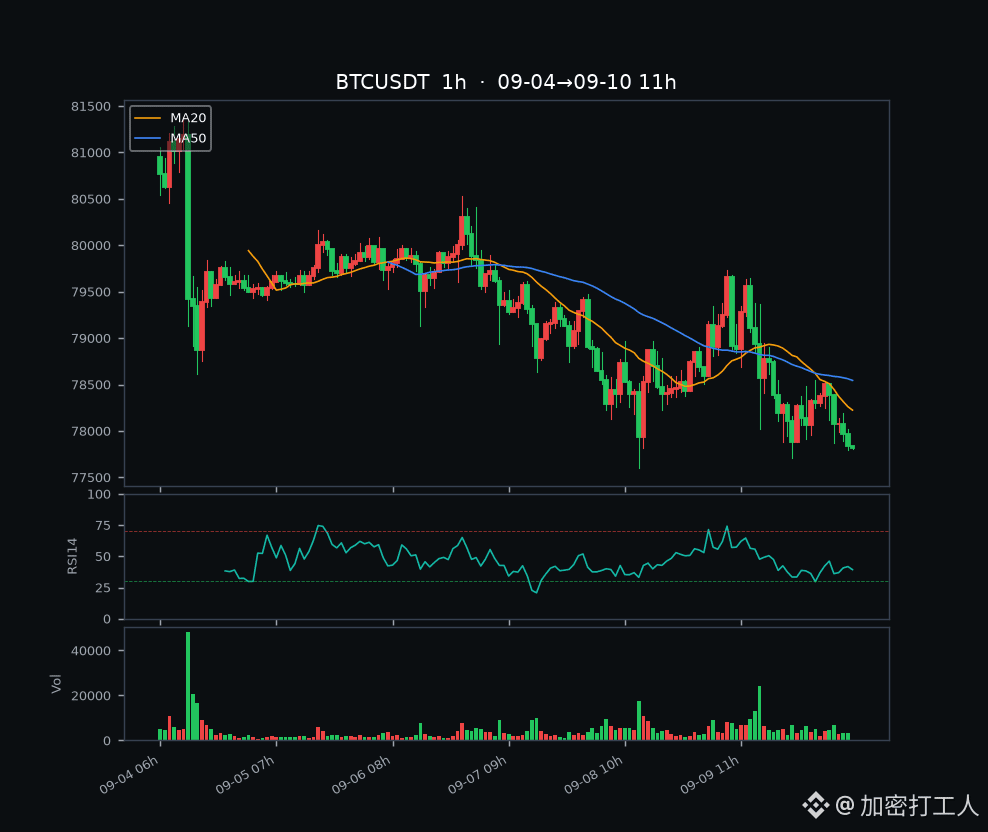
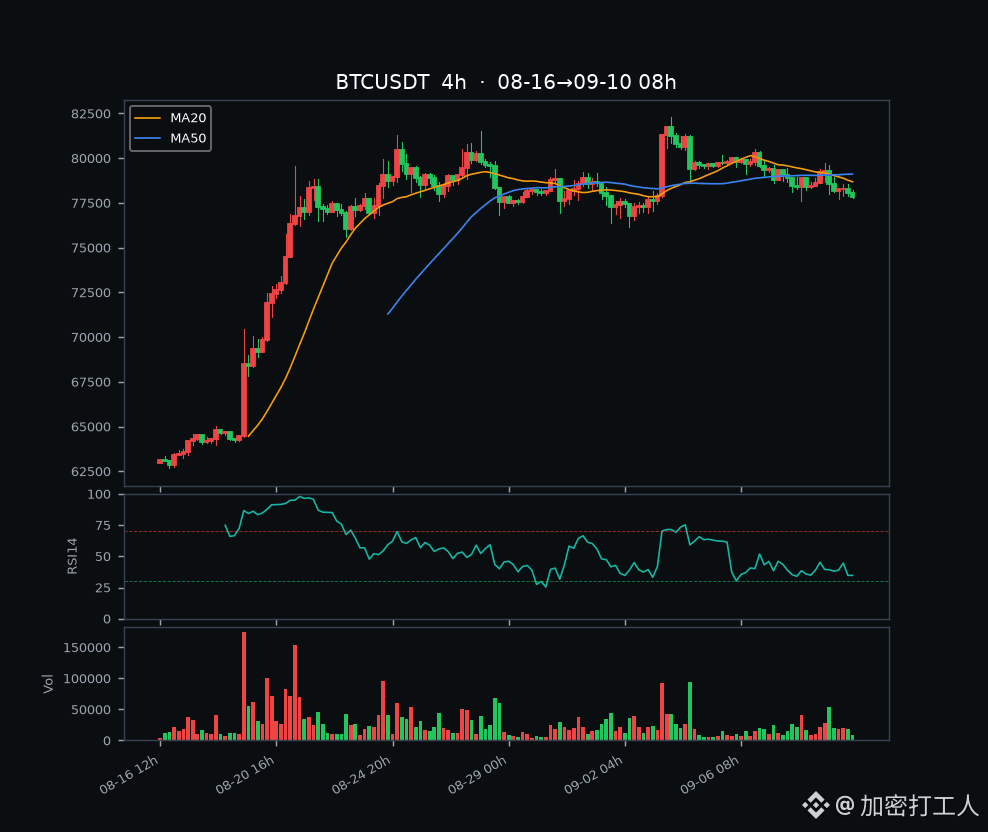
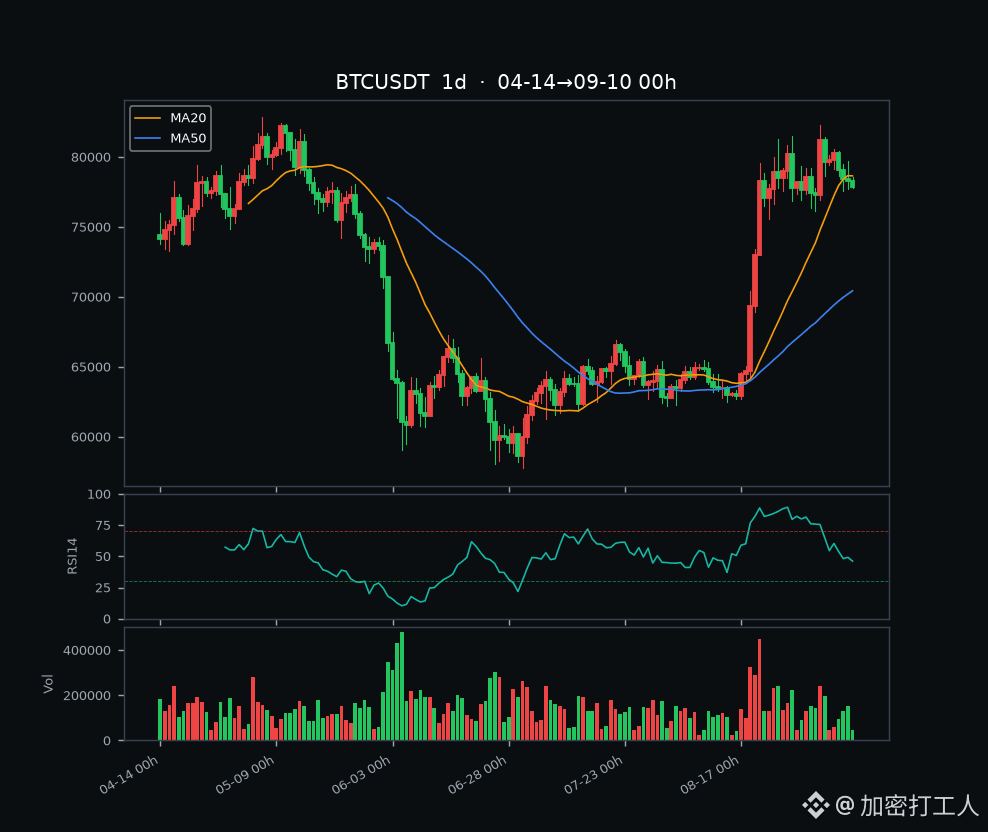
$BTC current price 77803.2, 24h -1.37%, trading volume about 11.37 billion USDT (24h perpetual quote, about 145k BTC); 24h high 79648.1 / low 77706.1.
In the piece I wrote on 09-07, I said, "After breaking below 80k, it’s a bottoming grind, and the 78500-78900 range is still holding." Today, that tone directly smashed through that range. It opened at 79648 and then drifted lower all the way; into the close, it probed down to 77706, and closed at 77803. Over the past 24h, it’s down 1.37%, and volume of 11.37 billion is almost the same as the 11.39 billion from the day before—price is falling but volume isn’t shrinking, which suggests selling pressure is continuous, not something that gets slammed once and then quickly retracts. Most importantly, the key line at 78500-78900 has already been lost; price is now pressing just above the daily MA25 (76907). The situation is completely different from last week’s "range-floor grinding"—this is the step down to the next tier.
📊 Technicals
All three time cycles are weak, with "bear dominance, moving averages pressing down". The 1d close is 77808, already below MA7 (79041); only MA25 (76907) is still holding things up. RSI 46.1 is neutral but slightly weak. MACD bars are -592.7 (dif 2360 pressing down dea 2952); several consecutive bars are negative and the gap is widening—after the top at 81230, it’s been stepping down the whole way, and daily momentum is still fading. The 4h chart looks the worst: close at 77808. MA7 (78355) / MA25 (78915) / MA50 (79113) / MA99 (78846) are all stacked above price, acting as resistance. RSI 34.6 is near oversold. MACD bars are -88, opening downward. Around 77808—current close—is where the four-hour bears call the shots. The 1h chart also hasn’t stopped the drop: close 77803, with MA7 (78091) / MA25 (78396) / MA50 (78543) / MA99 (78963) all pressing above. RSI 39.0 is weak, and MACD bars are -35.3 green; the hourly level is still probing lower.
Key levels nailed down: below 77706 (today’s low) is the first line—if it breaks, it runs straight to 76907 (daily MA25), the real make-or-break. This level must be watched closely today; a further break points back toward MA50 (70433) and the prior low around 77084 area, which would look ugly for the medium term. Overhead resistance: 78091 (1h MA7) / 78396 (1h MA25) are immediate caps. Only after a move above 78915 (4h MA25) / 79113 (4h MA50) can you start talking about the selloff stabilizing. 79648 (today’s high) is the true short-term pressure point.
💧 Derivatives & sentiment
Fee rate 7.214e-05 (8h, daily change about +0.0216%), more than double the 3.012e-05 from 09-07—but in absolute terms it’s still low and the leverage isn’t “overheating.” Open interest 105,948 BTC (about 8.24 billion USDT), down slightly versus 107,096 on 09-07. With price down and OI also down, longs are reducing positions rather than stubbornly holding losses—cleaner than the situation at the time of "falling without reducing leverage," so the string of passive liquidations isn’t as tight. But net longs are getting crowded again: top trader positioning ratio 2.2650 (long 69.37%)—whale net longs have returned to high levels; global account ratio 1.5044 (long 60.07%), clearly more bullish than 1.08 on 09-07. Retail is also turning net long, which is often a contrarian signal. Taker buy/sell ratio is 0.6590; active sell orders are pressing harder (buys 62.5 / sells 94.9). The real flow is more bearish, matching "price down with volume not shrinking." Fear&Greed 69 (greed), slightly lower than 71 on 09-07. Over the past week it’s eased from 74 down to 69; sentiment is still in the greed zone but cooling off.
📰 News
The news/search channel won’t be usable tonight (geo restriction). I couldn’t obtain ETF net flows or precise on-chain figures, so I won’t fabricate numbers. On the chart, BTC itself didn’t trigger a big surprise event. This break below 78k looks more like a trend-based pullback after the failure of the 81-82k breakout, combined with technical step-down effects from weakening daily/4h momentum—not a single negative catalyst.
The biggest external macro variable is tomorrow (Sep 11) US August CPI; fluctuations around the data could amplify moves, and that will be key for setting the direction.
👉 My view
I read it as: after the 78500-78900 range is lost, it steps down toward 76907 (daily MA25), diverging from the 09-07 "range grinding". 77803 has already broken the prior range; 4h RSI 34.6 is near oversold; daily MACD bars -592.7 are continuously expanding. The short-term bearish pressure is real, but I’m not chasing shorts to cut into the drop. Daily MA25 (76907) hasn’t broken yet; MA50 (70433) is far below. This is a slow retreat, not a collapse. There’s likely a technical dead-cat bounce around the 76900 area. If you’re in a position, place stop-loss orders below 76900; if it breaks, treat it as a short-term weakness signal and撤退—especially with top trader’s crowded net long at 69.37%, once 76900 is lost, that leverage-long crowd becomes the liquidation fuse. If you have no position, don’t bottom-pick around 77800—wait for two signals: either a volume-backed reclaim of 78396 (1h MA25) with no turning back, and/or hourly MACD flips red to confirm short-term stabilization; or a retest of 76900-77080 that holds without breaking, then enter with light sizing. The medium-term big structure hasn’t broken (daily MA order is still bullish, and MA50 70433 is still below). But daily MACD bars have been negative for consecutive days and dif has crossed below dea. The post-812k top pullback hasn’t fully played out. Until 76900 is reclaimed, treat this as "step-down consolidation": keep position size small, wait for CPI to settle and for daily MACD/candles to turn positive—that’s the confirmation the trend is starting again.
Risk warning: BTC volatility is high and leverage is dense; the needle-like spikes and liquidity risks inside the step-down are not low. Fee and long/short ratio are only from the current snapshot and can change anytime. Tomorrow’s CPI could amplify volatility.
For reference only; not investment advice.
$BTC $ETH $SOL #BTC #行情分析 #合约 #Bitcoin
$BTC current price 77803.2, 24h -1.37%, trading volume about 11.37 billion USDT (24h perpetual quote, about 145k BTC); 24h high 79648.1 / low 77706.1.
In the piece I wrote on 09-07, I said, "After breaking below 80k, it’s a bottoming grind, and the 78500-78900 range is still holding." Today, that tone directly smashed through that range. It opened at 79648 and then drifted lower all the way; into the close, it probed down to 77706, and closed at 77803. Over the past 24h, it’s down 1.37%, and volume of 11.37 billion is almost the same as the 11.39 billion from the day before—price is falling but volume isn’t shrinking, which suggests selling pressure is continuous, not something that gets slammed once and then quickly retracts. Most importantly, the key line at 78500-78900 has already been lost; price is now pressing just above the daily MA25 (76907). The situation is completely different from last week’s "range-floor grinding"—this is the step down to the next tier.
📊 Technicals
All three time cycles are weak, with "bear dominance, moving averages pressing down". The 1d close is 77808, already below MA7 (79041); only MA25 (76907) is still holding things up. RSI 46.1 is neutral but slightly weak. MACD bars are -592.7 (dif 2360 pressing down dea 2952); several consecutive bars are negative and the gap is widening—after the top at 81230, it’s been stepping down the whole way, and daily momentum is still fading. The 4h chart looks the worst: close at 77808. MA7 (78355) / MA25 (78915) / MA50 (79113) / MA99 (78846) are all stacked above price, acting as resistance. RSI 34.6 is near oversold. MACD bars are -88, opening downward. Around 77808—current close—is where the four-hour bears call the shots. The 1h chart also hasn’t stopped the drop: close 77803, with MA7 (78091) / MA25 (78396) / MA50 (78543) / MA99 (78963) all pressing above. RSI 39.0 is weak, and MACD bars are -35.3 green; the hourly level is still probing lower.
Key levels nailed down: below 77706 (today’s low) is the first line—if it breaks, it runs straight to 76907 (daily MA25), the real make-or-break. This level must be watched closely today; a further break points back toward MA50 (70433) and the prior low around 77084 area, which would look ugly for the medium term. Overhead resistance: 78091 (1h MA7) / 78396 (1h MA25) are immediate caps. Only after a move above 78915 (4h MA25) / 79113 (4h MA50) can you start talking about the selloff stabilizing. 79648 (today’s high) is the true short-term pressure point.
💧 Derivatives & sentiment
Fee rate 7.214e-05 (8h, daily change about +0.0216%), more than double the 3.012e-05 from 09-07—but in absolute terms it’s still low and the leverage isn’t “overheating.” Open interest 105,948 BTC (about 8.24 billion USDT), down slightly versus 107,096 on 09-07. With price down and OI also down, longs are reducing positions rather than stubbornly holding losses—cleaner than the situation at the time of "falling without reducing leverage," so the string of passive liquidations isn’t as tight. But net longs are getting crowded again: top trader positioning ratio 2.2650 (long 69.37%)—whale net longs have returned to high levels; global account ratio 1.5044 (long 60.07%), clearly more bullish than 1.08 on 09-07. Retail is also turning net long, which is often a contrarian signal. Taker buy/sell ratio is 0.6590; active sell orders are pressing harder (buys 62.5 / sells 94.9). The real flow is more bearish, matching "price down with volume not shrinking." Fear&Greed 69 (greed), slightly lower than 71 on 09-07. Over the past week it’s eased from 74 down to 69; sentiment is still in the greed zone but cooling off.
📰 News
The news/search channel won’t be usable tonight (geo restriction). I couldn’t obtain ETF net flows or precise on-chain figures, so I won’t fabricate numbers. On the chart, BTC itself didn’t trigger a big surprise event. This break below 78k looks more like a trend-based pullback after the failure of the 81-82k breakout, combined with technical step-down effects from weakening daily/4h momentum—not a single negative catalyst.
The biggest external macro variable is tomorrow (Sep 11) US August CPI; fluctuations around the data could amplify moves, and that will be key for setting the direction.
👉 My view
I read it as: after the 78500-78900 range is lost, it steps down toward 76907 (daily MA25), diverging from the 09-07 "range grinding". 77803 has already broken the prior range; 4h RSI 34.6 is near oversold; daily MACD bars -592.7 are continuously expanding. The short-term bearish pressure is real, but I’m not chasing shorts to cut into the drop. Daily MA25 (76907) hasn’t broken yet; MA50 (70433) is far below. This is a slow retreat, not a collapse. There’s likely a technical dead-cat bounce around the 76900 area. If you’re in a position, place stop-loss orders below 76900; if it breaks, treat it as a short-term weakness signal and撤退—especially with top trader’s crowded net long at 69.37%, once 76900 is lost, that leverage-long crowd becomes the liquidation fuse. If you have no position, don’t bottom-pick around 77800—wait for two signals: either a volume-backed reclaim of 78396 (1h MA25) with no turning back, and/or hourly MACD flips red to confirm short-term stabilization; or a retest of 76900-77080 that holds without breaking, then enter with light sizing. The medium-term big structure hasn’t broken (daily MA order is still bullish, and MA50 70433 is still below). But daily MACD bars have been negative for consecutive days and dif has crossed below dea. The post-812k top pullback hasn’t fully played out. Until 76900 is reclaimed, treat this as "step-down consolidation": keep position size small, wait for CPI to settle and for daily MACD/candles to turn positive—that’s the confirmation the trend is starting again.
Risk warning: BTC volatility is high and leverage is dense; the needle-like spikes and liquidity risks inside the step-down are not low. Fee and long/short ratio are only from the current snapshot and can change anytime. Tomorrow’s CPI could amplify volatility.
For reference only; not investment advice.
$BTC $ETH $SOL #BTC #行情分析 #合约 #Bitcoin
In the piece I wrote on 09-07, I said, "After breaking below 80k, it’s a bottoming grind, and the 78500-78900 range is still holding." Today, that tone directly smashed through that range. It opened at 79648 and then drifted lower all the way; into the close, it probed down to 77706, and closed at 77803. Over the past 24h, it’s down 1.37%, and volume of 11.37 billion is almost the same as the 11.39 billion from the day before—price is falling but volume isn’t shrinking, which suggests selling pressure is continuous, not something that gets slammed once and then quickly retracts. Most importantly, the key line at 78500-78900 has already been lost; price is now pressing just above the daily MA25 (76907). The situation is completely different from last week’s "range-floor grinding"—this is the step down to the next tier.
📊 Technicals
All three time cycles are weak, with "bear dominance, moving averages pressing down". The 1d close is 77808, already below MA7 (79041); only MA25 (76907) is still holding things up. RSI 46.1 is neutral but slightly weak. MACD bars are -592.7 (dif 2360 pressing down dea 2952); several consecutive bars are negative and the gap is widening—after the top at 81230, it’s been stepping down the whole way, and daily momentum is still fading. The 4h chart looks the worst: close at 77808. MA7 (78355) / MA25 (78915) / MA50 (79113) / MA99 (78846) are all stacked above price, acting as resistance. RSI 34.6 is near oversold. MACD bars are -88, opening downward. Around 77808—current close—is where the four-hour bears call the shots. The 1h chart also hasn’t stopped the drop: close 77803, with MA7 (78091) / MA25 (78396) / MA50 (78543) / MA99 (78963) all pressing above. RSI 39.0 is weak, and MACD bars are -35.3 green; the hourly level is still probing lower.
Key levels nailed down: below 77706 (today’s low) is the first line—if it breaks, it runs straight to 76907 (daily MA25), the real make-or-break. This level must be watched closely today; a further break points back toward MA50 (70433) and the prior low around 77084 area, which would look ugly for the medium term. Overhead resistance: 78091 (1h MA7) / 78396 (1h MA25) are immediate caps. Only after a move above 78915 (4h MA25) / 79113 (4h MA50) can you start talking about the selloff stabilizing. 79648 (today’s high) is the true short-term pressure point.
💧 Derivatives & sentiment
Fee rate 7.214e-05 (8h, daily change about +0.0216%), more than double the 3.012e-05 from 09-07—but in absolute terms it’s still low and the leverage isn’t “overheating.” Open interest 105,948 BTC (about 8.24 billion USDT), down slightly versus 107,096 on 09-07. With price down and OI also down, longs are reducing positions rather than stubbornly holding losses—cleaner than the situation at the time of "falling without reducing leverage," so the string of passive liquidations isn’t as tight. But net longs are getting crowded again: top trader positioning ratio 2.2650 (long 69.37%)—whale net longs have returned to high levels; global account ratio 1.5044 (long 60.07%), clearly more bullish than 1.08 on 09-07. Retail is also turning net long, which is often a contrarian signal. Taker buy/sell ratio is 0.6590; active sell orders are pressing harder (buys 62.5 / sells 94.9). The real flow is more bearish, matching "price down with volume not shrinking." Fear&Greed 69 (greed), slightly lower than 71 on 09-07. Over the past week it’s eased from 74 down to 69; sentiment is still in the greed zone but cooling off.
📰 News
The news/search channel won’t be usable tonight (geo restriction). I couldn’t obtain ETF net flows or precise on-chain figures, so I won’t fabricate numbers. On the chart, BTC itself didn’t trigger a big surprise event. This break below 78k looks more like a trend-based pullback after the failure of the 81-82k breakout, combined with technical step-down effects from weakening daily/4h momentum—not a single negative catalyst.
The biggest external macro variable is tomorrow (Sep 11) US August CPI; fluctuations around the data could amplify moves, and that will be key for setting the direction.
👉 My view
I read it as: after the 78500-78900 range is lost, it steps down toward 76907 (daily MA25), diverging from the 09-07 "range grinding". 77803 has already broken the prior range; 4h RSI 34.6 is near oversold; daily MACD bars -592.7 are continuously expanding. The short-term bearish pressure is real, but I’m not chasing shorts to cut into the drop. Daily MA25 (76907) hasn’t broken yet; MA50 (70433) is far below. This is a slow retreat, not a collapse. There’s likely a technical dead-cat bounce around the 76900 area. If you’re in a position, place stop-loss orders below 76900; if it breaks, treat it as a short-term weakness signal and撤退—especially with top trader’s crowded net long at 69.37%, once 76900 is lost, that leverage-long crowd becomes the liquidation fuse. If you have no position, don’t bottom-pick around 77800—wait for two signals: either a volume-backed reclaim of 78396 (1h MA25) with no turning back, and/or hourly MACD flips red to confirm short-term stabilization; or a retest of 76900-77080 that holds without breaking, then enter with light sizing. The medium-term big structure hasn’t broken (daily MA order is still bullish, and MA50 70433 is still below). But daily MACD bars have been negative for consecutive days and dif has crossed below dea. The post-812k top pullback hasn’t fully played out. Until 76900 is reclaimed, treat this as "step-down consolidation": keep position size small, wait for CPI to settle and for daily MACD/candles to turn positive—that’s the confirmation the trend is starting again.
Risk warning: BTC volatility is high and leverage is dense; the needle-like spikes and liquidity risks inside the step-down are not low. Fee and long/short ratio are only from the current snapshot and can change anytime. Tomorrow’s CPI could amplify volatility.
For reference only; not investment advice.
$BTC $ETH $SOL #BTC #行情分析 #合约 #Bitcoin
145
·
--
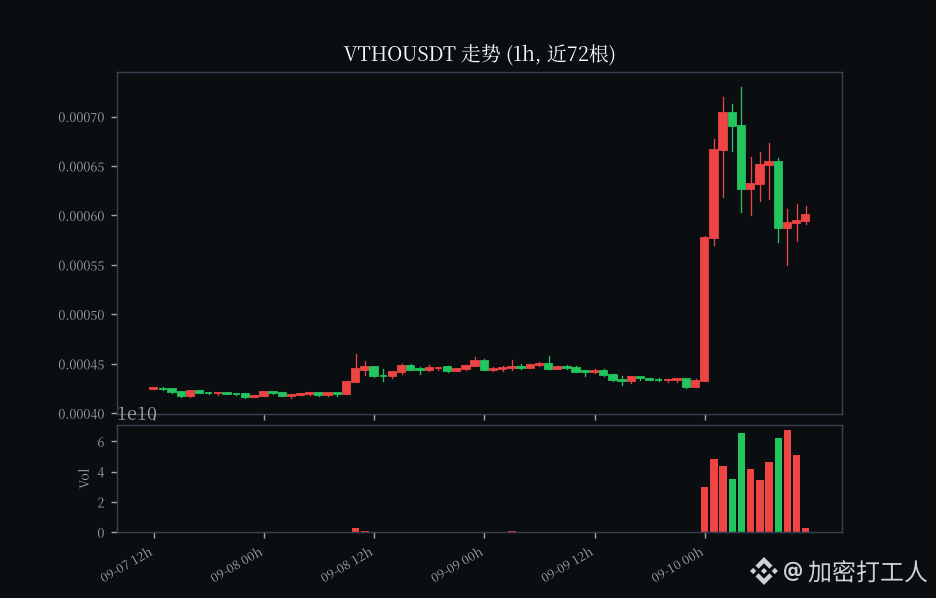
$VTHO current price 0.0006, one day surges 35%🔥 In 7 days, it went from 0.0004 to 0.0007—after each single wave pulse pumps, it immediately fades. It gets dumped back 18% from the highs📉 This coin is VeChain’s gas token, with daily emissions and constant sell pressure😈 Once the profit crowd runs, it turns into a waterfall. I’m shorting $VTHO—respect first, short first!
$VTHO current price 0.0006, one day surges 35%🔥 In 7 days, it went from 0.0004 to 0.0007—after each single wave pulse pumps, it immediately fades. It gets dumped back 18% from the highs📉 This coin is VeChain’s gas token, with daily emissions and constant sell pressure😈 Once the profit crowd runs, it turns into a waterfall. I’m shorting $VTHO —respect first, short first!
734
·
--
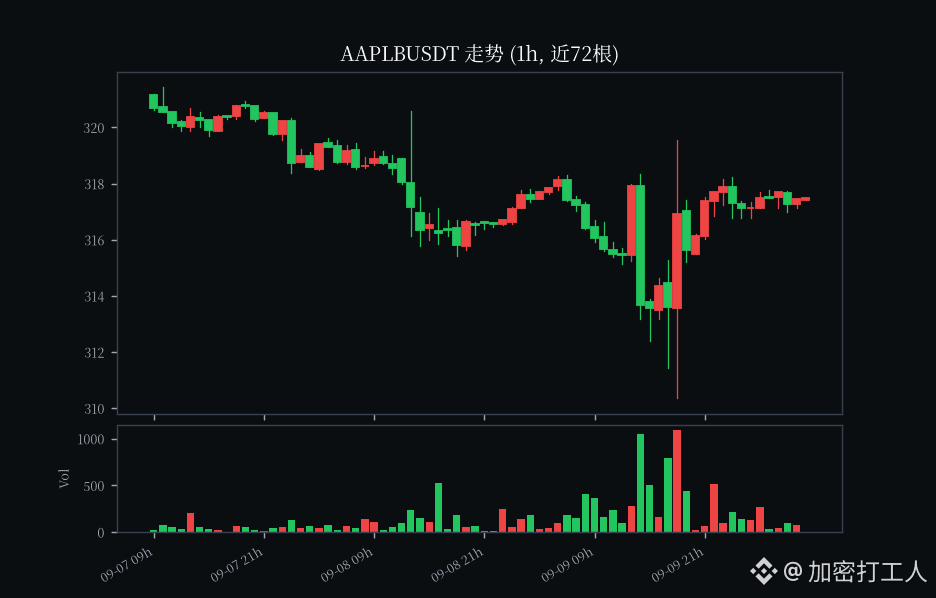
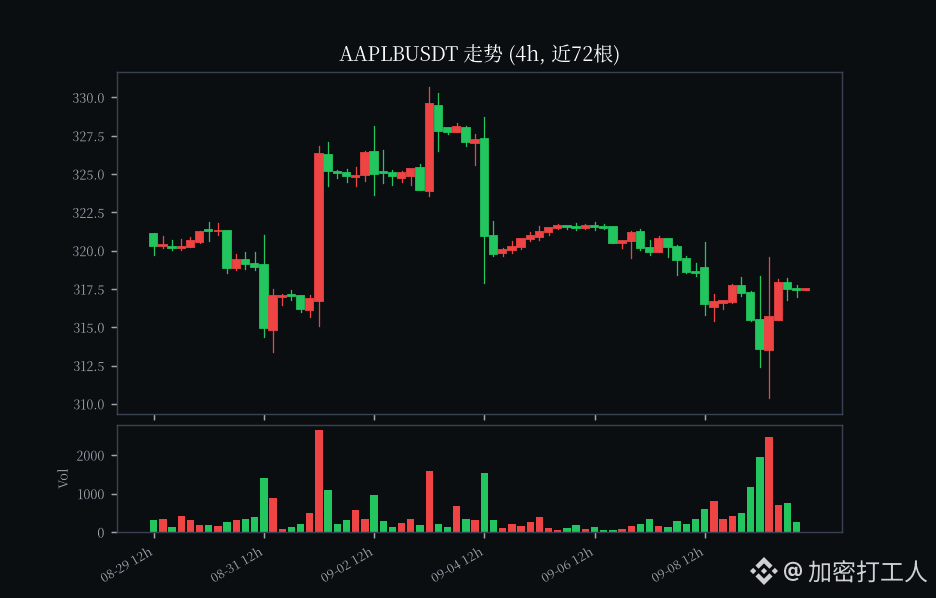
$AAPLB current price 317.49
I happened to scroll past Apple this afternoon; basically I didn’t do anything today. It’s up 0.09%, just grinding around the 317 area.
Honestly, I’m pretty confident in this stock. The iPhone 17 upgrade cycle looks decent. The services business side collects monthly fees very reliably, and the company has plenty of cash on hand—its fundamentals are solid. Today’s movement looks more like sideways waiting for news; I haven’t seen anyone dumping it.
It’s just stuck around the previous high near 319—kind of awkward. There’s still overhead selling pressure, so chasing it right now doesn’t seem worth it.
Do you think Apple can push through? U.S. stocks are volatile—manage your position sizes accordingly. Just for reference, not advice.
$AAPLB $QQQB #美股 #bStocks #technology stocks
$AAPLB current price 317.49
I happened to scroll past Apple this afternoon; basically I didn’t do anything today. It’s up 0.09%, just grinding around the 317 area.
Honestly, I’m pretty confident in this stock. The iPhone 17 upgrade cycle looks decent. The services business side collects monthly fees very reliably, and the company has plenty of cash on hand—its fundamentals are solid. Today’s movement looks more like sideways waiting for news; I haven’t seen anyone dumping it.
It’s just stuck around the previous high near 319—kind of awkward. There’s still overhead selling pressure, so chasing it right now doesn’t seem worth it.
Do you think Apple can push through? U.S. stocks are volatile—manage your position sizes accordingly. Just for reference, not advice.
$AAPLB $QQQB #美股 #bStocks #technology stocks
I happened to scroll past Apple this afternoon; basically I didn’t do anything today. It’s up 0.09%, just grinding around the 317 area.
Honestly, I’m pretty confident in this stock. The iPhone 17 upgrade cycle looks decent. The services business side collects monthly fees very reliably, and the company has plenty of cash on hand—its fundamentals are solid. Today’s movement looks more like sideways waiting for news; I haven’t seen anyone dumping it.
It’s just stuck around the previous high near 319—kind of awkward. There’s still overhead selling pressure, so chasing it right now doesn’t seem worth it.
Do you think Apple can push through? U.S. stocks are volatile—manage your position sizes accordingly. Just for reference, not advice.
$AAPLB $QQQB #美股 #bStocks #technology stocks
337
·
--
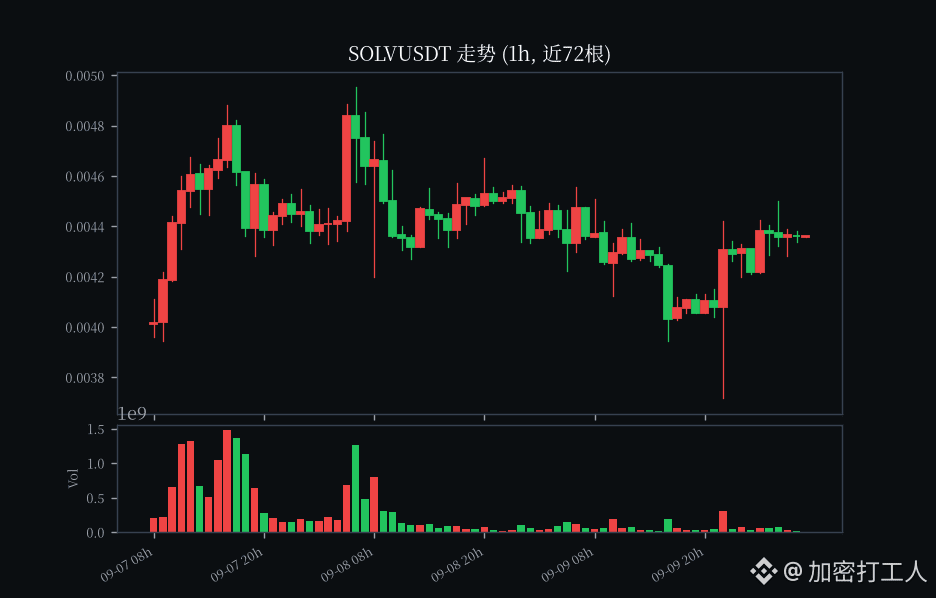
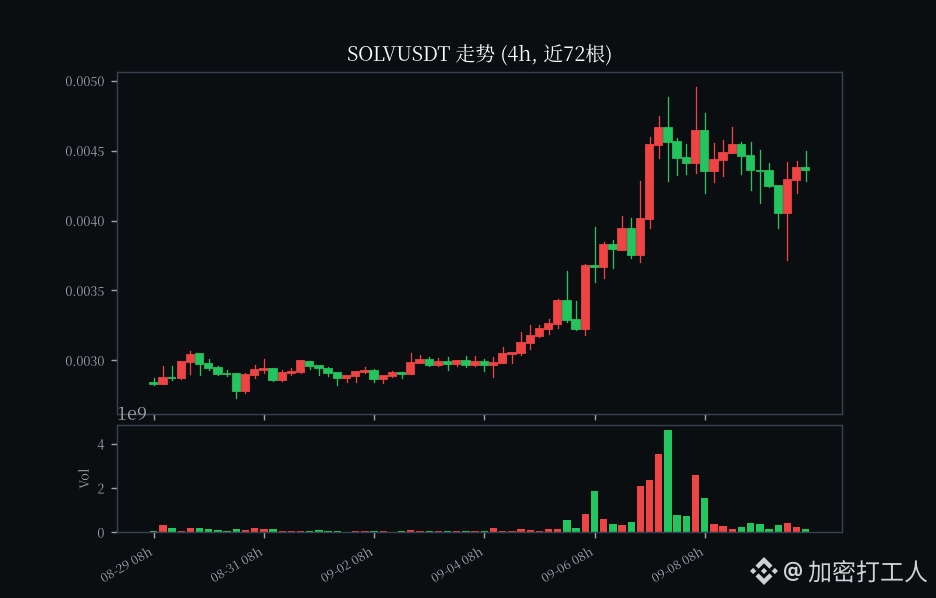
$SOLV 现价0.00436
SOLV is one of the BTCFi leaders on Binance Alpha, focusing on SolvBTC yield-bearing Bitcoin products. It turns idle BTC into a yield-generating, cross-chain liquid asset. In terms of narrative, it leverages the Babylon staking track plus Bitcoin finance.
Live market: Down 2.68% over the past 24h. Current price is 0.00436. Intraday range: 0.00381–0.0045. 24h trading volume is about 1.92 million USDT. Overall, it’s weak and consolidating.
Opportunities: Once the BTCFi sector rotates higher as BTC strengthens, small-cap Alphas like SOLV often show greater upside elasticity. Users holding Binance Alpha points can also stack an additional layer of expected “points farming” momentum.
Risk warning: Small market cap, thinner liquidity, and large daily volatility. Alpha token unlocks and sentiment shifts happen quickly—don’t get carried away with position sizing; implement strict stop-losses.
$SOLV $BTC #币安Alpha #BTCFi #山寨币
$SOLV 现价0.00436
SOLV is one of the BTCFi leaders on Binance Alpha, focusing on SolvBTC yield-bearing Bitcoin products. It turns idle BTC into a yield-generating, cross-chain liquid asset. In terms of narrative, it leverages the Babylon staking track plus Bitcoin finance.
Live market: Down 2.68% over the past 24h. Current price is 0.00436. Intraday range: 0.00381–0.0045. 24h trading volume is about 1.92 million USDT. Overall, it’s weak and consolidating.
Opportunities: Once the BTCFi sector rotates higher as BTC strengthens, small-cap Alphas like SOLV often show greater upside elasticity. Users holding Binance Alpha points can also stack an additional layer of expected “points farming” momentum.
Risk warning: Small market cap, thinner liquidity, and large daily volatility. Alpha token unlocks and sentiment shifts happen quickly—don’t get carried away with position sizing; implement strict stop-losses.
$SOLV $BTC #币安Alpha #BTCFi #山寨币
SOLV is one of the BTCFi leaders on Binance Alpha, focusing on SolvBTC yield-bearing Bitcoin products. It turns idle BTC into a yield-generating, cross-chain liquid asset. In terms of narrative, it leverages the Babylon staking track plus Bitcoin finance.
Live market: Down 2.68% over the past 24h. Current price is 0.00436. Intraday range: 0.00381–0.0045. 24h trading volume is about 1.92 million USDT. Overall, it’s weak and consolidating.
Opportunities: Once the BTCFi sector rotates higher as BTC strengthens, small-cap Alphas like SOLV often show greater upside elasticity. Users holding Binance Alpha points can also stack an additional layer of expected “points farming” momentum.
Risk warning: Small market cap, thinner liquidity, and large daily volatility. Alpha token unlocks and sentiment shifts happen quickly—don’t get carried away with position sizing; implement strict stop-losses.
$SOLV $BTC #币安Alpha #BTCFi #山寨币
1
337
·
--
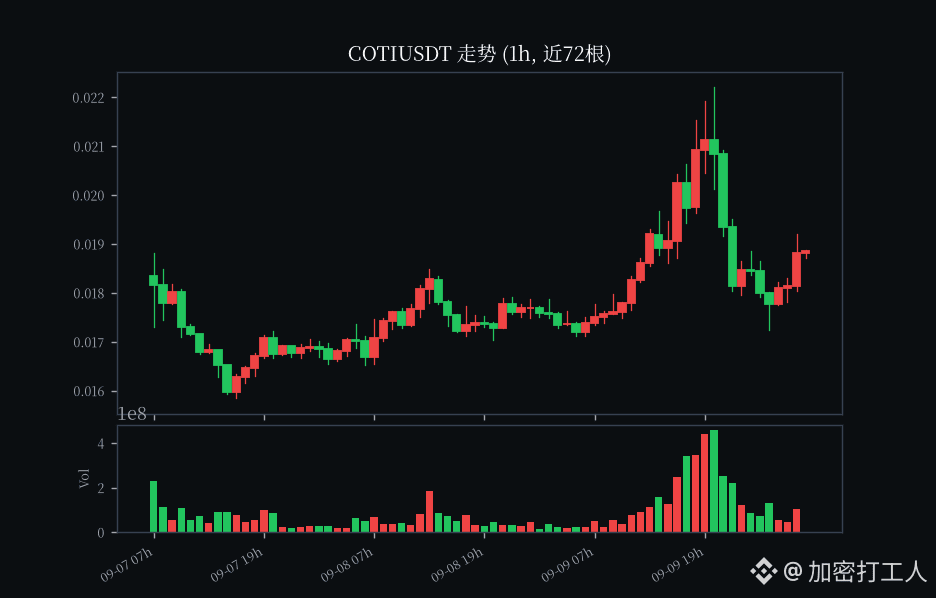
$COTI current price $0.01882, 7-day surge up 46%🔥 If it tries to push to 0.022, it’ll deflate—then from the peak until now it’s been soft and has dumped back to 15%😅 A one-wave shill pump is done with low volume; those little gains from the bulls will be bled out eventually 📉 I’m shorting $COTI—if you’re with me, hit 1 ⚡
$COTI current price $0.01882, 7-day surge up 46%🔥 If it tries to push to 0.022, it’ll deflate—then from the peak until now it’s been soft and has dumped back to 15%😅 A one-wave shill pump is done with low volume; those little gains from the bulls will be bled out eventually 📉 I’m shorting $COTI —if you’re with me, hit 1 ⚡
595
·
--
$NVDAB current price 223.04
I took a quick look at Nvidia this morning. It’s down a little more than 1% today, and it’s hovering around the 223 level.
Honestly, I’m quite bullish on its momentum. That AI wave of capital expenditures hasn’t really stopped; demand from data centers is still strong, and Blackwell capacity is gradually ramping up as well. The fundamentals are basically fine. This kind of pullback today feels more like a breather after a very fast run-up, and trading volume isn’t overly elevated.
It’s just that in the short term, this level is a bit tricky. There’s still some selling pressure near the prior highs, so chasing at the moment doesn’t feel that comfortable.
What do you think— is this pullback a good time to get in, or does it still need to shake things out some more? U.S. market volatility is high—manage your position sizing yourself. For reference only.
$NVDAB $QQQB #美股 #bStocks #AI stocks
$NVDAB current price 223.04
I took a quick look at Nvidia this morning. It’s down a little more than 1% today, and it’s hovering around the 223 level.
Honestly, I’m quite bullish on its momentum. That AI wave of capital expenditures hasn’t really stopped; demand from data centers is still strong, and Blackwell capacity is gradually ramping up as well. The fundamentals are basically fine. This kind of pullback today feels more like a breather after a very fast run-up, and trading volume isn’t overly elevated.
It’s just that in the short term, this level is a bit tricky. There’s still some selling pressure near the prior highs, so chasing at the moment doesn’t feel that comfortable.
What do you think— is this pullback a good time to get in, or does it still need to shake things out some more? U.S. market volatility is high—manage your position sizing yourself. For reference only.
$NVDAB $QQQB #美股 #bStocks #AI stocks
I took a quick look at Nvidia this morning. It’s down a little more than 1% today, and it’s hovering around the 223 level.
Honestly, I’m quite bullish on its momentum. That AI wave of capital expenditures hasn’t really stopped; demand from data centers is still strong, and Blackwell capacity is gradually ramping up as well. The fundamentals are basically fine. This kind of pullback today feels more like a breather after a very fast run-up, and trading volume isn’t overly elevated.
It’s just that in the short term, this level is a bit tricky. There’s still some selling pressure near the prior highs, so chasing at the moment doesn’t feel that comfortable.
What do you think— is this pullback a good time to get in, or does it still need to shake things out some more? U.S. market volatility is high—manage your position sizing yourself. For reference only.
$NVDAB $QQQB #美股 #bStocks #AI stocks
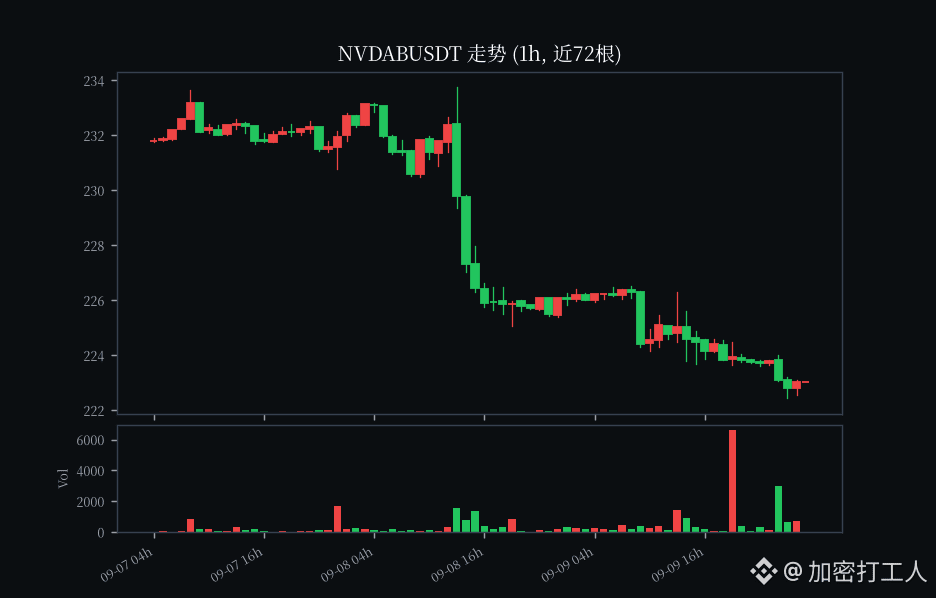
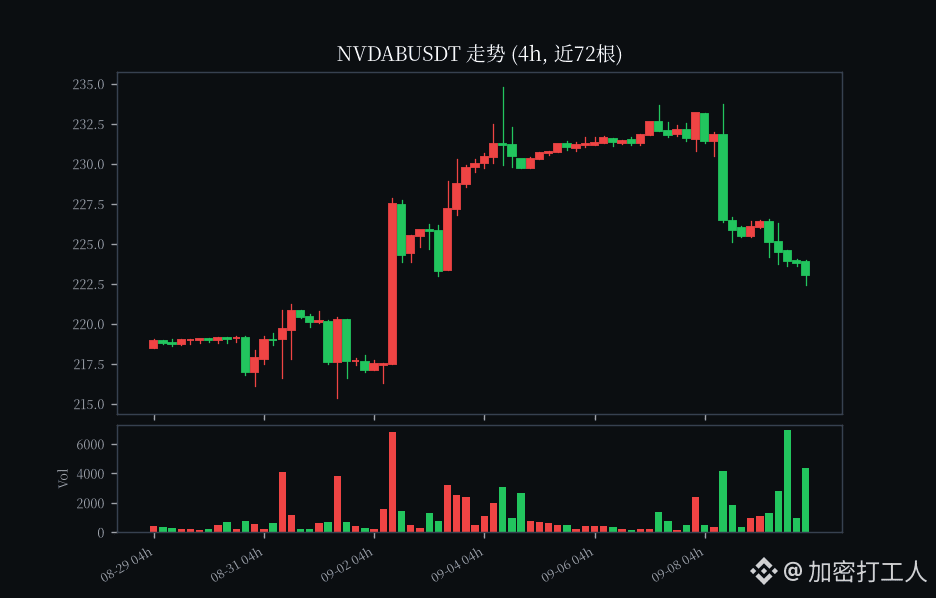
248
·
--
$ASTER current price 0.718
Binance Alpha early session roundup 👇
ASTER is currently at 0.718, down 5.03% in 24h, with trading volume of $14.76 million. Intraday high 0.767 / low 0.709. The bears are keeping pressure on; volume has shrunk to near a one-week low.
On the 1h chart, price has been grinding around the 0.72 area repeatedly. The 4h chart still hasn’t shown a reversal signal—so for the short term, focus first on whether the 0.70 integer level can hold.
Today, the Alpha sector is generally rather cold overall, and capital is waiting for new narratives. If you still hold an Alpha position, are you going to hold or exit? Let’s discuss in the comments 👇
Risk warning: Alpha coins are extremely volatile. The above is for information sharing only and does not constitute investment advice.
$ASTER $BNB #币安Alpha #山寨币 #刷分
$ASTER current price 0.718
Binance Alpha early session roundup 👇
ASTER is currently at 0.718, down 5.03% in 24h, with trading volume of $14.76 million. Intraday high 0.767 / low 0.709. The bears are keeping pressure on; volume has shrunk to near a one-week low.
On the 1h chart, price has been grinding around the 0.72 area repeatedly. The 4h chart still hasn’t shown a reversal signal—so for the short term, focus first on whether the 0.70 integer level can hold.
Today, the Alpha sector is generally rather cold overall, and capital is waiting for new narratives. If you still hold an Alpha position, are you going to hold or exit? Let’s discuss in the comments 👇
Risk warning: Alpha coins are extremely volatile. The above is for information sharing only and does not constitute investment advice.
$ASTER $BNB #币安Alpha #山寨币 #刷分
Binance Alpha early session roundup 👇
ASTER is currently at 0.718, down 5.03% in 24h, with trading volume of $14.76 million. Intraday high 0.767 / low 0.709. The bears are keeping pressure on; volume has shrunk to near a one-week low.
On the 1h chart, price has been grinding around the 0.72 area repeatedly. The 4h chart still hasn’t shown a reversal signal—so for the short term, focus first on whether the 0.70 integer level can hold.
Today, the Alpha sector is generally rather cold overall, and capital is waiting for new narratives. If you still hold an Alpha position, are you going to hold or exit? Let’s discuss in the comments 👇
Risk warning: Alpha coins are extremely volatile. The above is for information sharing only and does not constitute investment advice.
$ASTER $BNB #币安Alpha #山寨币 #刷分
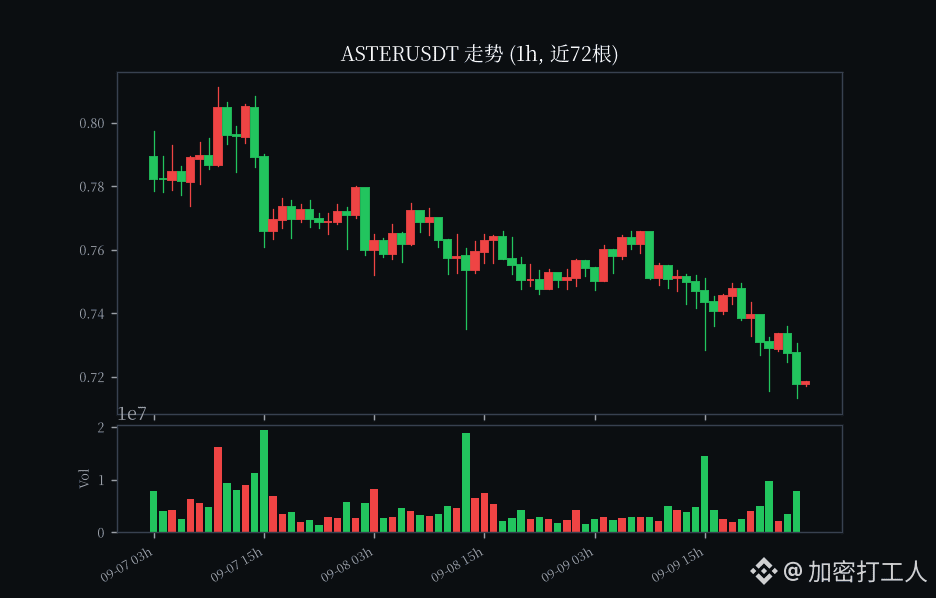
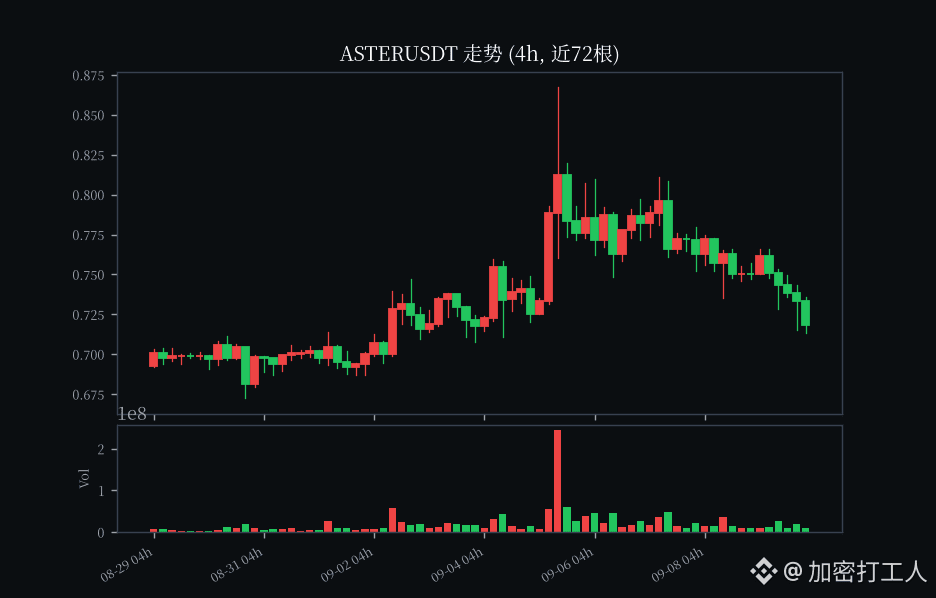
1
1.1k
·
--
🎙️ Build the Binance Square, hold BNB|Thursday, last night I was bitten by someone in Biden's family’s恶doge, what about you? [emoji] Come chat~

End
04 h 57 m 12 s
10.2k
35
44
·
--
$IOST current price $0.00158, 24h surge 94.76% 🚀 In 7 days, it jumped from 0.00058 to 0.00222, up 168% 💀 Now it's dumped back down 29% from the peak; once volume dries up, confidence deflates ⚠️ I’m shorting $IOST—short first as a mark of respect! Drop a comment if you’re following 😏
$IOST current price $0.00158, 24h surge 94.76% 🚀 In 7 days, it jumped from 0.00058 to 0.00222, up 168% 💀 Now it's dumped back down 29% from the peak; once volume dries up, confidence deflates ⚠️ I’m shorting $IOST —short first as a mark of respect! Drop a comment if you’re following 😏
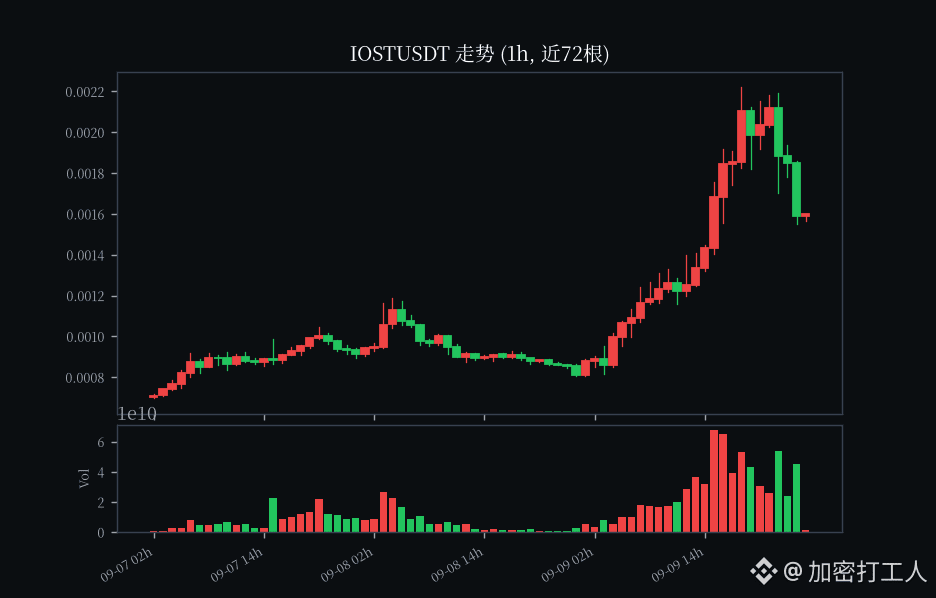
1
2
3k
Log in to explore more content
Join global crypto users on Binance Square
⚡️ Get latest and useful information about crypto.
💬 Trusted by the world’s largest crypto exchange.
👍 Discover real insights from verified creators.
Email / Phone number
Trending Topics
CPIWatch
86.1M views
499,023 Discussing
Share & Win Traffic Reward in our Trending Hashtag Campaign
✨Topic: Will CPI Trigger Rate Hike?
👉How to Join:
Publish a short post or article with hashtag #CPIWatch
Create content based on the below two angles:
- Nonfarm payrolls beat expectations and CPI is around the corner, do you think the Fed will hike or hold the rate?
- Bullish or bearish? Share your take and showcase your stocks or gold trade/holdings with our trade sharing widget.
🚀Campaign Period:
- 2026-09-11 3:00 - 2026-09-12 9:00 UTC
🎁Reward:
- Qualified posts that comply with the above guidelines and contain more than 100 words will be reviewed and may receive a random traffic boost of 500 to 3,000 views. You will receive a notification from your feed secretary if your post is selected.
- Get a chance to have your article featured on Binance Square Official
Need ideas for your post? Visit the topic page #CPIWatch or the Square Guide on How to Post for Better Reach.
Binance Square Official
·193 Likes
·312.5k views
USToSanctionBigBankMonday
138 views
32 Discussing
TrumpDeclinesSaudiRequestToStrikeHouthis
6,128 views
164 Discussing