
dharztrend
1k Posts

dharztrend
Report
Block User
BTC trader focused on price action, market structure, and disciplined trading. Sharing Bitcoin chart analysis with clear entry points, stop loss, and take profi
Open Trade
Occasional Trader
4.8 Years
308 Following
472 Followers
1.5K+ Liked
Posts
Portfolio
All
Quotes
Videos
·
--
📊 ONEUSDT | Potential Bullish Reversal?
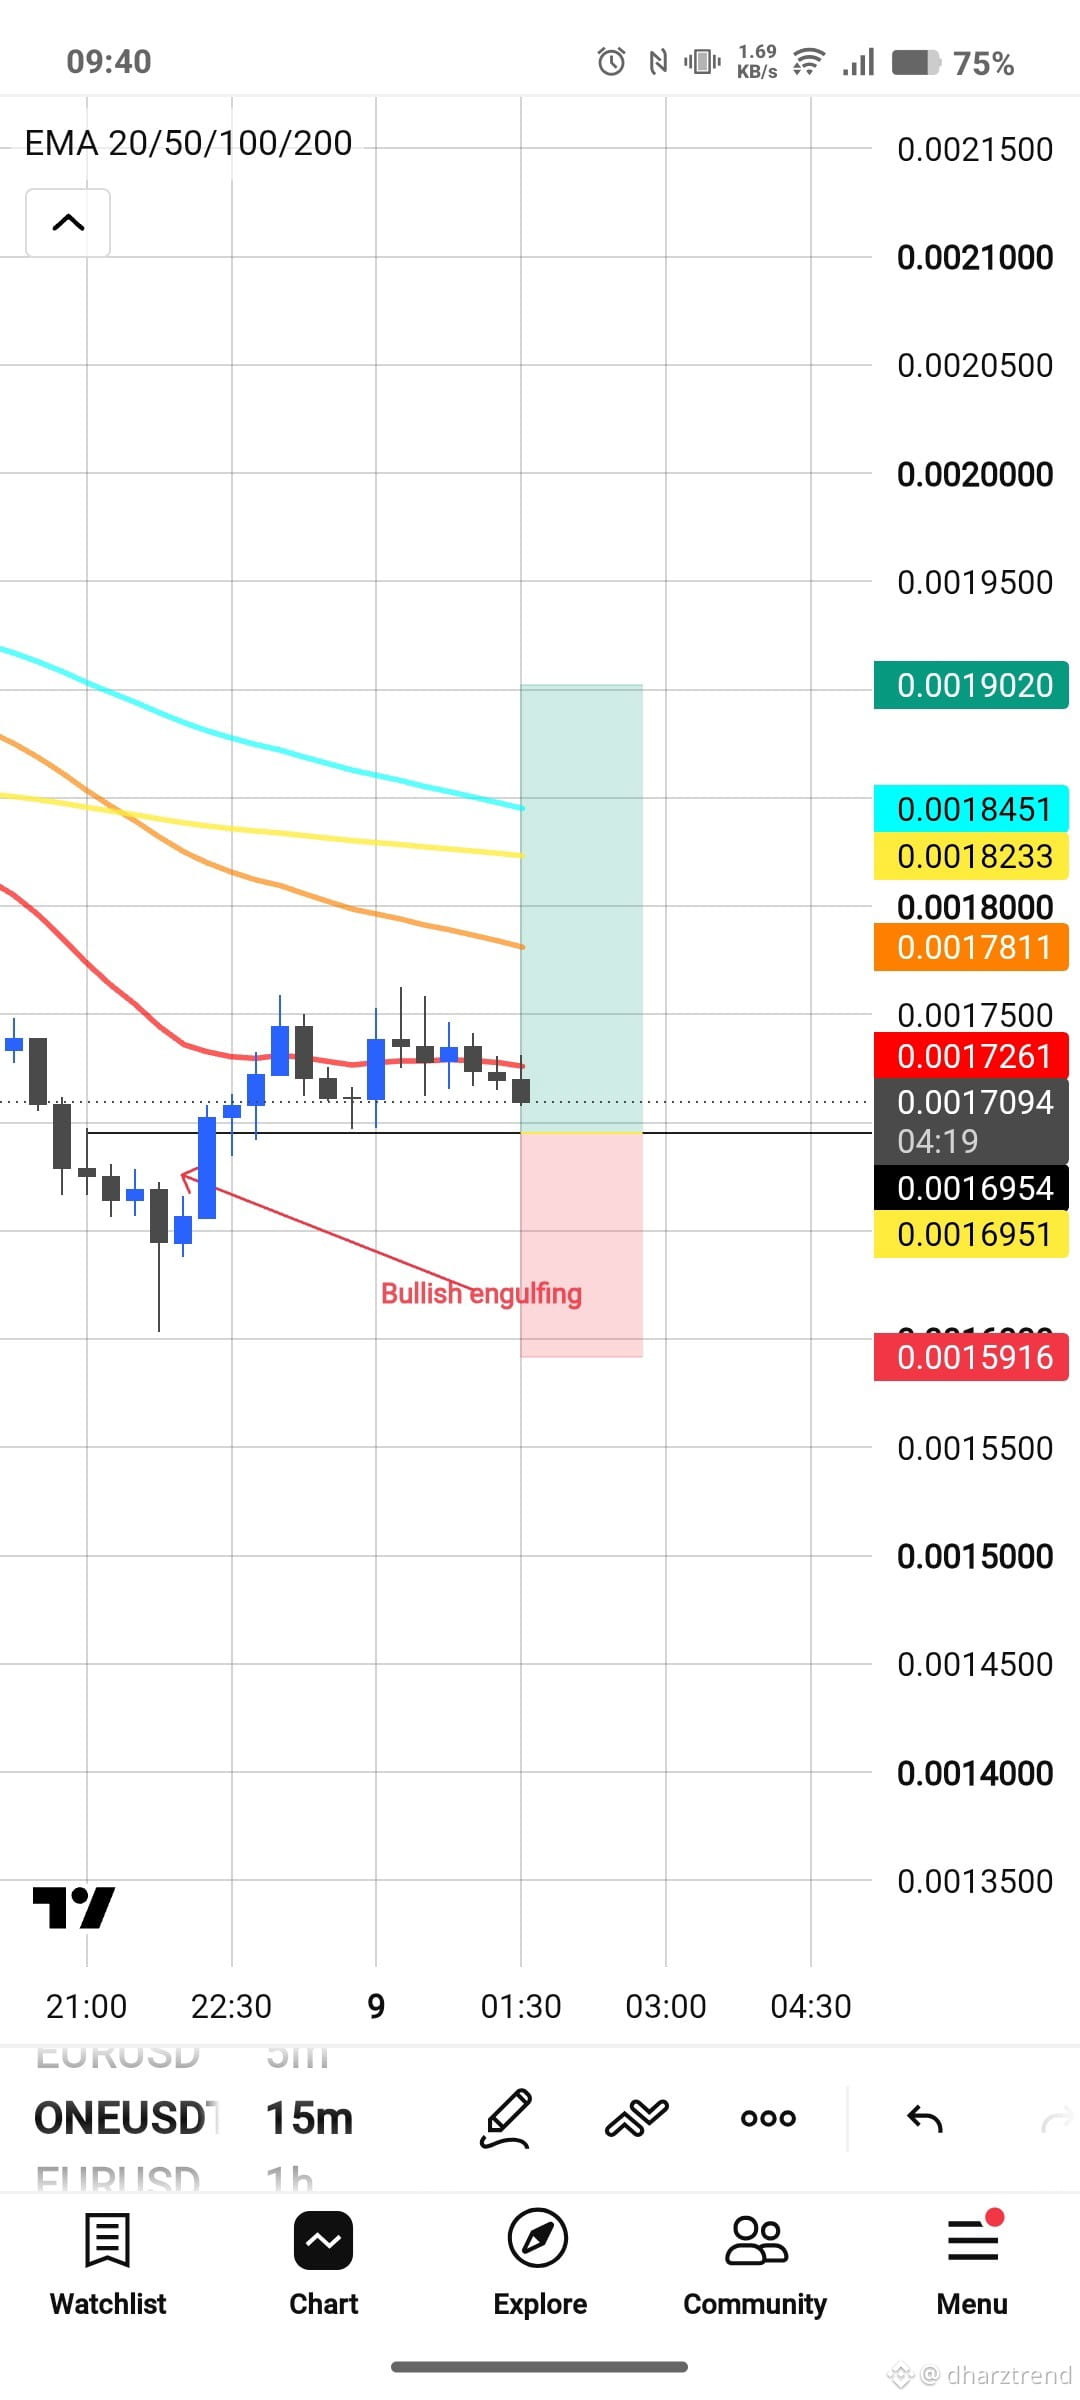
On the 15-minute timeframe, ONEUSDT is showing a potential bullish reversal after forming a Bullish Engulfing pattern.
The price is attempting to recover after a previous decline, but there is still resistance from the EMA 20, 50, 100, and 200.
📍 Trade Setup:
Entry: 0.0016954
Stop Loss: 0.0015916
Take Profit: 0.0019020
My Trading Outlook:
I'm watching for a bullish confirmation and a possible breakout above the EMA 20. If buyers gain momentum, the price could continue moving higher.
However, confirmation is important. Never enter a trade based on a candle pattern alone. Always manage your risk.
#ONEUSDT #CryptoTrading #PriceAction #TechnicalAnalysis #Binance
$ONE
{future}(ONEUSDT)
📊 ONEUSDT | Potential Bullish Reversal?
On the 15-minute timeframe, ONEUSDT is showing a potential bullish reversal after forming a Bullish Engulfing pattern.
The price is attempting to recover after a previous decline, but there is still resistance from the EMA 20, 50, 100, and 200.
📍 Trade Setup:
Entry: 0.0016954
Stop Loss: 0.0015916
Take Profit: 0.0019020
My Trading Outlook:
I'm watching for a bullish confirmation and a possible breakout above the EMA 20. If buyers gain momentum, the price could continue moving higher.
However, confirmation is important. Never enter a trade based on a candle pattern alone. Always manage your risk.
#ONEUSDT #CryptoTrading #PriceAction #TechnicalAnalysis #Binance
$ONE
On the 15-minute timeframe, ONEUSDT is showing a potential bullish reversal after forming a Bullish Engulfing pattern.
The price is attempting to recover after a previous decline, but there is still resistance from the EMA 20, 50, 100, and 200.
📍 Trade Setup:
Entry: 0.0016954
Stop Loss: 0.0015916
Take Profit: 0.0019020
My Trading Outlook:
I'm watching for a bullish confirmation and a possible breakout above the EMA 20. If buyers gain momentum, the price could continue moving higher.
However, confirmation is important. Never enter a trade based on a candle pattern alone. Always manage your risk.
#ONEUSDT #CryptoTrading #PriceAction #TechnicalAnalysis #Binance
$ONE
201
·
--
IDOL/USD 15m Setup (Long Bias)
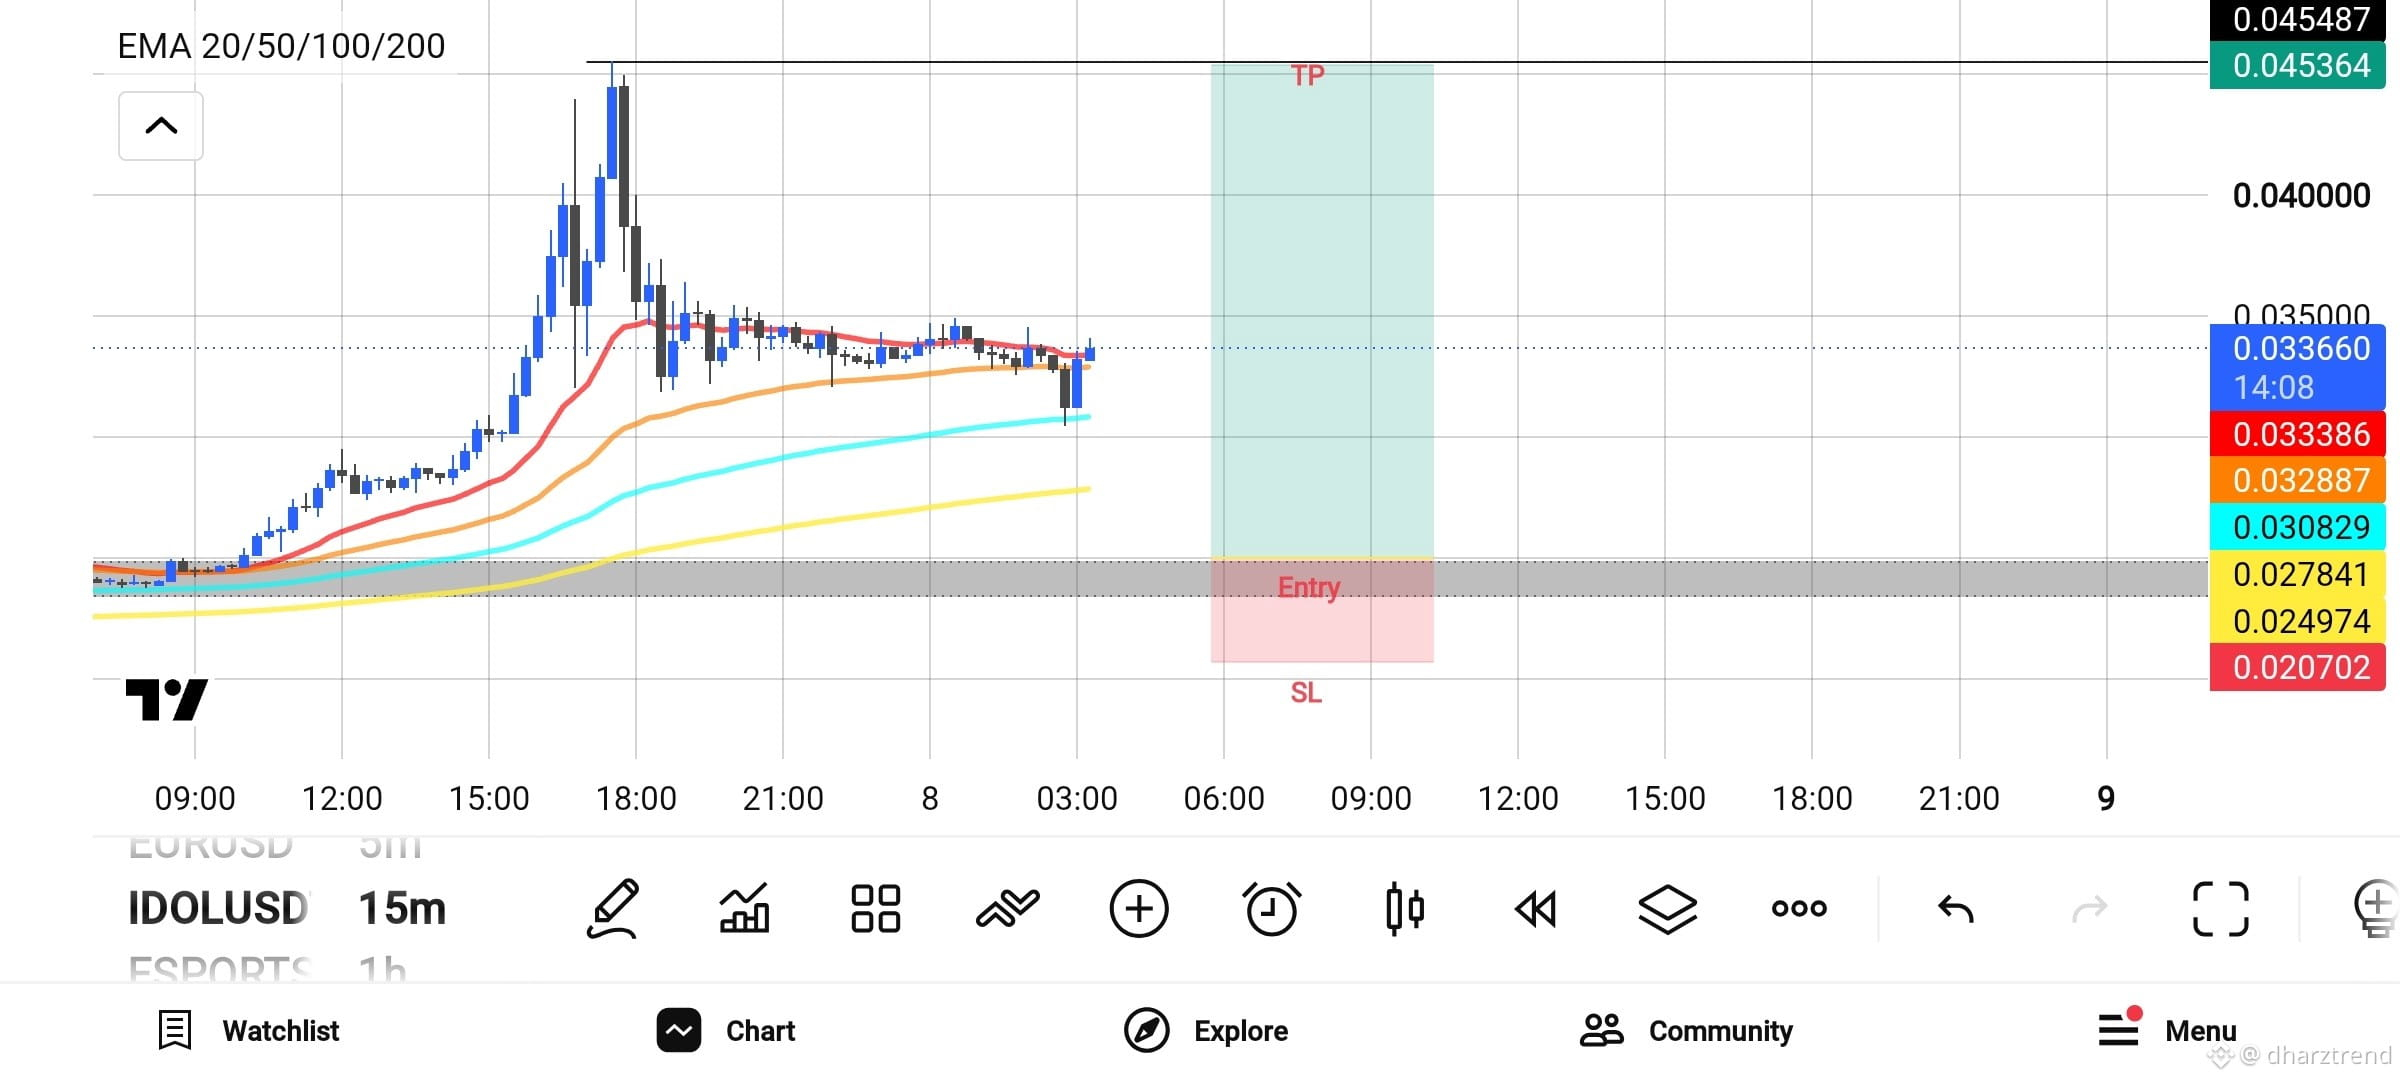
Chart shows clear pullback after the earlier spike. Price is testing the lower EMAs while the higher ones are still sloping up.
Trade Idea:
Entry Zone: 0.0278 – 0.0308 (highlighted red box)
Stop Loss: Below 0.0207
Take Profit: 0.0453 – 0.0455 (highlighted green box)
Risk-reward looks solid if it holds the demand area and reclaims the 20/50 EMA.$IDOL
{future}(IDOLUSDT)
IDOL/USD 15m Setup (Long Bias)
Chart shows clear pullback after the earlier spike. Price is testing the lower EMAs while the higher ones are still sloping up.
Trade Idea:
Entry Zone: 0.0278 – 0.0308 (highlighted red box)
Stop Loss: Below 0.0207
Take Profit: 0.0453 – 0.0455 (highlighted green box)
Risk-reward looks solid if it holds the demand area and reclaims the 20/50 EMA.$IDOL
Chart shows clear pullback after the earlier spike. Price is testing the lower EMAs while the higher ones are still sloping up.
Trade Idea:
Entry Zone: 0.0278 – 0.0308 (highlighted red box)
Stop Loss: Below 0.0207
Take Profit: 0.0453 – 0.0455 (highlighted green box)
Risk-reward looks solid if it holds the demand area and reclaims the 20/50 EMA.$IDOL
476
·
--
SOXL – Bearish Market Structure | 4H Analysis
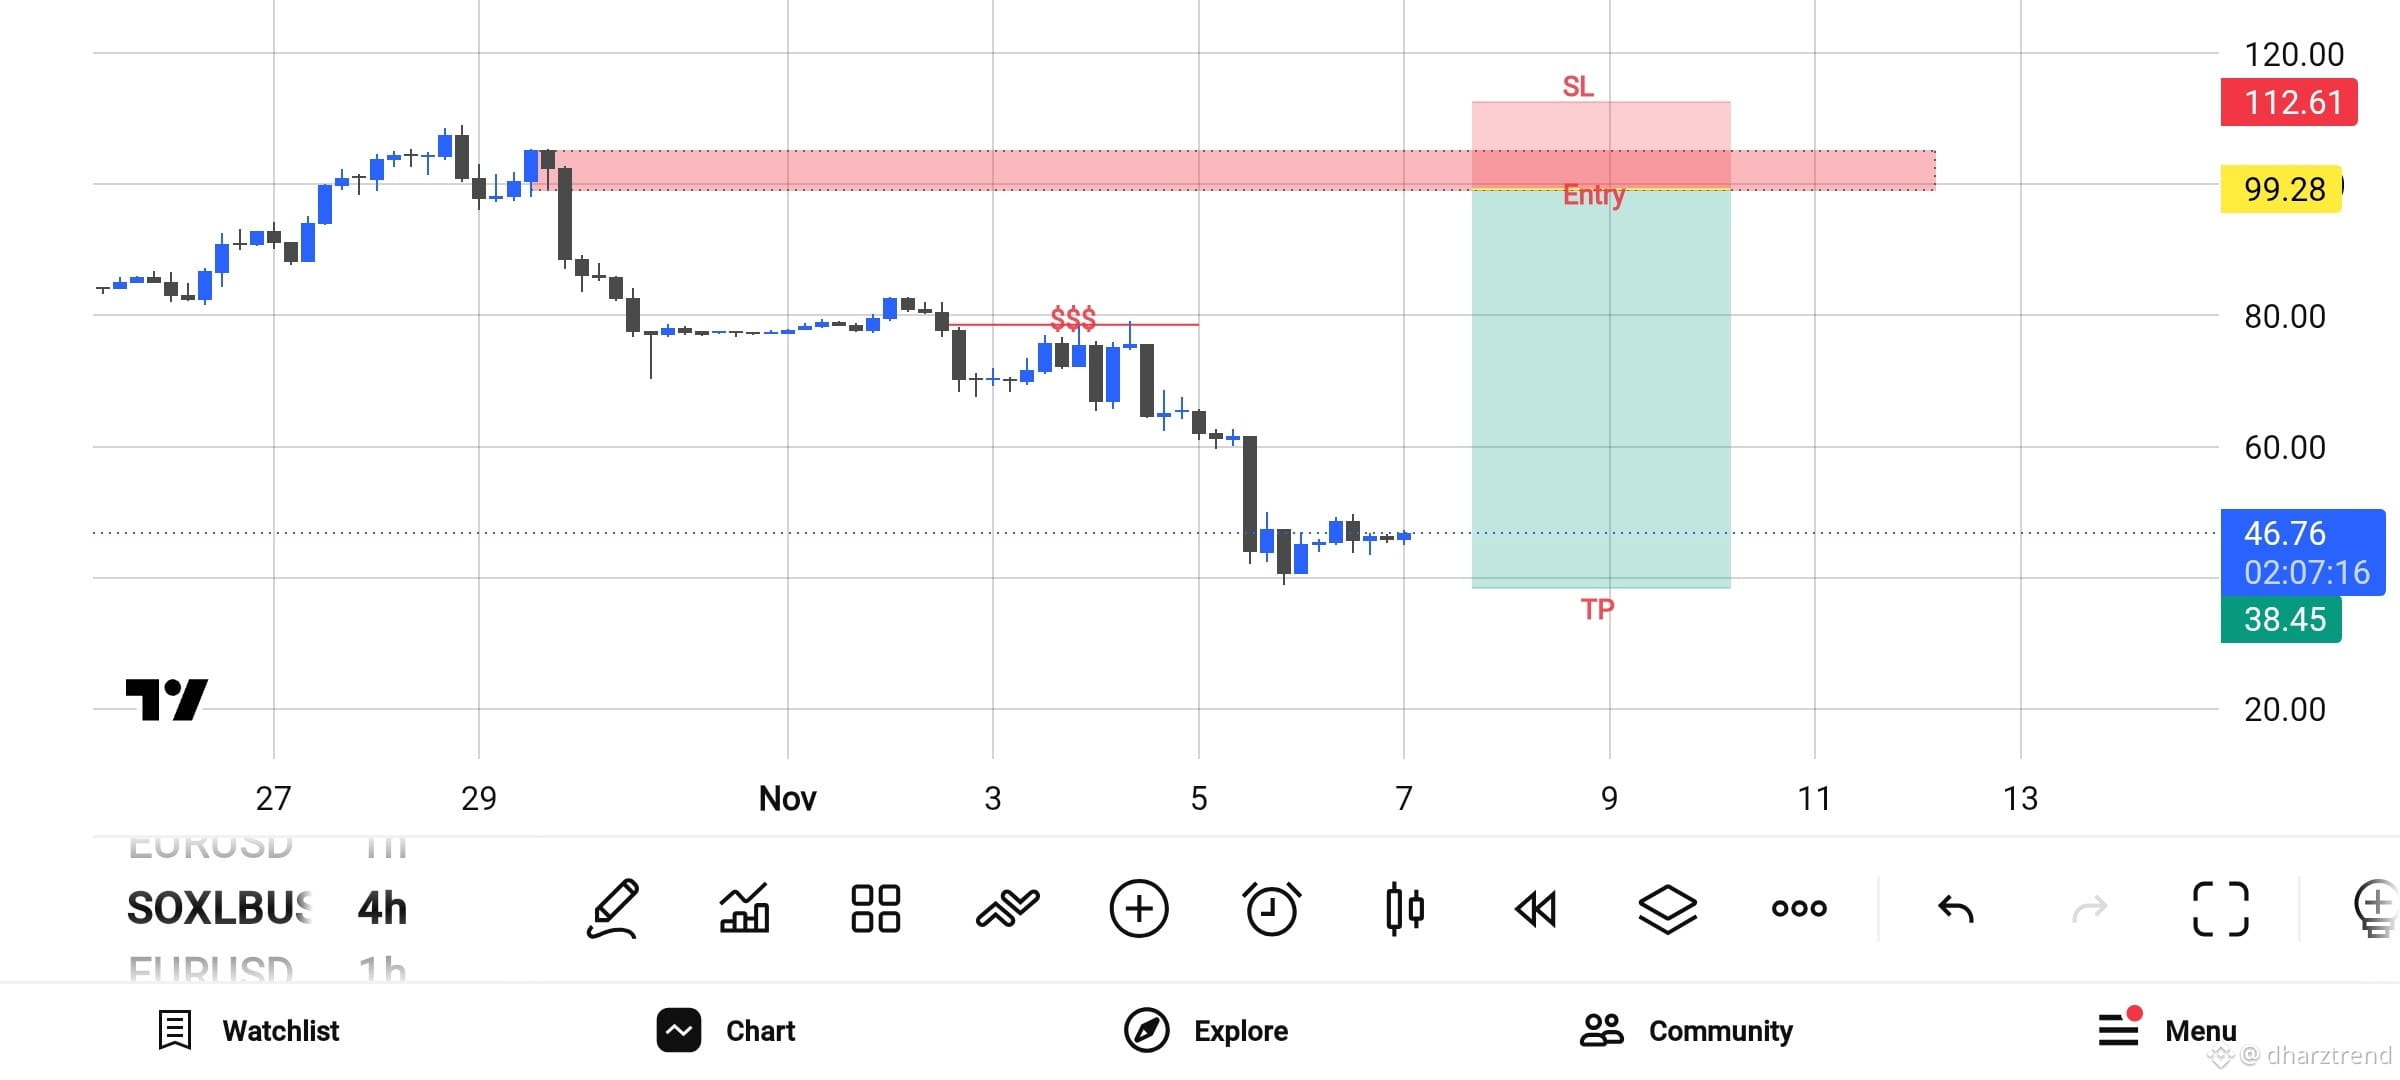
SOXL continues to show strong bearish momentum on the 4H timeframe.
My trading setup focuses on a potential short position:
🔴 Entry: $99.28
🛑 Stop Loss: $112.61
🎯 Take Profit: $38.45
Market Outlook:
- Price has broken below previous support levels.
- Sellers remain in control.
- Waiting for a pullback toward the supply zone before considering a short entry.
- The bearish structure remains my primary bias.
Patience is important. I don't chase the market; I wait for price to come to my planned entry.
Remember: Every trade carries risk. Always manage your position size and protect your capital.
#SOXL #TechnicalAnalysis #PriceAction #TradingStrategy #cryptotrading $SOXLB
{spot}(SOXLBUSDT)
SOXL – Bearish Market Structure | 4H Analysis
SOXL continues to show strong bearish momentum on the 4H timeframe.
My trading setup focuses on a potential short position:
🔴 Entry: $99.28
🛑 Stop Loss: $112.61
🎯 Take Profit: $38.45
Market Outlook:
- Price has broken below previous support levels.
- Sellers remain in control.
- Waiting for a pullback toward the supply zone before considering a short entry.
- The bearish structure remains my primary bias.
Patience is important. I don't chase the market; I wait for price to come to my planned entry.
Remember: Every trade carries risk. Always manage your position size and protect your capital.
#SOXL #TechnicalAnalysis #PriceAction #TradingStrategy #cryptotrading $SOXLB
SOXL continues to show strong bearish momentum on the 4H timeframe.
My trading setup focuses on a potential short position:
🔴 Entry: $99.28
🛑 Stop Loss: $112.61
🎯 Take Profit: $38.45
Market Outlook:
- Price has broken below previous support levels.
- Sellers remain in control.
- Waiting for a pullback toward the supply zone before considering a short entry.
- The bearish structure remains my primary bias.
Patience is important. I don't chase the market; I wait for price to come to my planned entry.
Remember: Every trade carries risk. Always manage your position size and protect your capital.
#SOXL #TechnicalAnalysis #PriceAction #TradingStrategy #cryptotrading $SOXLB
1
421
·
--
📈 BULLISH REVERSAL SETUP – WATCH THIS ZONE!
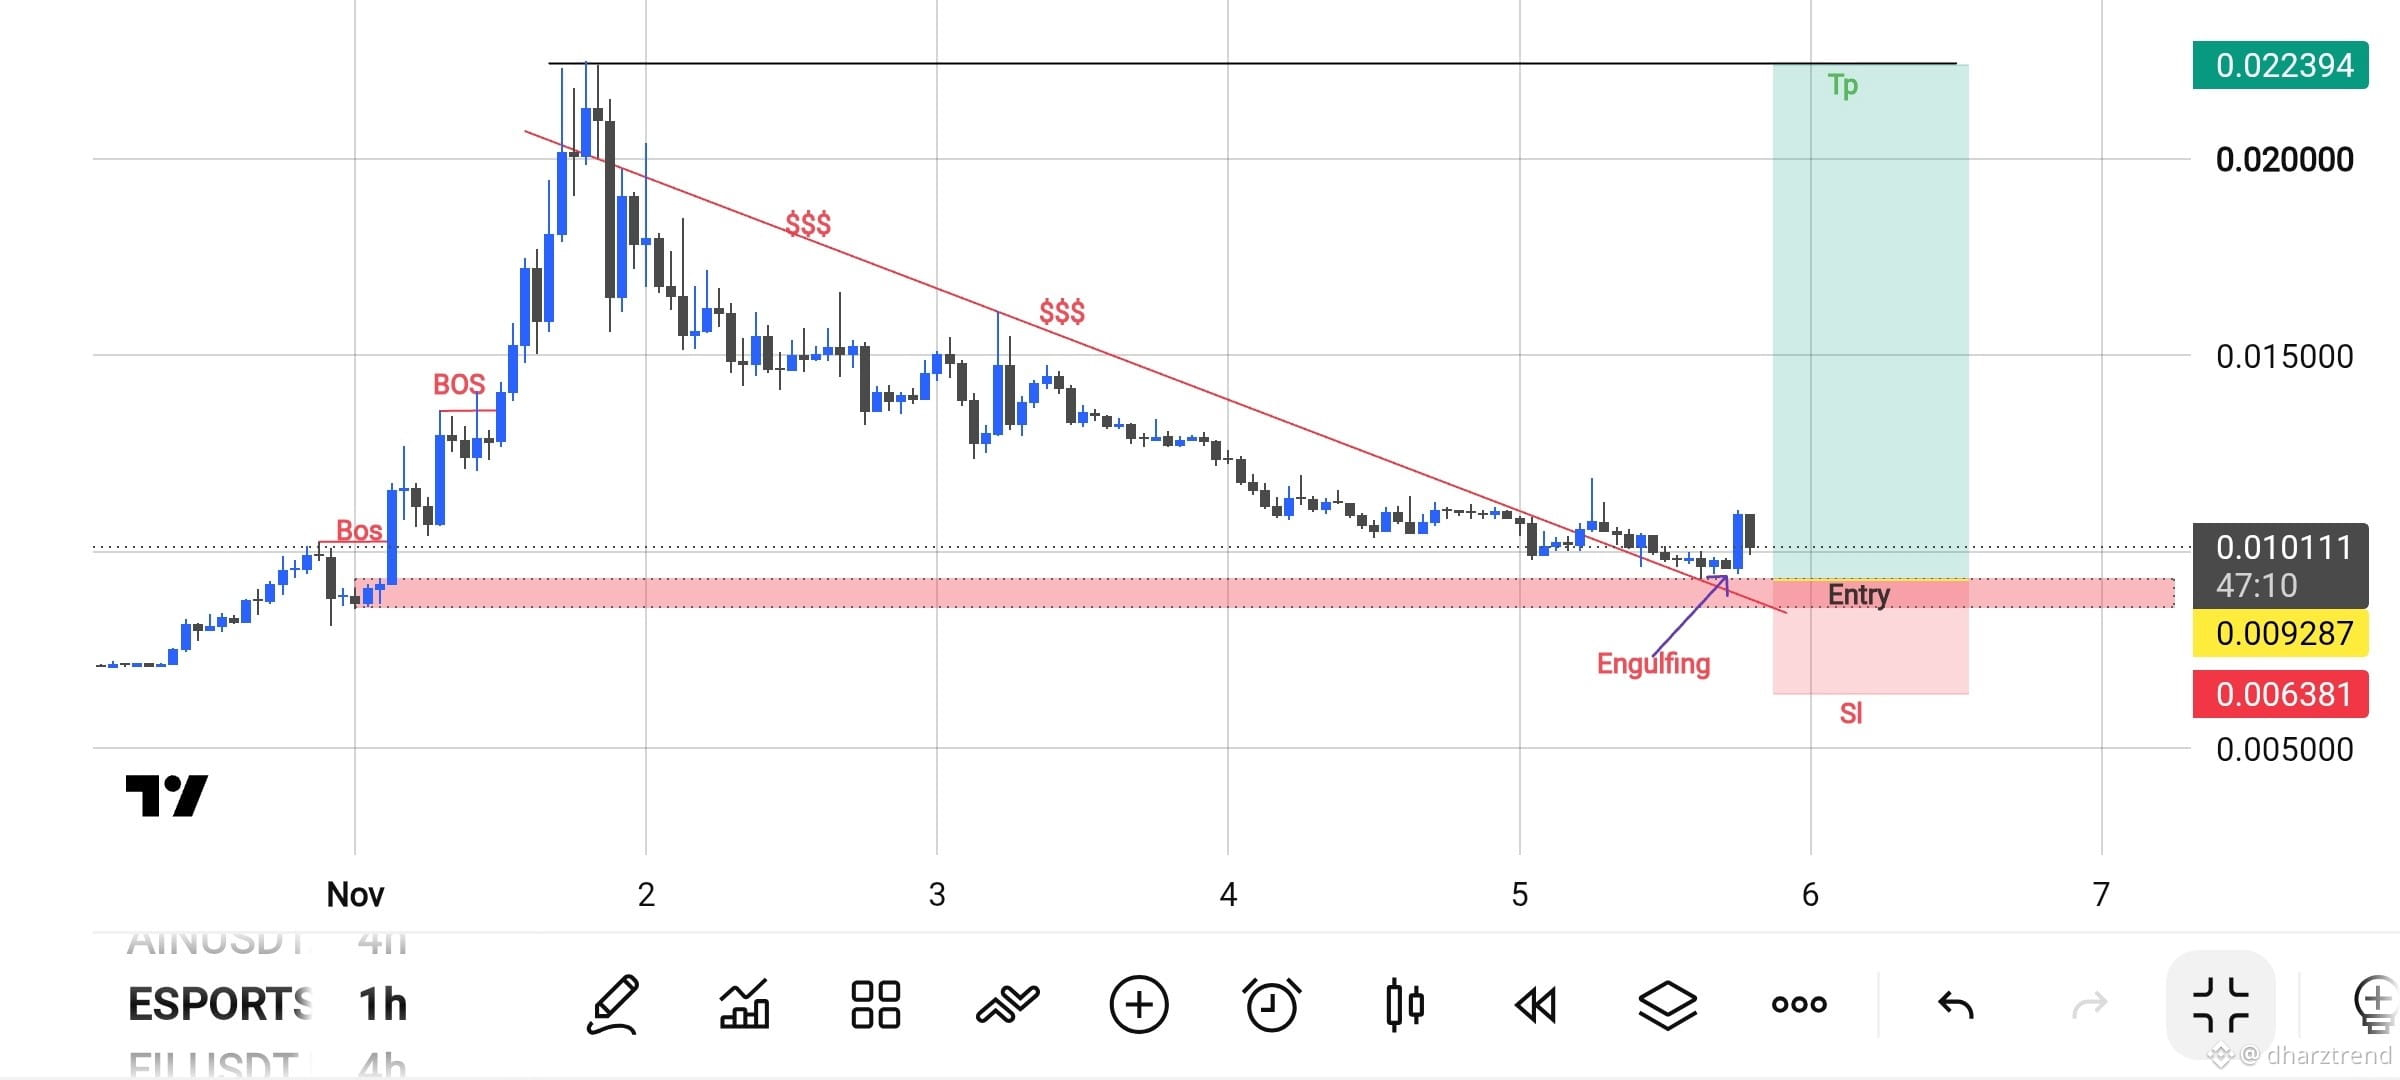
After a prolonged downtrend, price is approaching a major support and demand zone.
Here's what I'm watching:
🔹 Market Structure: Previous BOS shows bullish momentum history.
🔹 Trendline: Price is testing the descending resistance trendline.
🔹 Support Zone: Buyers are showing interest around the 0.0093–0.0101 area.
🔹 Confirmation: A bullish engulfing candle could signal a potential reversal.
🎯 Entry: 0.009287
🛑 Stop Loss: 0.006381
🚀 Take Profit: 0.022394
My Strategy: I'm watching for a confirmed bullish reversal rather than chasing the price. Patience and risk management are key.
Can this be the beginning of a new bullish trend? 👀
What's your take? Bullish or bearish?
#CryptoTrading #TechnicalAnalysis #PriceAction #MarketStructure #Binance $ESPORTS
{future}(ESPORTSUSDT)
📈 BULLISH REVERSAL SETUP – WATCH THIS ZONE!
After a prolonged downtrend, price is approaching a major support and demand zone.
Here's what I'm watching:
🔹 Market Structure: Previous BOS shows bullish momentum history.
🔹 Trendline: Price is testing the descending resistance trendline.
🔹 Support Zone: Buyers are showing interest around the 0.0093–0.0101 area.
🔹 Confirmation: A bullish engulfing candle could signal a potential reversal.
🎯 Entry: 0.009287
🛑 Stop Loss: 0.006381
🚀 Take Profit: 0.022394
My Strategy: I'm watching for a confirmed bullish reversal rather than chasing the price. Patience and risk management are key.
Can this be the beginning of a new bullish trend? 👀
What's your take? Bullish or bearish?
#CryptoTrading #TechnicalAnalysis #PriceAction #MarketStructure #Binance $ESPORTS
After a prolonged downtrend, price is approaching a major support and demand zone.
Here's what I'm watching:
🔹 Market Structure: Previous BOS shows bullish momentum history.
🔹 Trendline: Price is testing the descending resistance trendline.
🔹 Support Zone: Buyers are showing interest around the 0.0093–0.0101 area.
🔹 Confirmation: A bullish engulfing candle could signal a potential reversal.
🎯 Entry: 0.009287
🛑 Stop Loss: 0.006381
🚀 Take Profit: 0.022394
My Strategy: I'm watching for a confirmed bullish reversal rather than chasing the price. Patience and risk management are key.
Can this be the beginning of a new bullish trend? 👀
What's your take? Bullish or bearish?
#CryptoTrading #TechnicalAnalysis #PriceAction #MarketStructure #Binance $ESPORTS
2
826
·
--
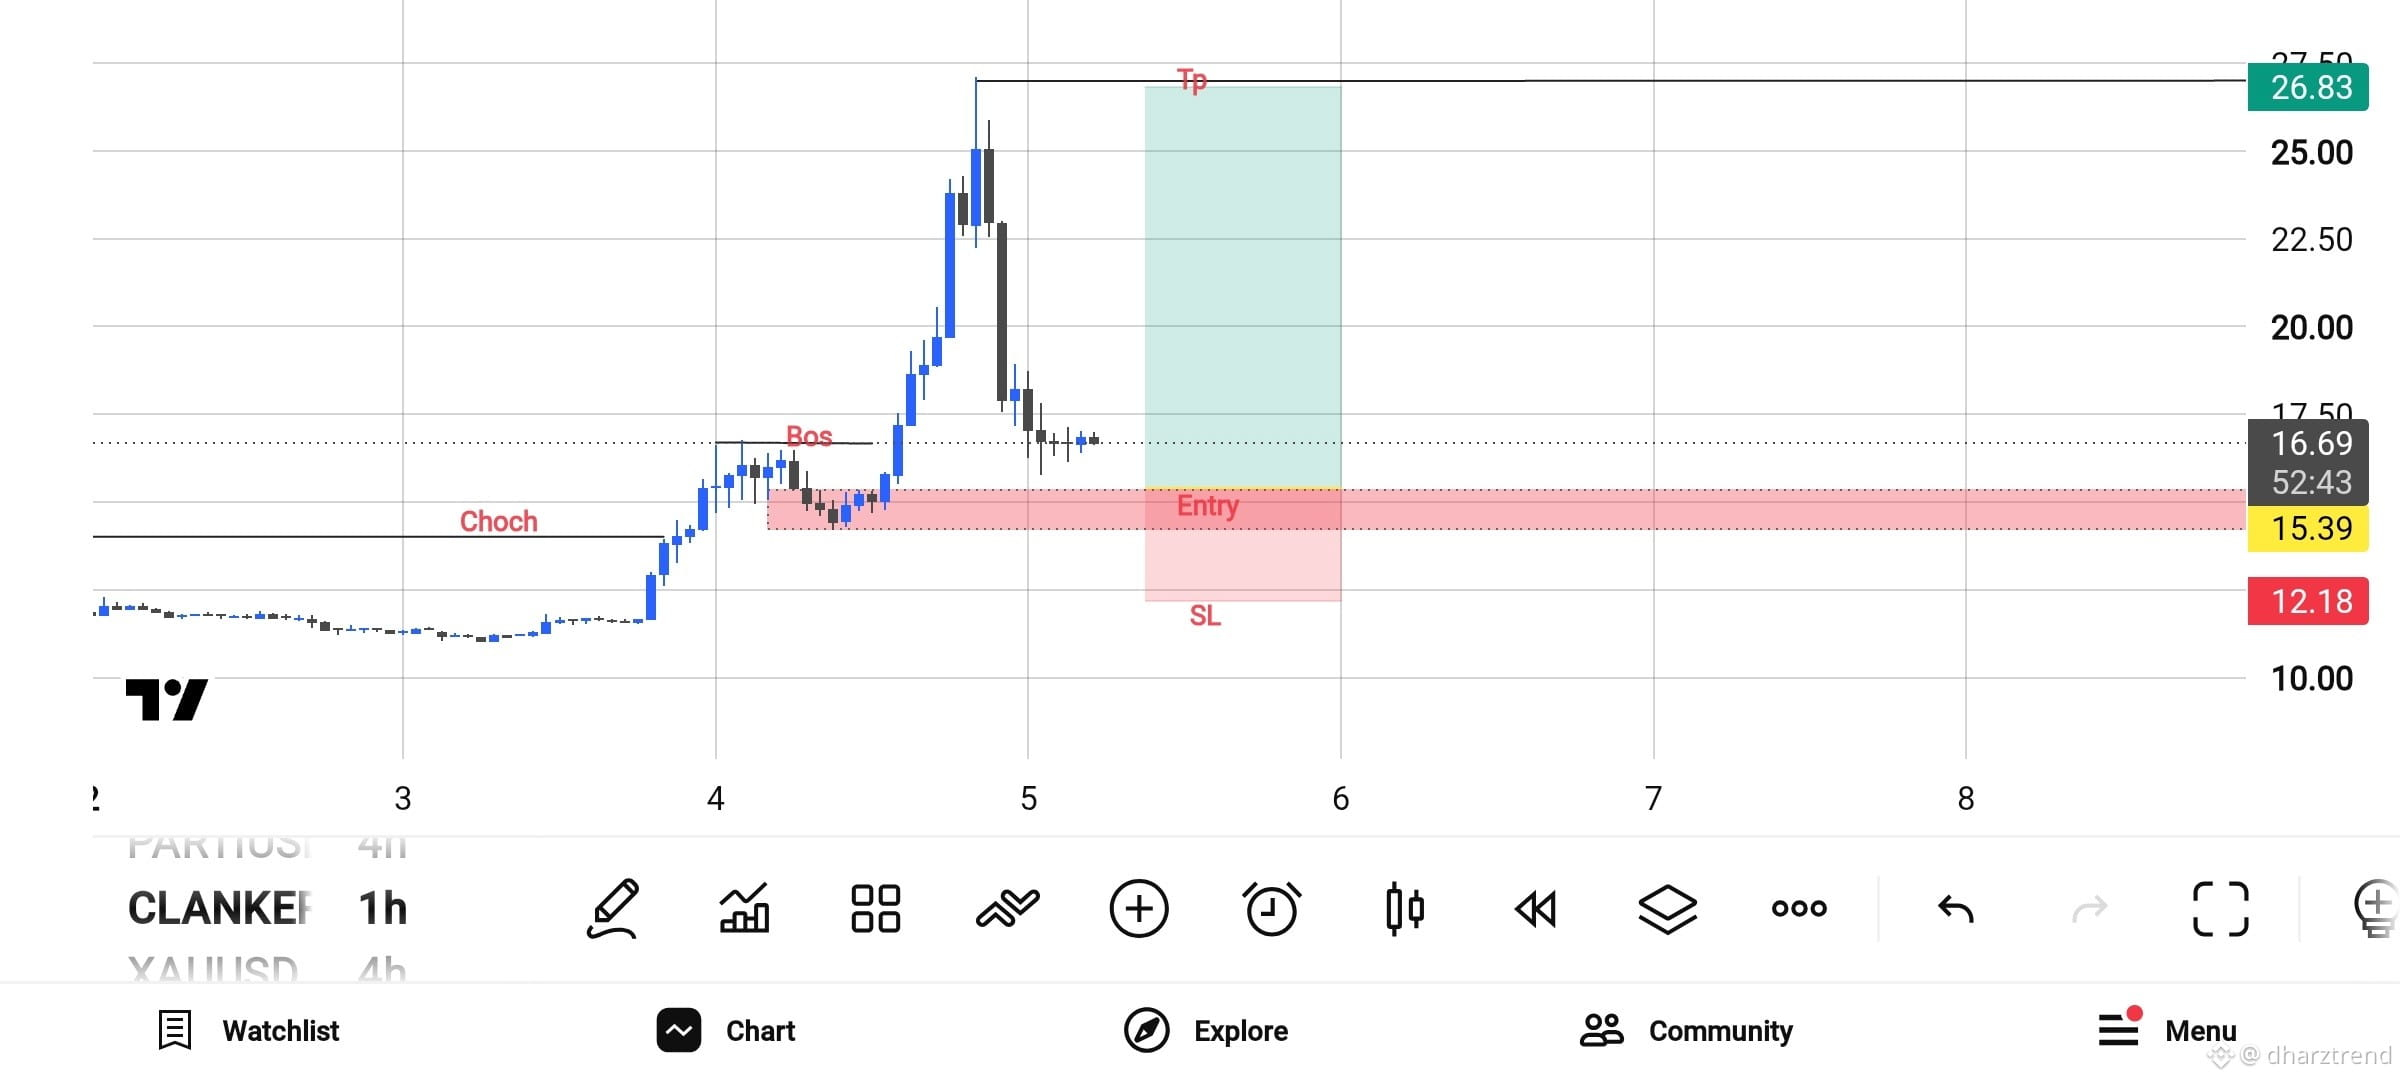
A Bullish Market Structure Is Forming 📈
Watching this setup closely.
Price showed a clear CHoCH (Change of Character) followed by a BOS (Break of Structure), signaling a potential bullish trend reversal.
My trading plan:
- Entry Zone: $15.39 – $16.00
- Stop Loss: $12.18
- Take Profit: $26.83
I'm waiting for price to pull back into the demand zone before considering an entry.
No FOMO. No chasing green candles. Just patience and proper risk management.
Remember: A setup is only a possibility, not a guarantee.
Trade the structure, not the emotions.
#CryptoTrading #PriceAction #MarketStructure #Altcoins #Binance$CLANKER
{future}(CLANKERUSDT)
A Bullish Market Structure Is Forming 📈
Watching this setup closely.
Price showed a clear CHoCH (Change of Character) followed by a BOS (Break of Structure), signaling a potential bullish trend reversal.
My trading plan:
- Entry Zone: $15.39 – $16.00
- Stop Loss: $12.18
- Take Profit: $26.83
I'm waiting for price to pull back into the demand zone before considering an entry.
No FOMO. No chasing green candles. Just patience and proper risk management.
Remember: A setup is only a possibility, not a guarantee.
Trade the structure, not the emotions.
#CryptoTrading #PriceAction #MarketStructure #Altcoins #Binance$CLANKER
Watching this setup closely.
Price showed a clear CHoCH (Change of Character) followed by a BOS (Break of Structure), signaling a potential bullish trend reversal.
My trading plan:
- Entry Zone: $15.39 – $16.00
- Stop Loss: $12.18
- Take Profit: $26.83
I'm waiting for price to pull back into the demand zone before considering an entry.
No FOMO. No chasing green candles. Just patience and proper risk management.
Remember: A setup is only a possibility, not a guarantee.
Trade the structure, not the emotions.
#CryptoTrading #PriceAction #MarketStructure #Altcoins #Binance$CLANKER
1
293
·
--
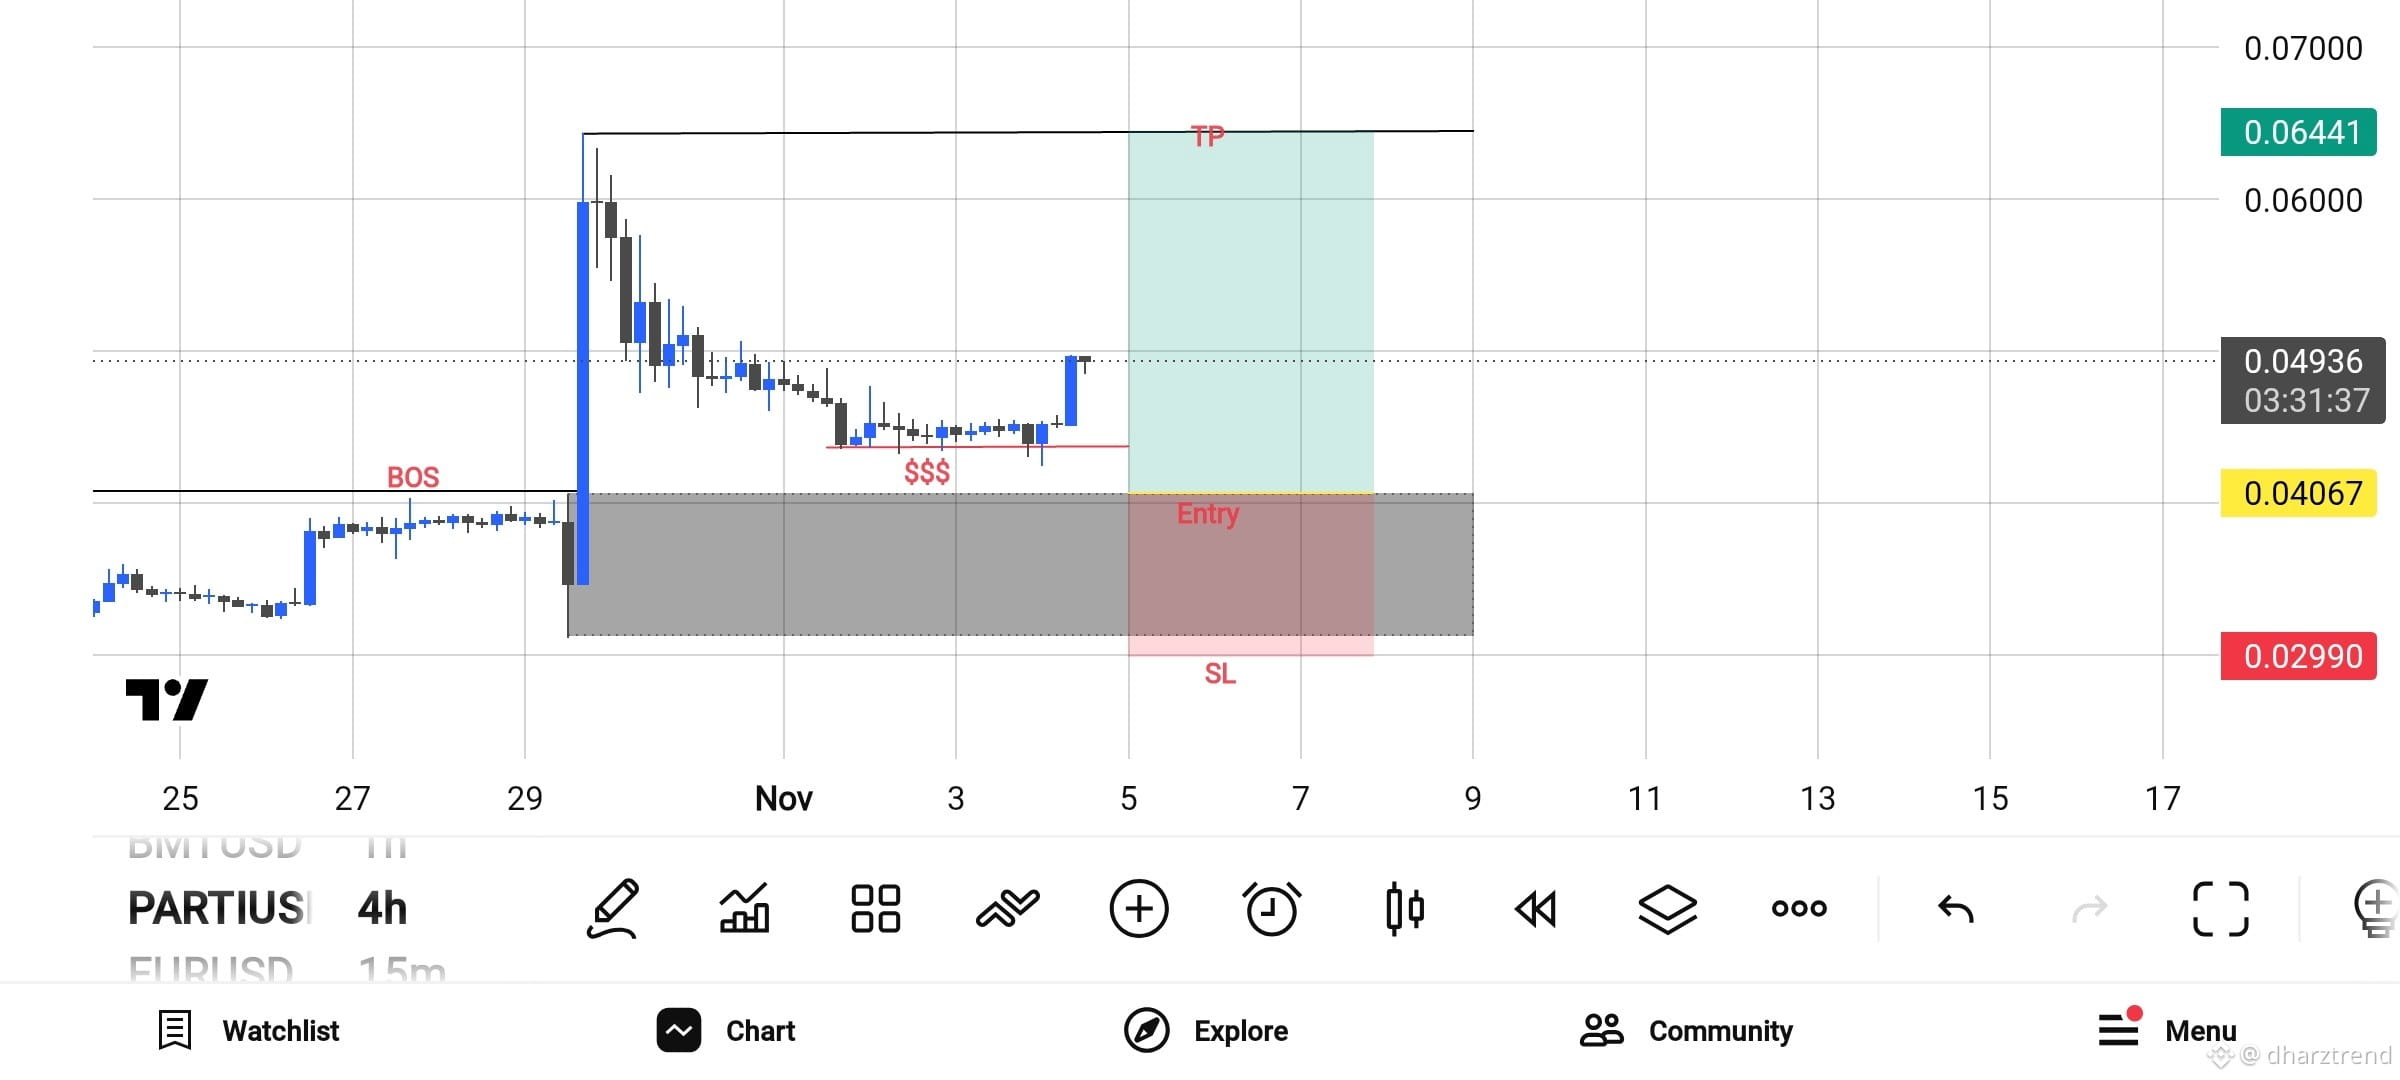
🚀 $PARTI – Bullish Structure | 4H Timeframe
PARTI is showing an interesting bullish market structure.
After a strong breakout (BOS), price entered a consolidation phase. Now we're watching for a possible continuation to the upside.
📊 My Trading Plan:
- Entry Zone: $0.04067
- Stop Loss: $0.02990
- Take Profit: $0.06441
- Current Price: Around $0.04936
- Risk-to-Reward: Approximately 1:2.2
My Strategy:
I'm waiting for price to pull back into the demand zone before considering a LONG position.
No chasing the price. Patience is part of the strategy.
If the demand zone holds and bullish momentum continues, $PARTI could have room for another move upward.
What's your take? Are you bullish on PARTI?
This is my personal technical analysis, not financial advice. Always manage your risk.$PARTI
{future}(PARTIUSDT)
🚀 $PARTI – Bullish Structure | 4H Timeframe
PARTI is showing an interesting bullish market structure.
After a strong breakout (BOS), price entered a consolidation phase. Now we're watching for a possible continuation to the upside.
📊 My Trading Plan:
- Entry Zone: $0.04067
- Stop Loss: $0.02990
- Take Profit: $0.06441
- Current Price: Around $0.04936
- Risk-to-Reward: Approximately 1:2.2
My Strategy:
I'm waiting for price to pull back into the demand zone before considering a LONG position.
No chasing the price. Patience is part of the strategy.
If the demand zone holds and bullish momentum continues, $PARTI could have room for another move upward.
What's your take? Are you bullish on PARTI?
This is my personal technical analysis, not financial advice. Always manage your risk.$PARTI
PARTI is showing an interesting bullish market structure.
After a strong breakout (BOS), price entered a consolidation phase. Now we're watching for a possible continuation to the upside.
📊 My Trading Plan:
- Entry Zone: $0.04067
- Stop Loss: $0.02990
- Take Profit: $0.06441
- Current Price: Around $0.04936
- Risk-to-Reward: Approximately 1:2.2
My Strategy:
I'm waiting for price to pull back into the demand zone before considering a LONG position.
No chasing the price. Patience is part of the strategy.
If the demand zone holds and bullish momentum continues, $PARTI could have room for another move upward.
What's your take? Are you bullish on PARTI?
This is my personal technical analysis, not financial advice. Always manage your risk.$PARTI
465
·
--
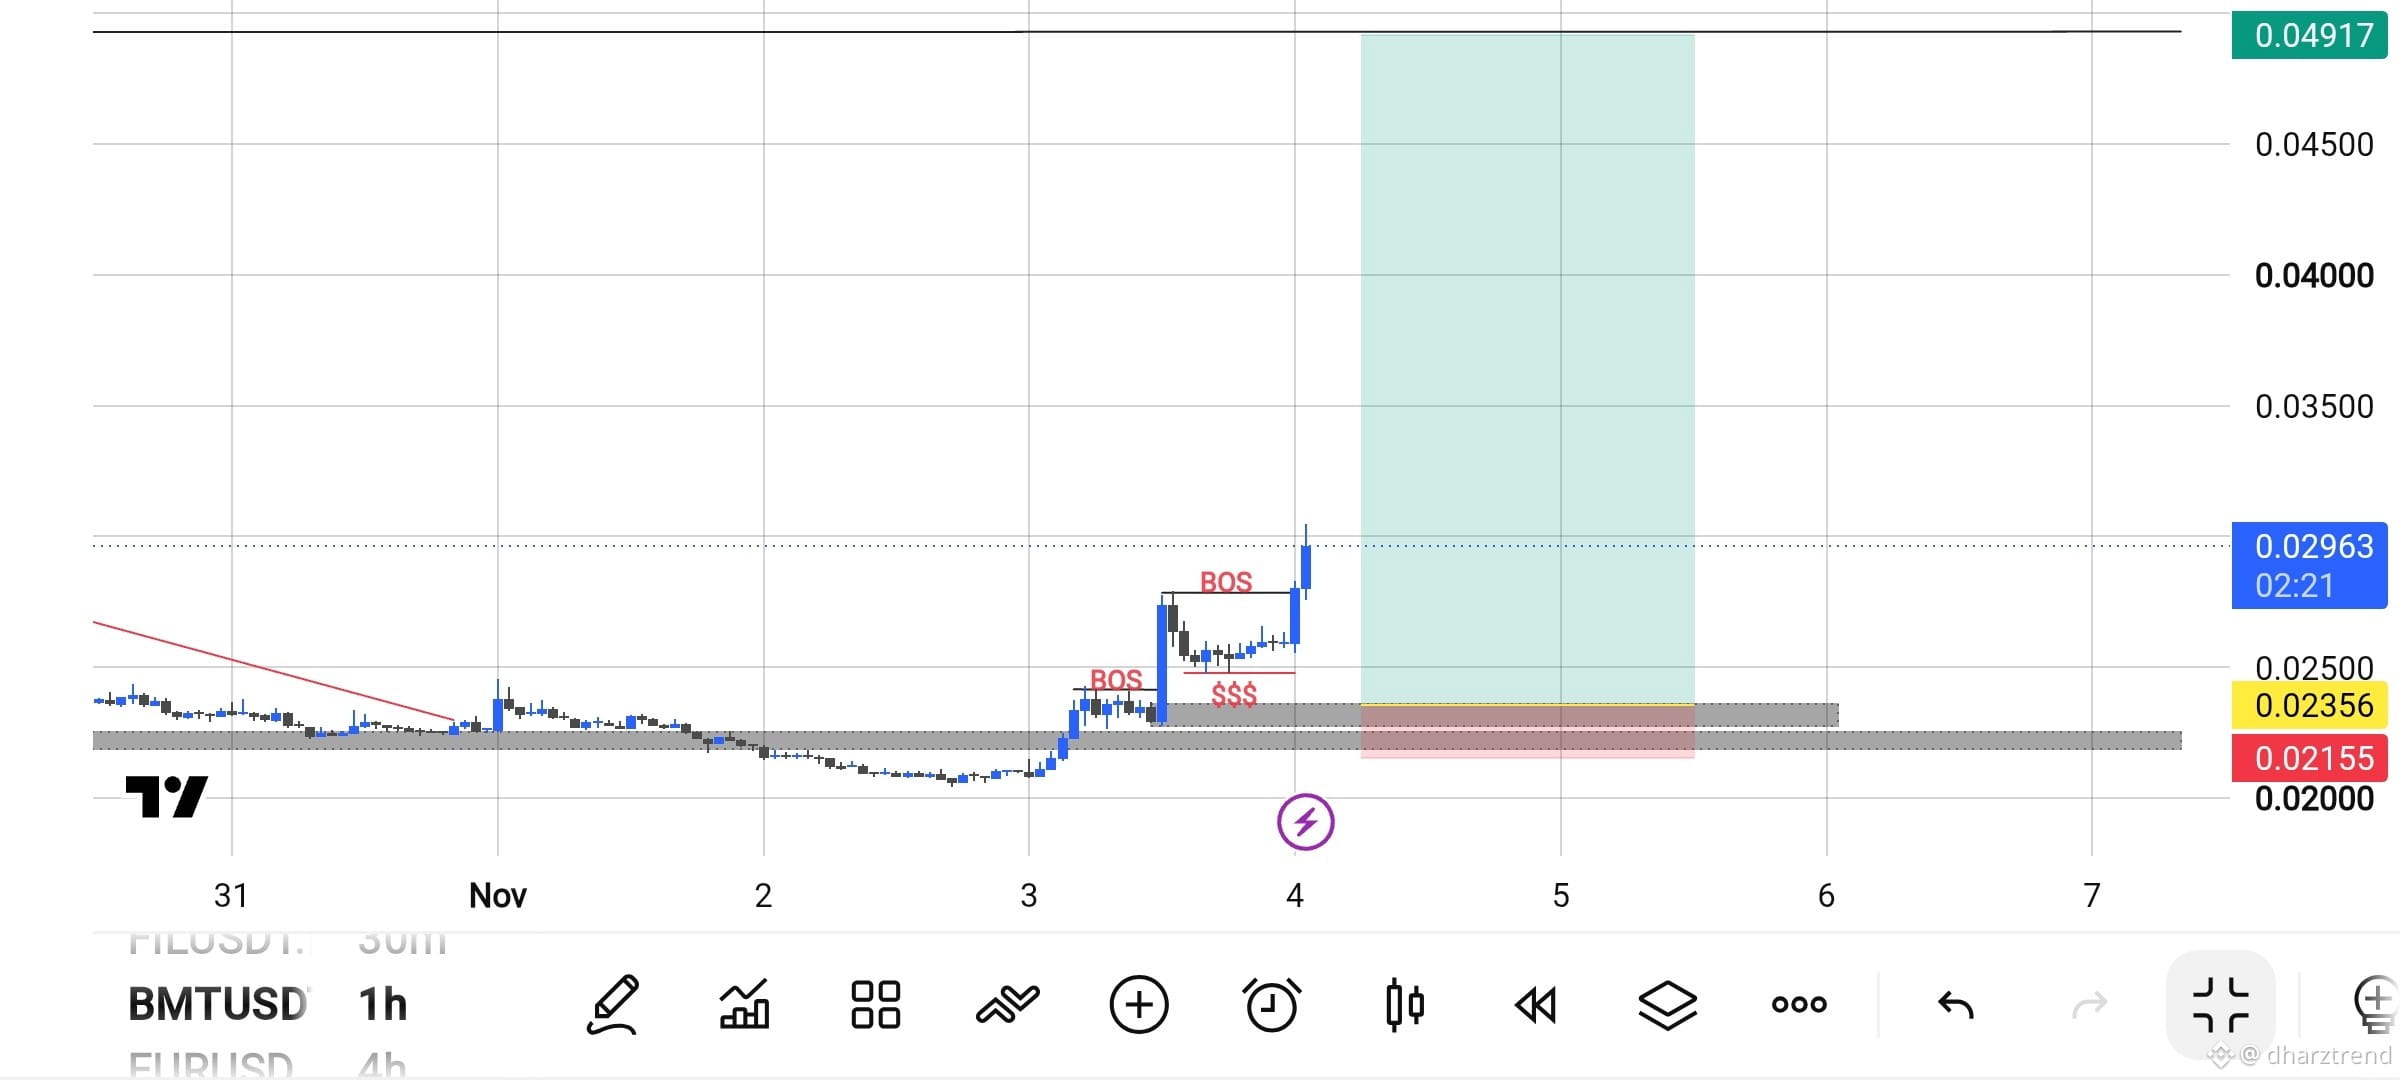
🔥 $BMT Break of Structure + Liquidity Sweep 🔥
BMTUSD 1H looking very clean.
Price was consolidating for days, then:
Swept the $$$ liquidity zone
Printed a clear Break of Structure (BOS)
Followed it with another BOS higher
This is classic smart money behavior — take liquidity, then expand.
Key levels:
Support / demand zone: 0.02155 – 0.02356
Immediate resistance: 0.02963
Higher target: 0.04917
As long as price holds above the gray support zone after the liquidity grab, the structure remains bullish and continuation is favored.
Volume expanding + rising OI + negative funding = strong conditions.
Watching for a hold and push higher.
What’s your bias on $BMT right now?$BMT
{future}(BMTUSDT)
🔥 $BMT Break of Structure + Liquidity Sweep 🔥
BMTUSD 1H looking very clean.
Price was consolidating for days, then:
Swept the $$$ liquidity zone
Printed a clear Break of Structure (BOS)
Followed it with another BOS higher
This is classic smart money behavior — take liquidity, then expand.
Key levels:
Support / demand zone: 0.02155 – 0.02356
Immediate resistance: 0.02963
Higher target: 0.04917
As long as price holds above the gray support zone after the liquidity grab, the structure remains bullish and continuation is favored.
Volume expanding + rising OI + negative funding = strong conditions.
Watching for a hold and push higher.
What’s your bias on $BMT right now?$BMT
BMTUSD 1H looking very clean.
Price was consolidating for days, then:
Swept the $$$ liquidity zone
Printed a clear Break of Structure (BOS)
Followed it with another BOS higher
This is classic smart money behavior — take liquidity, then expand.
Key levels:
Support / demand zone: 0.02155 – 0.02356
Immediate resistance: 0.02963
Higher target: 0.04917
As long as price holds above the gray support zone after the liquidity grab, the structure remains bullish and continuation is favored.
Volume expanding + rising OI + negative funding = strong conditions.
Watching for a hold and push higher.
What’s your bias on $BMT right now?$BMT
384
·
--
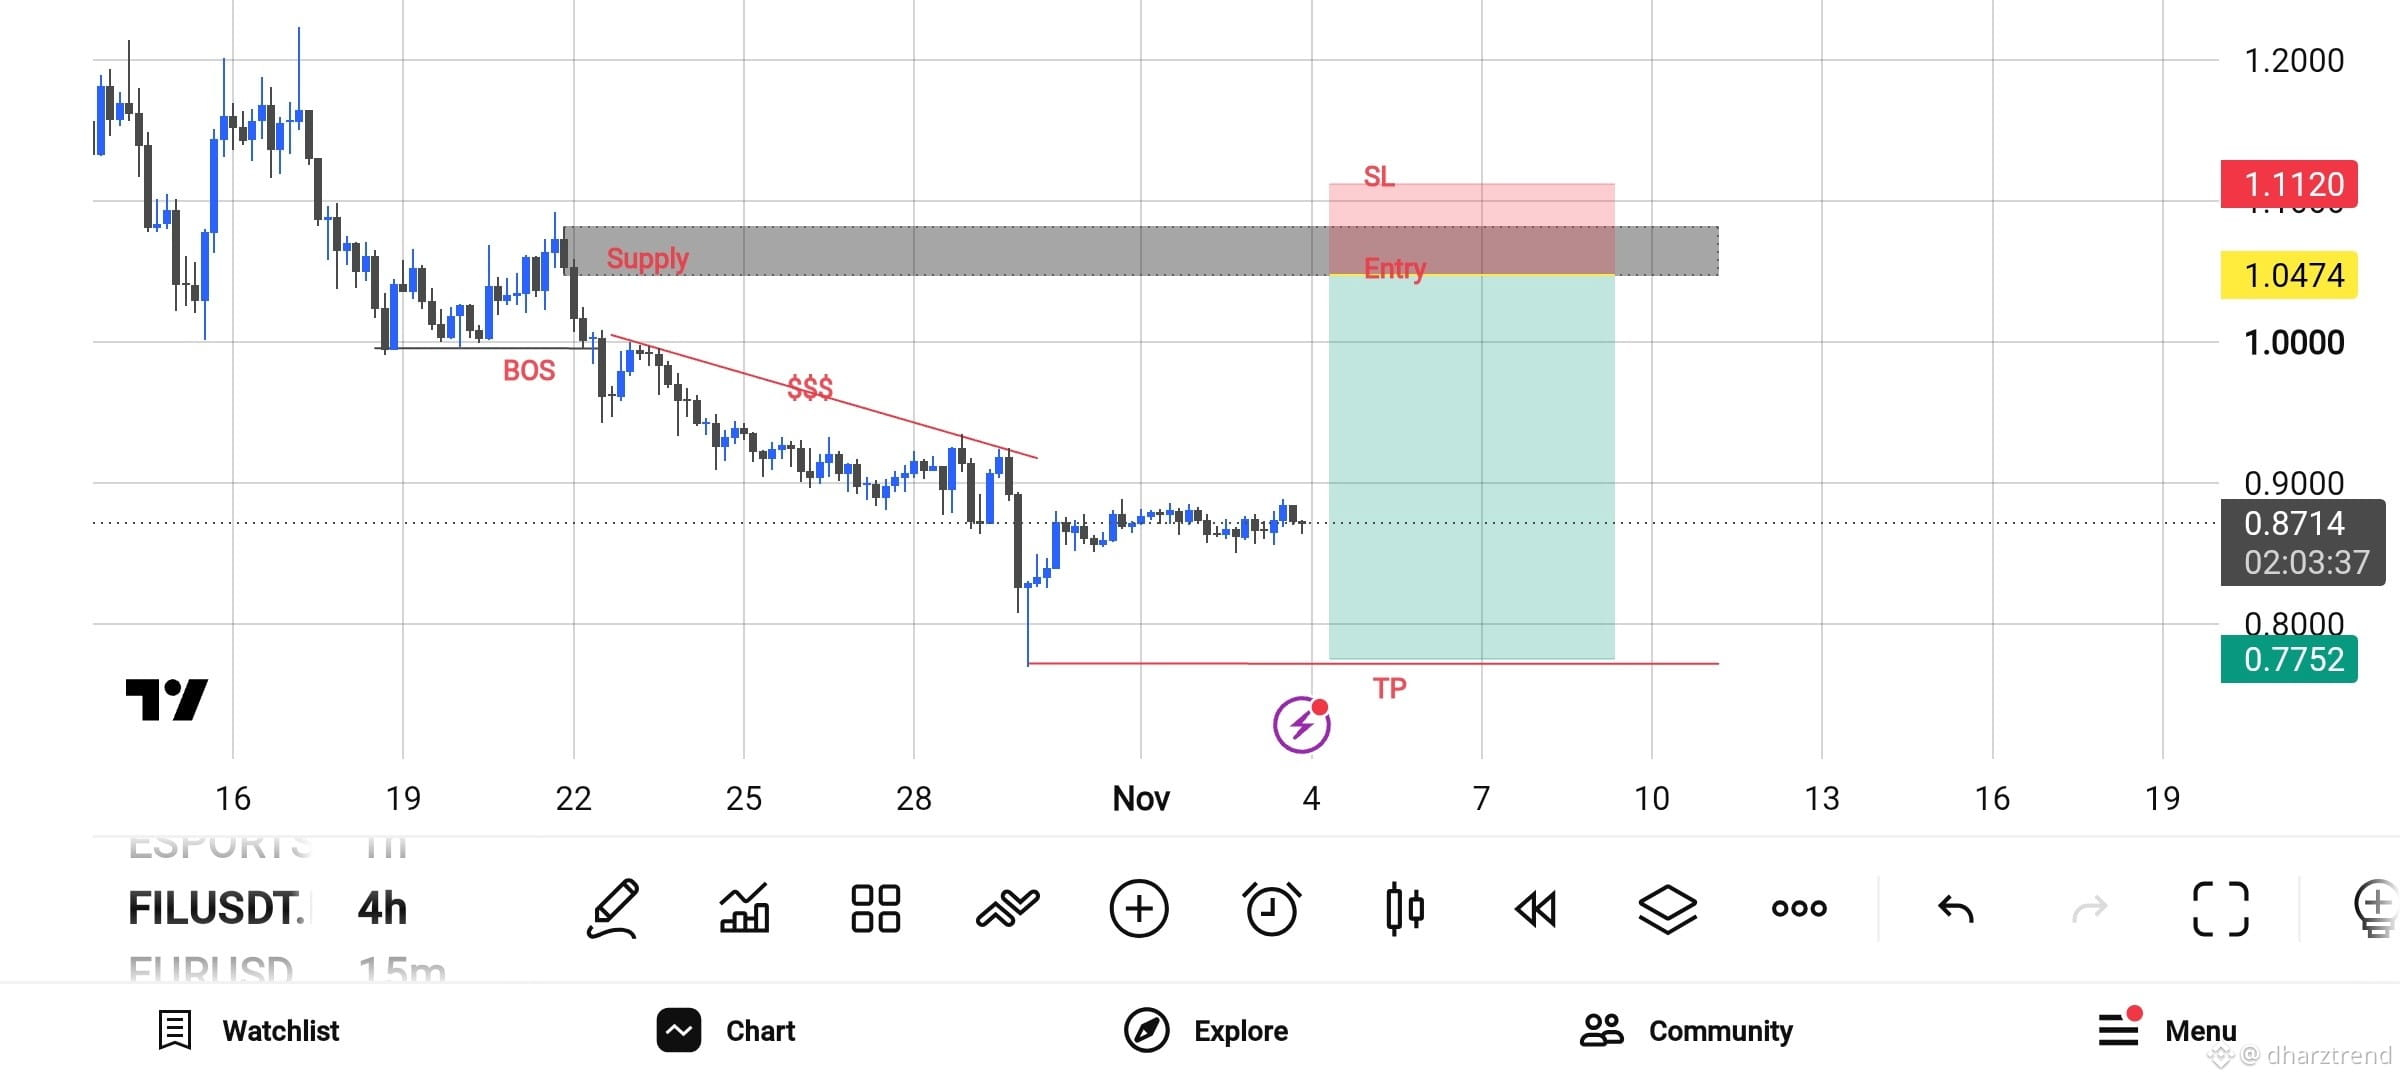
📉 FILUSDT – BEARISH SETUP | SHORT IDEA
The market structure remains bearish after a clear Break of Structure (BOS).
🔴 Supply Zone: 1.0474
🎯 Entry: 1.0474
🛑 Stop Loss: 1.1120
💰 Take Profit: 0.7752
My Trading Plan:
I'm watching for a pullback into the supply zone before considering a SHORT position.
Price is still showing bearish structure, and I'm looking for sellers to defend the supply area.
Patience is key. No chasing price. Wait for confirmation.
Trade the structure, not the emotion.
What's your bias on FILUSDT? Bearish or bullish?
#FILUSDT #CryptoTrading #TechnicalAnalysis $FIL
{spot}(FILUSDT)
📉 FILUSDT – BEARISH SETUP | SHORT IDEA
The market structure remains bearish after a clear Break of Structure (BOS).
🔴 Supply Zone: 1.0474
🎯 Entry: 1.0474
🛑 Stop Loss: 1.1120
💰 Take Profit: 0.7752
My Trading Plan:
I'm watching for a pullback into the supply zone before considering a SHORT position.
Price is still showing bearish structure, and I'm looking for sellers to defend the supply area.
Patience is key. No chasing price. Wait for confirmation.
Trade the structure, not the emotion.
What's your bias on FILUSDT? Bearish or bullish?
#FILUSDT #CryptoTrading #TechnicalAnalysis $FIL
The market structure remains bearish after a clear Break of Structure (BOS).
🔴 Supply Zone: 1.0474
🎯 Entry: 1.0474
🛑 Stop Loss: 1.1120
💰 Take Profit: 0.7752
My Trading Plan:
I'm watching for a pullback into the supply zone before considering a SHORT position.
Price is still showing bearish structure, and I'm looking for sellers to defend the supply area.
Patience is key. No chasing price. Wait for confirmation.
Trade the structure, not the emotion.
What's your bias on FILUSDT? Bearish or bullish?
#FILUSDT #CryptoTrading #TechnicalAnalysis $FIL
862
·
--
$ESPORTS
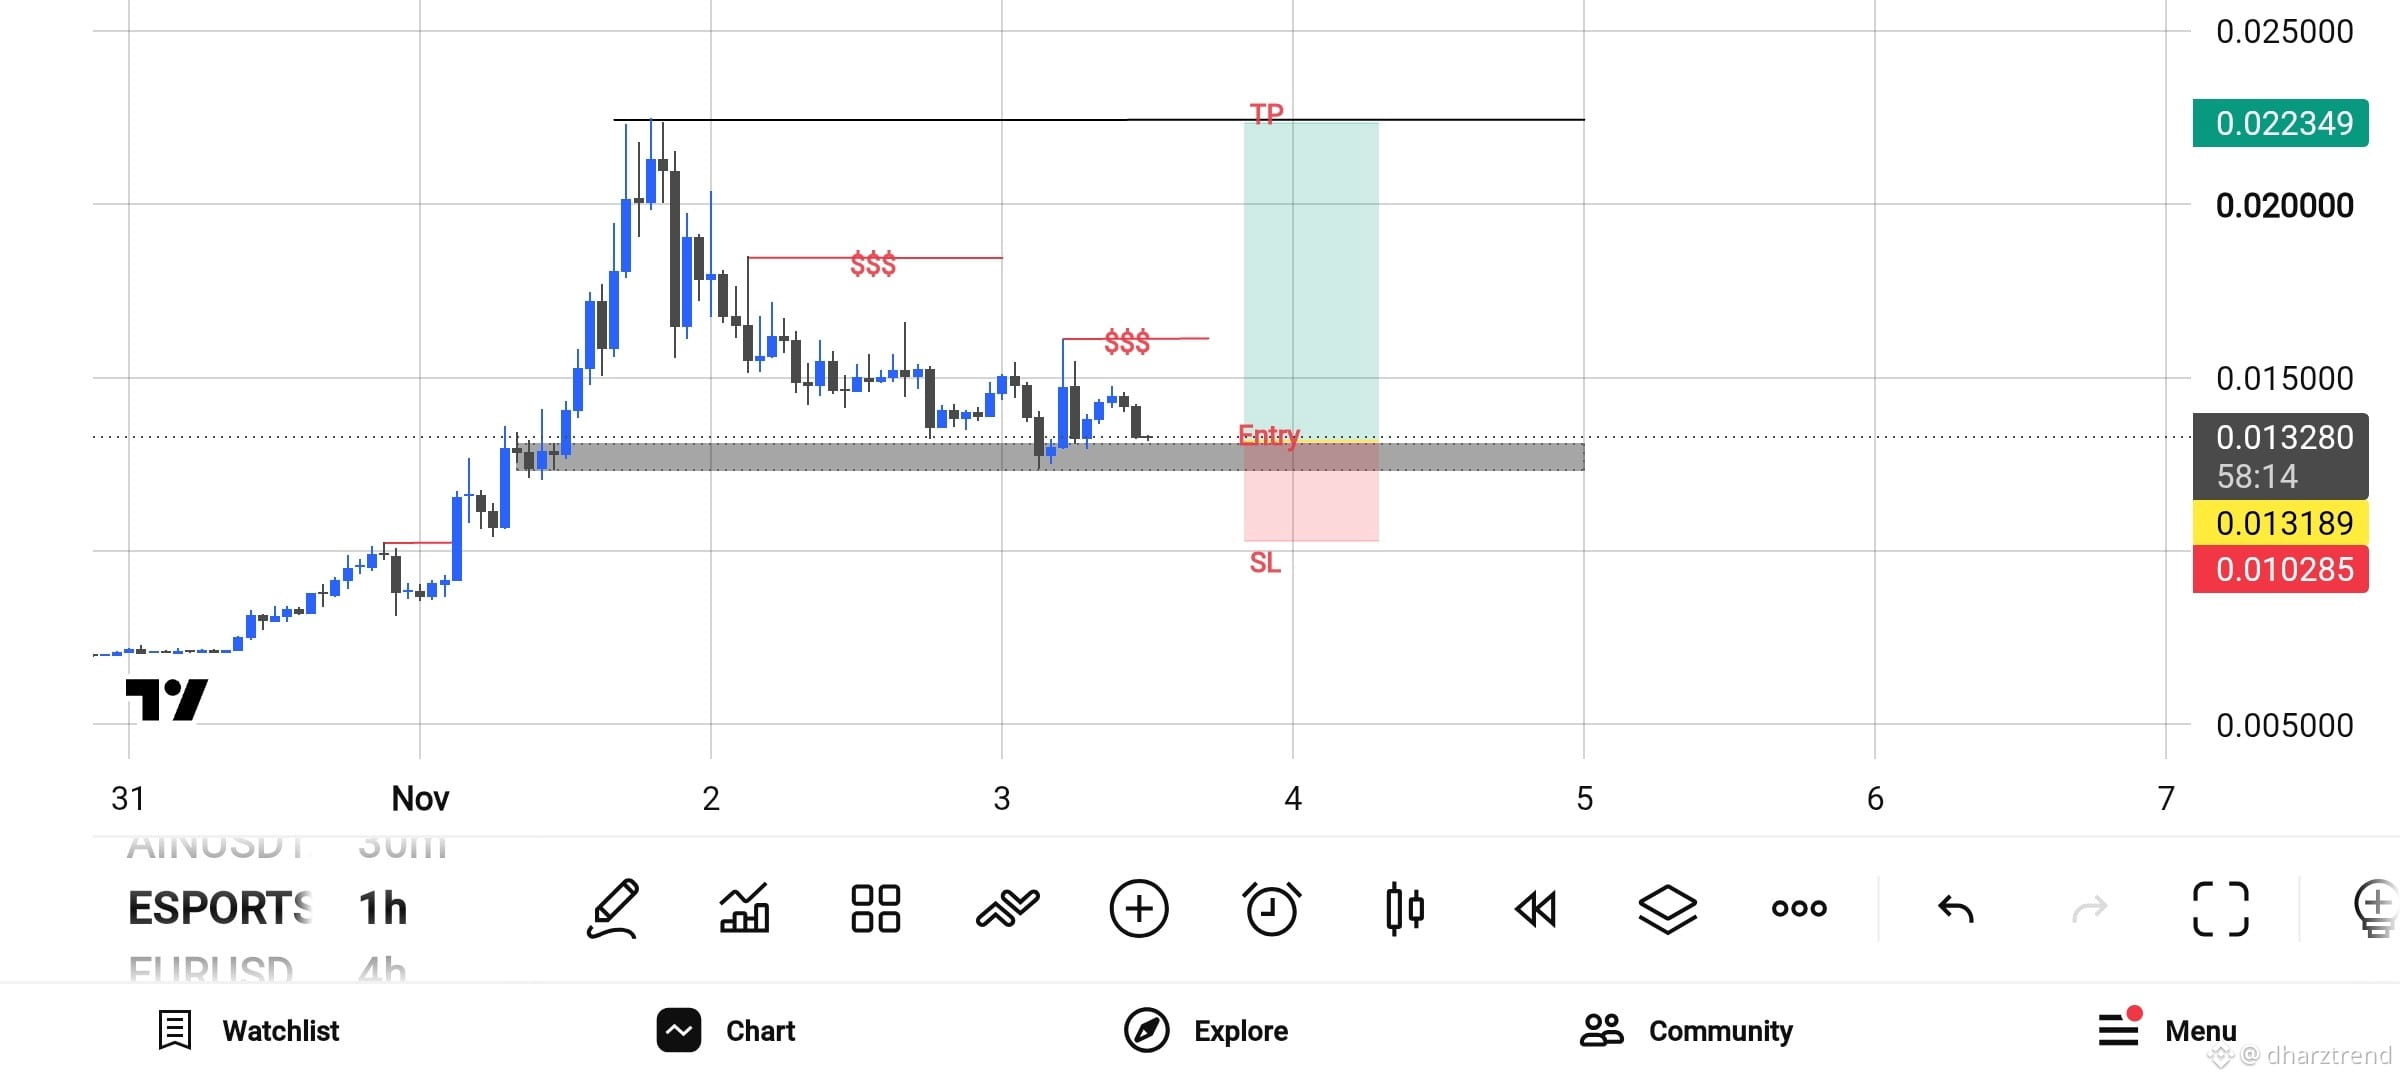
🚀 ESPORTS/USDT – BULLISH SETUP | 1H
Watching this setup closely! Price is approaching a key support zone after a strong bullish rally.
📈 Trade Plan: LONG
- Entry: 0.013189
- Stop Loss: 0.010285
- Take Profit: 0.022349
- Risk-to-Reward: Approximately 1:3.15
My Strategy:
Waiting for support to hold and bullish confirmation before considering an entry.
The goal is to catch the next potential continuation move.
⚠️ This is a trade setup, not a guaranteed outcome. Always manage your risk.
What do you think? Will bulls defend this support zone? 🔥#ESPORTS #CryptoTrading #Binance #Altcoins #TradingSetup $ESPORTS
{future}(ESPORTSUSDT)
$ESPORTS
🚀 ESPORTS/USDT – BULLISH SETUP | 1H
Watching this setup closely! Price is approaching a key support zone after a strong bullish rally.
📈 Trade Plan: LONG
- Entry: 0.013189
- Stop Loss: 0.010285
- Take Profit: 0.022349
- Risk-to-Reward: Approximately 1:3.15
My Strategy:
Waiting for support to hold and bullish confirmation before considering an entry.
The goal is to catch the next potential continuation move.
⚠️ This is a trade setup, not a guaranteed outcome. Always manage your risk.
What do you think? Will bulls defend this support zone? 🔥#ESPORTS #CryptoTrading #Binance #Altcoins #TradingSetup $ESPORTS
🚀 ESPORTS/USDT – BULLISH SETUP | 1H
Watching this setup closely! Price is approaching a key support zone after a strong bullish rally.
📈 Trade Plan: LONG
- Entry: 0.013189
- Stop Loss: 0.010285
- Take Profit: 0.022349
- Risk-to-Reward: Approximately 1:3.15
My Strategy:
Waiting for support to hold and bullish confirmation before considering an entry.
The goal is to catch the next potential continuation move.
⚠️ This is a trade setup, not a guaranteed outcome. Always manage your risk.
What do you think? Will bulls defend this support zone? 🔥#ESPORTS #CryptoTrading #Binance #Altcoins #TradingSetup $ESPORTS
2
2
840
·
--
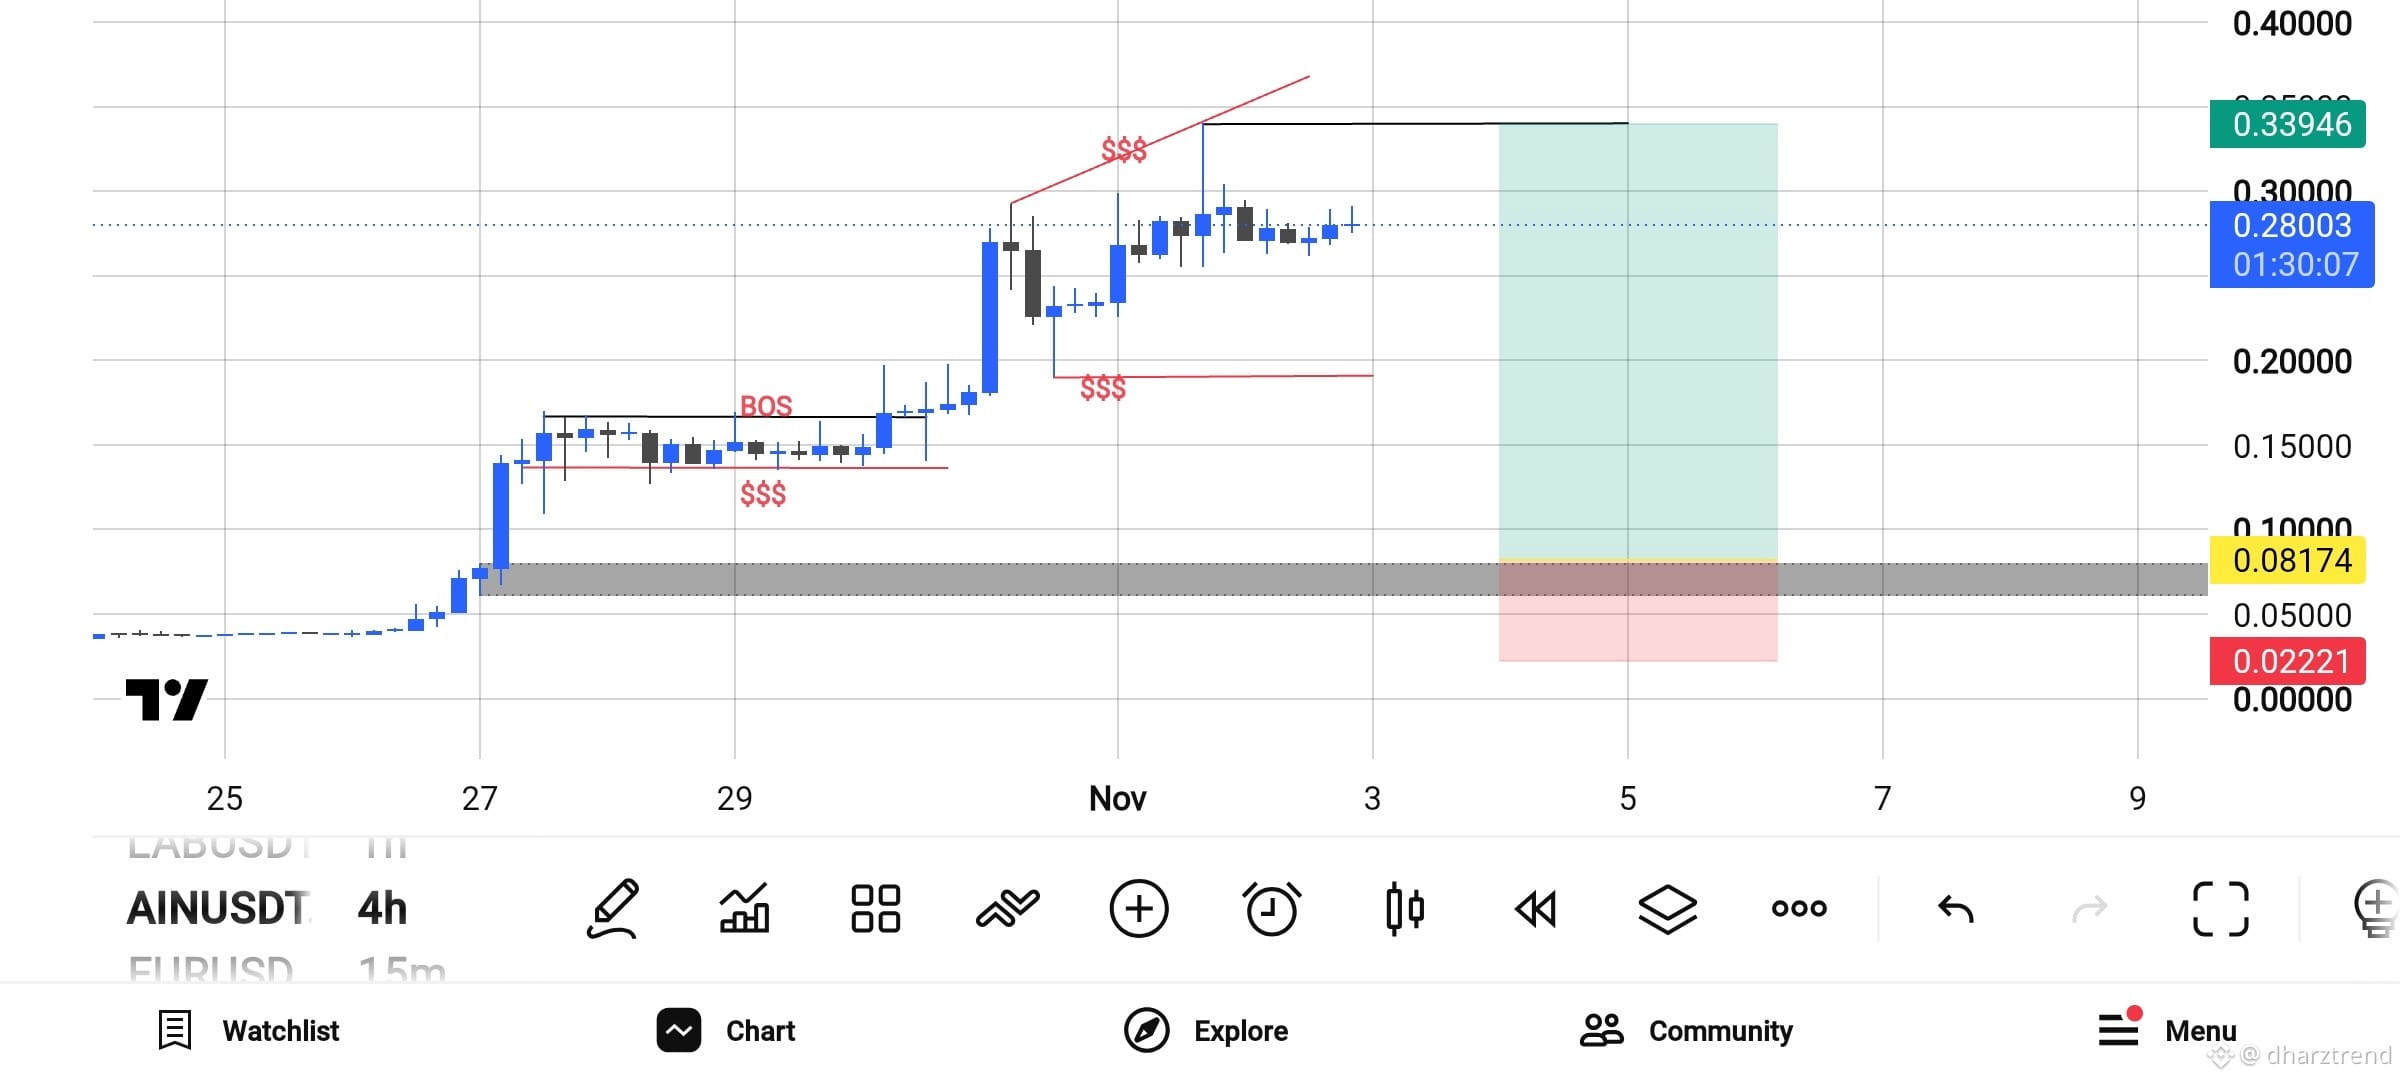
AINUSDT – Early Entry, Strong Potential! 🚀
My entry on AINUSDT was around $0.08, and price is now trading near $0.28.
That's a significant move already! 📈
My Chart Analysis (4H):
- Strong bullish market structure.
- Clear Break of Structure (BOS).
- Price is consolidating after a strong rally.
- Next potential target: $0.339.
I'm watching how price reacts around the current consolidation before expecting another move higher.
Sometimes patience is more powerful than chasing a breakout.
Did you catch AIN early, or are you still waiting for an entry?
#AINUSDT #Binance #CryptoTrading #Altcoins #TechnicalAnalysis $AIN
{future}(AINUSDT)
AINUSDT – Early Entry, Strong Potential! 🚀
My entry on AINUSDT was around $0.08, and price is now trading near $0.28.
That's a significant move already! 📈
My Chart Analysis (4H):
- Strong bullish market structure.
- Clear Break of Structure (BOS).
- Price is consolidating after a strong rally.
- Next potential target: $0.339.
I'm watching how price reacts around the current consolidation before expecting another move higher.
Sometimes patience is more powerful than chasing a breakout.
Did you catch AIN early, or are you still waiting for an entry?
#AINUSDT #Binance #CryptoTrading #Altcoins #TechnicalAnalysis $AIN
My entry on AINUSDT was around $0.08, and price is now trading near $0.28.
That's a significant move already! 📈
My Chart Analysis (4H):
- Strong bullish market structure.
- Clear Break of Structure (BOS).
- Price is consolidating after a strong rally.
- Next potential target: $0.339.
I'm watching how price reacts around the current consolidation before expecting another move higher.
Sometimes patience is more powerful than chasing a breakout.
Did you catch AIN early, or are you still waiting for an entry?
#AINUSDT #Binance #CryptoTrading #Altcoins #TechnicalAnalysis $AIN
2
1.4k
·
--
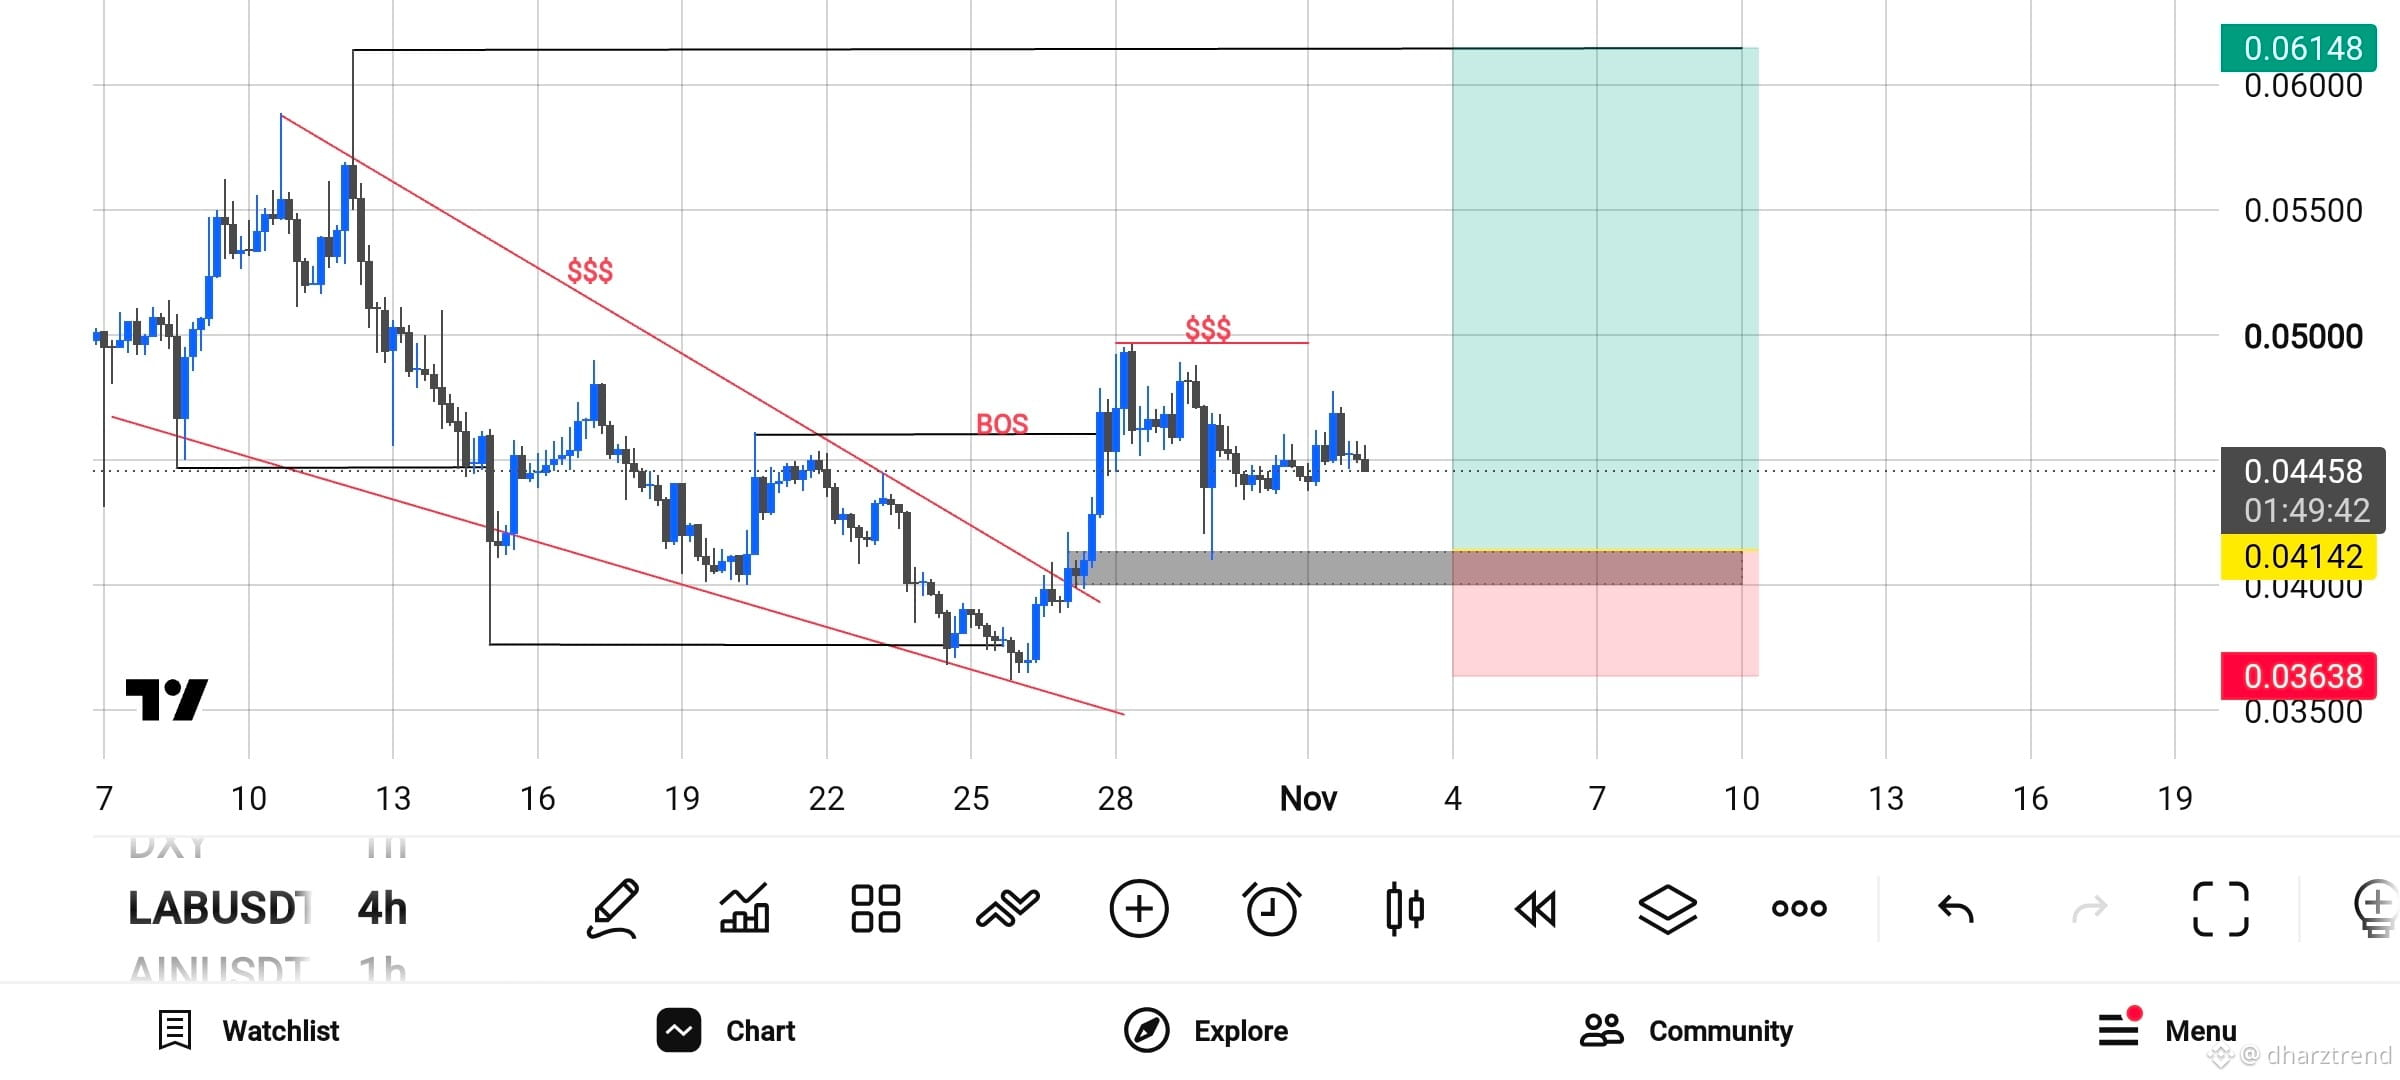
LABUSDT – 4H | Bullish Setup 📈
LABUSDT has broken out of its descending channel and confirmed a bullish Break of Structure (BOS).
My strategy is to wait for a potential pullback into the demand zone before considering a long position.
My Trading Plan:
- Entry: 0.04142
- Stop Loss: 0.03638
- Take Profit: 0.06148
I'm watching the previous liquidity highs as potential targets.
Patience is key. I prefer waiting for confirmation rather than chasing the price.
This is my personal technical analysis, not financial advice. Always manage your risk.
What's your view on LABUSDT? Bullish continuation or another pullback?$LAB
{future}(LABUSDT)
LABUSDT – 4H | Bullish Setup 📈
LABUSDT has broken out of its descending channel and confirmed a bullish Break of Structure (BOS).
My strategy is to wait for a potential pullback into the demand zone before considering a long position.
My Trading Plan:
- Entry: 0.04142
- Stop Loss: 0.03638
- Take Profit: 0.06148
I'm watching the previous liquidity highs as potential targets.
Patience is key. I prefer waiting for confirmation rather than chasing the price.
This is my personal technical analysis, not financial advice. Always manage your risk.
What's your view on LABUSDT? Bullish continuation or another pullback?$LAB
LABUSDT has broken out of its descending channel and confirmed a bullish Break of Structure (BOS).
My strategy is to wait for a potential pullback into the demand zone before considering a long position.
My Trading Plan:
- Entry: 0.04142
- Stop Loss: 0.03638
- Take Profit: 0.06148
I'm watching the previous liquidity highs as potential targets.
Patience is key. I prefer waiting for confirmation rather than chasing the price.
This is my personal technical analysis, not financial advice. Always manage your risk.
What's your view on LABUSDT? Bullish continuation or another pullback?$LAB
1
735
·
--
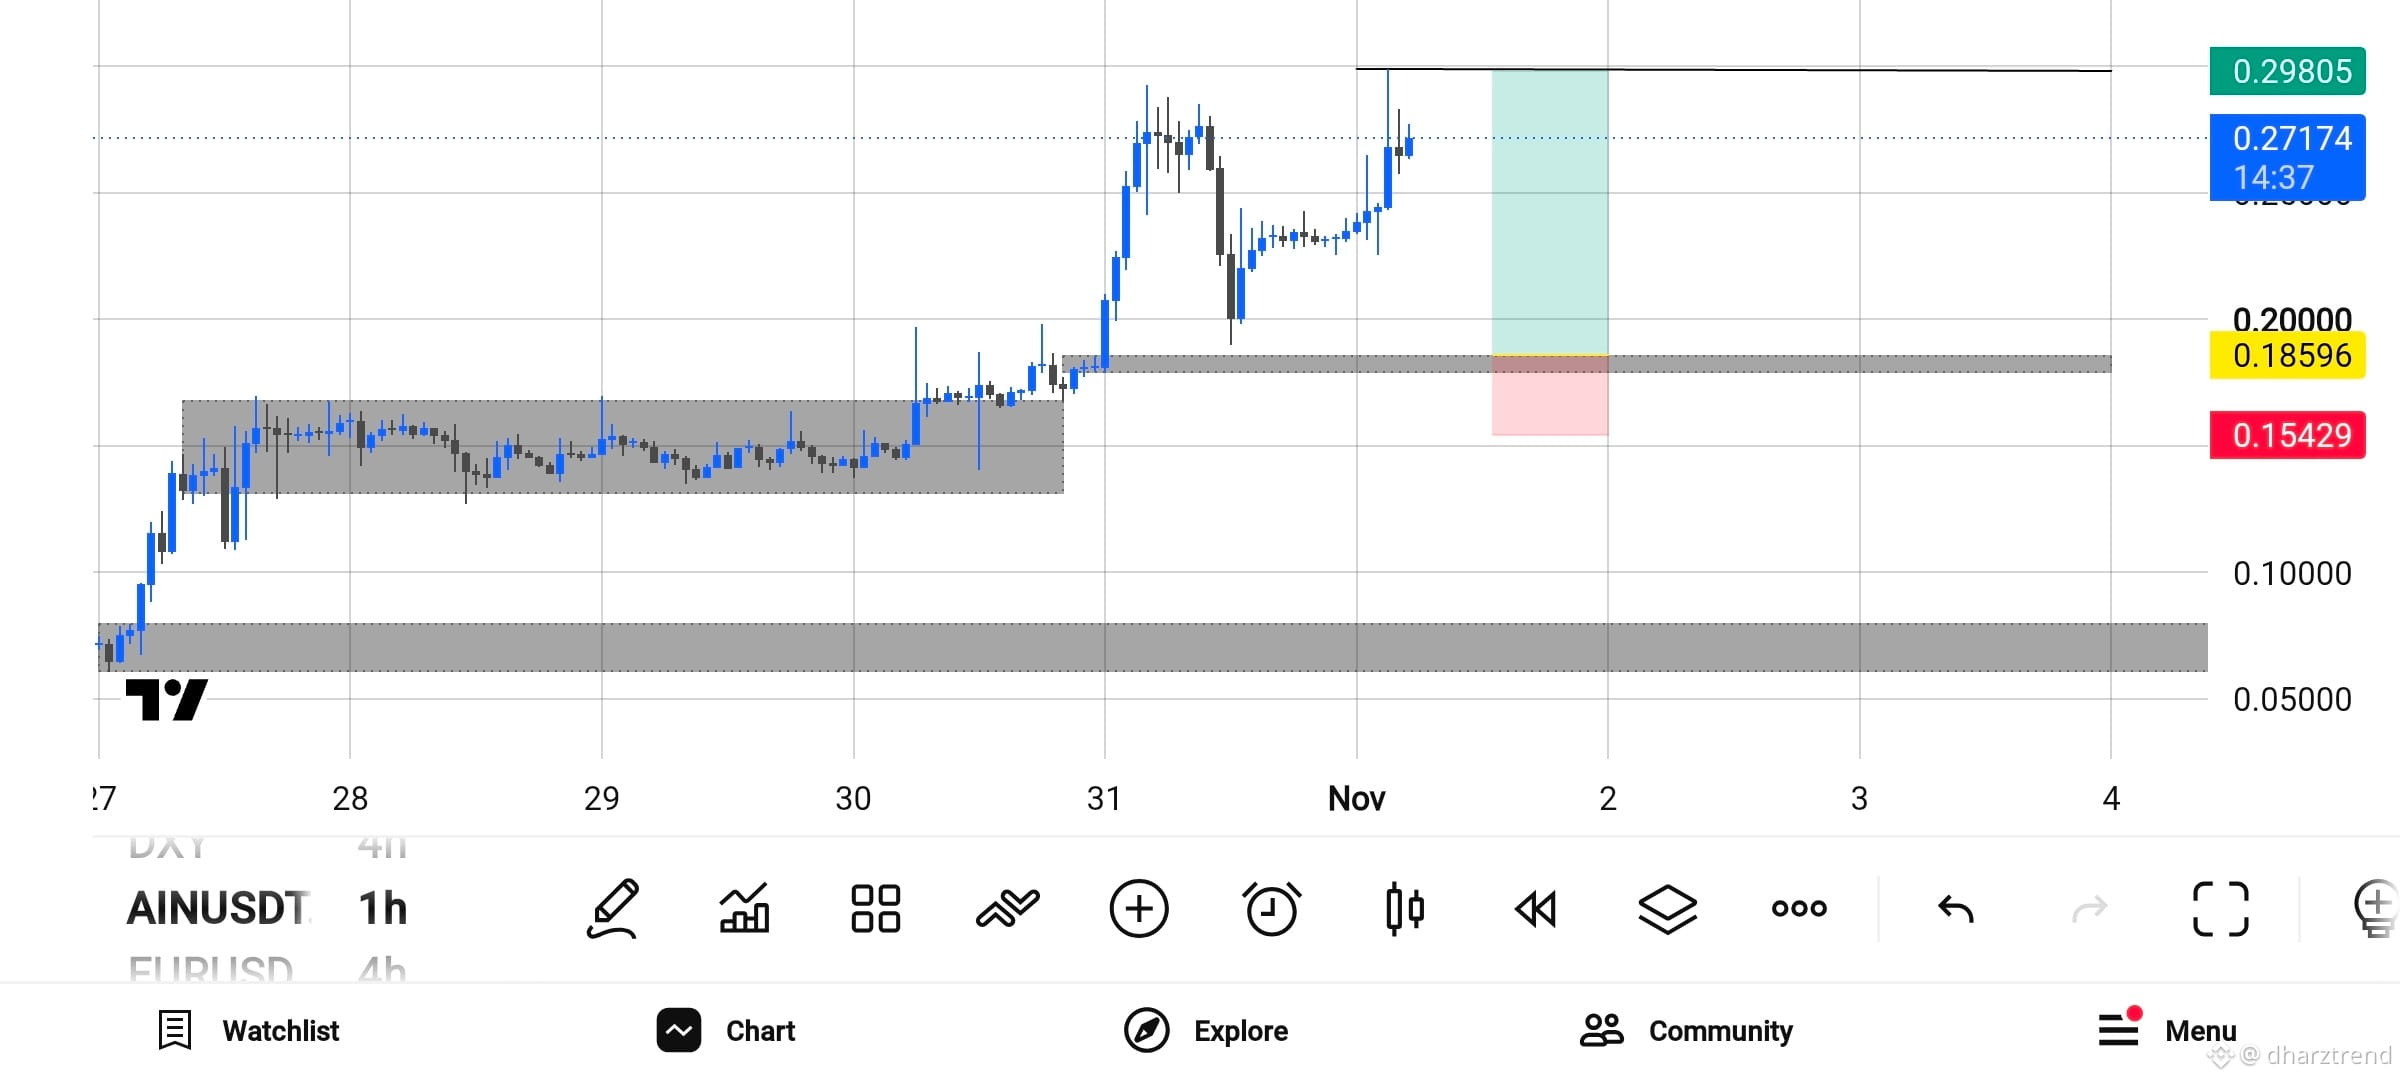
AINUSDT – Bullish Setup | 1H Timeframe 📈
AINUSDT is showing strong bullish momentum after breaking out of its previous consolidation range.
My strategy is to wait for a proper pullback toward the demand zone before considering an entry. I’m watching these key levels:
🎯 Entry: 0.18596
🛑 Stop Loss: 0.15429
🚀 Take Profit: 0.29805
The idea is to follow the bullish market structure and avoid chasing the price after a strong pump.
Remember: Always manage your risk and wait for confirmation before entering a trade.
What do you think? Can AINUSDT reach 0.29805? Let's discuss!
#AINUSDT #CryptoTrading #TechnicalAnalysis #Binance #tradingStrategy $AIN
{future}(AINUSDT)
AINUSDT – Bullish Setup | 1H Timeframe 📈
AINUSDT is showing strong bullish momentum after breaking out of its previous consolidation range.
My strategy is to wait for a proper pullback toward the demand zone before considering an entry. I’m watching these key levels:
🎯 Entry: 0.18596
🛑 Stop Loss: 0.15429
🚀 Take Profit: 0.29805
The idea is to follow the bullish market structure and avoid chasing the price after a strong pump.
Remember: Always manage your risk and wait for confirmation before entering a trade.
What do you think? Can AINUSDT reach 0.29805? Let's discuss!
#AINUSDT #CryptoTrading #TechnicalAnalysis #Binance #tradingStrategy $AIN
AINUSDT is showing strong bullish momentum after breaking out of its previous consolidation range.
My strategy is to wait for a proper pullback toward the demand zone before considering an entry. I’m watching these key levels:
🎯 Entry: 0.18596
🛑 Stop Loss: 0.15429
🚀 Take Profit: 0.29805
The idea is to follow the bullish market structure and avoid chasing the price after a strong pump.
Remember: Always manage your risk and wait for confirmation before entering a trade.
What do you think? Can AINUSDT reach 0.29805? Let's discuss!
#AINUSDT #CryptoTrading #TechnicalAnalysis #Binance #tradingStrategy $AIN
678
·
--
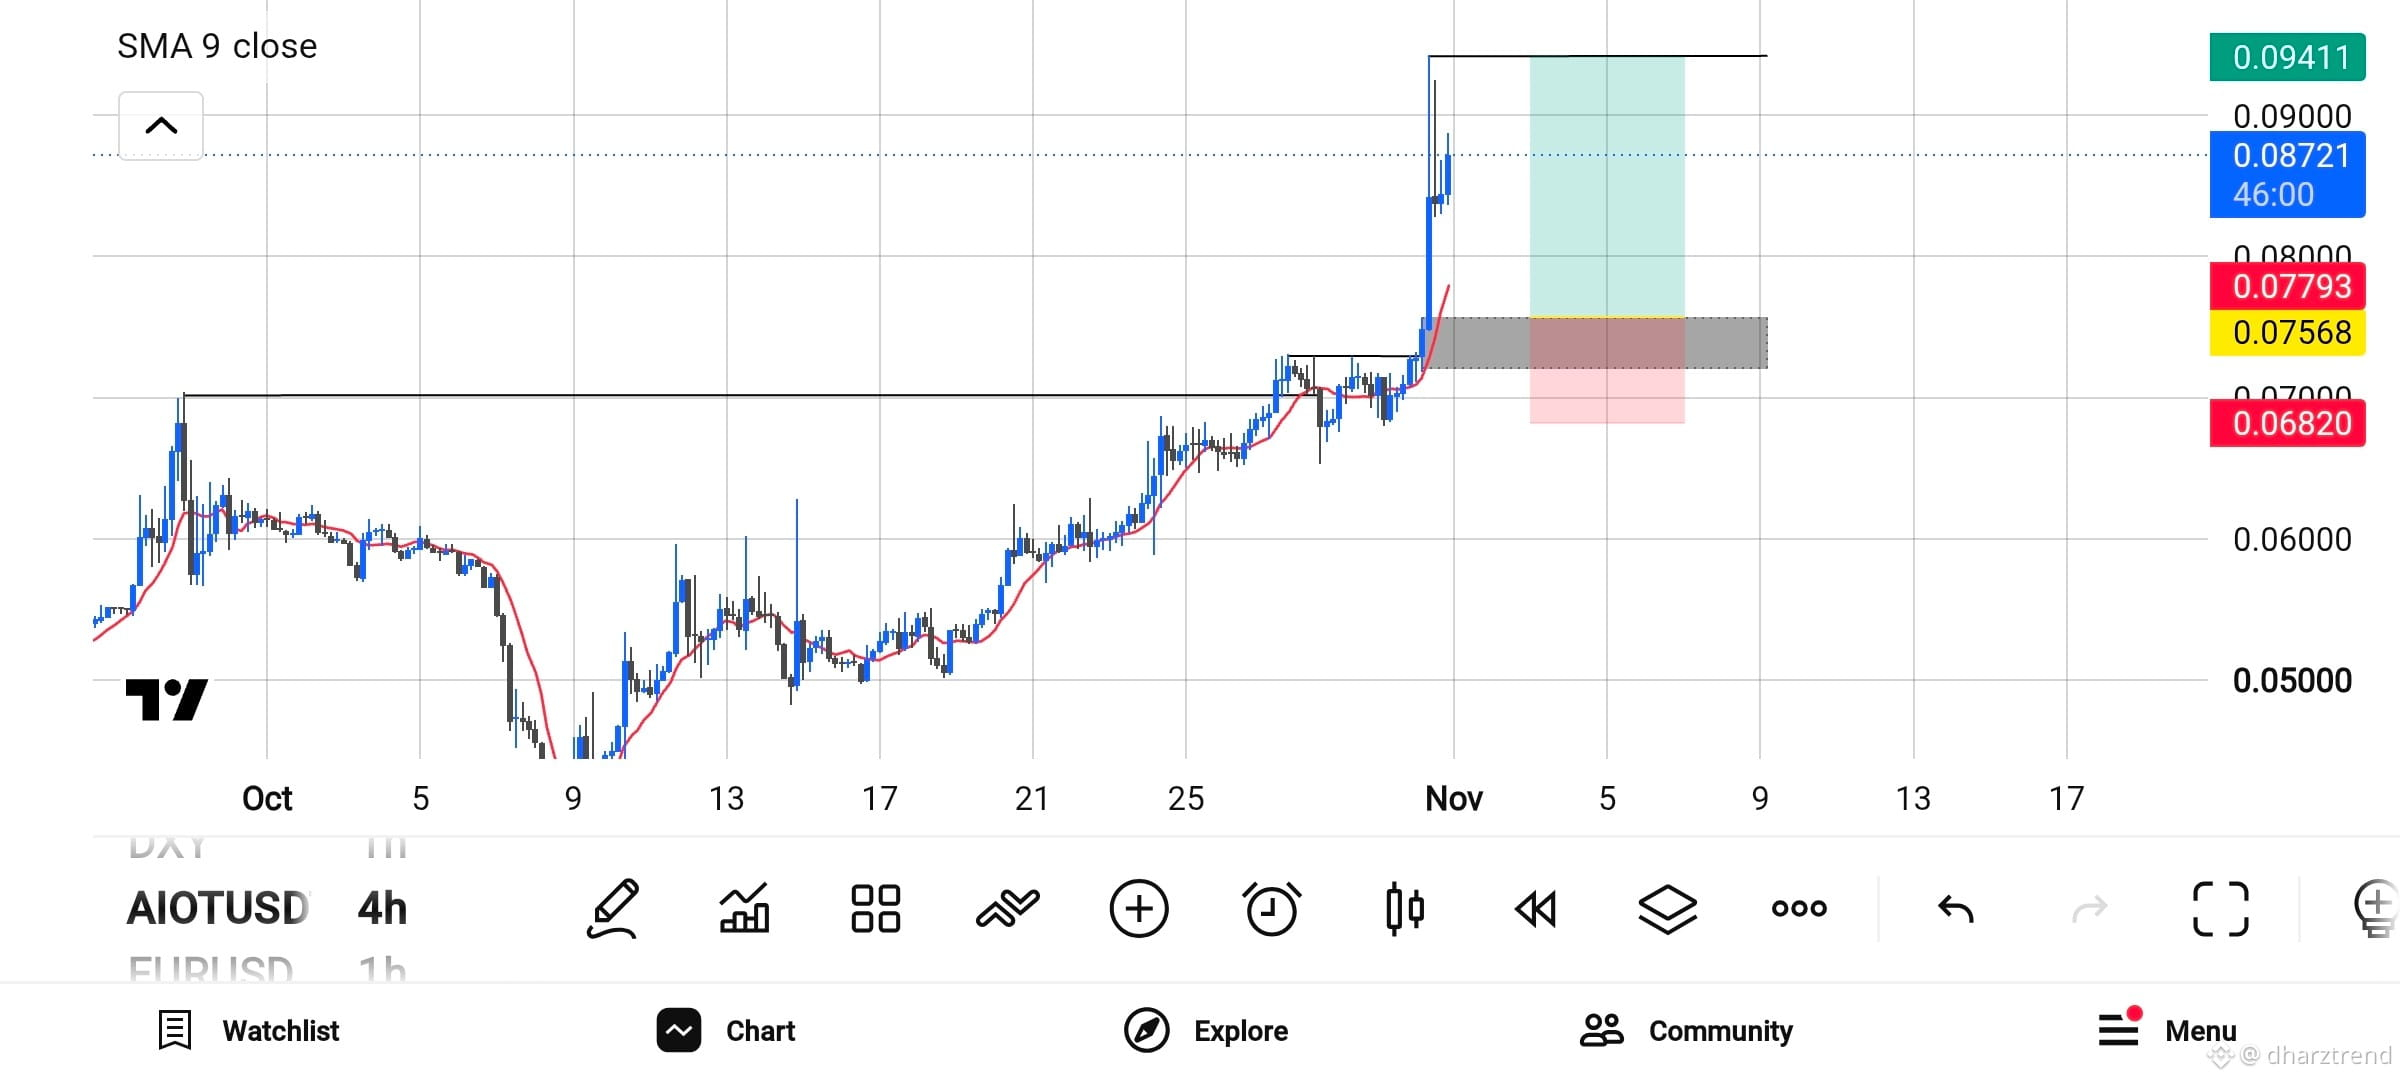
🚀 AIOTUSD Trade Setup — High Probability Breakout!
👋 Hey Binance Community! Sharing my clean trade setup for AIOT/USD on the 4-hour chart — check this out!
📊 Chart Overview
- Pair: AIOT/USD
- Timeframe: 4-Hour
- Indicator Used: SMA 9 (Simple Moving Average)
- Current Price: ~0.08721 | Recent High: 0.09411
✅ What’s Happening Here
AIOT just did a strong breakout from a long consolidation zone! 📈
- Price was steadily climbing + holding above the red SMA 9 line = bullish momentum confirmed
- Broke past resistance decisively with volume — no fakeout signs yet
- The grey box = former resistance turned support zone (~0.07568 – 0.07793)
- Green zone = Target Area → 0.08721 up to 0.09411 🎯
- Red zone = Stop Loss → below 0.06820 — invalid if broken ⚠️
📈 Trade Plan
Detail Price
Entry Zone 0.08200 – 0.08700
Target 1 0.09000
Target 2 0.09411 (Full High)
Stop Loss 0.06820
✅ Risk-Reward Ratio: ~1:2.5 — solid setup!
💡 Key Notes
- SMA 9 acting as dynamic support — as long as price stays above it, uptrend stays intact
- If price pulls back to the grey zone (~0.075–0.078), that's a strong discount re-entry
- If it drops below 0.06820 → setup invalid, don't catch falling knives 🚫
- Always manage risk — don't risk more than you can afford to lose!
⚠️ Disclaimer: This is my personal analysis & educational content — NOT financial advice. DYOR before trading! Crypto is volatile, manage your risk wisely.$AIOT
{future}(AIOTUSDT)
🚀 AIOTUSD Trade Setup — High Probability Breakout!
👋 Hey Binance Community! Sharing my clean trade setup for AIOT/USD on the 4-hour chart — check this out!
📊 Chart Overview
- Pair: AIOT/USD
- Timeframe: 4-Hour
- Indicator Used: SMA 9 (Simple Moving Average)
- Current Price: ~0.08721 | Recent High: 0.09411
✅ What’s Happening Here
AIOT just did a strong breakout from a long consolidation zone! 📈
- Price was steadily climbing + holding above the red SMA 9 line = bullish momentum confirmed
- Broke past resistance decisively with volume — no fakeout signs yet
- The grey box = former resistance turned support zone (~0.07568 – 0.07793)
- Green zone = Target Area → 0.08721 up to 0.09411 🎯
- Red zone = Stop Loss → below 0.06820 — invalid if broken ⚠️
📈 Trade Plan
Detail Price
Entry Zone 0.08200 – 0.08700
Target 1 0.09000
Target 2 0.09411 (Full High)
Stop Loss 0.06820
✅ Risk-Reward Ratio: ~1:2.5 — solid setup!
💡 Key Notes
- SMA 9 acting as dynamic support — as long as price stays above it, uptrend stays intact
- If price pulls back to the grey zone (~0.075–0.078), that's a strong discount re-entry
- If it drops below 0.06820 → setup invalid, don't catch falling knives 🚫
- Always manage risk — don't risk more than you can afford to lose!
⚠️ Disclaimer: This is my personal analysis & educational content — NOT financial advice. DYOR before trading! Crypto is volatile, manage your risk wisely.$AIOT
👋 Hey Binance Community! Sharing my clean trade setup for AIOT/USD on the 4-hour chart — check this out!
📊 Chart Overview
- Pair: AIOT/USD
- Timeframe: 4-Hour
- Indicator Used: SMA 9 (Simple Moving Average)
- Current Price: ~0.08721 | Recent High: 0.09411
✅ What’s Happening Here
AIOT just did a strong breakout from a long consolidation zone! 📈
- Price was steadily climbing + holding above the red SMA 9 line = bullish momentum confirmed
- Broke past resistance decisively with volume — no fakeout signs yet
- The grey box = former resistance turned support zone (~0.07568 – 0.07793)
- Green zone = Target Area → 0.08721 up to 0.09411 🎯
- Red zone = Stop Loss → below 0.06820 — invalid if broken ⚠️
📈 Trade Plan
Detail Price
Entry Zone 0.08200 – 0.08700
Target 1 0.09000
Target 2 0.09411 (Full High)
Stop Loss 0.06820
✅ Risk-Reward Ratio: ~1:2.5 — solid setup!
💡 Key Notes
- SMA 9 acting as dynamic support — as long as price stays above it, uptrend stays intact
- If price pulls back to the grey zone (~0.075–0.078), that's a strong discount re-entry
- If it drops below 0.06820 → setup invalid, don't catch falling knives 🚫
- Always manage risk — don't risk more than you can afford to lose!
⚠️ Disclaimer: This is my personal analysis & educational content — NOT financial advice. DYOR before trading! Crypto is volatile, manage your risk wisely.$AIOT
415
·
--
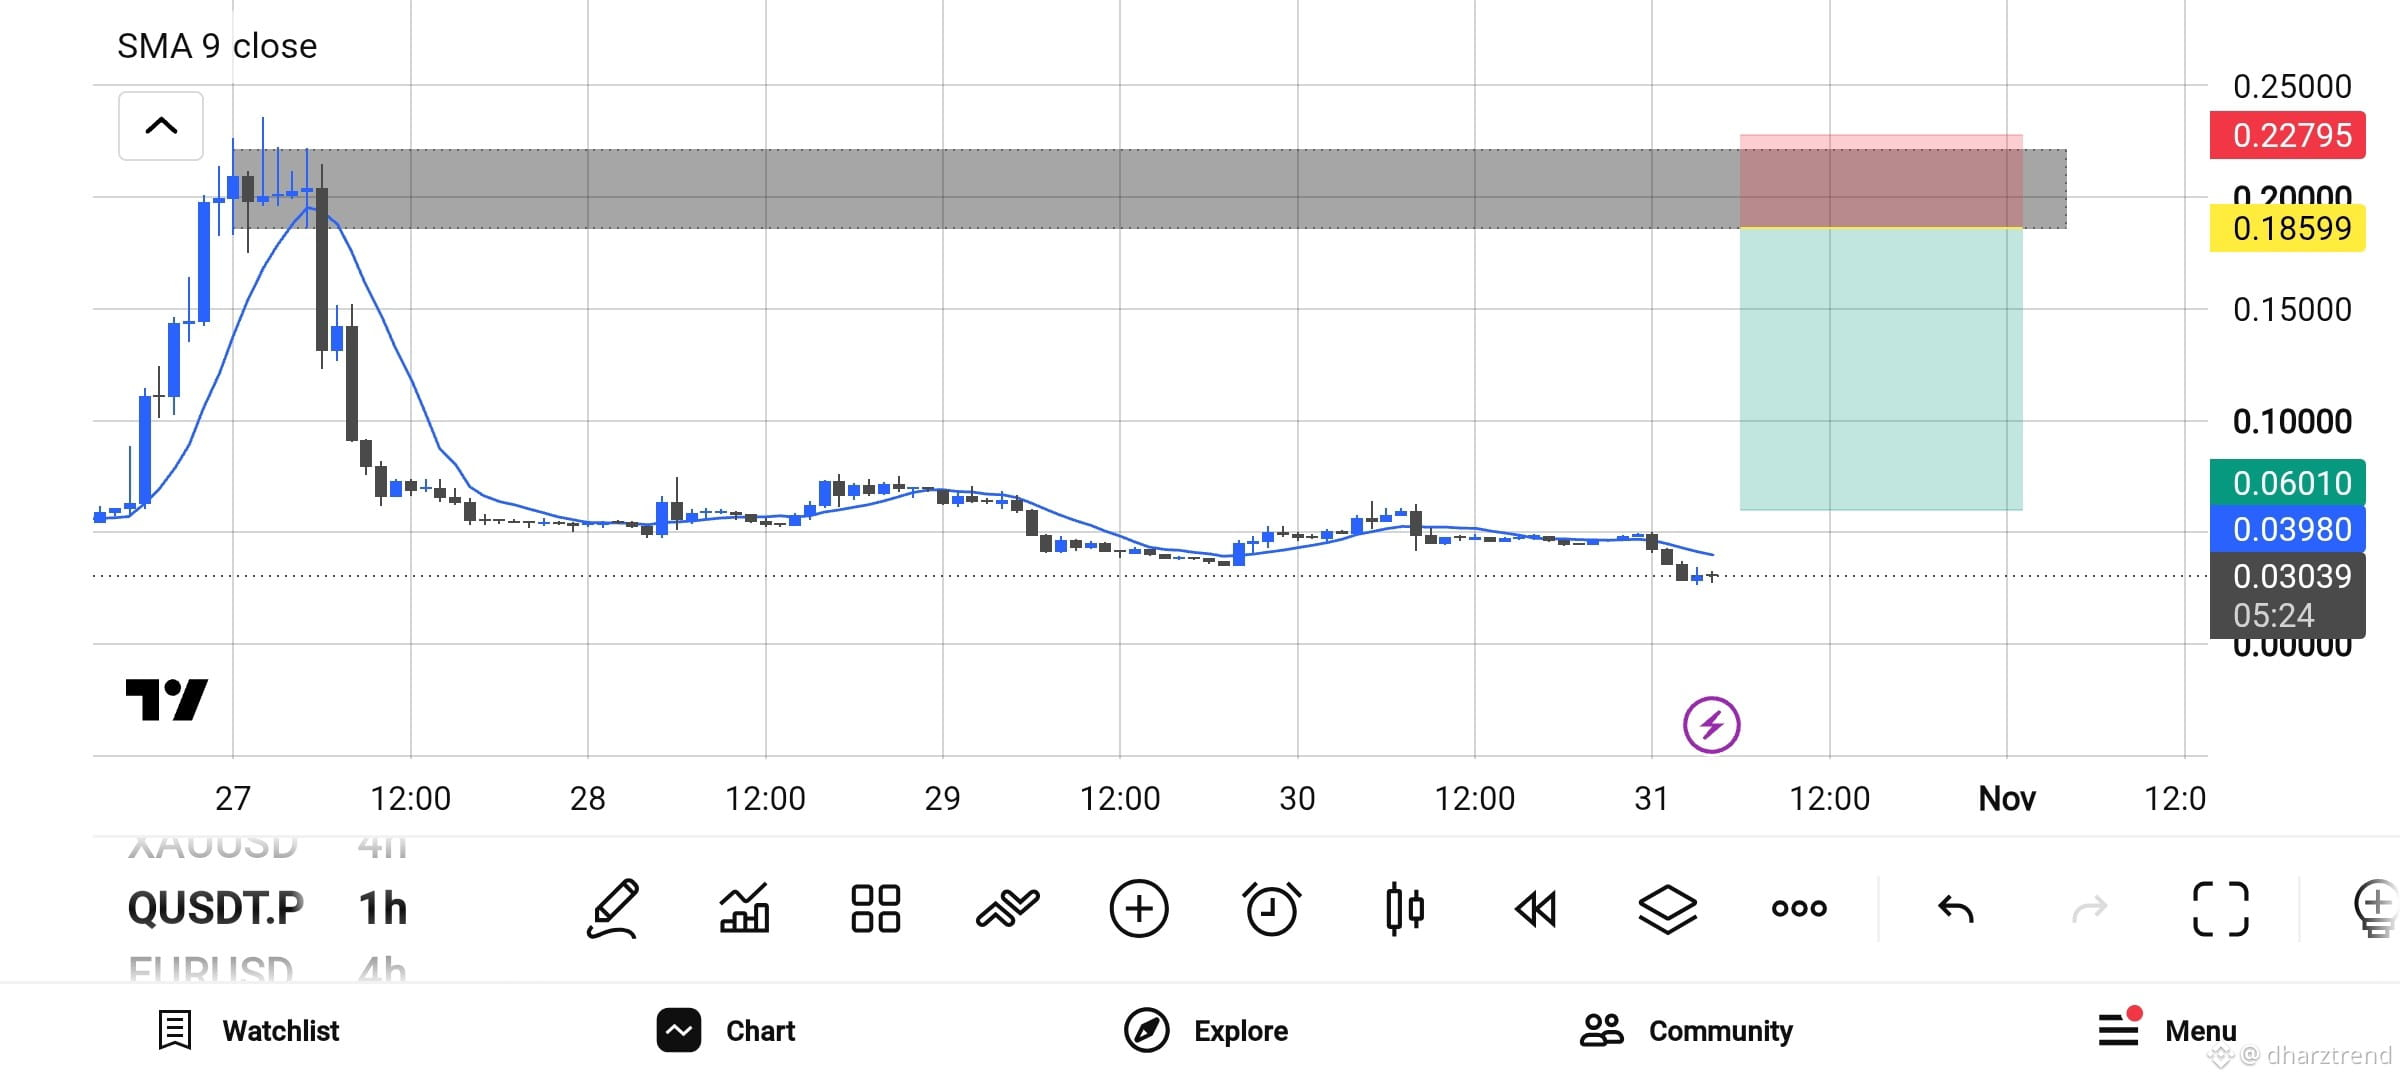
📉 QUSDT.P – BEARISH SETUP | SHORT OPPORTUNITY
The market doesn't always reward those who chase the pump. Sometimes, the best opportunity comes after a massive rally loses its momentum.
🔍 My Trading Setup (1H):
🔴 Direction: SHORT
🎯 Entry: 0.18599
🛑 Stop Loss: 0.22795
💰 Take Profit: 0.06010
Why SHORT?
• Price experienced a massive bearish correction after its strong pump.
• The 9 SMA is showing bearish momentum.
• The marked supply zone provides a potential resistance area.
• I'm looking for a possible rejection from resistance before considering a short entry.
📌 My Strategy:
Wait for price to return to the supply zone and confirm bearish rejection. No confirmation, no trade.
Trading is about patience, discipline, and risk management. Never enter blindly.
What's your view on QUSDT.P? Are you bearish too?
#QUSDT #ShortSetup #CryptoTrading #TechnicalAnalysis #BinanceSquare $Q
{future}(QUSDT)
📉 QUSDT.P – BEARISH SETUP | SHORT OPPORTUNITY
The market doesn't always reward those who chase the pump. Sometimes, the best opportunity comes after a massive rally loses its momentum.
🔍 My Trading Setup (1H):
🔴 Direction: SHORT
🎯 Entry: 0.18599
🛑 Stop Loss: 0.22795
💰 Take Profit: 0.06010
Why SHORT?
• Price experienced a massive bearish correction after its strong pump.
• The 9 SMA is showing bearish momentum.
• The marked supply zone provides a potential resistance area.
• I'm looking for a possible rejection from resistance before considering a short entry.
📌 My Strategy:
Wait for price to return to the supply zone and confirm bearish rejection. No confirmation, no trade.
Trading is about patience, discipline, and risk management. Never enter blindly.
What's your view on QUSDT.P? Are you bearish too?
#QUSDT #ShortSetup #CryptoTrading #TechnicalAnalysis #BinanceSquare $Q
The market doesn't always reward those who chase the pump. Sometimes, the best opportunity comes after a massive rally loses its momentum.
🔍 My Trading Setup (1H):
🔴 Direction: SHORT
🎯 Entry: 0.18599
🛑 Stop Loss: 0.22795
💰 Take Profit: 0.06010
Why SHORT?
• Price experienced a massive bearish correction after its strong pump.
• The 9 SMA is showing bearish momentum.
• The marked supply zone provides a potential resistance area.
• I'm looking for a possible rejection from resistance before considering a short entry.
📌 My Strategy:
Wait for price to return to the supply zone and confirm bearish rejection. No confirmation, no trade.
Trading is about patience, discipline, and risk management. Never enter blindly.
What's your view on QUSDT.P? Are you bearish too?
#QUSDT #ShortSetup #CryptoTrading #TechnicalAnalysis #BinanceSquare $Q
406
·
--
📊 Harmony (ONE) Update — Oct 31, 2026
✨ Current Price: $0.001181 | 🔻 -4.53% today
💰 Market Cap: $29.01M | 📈 Rank #551
📦 Circulation Supply: 24.71B ONE
📅 All-Time High: $0.3798 (Oct 26, 2021)
📉 All-Time Low: $0.000231 (Aug 13, 2026)
💧 24h Volume: $4.97M | Vol/MCap: 17.15% — strong liquidity!
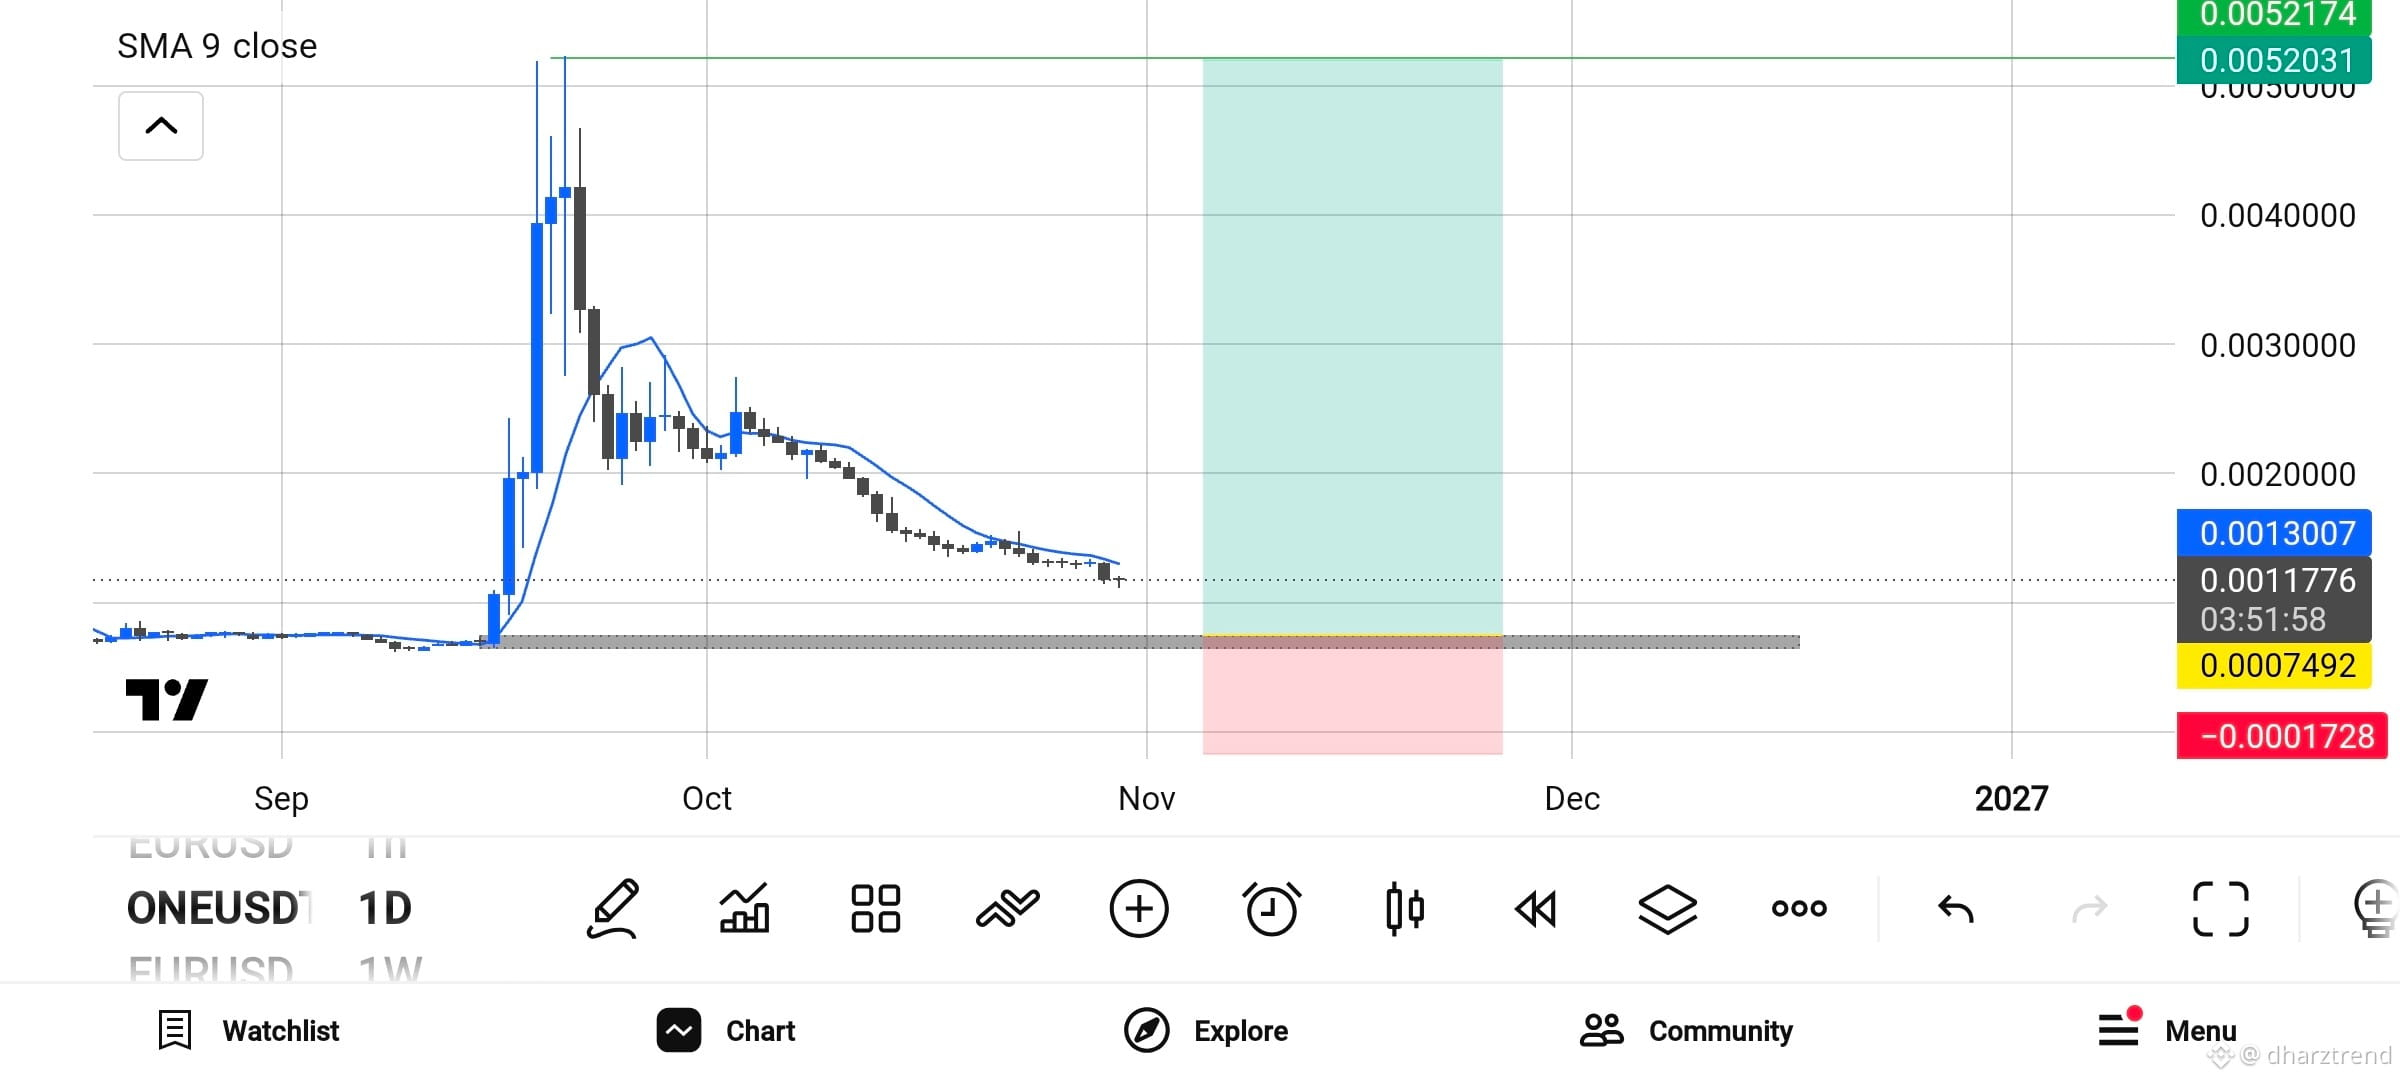
📈 Chart & Price Action
- After a sharp rally in late Sep, ONE has been in a steady downtrend since early Oct
- Currently testing support around $0.00117 – $0.00130 zone
- Key levels to watch:
✅ Support: ~$0.00075 – $0.00100 (strong base zone)
🚀 Resistance: $0.00180 → $0.00250 → $0.00520 (SMA9 high)
- Price is sitting right near recent lows — could see consolidation or bounce from here
💡 Quick Take
ONE is trading at a fraction of its all-time high. Volume remains healthy, meaning traders are still active. It's in a clear downtrend for now, so patience is key — wait for clear reversal signals before chasing. The $0.00075–$0.00100 zone is a critical support area; holding that keeps the door open for a potential recovery play.
⚠️ Not financial advice — DYOR & manage risk! Crypto is volatile.
$ONE
{future}(ONEUSDT)
📊 Harmony (ONE) Update — Oct 31, 2026
✨ Current Price: $0.001181 | 🔻 -4.53% today
💰 Market Cap: $29.01M | 📈 Rank #551
📦 Circulation Supply: 24.71B ONE
📅 All-Time High: $0.3798 (Oct 26, 2021)
📉 All-Time Low: $0.000231 (Aug 13, 2026)
💧 24h Volume: $4.97M | Vol/MCap: 17.15% — strong liquidity!
📈 Chart & Price Action
- After a sharp rally in late Sep, ONE has been in a steady downtrend since early Oct
- Currently testing support around $0.00117 – $0.00130 zone
- Key levels to watch:
✅ Support: ~$0.00075 – $0.00100 (strong base zone)
🚀 Resistance: $0.00180 → $0.00250 → $0.00520 (SMA9 high)
- Price is sitting right near recent lows — could see consolidation or bounce from here
💡 Quick Take
ONE is trading at a fraction of its all-time high. Volume remains healthy, meaning traders are still active. It's in a clear downtrend for now, so patience is key — wait for clear reversal signals before chasing. The $0.00075–$0.00100 zone is a critical support area; holding that keeps the door open for a potential recovery play.
⚠️ Not financial advice — DYOR & manage risk! Crypto is volatile.
$ONE
✨ Current Price: $0.001181 | 🔻 -4.53% today
💰 Market Cap: $29.01M | 📈 Rank #551
📦 Circulation Supply: 24.71B ONE
📅 All-Time High: $0.3798 (Oct 26, 2021)
📉 All-Time Low: $0.000231 (Aug 13, 2026)
💧 24h Volume: $4.97M | Vol/MCap: 17.15% — strong liquidity!
📈 Chart & Price Action
- After a sharp rally in late Sep, ONE has been in a steady downtrend since early Oct
- Currently testing support around $0.00117 – $0.00130 zone
- Key levels to watch:
✅ Support: ~$0.00075 – $0.00100 (strong base zone)
🚀 Resistance: $0.00180 → $0.00250 → $0.00520 (SMA9 high)
- Price is sitting right near recent lows — could see consolidation or bounce from here
💡 Quick Take
ONE is trading at a fraction of its all-time high. Volume remains healthy, meaning traders are still active. It's in a clear downtrend for now, so patience is key — wait for clear reversal signals before chasing. The $0.00075–$0.00100 zone is a critical support area; holding that keeps the door open for a potential recovery play.
⚠️ Not financial advice — DYOR & manage risk! Crypto is volatile.
$ONE
1
513
·
--
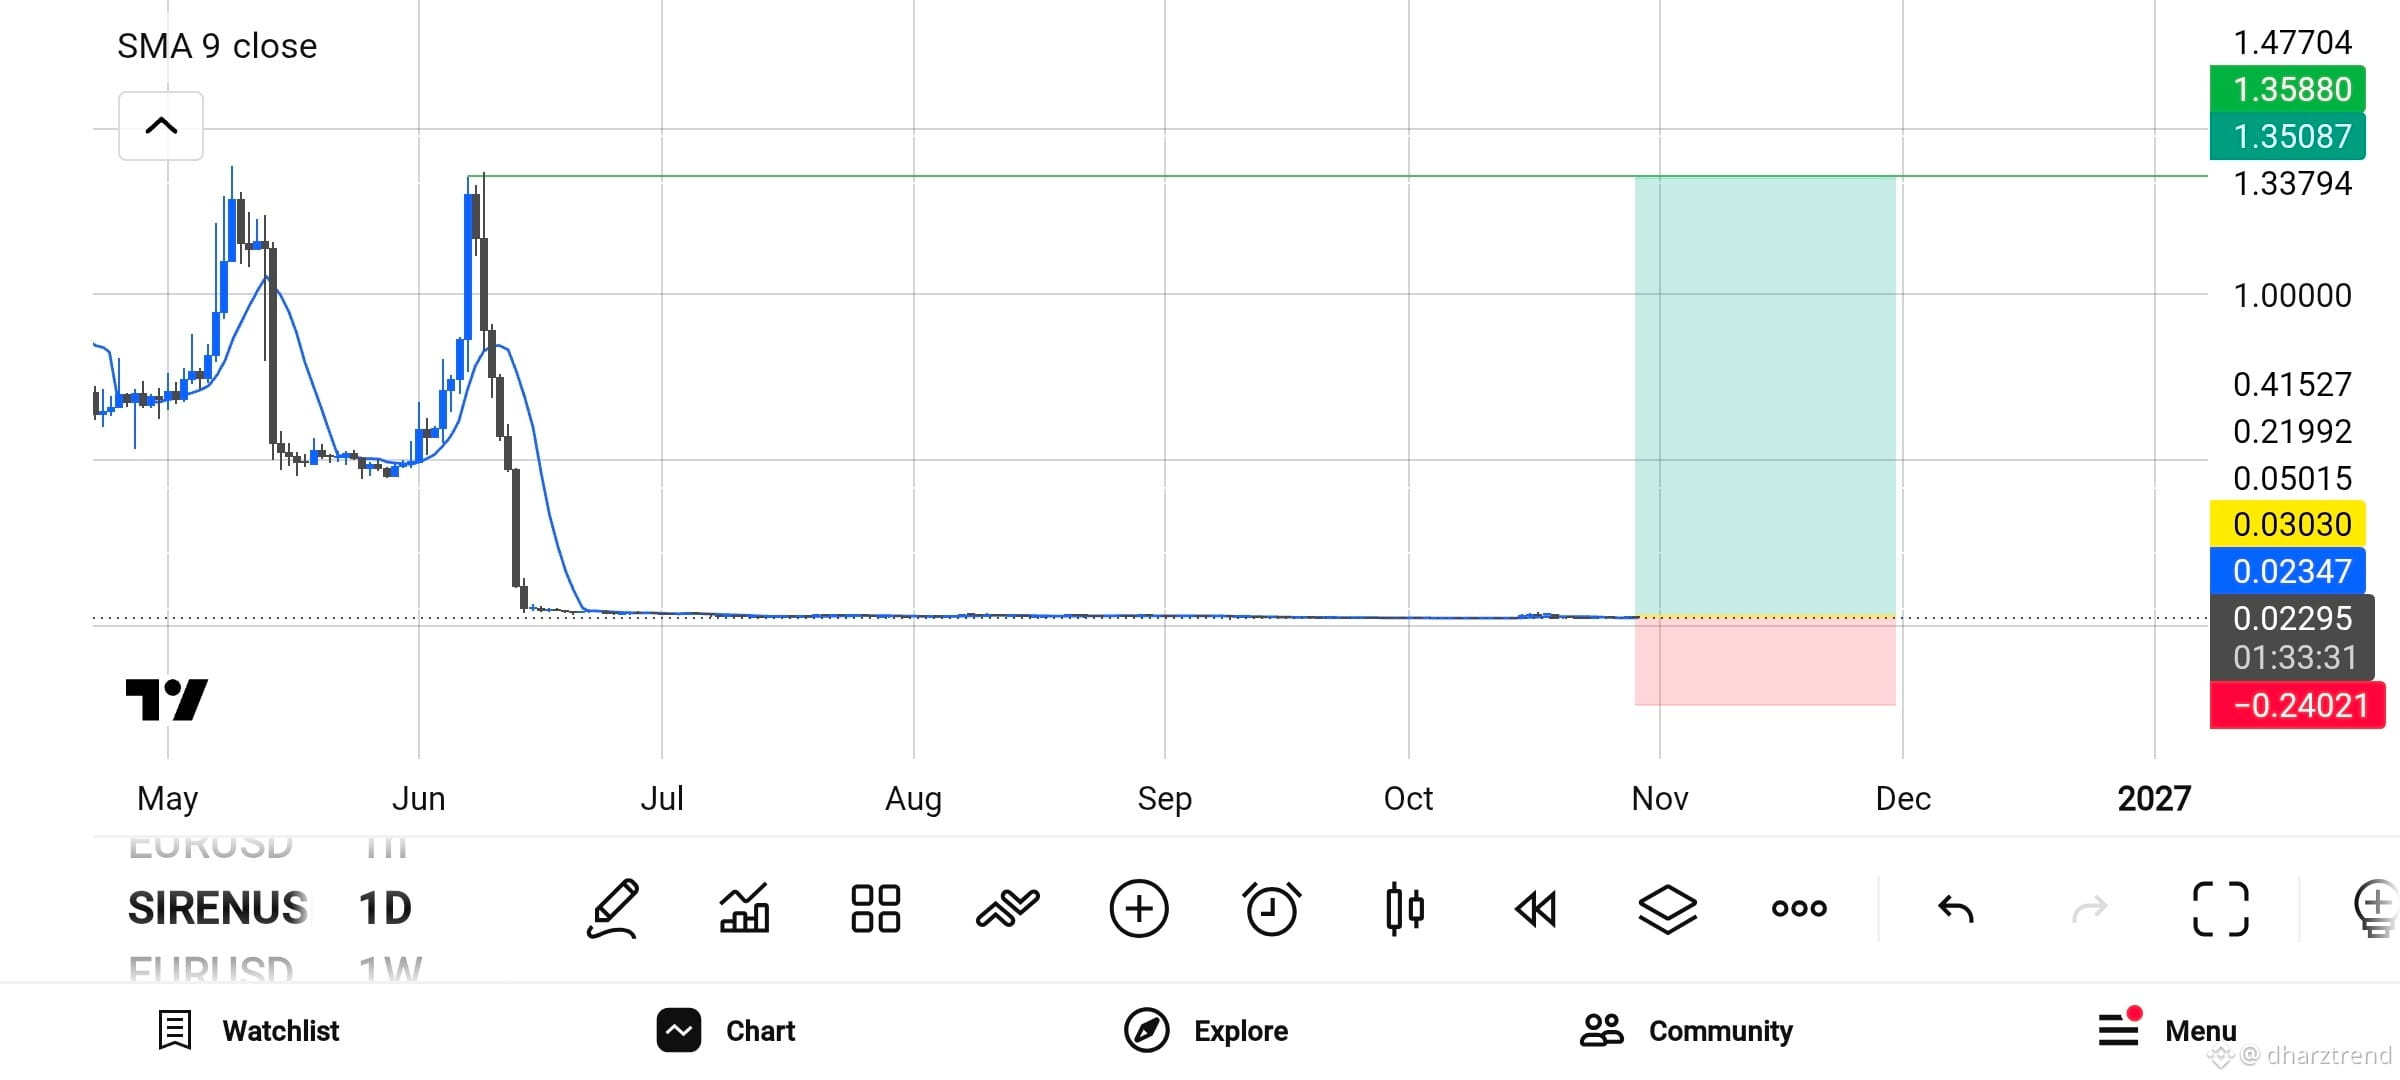
📊 SIRENUS/USDT – My Daily Chart Trading Plan
I’m analyzing SIRENUS on the 1D timeframe using the SMA 9 and a potential breakout setup.
My Trading Plan:
- Entry: Wait for price confirmation and a strong breakout.
- Take Profit (TP): 1.33794
- Stop Loss (SL): 0.02347
- Risk Management: Always calculate your position size and risk only what you can afford to lose.
⚠️ The chart shows extremely sharp historical price movements followed by a prolonged period of very low prices. The displayed targets are speculative and should not be treated as confirmed price predictions.
This is my personal technical analysis, not financial advice. Always DYOR before entering a trade.
📈 What do you think about this setup? Are you watching SIRENUS for a possible breakout?
#CryptoTrading #TechnicalAnalysis #SIRENUS #TradingStrategy #Binance $SIREN
{future}(SIRENUSDT)
📊 SIRENUS/USDT – My Daily Chart Trading Plan
I’m analyzing SIRENUS on the 1D timeframe using the SMA 9 and a potential breakout setup.
My Trading Plan:
- Entry: Wait for price confirmation and a strong breakout.
- Take Profit (TP): 1.33794
- Stop Loss (SL): 0.02347
- Risk Management: Always calculate your position size and risk only what you can afford to lose.
⚠️ The chart shows extremely sharp historical price movements followed by a prolonged period of very low prices. The displayed targets are speculative and should not be treated as confirmed price predictions.
This is my personal technical analysis, not financial advice. Always DYOR before entering a trade.
📈 What do you think about this setup? Are you watching SIRENUS for a possible breakout?
#CryptoTrading #TechnicalAnalysis #SIRENUS #TradingStrategy #Binance $SIREN
I’m analyzing SIRENUS on the 1D timeframe using the SMA 9 and a potential breakout setup.
My Trading Plan:
- Entry: Wait for price confirmation and a strong breakout.
- Take Profit (TP): 1.33794
- Stop Loss (SL): 0.02347
- Risk Management: Always calculate your position size and risk only what you can afford to lose.
⚠️ The chart shows extremely sharp historical price movements followed by a prolonged period of very low prices. The displayed targets are speculative and should not be treated as confirmed price predictions.
This is my personal technical analysis, not financial advice. Always DYOR before entering a trade.
📈 What do you think about this setup? Are you watching SIRENUS for a possible breakout?
#CryptoTrading #TechnicalAnalysis #SIRENUS #TradingStrategy #Binance $SIREN
498
·
--
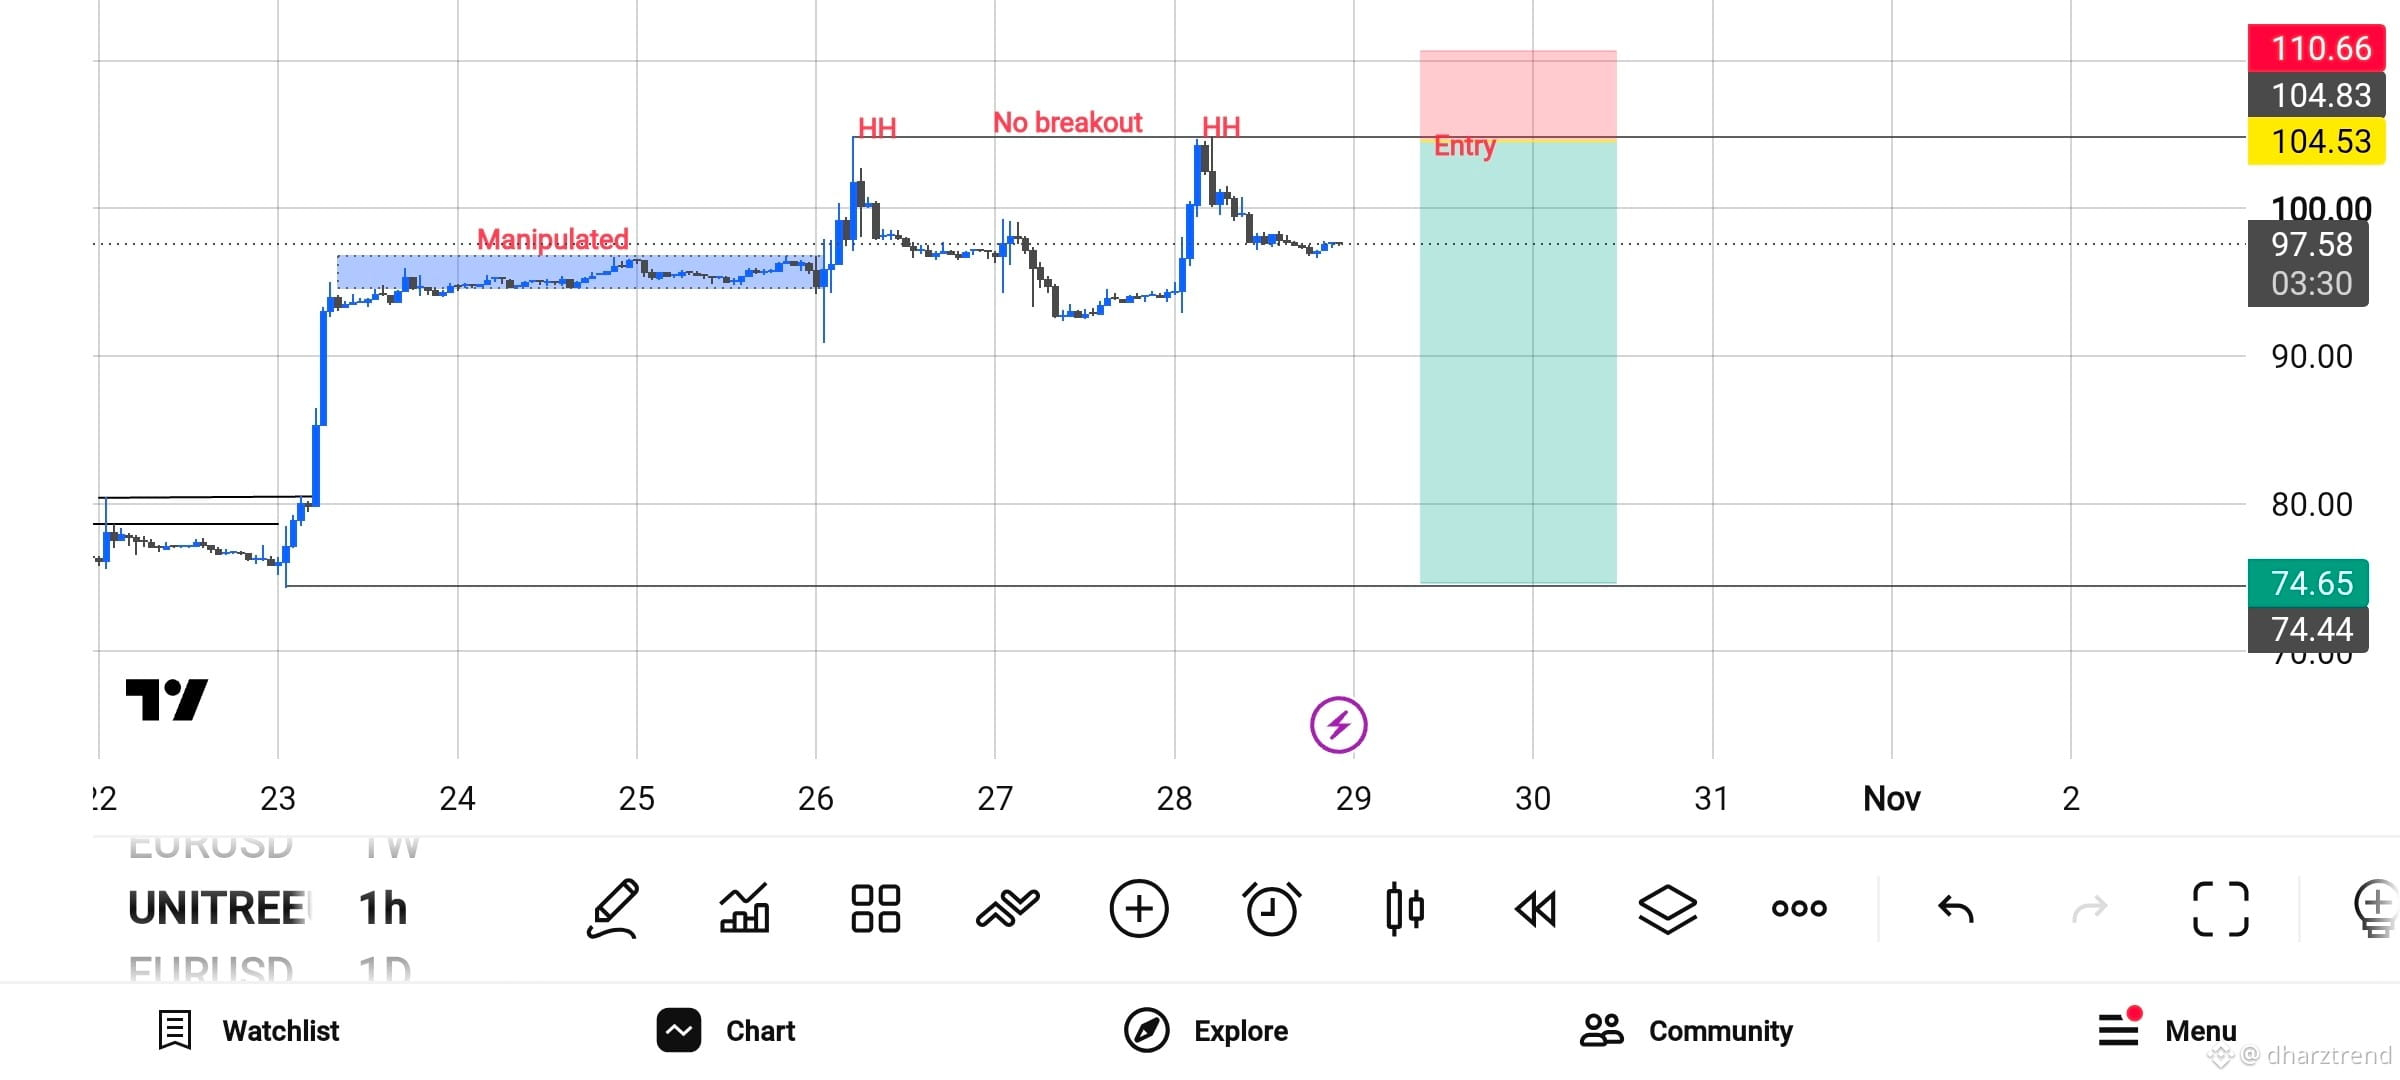
📉 SHORT / SELL SETUP
Timeframe: 1H
Setup Logic: Double Top pattern • Two Higher Highs but no valid breakout → clear rejection at resistance zone → bearish reversal confirmed
Entry Zone: 104.53 – 104.83
Stop Loss: Above resistance → ~110.66
Targets:
• T1: 100.00
• T2: 97.58
• T3: 74.65
Why Sell: Price failed to hold above resistance → buyers exhausted, bears taking control ✅$UNITREE
📉 SHORT / SELL SETUP
Timeframe: 1H
Setup Logic: Double Top pattern • Two Higher Highs but no valid breakout → clear rejection at resistance zone → bearish reversal confirmed
Entry Zone: 104.53 – 104.83
Stop Loss: Above resistance → ~110.66
Targets:
• T1: 100.00
• T2: 97.58
• T3: 74.65
Why Sell: Price failed to hold above resistance → buyers exhausted, bears taking control ✅$UNITREE
Timeframe: 1H
Setup Logic: Double Top pattern • Two Higher Highs but no valid breakout → clear rejection at resistance zone → bearish reversal confirmed
Entry Zone: 104.53 – 104.83
Stop Loss: Above resistance → ~110.66
Targets:
• T1: 100.00
• T2: 97.58
• T3: 74.65
Why Sell: Price failed to hold above resistance → buyers exhausted, bears taking control ✅$UNITREE
770
·
--
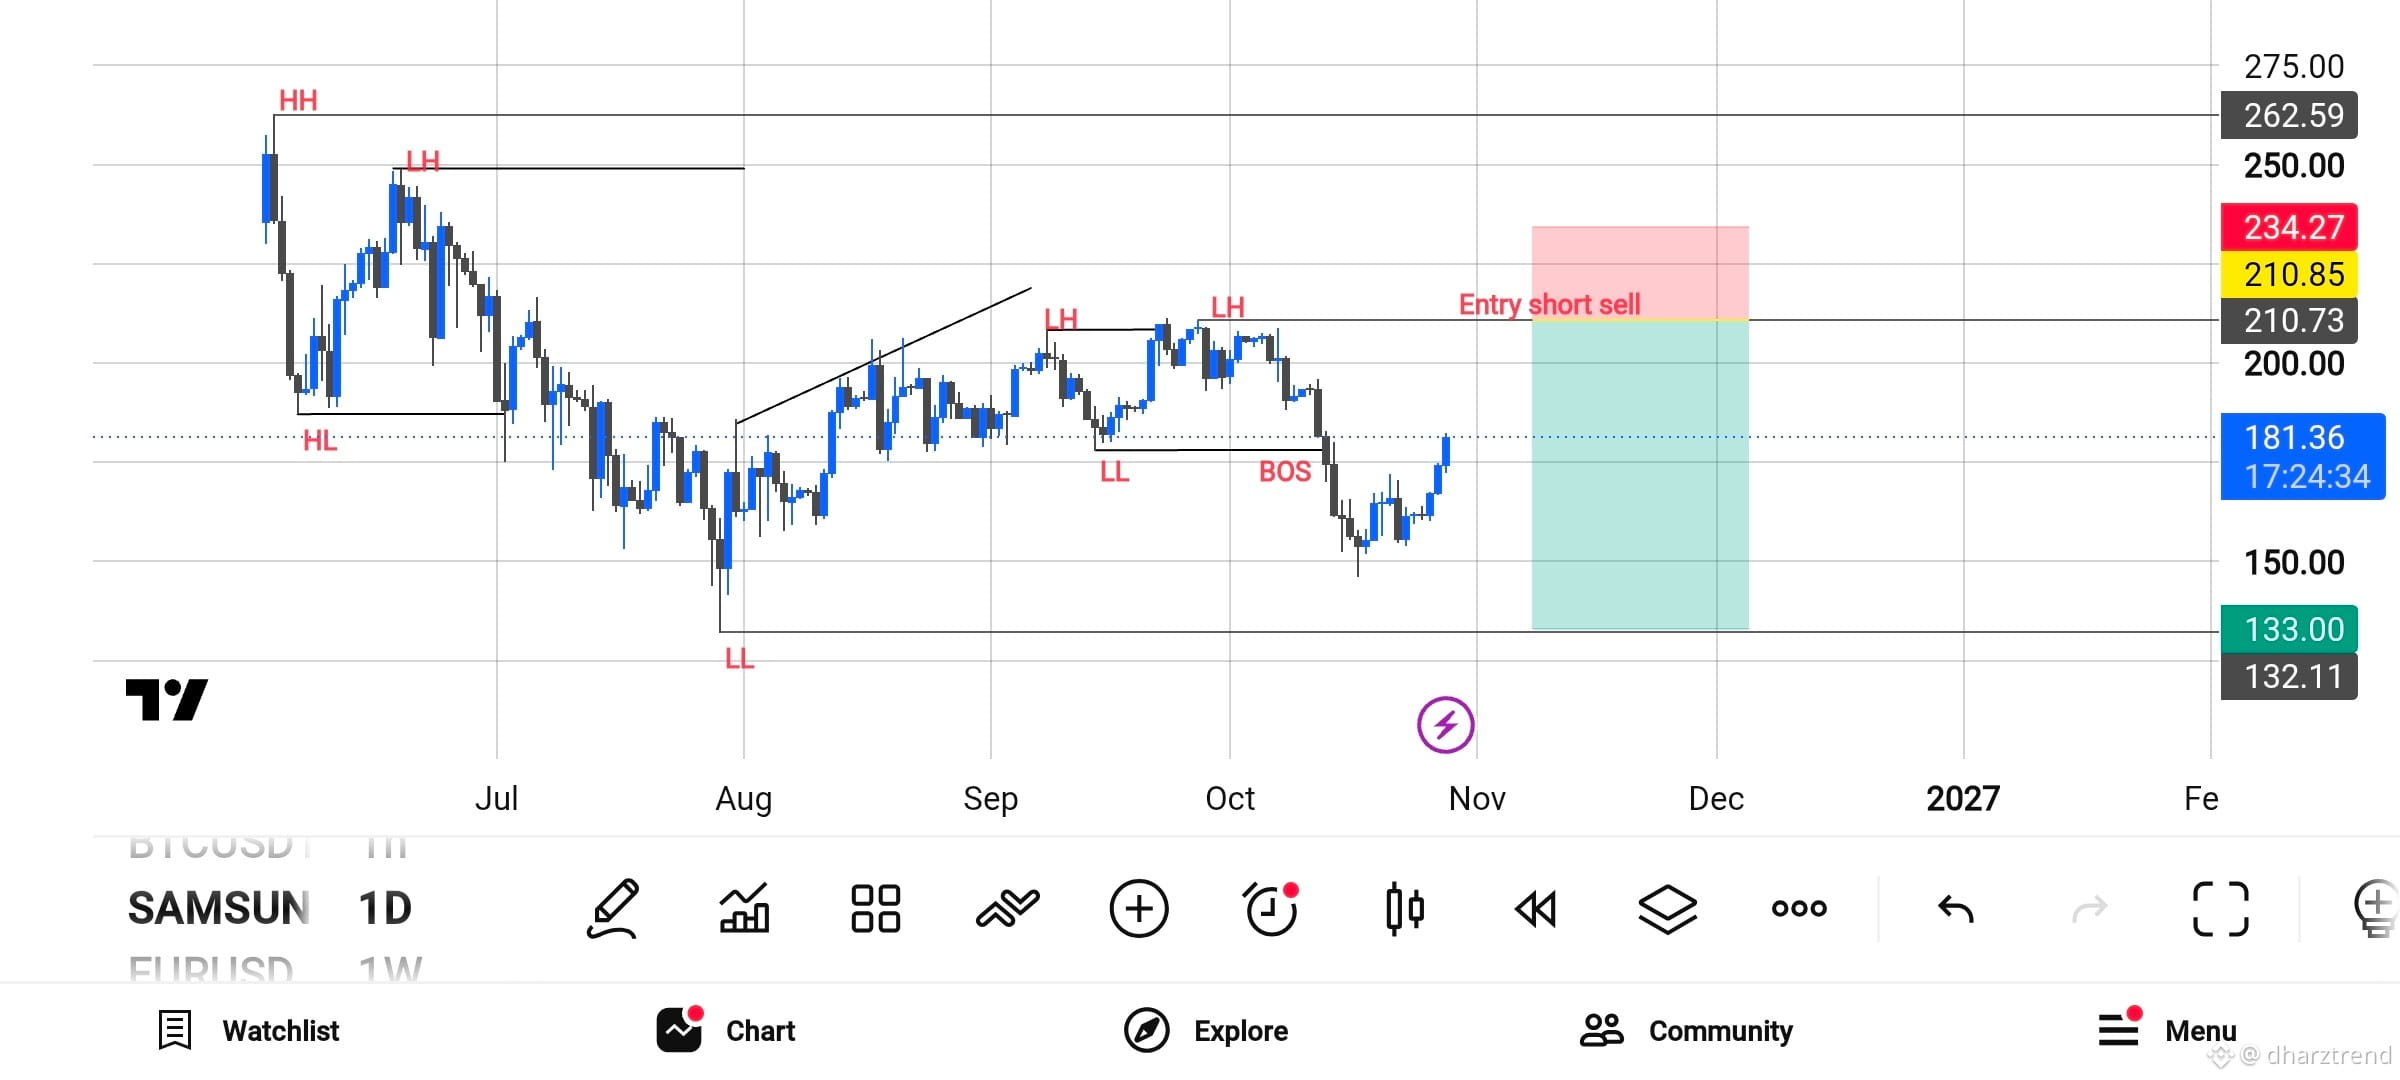
samsung📉 Samsung Stock Analysis | My Current Trading Strategy
My current strategy is based on market structure and price action.
Looking at the daily chart, the market is showing bearish signs, with lower highs (LH), lower lows (LL), and a recent break of structure (BOS).
🎯 My Trading Plan
- Entry: 210.73
- Stop Loss: 234.27
- Take Profit: 133.00
I am waiting for a possible pullback toward the resistance zone before considering a short setup. Patience and confirmation are important before entering any trade.
This is my personal technical analysis, not financial advice.
What do you think about this setup?
#Samsung #StockAnalysis #PriceAction #tradingStrategy $SAMSUNG
samsung📉 Samsung Stock Analysis | My Current Trading Strategy
My current strategy is based on market structure and price action.
Looking at the daily chart, the market is showing bearish signs, with lower highs (LH), lower lows (LL), and a recent break of structure (BOS).
🎯 My Trading Plan
- Entry: 210.73
- Stop Loss: 234.27
- Take Profit: 133.00
I am waiting for a possible pullback toward the resistance zone before considering a short setup. Patience and confirmation are important before entering any trade.
This is my personal technical analysis, not financial advice.
What do you think about this setup?
#Samsung #StockAnalysis #PriceAction #tradingStrategy $SAMSUNG
My current strategy is based on market structure and price action.
Looking at the daily chart, the market is showing bearish signs, with lower highs (LH), lower lows (LL), and a recent break of structure (BOS).
🎯 My Trading Plan
- Entry: 210.73
- Stop Loss: 234.27
- Take Profit: 133.00
I am waiting for a possible pullback toward the resistance zone before considering a short setup. Patience and confirmation are important before entering any trade.
This is my personal technical analysis, not financial advice.
What do you think about this setup?
#Samsung #StockAnalysis #PriceAction #tradingStrategy $SAMSUNG
170
·
--
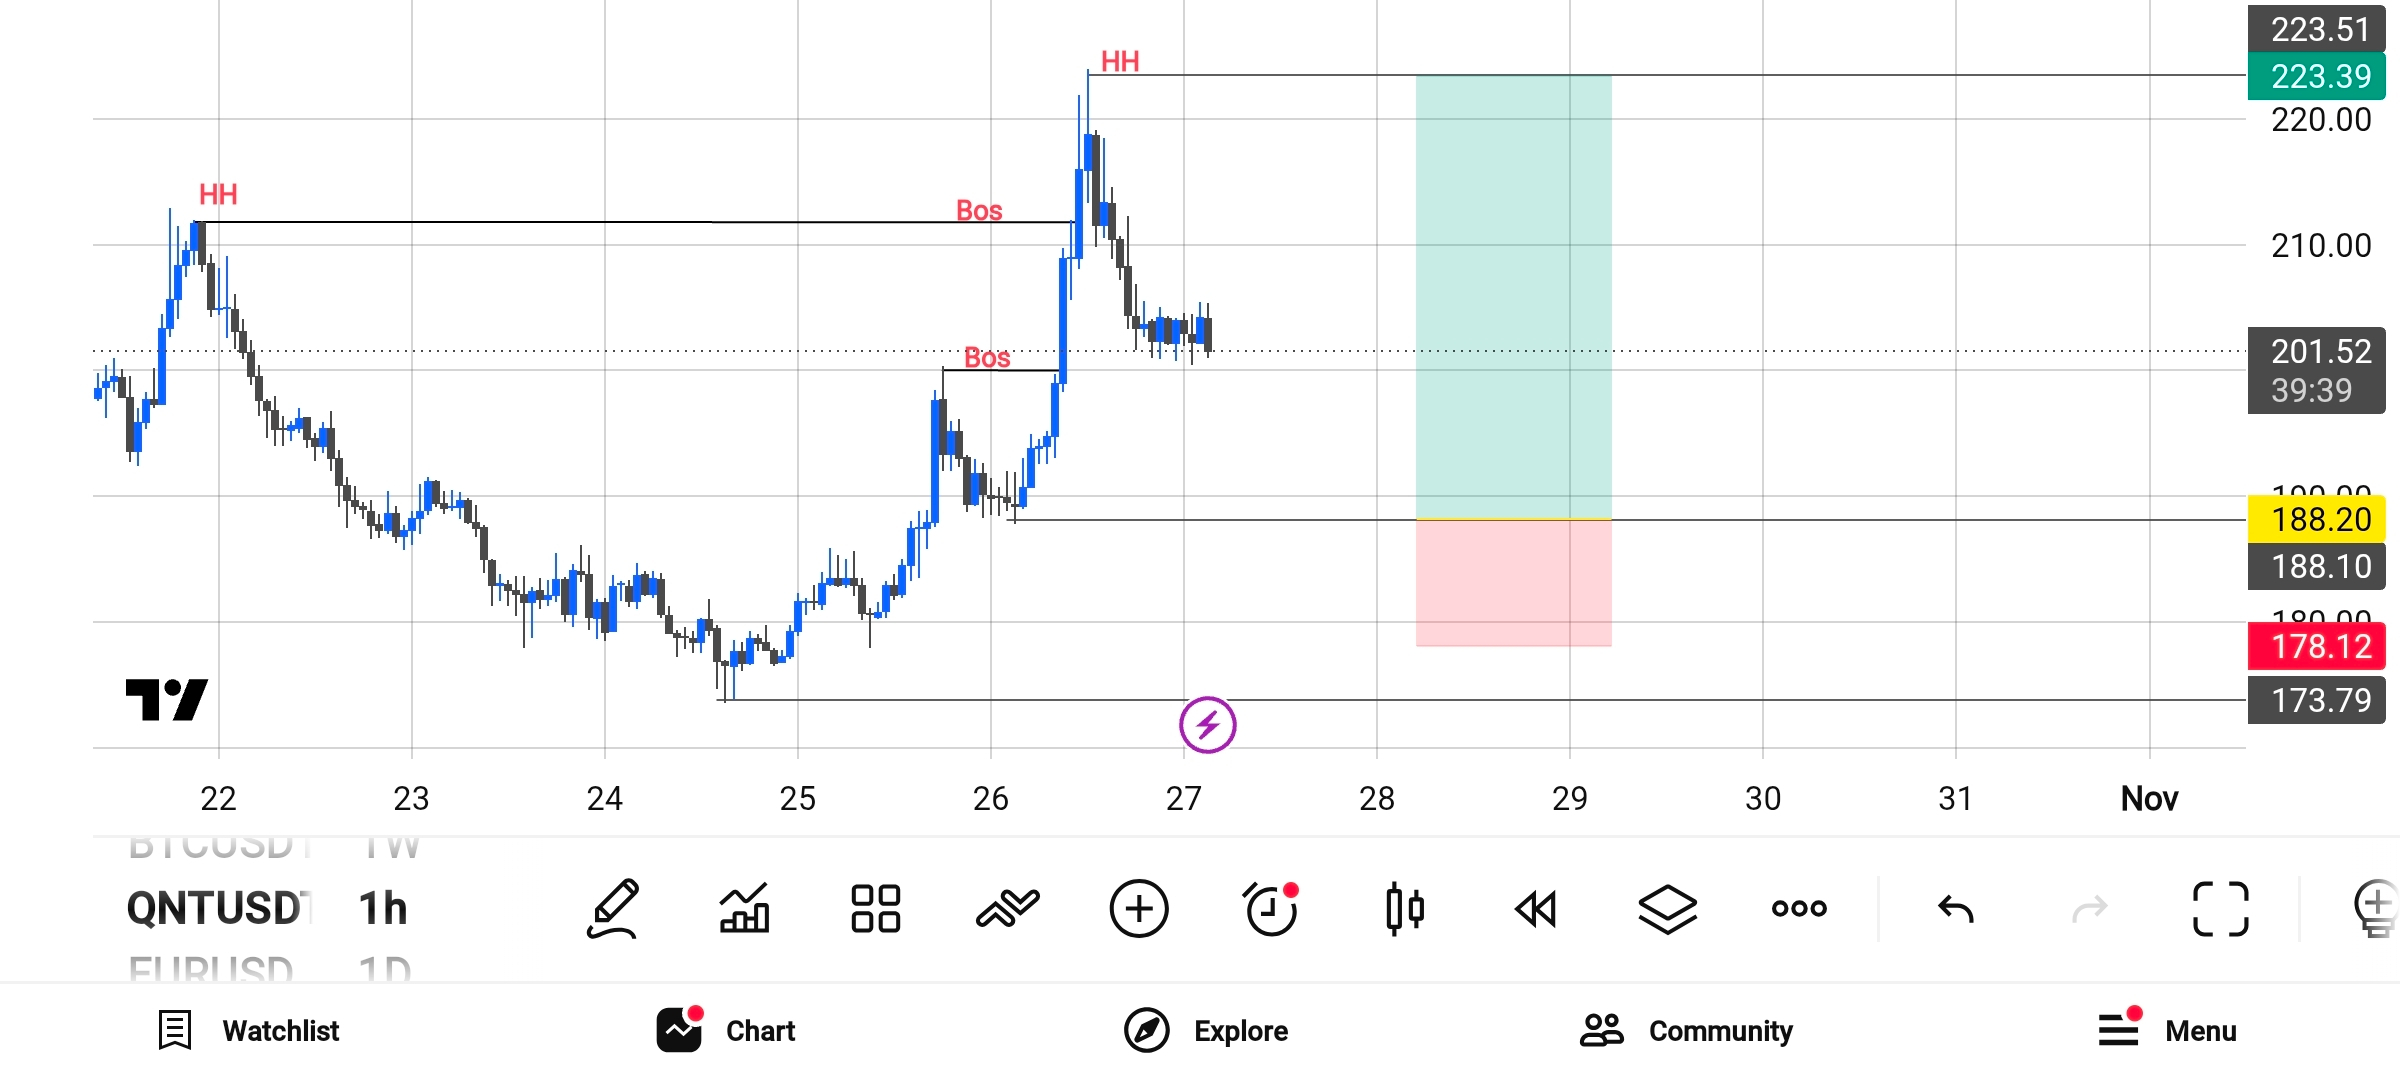
QNTUSDT 1H – Bullish Market Structure 📈
This is my current trading strategy for QNTUSDT.
Price broke above previous resistance and formed a new Higher High (HH), showing bullish market structure. After the strong upward move, price is now pulling back and consolidating.
My Trading Plan:
- Entry: 188.20
- Stop Loss: 178.12
- Take Profit: 223.39
- Risk-to-Reward: Approximately 1:3.5
My approach is to follow market structure, wait for a pullback, and look for a potential continuation of the uptrend. I will monitor price action around the entry zone before considering the setup.
This is my personal chart analysis, not financial advice. Always manage your risk and do your own research.
What do you think about this QNT setup?$BTC $QNT $PEPE
QNTUSDT 1H – Bullish Market Structure 📈
This is my current trading strategy for QNTUSDT.
Price broke above previous resistance and formed a new Higher High (HH), showing bullish market structure. After the strong upward move, price is now pulling back and consolidating.
My Trading Plan:
- Entry: 188.20
- Stop Loss: 178.12
- Take Profit: 223.39
- Risk-to-Reward: Approximately 1:3.5
My approach is to follow market structure, wait for a pullback, and look for a potential continuation of the uptrend. I will monitor price action around the entry zone before considering the setup.
This is my personal chart analysis, not financial advice. Always manage your risk and do your own research.
What do you think about this QNT setup?$BTC $QNT $PEPE
This is my current trading strategy for QNTUSDT.
Price broke above previous resistance and formed a new Higher High (HH), showing bullish market structure. After the strong upward move, price is now pulling back and consolidating.
My Trading Plan:
- Entry: 188.20
- Stop Loss: 178.12
- Take Profit: 223.39
- Risk-to-Reward: Approximately 1:3.5
My approach is to follow market structure, wait for a pullback, and look for a potential continuation of the uptrend. I will monitor price action around the entry zone before considering the setup.
This is my personal chart analysis, not financial advice. Always manage your risk and do your own research.
What do you think about this QNT setup?$BTC $QNT $PEPE
354
·
--
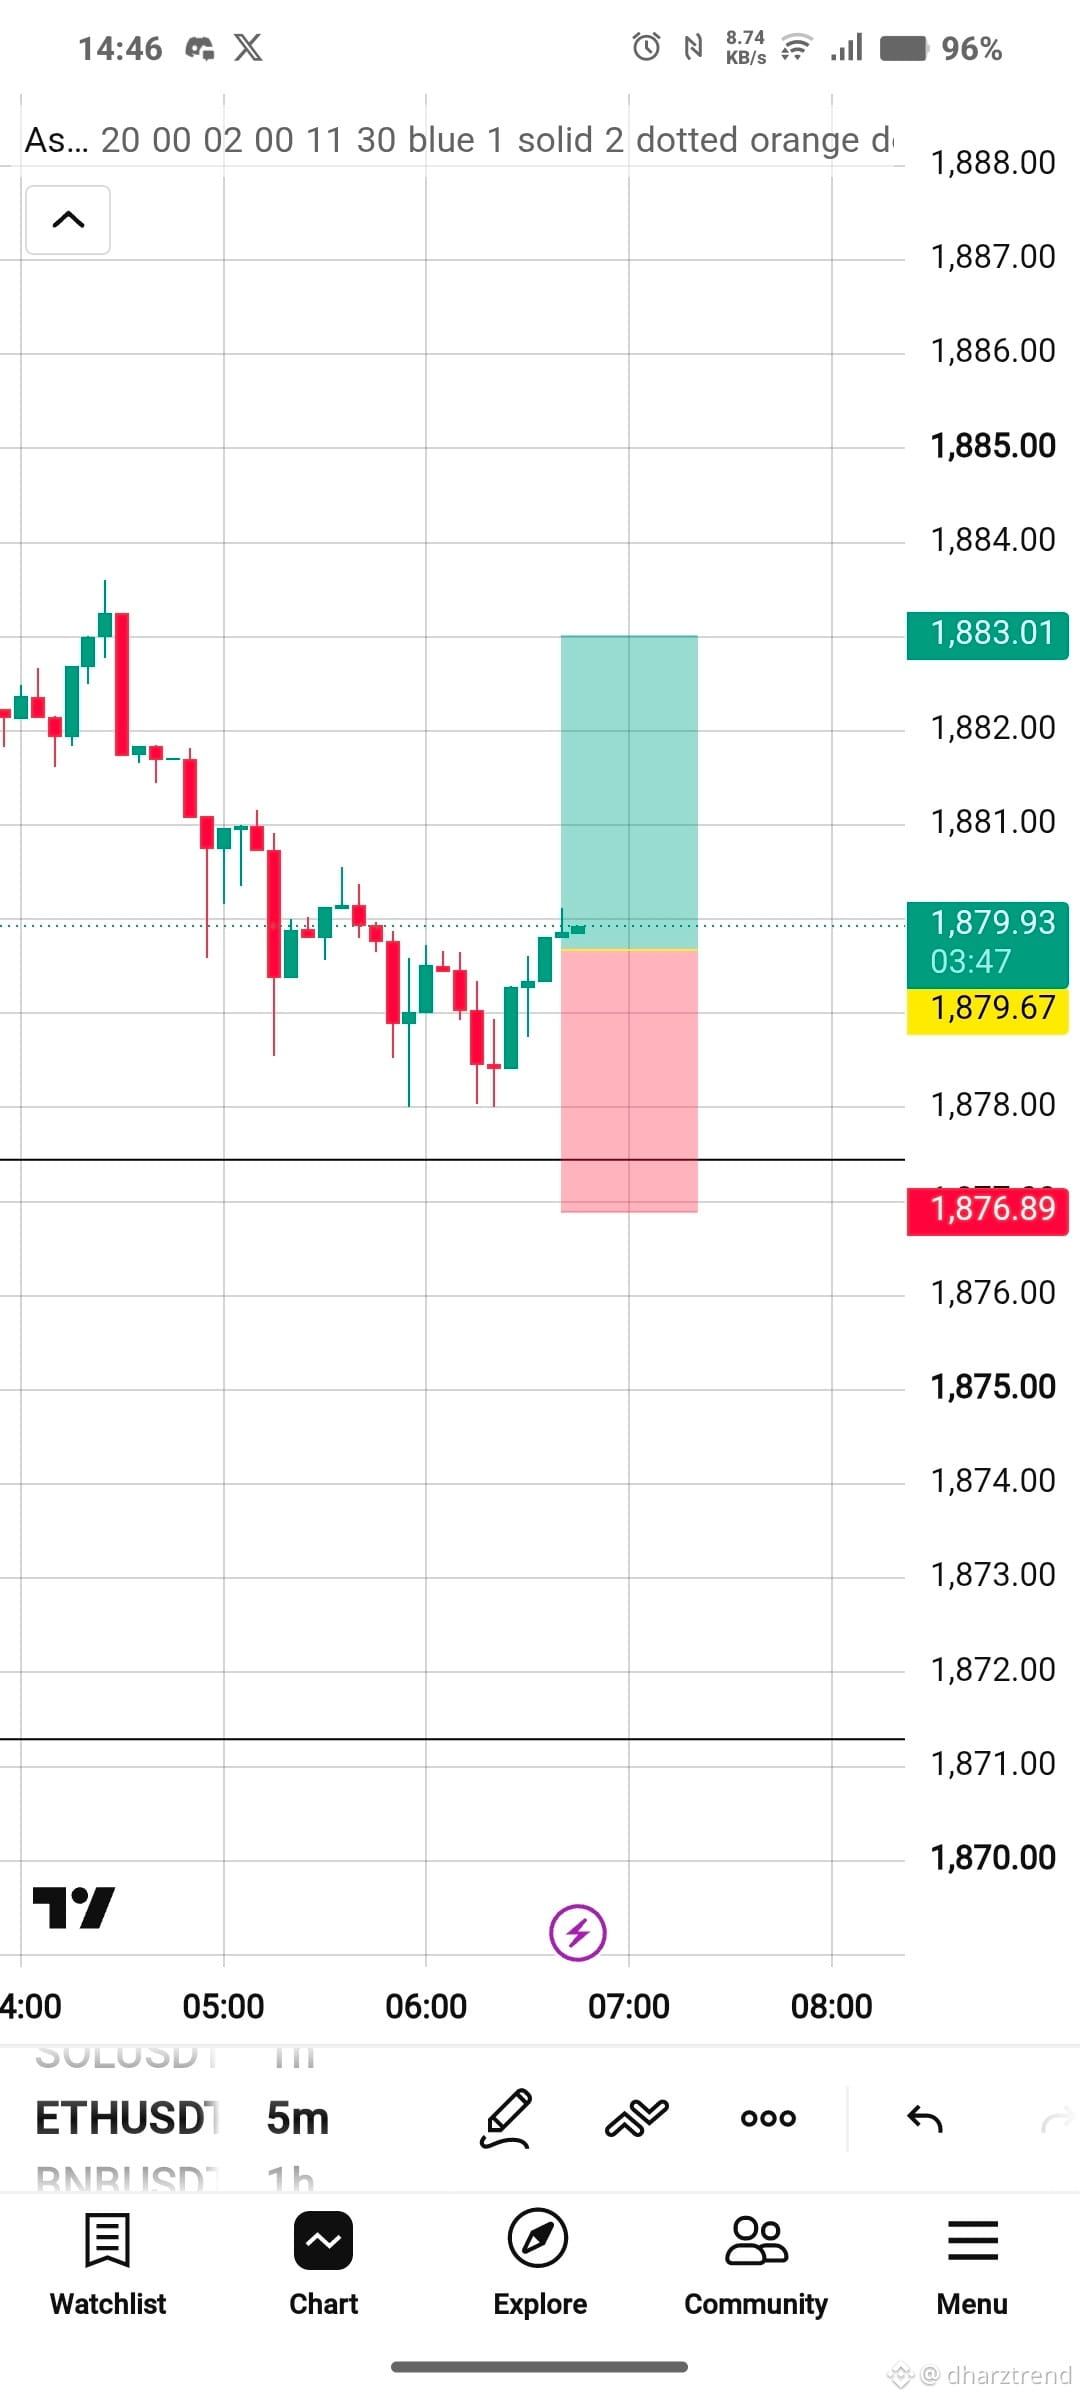
ETHUSDT 5M — LONG SETUP 📈
Price is showing a bullish reaction after testing the lower area around 1,878–1,879.
🎯 Entry: 1,879.67
🛑 Stop Loss: 1,876.89
💰 Take Profit: 1,883.01
📊 Risk/Reward: ~1:1.2
Trade idea: Wait for confirmation that buyers are taking control. If price breaks and holds above the nearby resistance, the next target is around 1,883.#ETH #Ethereum #CryptoTrading.
ETHUSDT 5M — LONG SETUP 📈
Price is showing a bullish reaction after testing the lower area around 1,878–1,879.
🎯 Entry: 1,879.67
🛑 Stop Loss: 1,876.89
💰 Take Profit: 1,883.01
📊 Risk/Reward: ~1:1.2
Trade idea: Wait for confirmation that buyers are taking control. If price breaks and holds above the nearby resistance, the next target is around 1,883.#ETH #Ethereum #CryptoTrading.
Price is showing a bullish reaction after testing the lower area around 1,878–1,879.
🎯 Entry: 1,879.67
🛑 Stop Loss: 1,876.89
💰 Take Profit: 1,883.01
📊 Risk/Reward: ~1:1.2
Trade idea: Wait for confirmation that buyers are taking control. If price breaks and holds above the nearby resistance, the next target is around 1,883.#ETH #Ethereum #CryptoTrading.
70
Log in to explore more content
Join global crypto users on Binance Square
⚡️ Get latest and useful information about crypto.
💬 Trusted by the world’s largest crypto exchange.
👍 Discover real insights from verified creators.
Email / Phone number
Trending Topics
BitcoinFiveWeeklyLosses
15,118 views
439 Discussing
Bitcoin News | Bitcoin Slides for Five Straight Weeks as AI Stock Rout Spills Into Crypto
Binance News
·8 Likes
·10.2k views
AIChipSlumpNasdaq
8,127 views
252 Discussing
NvidiaInvestigatesAfterHuang’sAffairApology
5,769 views
128 Discussing