
比特大熊
587 Posts

比特大熊
Report
Block User
推特X:比特大熊,🧣比特大熊2 持证职业金融理财师(证书编号:ABJ0087646),拥有十年一线金融交易实战经验,深耕趋势研判、量价结构、关键支撑阻力、波段周期共振、风险头寸管理等核心技术体系,擅长多周期盘面拆解、形态识别与量化信号筛选,专注打造高胜率、低回撤、可复制的标准化交易策略。
Frequent Trader
2.9 Years
3 Following
304 Followers
476 Liked
Posts
All
Quotes
Videos
·
--
See translation
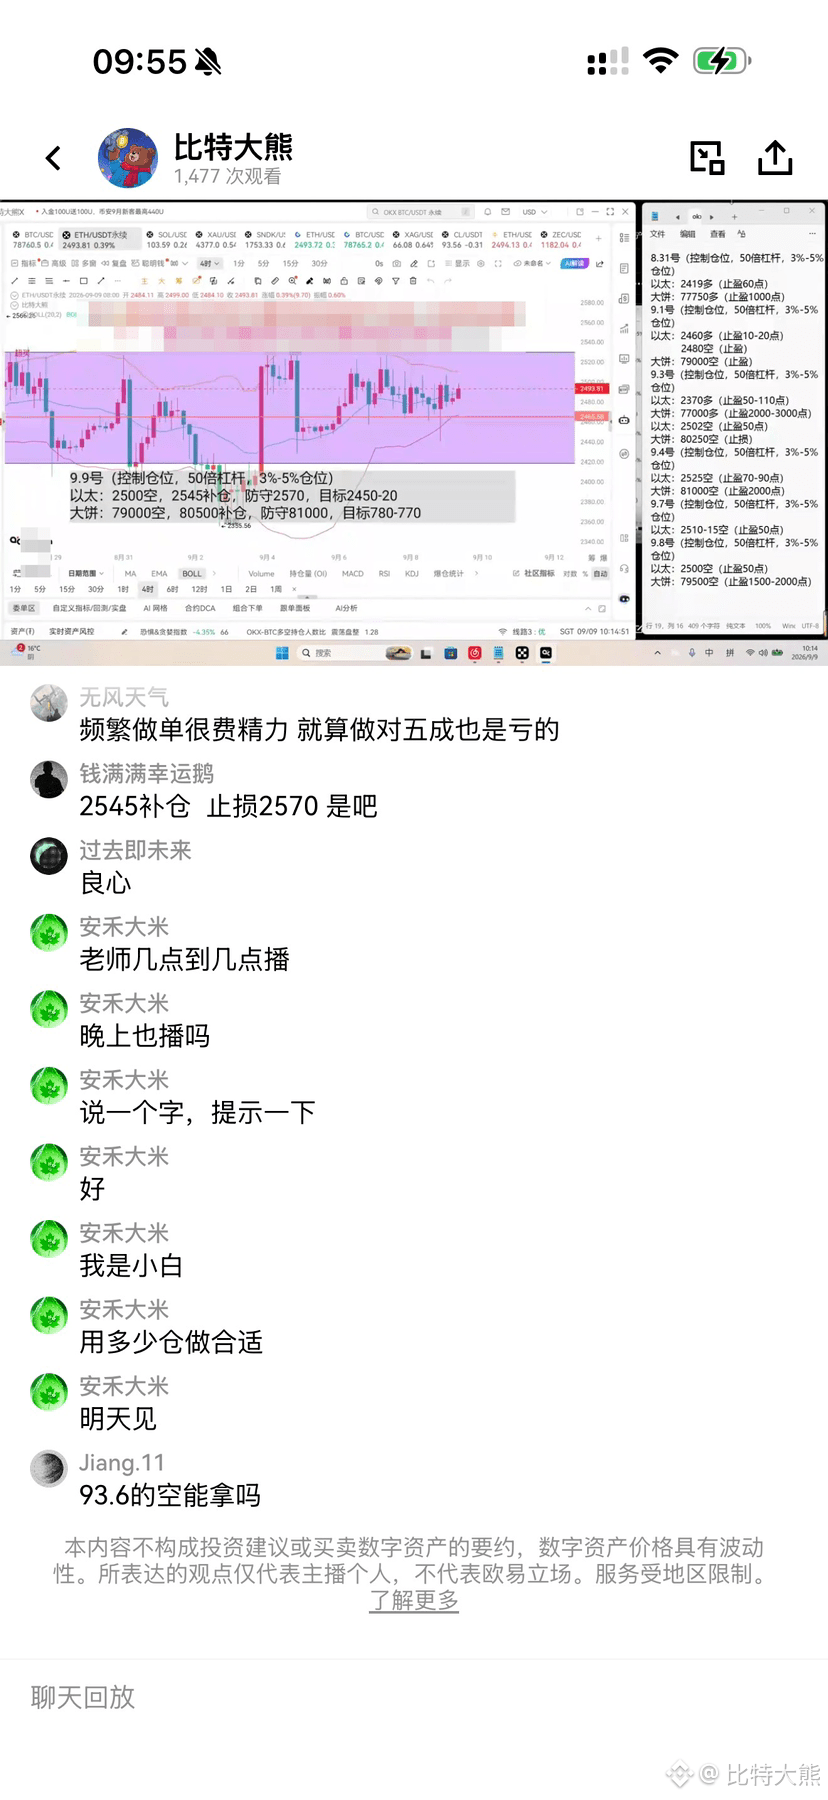
同样的位置,同样的目标,连续三天高位布局做空,每一轮都拿下不错的利润。
很多人总觉得行情难做,其实并不是行情复杂,是总在幻想一波走到底的单边大行情。
大部分时间市场就是箱体震荡,压力位高空,支撑位低多,来回撸波段,难道不香吗?稳稳把U揣进兜里,这样赚钱难道不舒服吗?
震荡行情不需要赌暴涨暴跌,认准关键压力和支撑,恪守结构去操作,不追涨杀跌,利润就会反复给到你。
但震荡行情也不是闭眼随便开单,仓位、止损一样不能忽视。频繁乱做单,哪怕五成胜率到头来依旧是亏损。
不要一心盼着大单边,能把震荡行情的钱稳稳赚到,已经跑赢绝大多数交易者。
同样的位置,同样的目标,连续三天高位布局做空,每一轮都拿下不错的利润。
很多人总觉得行情难做,其实并不是行情复杂,是总在幻想一波走到底的单边大行情。
大部分时间市场就是箱体震荡,压力位高空,支撑位低多,来回撸波段,难道不香吗?稳稳把U揣进兜里,这样赚钱难道不舒服吗?
震荡行情不需要赌暴涨暴跌,认准关键压力和支撑,恪守结构去操作,不追涨杀跌,利润就会反复给到你。
但震荡行情也不是闭眼随便开单,仓位、止损一样不能忽视。频繁乱做单,哪怕五成胜率到头来依旧是亏损。
不要一心盼着大单边,能把震荡行情的钱稳稳赚到,已经跑赢绝大多数交易者。
很多人总觉得行情难做,其实并不是行情复杂,是总在幻想一波走到底的单边大行情。
大部分时间市场就是箱体震荡,压力位高空,支撑位低多,来回撸波段,难道不香吗?稳稳把U揣进兜里,这样赚钱难道不舒服吗?
震荡行情不需要赌暴涨暴跌,认准关键压力和支撑,恪守结构去操作,不追涨杀跌,利润就会反复给到你。
但震荡行情也不是闭眼随便开单,仓位、止损一样不能忽视。频繁乱做单,哪怕五成胜率到头来依旧是亏损。
不要一心盼着大单边,能把震荡行情的钱稳稳赚到,已经跑赢绝大多数交易者。
82
·
--
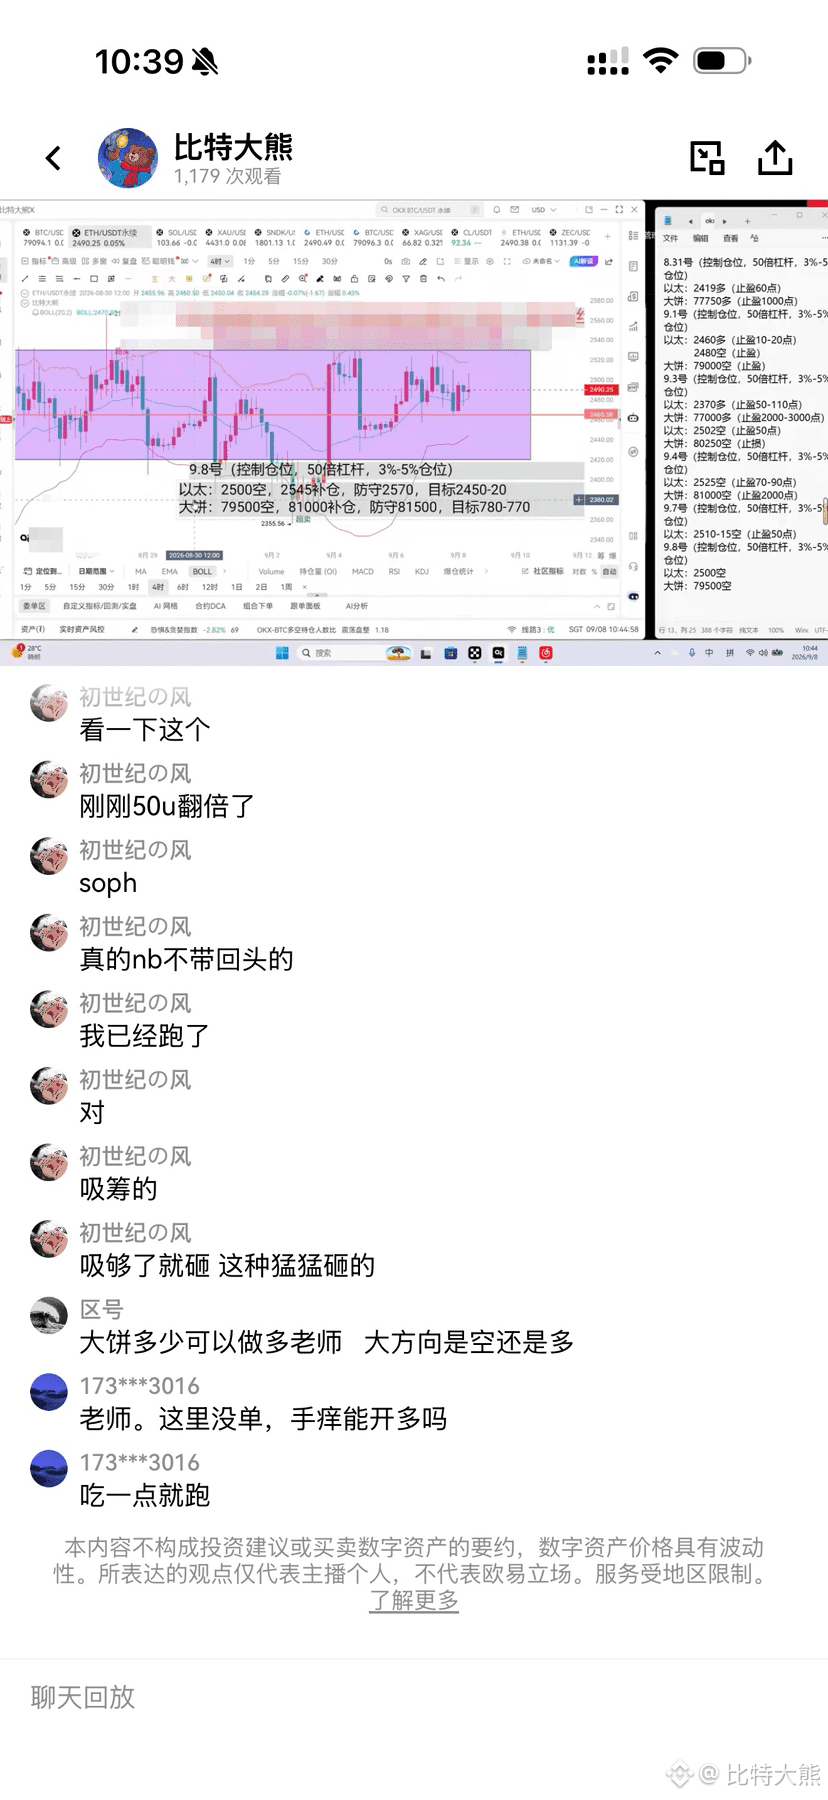
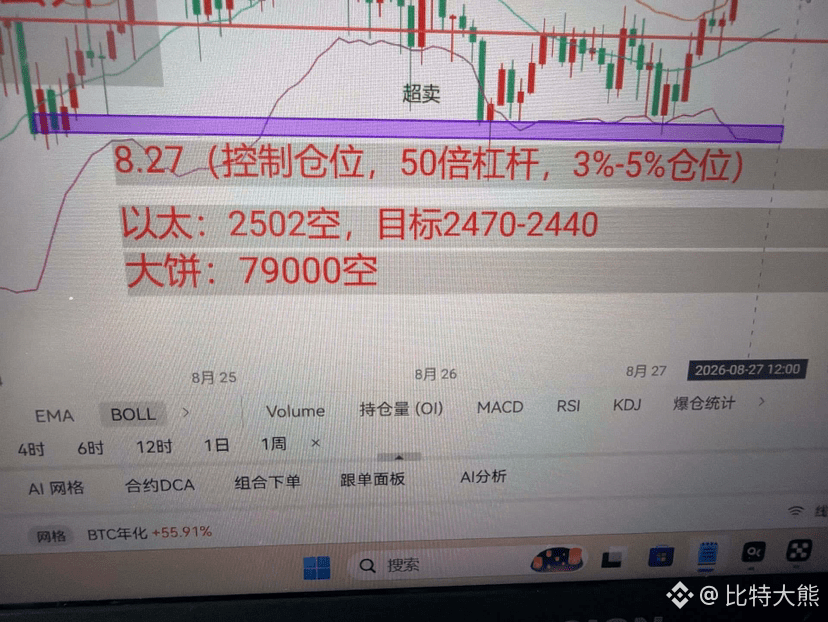
The other day in the livestream room we kept stressing the high-position short setup—giving the plan to short $ETH at 2500 and $BTC at 79500. After the US stock market opened, the price action broke out as expected, hitting the target levels precisely. The short positions were smoothly closed in profit.
This round wasn’t about luck or betting on direction. It was absolute certainty about the market trend and the timing of the main players’ accumulation and rinse-and-dump cycle. After the main players finished accumulating, they immediately slammed the price downward; the movement perfectly matched the structure we mapped out in advance.
Anyone who could keep up with the pace and strictly execute the plan made a huge profit in this round.
The other day in the livestream room we kept stressing the high-position short setup—giving the plan to short $ETH at 2500 and $BTC at 79500. After the US stock market opened, the price action broke out as expected, hitting the target levels precisely. The short positions were smoothly closed in profit.
This round wasn’t about luck or betting on direction. It was absolute certainty about the market trend and the timing of the main players’ accumulation and rinse-and-dump cycle. After the main players finished accumulating, they immediately slammed the price downward; the movement perfectly matched the structure we mapped out in advance.
Anyone who could keep up with the pace and strictly execute the plan made a huge profit in this round.
This round wasn’t about luck or betting on direction. It was absolute certainty about the market trend and the timing of the main players’ accumulation and rinse-and-dump cycle. After the main players finished accumulating, they immediately slammed the price downward; the movement perfectly matched the structure we mapped out in advance.
Anyone who could keep up with the pace and strictly execute the plan made a huge profit in this round.
1
125
·
--
SanDisk can’t hold it in anymore—about to have diarrhea? $SNDK
{future}(SNDKUSDT)
SanDisk can’t hold it in anymore—about to have diarrhea? $SNDK
1
144
·
--
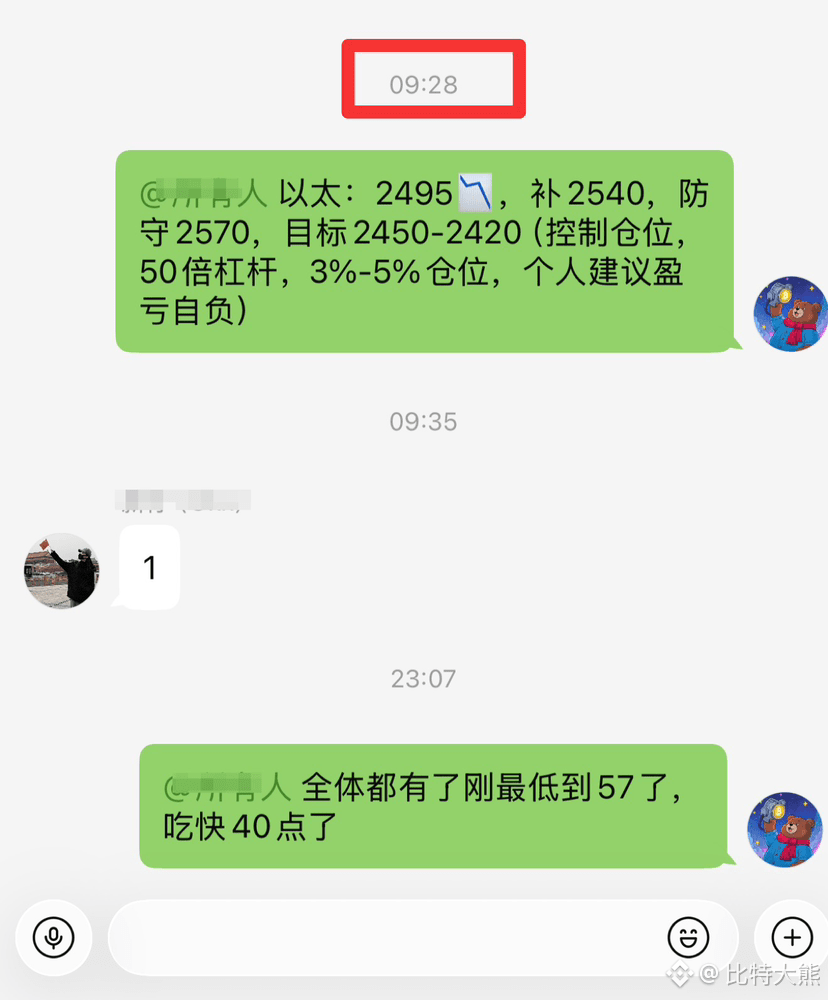
There's a chance to make a trade even on the weekend. This move is only seven points away from the target, and even the drop to 57 still captured nearly forty points.
There's a chance to make a trade even on the weekend. This move is only seven points away from the target, and even the drop to 57 still captured nearly forty points.
95
·
--
Why don’t I even dare to believe it myself? Isn’t that too exaggerated?
Why don’t I even dare to believe it myself? Isn’t that too exaggerated?

1
53
·
--
Live streaming permissions have been enabled, thank you to the Binance platform
Hope to share and exchange more interesting content here with everyone in the future #live streaming
Live streaming permissions have been enabled, thank you to the Binance platform
Hope to share and exchange more interesting content here with everyone in the future #live streaming
Hope to share and exchange more interesting content here with everyone in the future #live streaming


1
114
·
--
Buy and sell back and forth to feast on profits!
Buy and sell back and forth to feast on big gains!
Buy and sell back and forth and profit big!
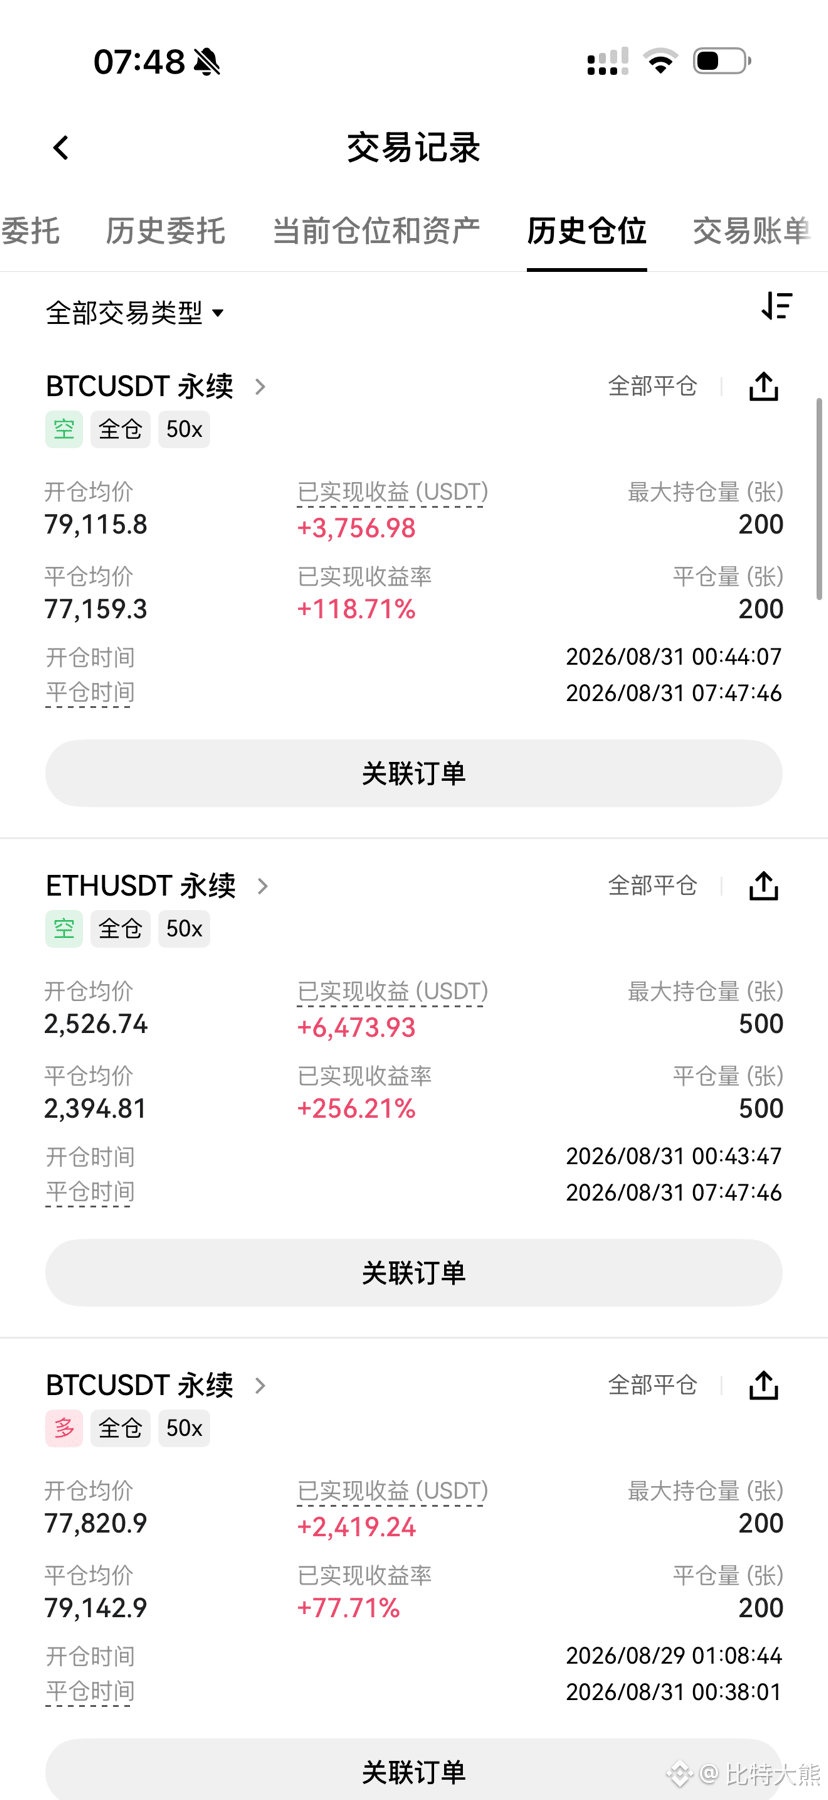
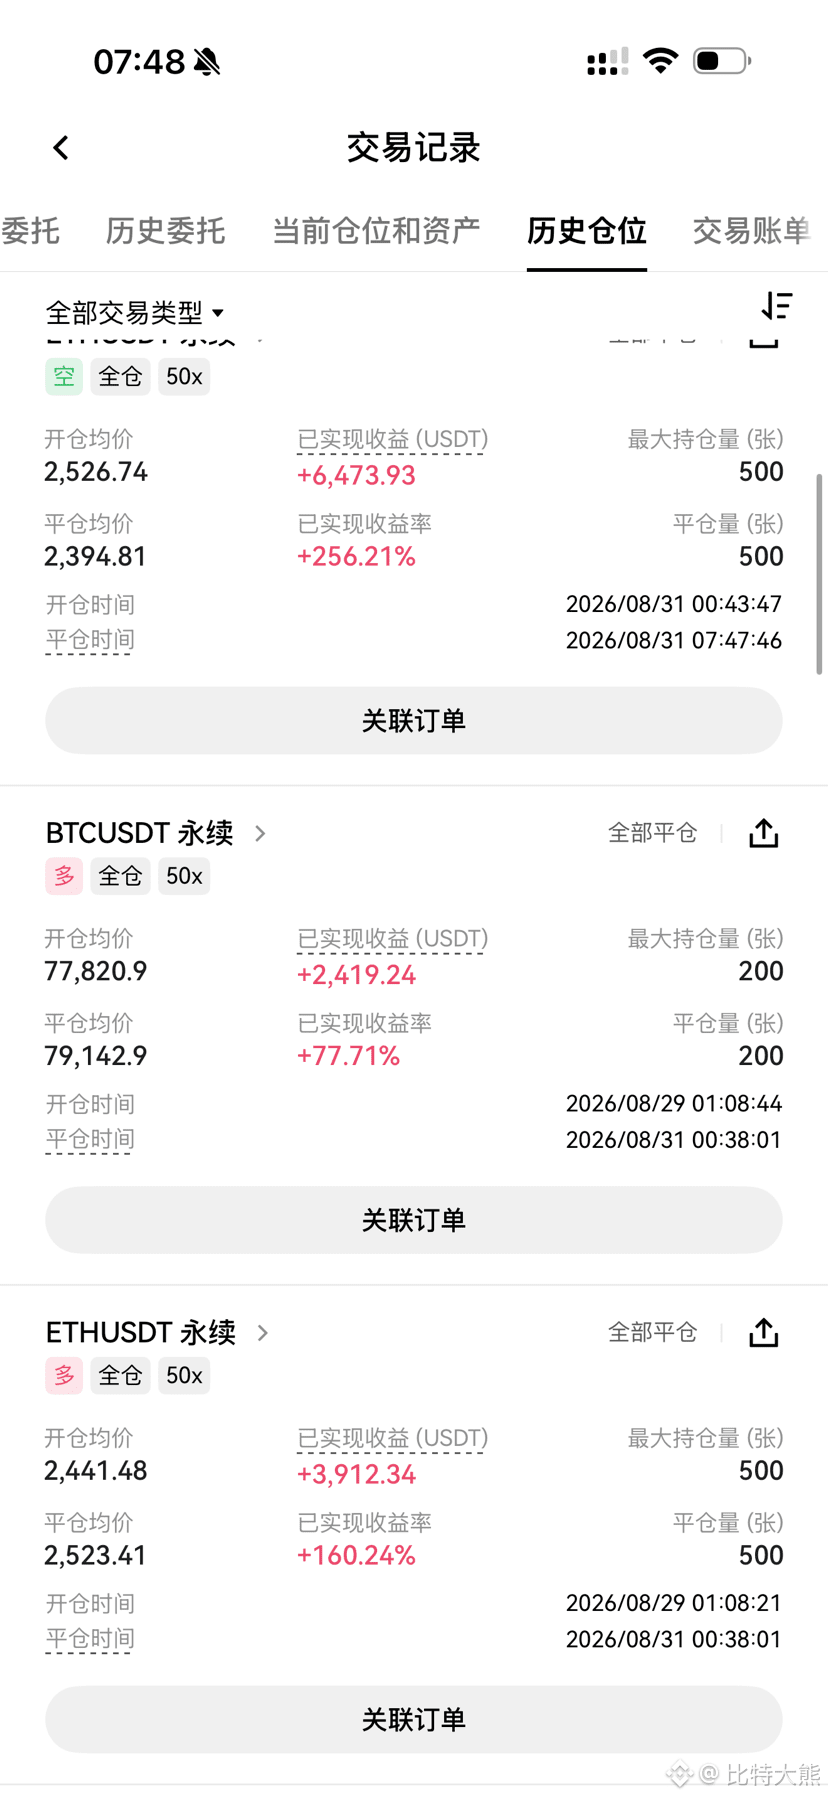
During the live stream, the key points of both the long and short sides were emphasized repeatedly. Can you really get many people to remember them, let alone strictly follow through?
First, after setting up the long position at the bottom of the structure on Saturday, it was decisively followed by a reverse move to set a short at the top.
After waking up from a nap, the short position placed at the upper band had already flipped by several times.
In just one night, the entire last week’s chart structure was fully completed in a full round trip.
It confirms the logic that was stressed over and over before ✅: As long as the larger structure hasn’t changed, focus on executing longs at key support areas and taking entries at key pressure points—avoid chasing or panic selling. In a ranging market, you can repeatedly harvest profits.
Remember, 90% of the time the market is in consolidation and range-bound conditions; a strong one-way move is only brief.
Buy and sell back and forth to feast on profits!
Buy and sell back and forth to feast on big gains!
Buy and sell back and forth and profit big!
During the live stream, the key points of both the long and short sides were emphasized repeatedly. Can you really get many people to remember them, let alone strictly follow through?
First, after setting up the long position at the bottom of the structure on Saturday, it was decisively followed by a reverse move to set a short at the top.
After waking up from a nap, the short position placed at the upper band had already flipped by several times.
In just one night, the entire last week’s chart structure was fully completed in a full round trip.
It confirms the logic that was stressed over and over before ✅: As long as the larger structure hasn’t changed, focus on executing longs at key support areas and taking entries at key pressure points—avoid chasing or panic selling. In a ranging market, you can repeatedly harvest profits.
Remember, 90% of the time the market is in consolidation and range-bound conditions; a strong one-way move is only brief.
Buy and sell back and forth to feast on big gains!
Buy and sell back and forth and profit big!
During the live stream, the key points of both the long and short sides were emphasized repeatedly. Can you really get many people to remember them, let alone strictly follow through?
First, after setting up the long position at the bottom of the structure on Saturday, it was decisively followed by a reverse move to set a short at the top.
After waking up from a nap, the short position placed at the upper band had already flipped by several times.
In just one night, the entire last week’s chart structure was fully completed in a full round trip.
It confirms the logic that was stressed over and over before ✅: As long as the larger structure hasn’t changed, focus on executing longs at key support areas and taking entries at key pressure points—avoid chasing or panic selling. In a ranging market, you can repeatedly harvest profits.
Remember, 90% of the time the market is in consolidation and range-bound conditions; a strong one-way move is only brief.
292
·
--
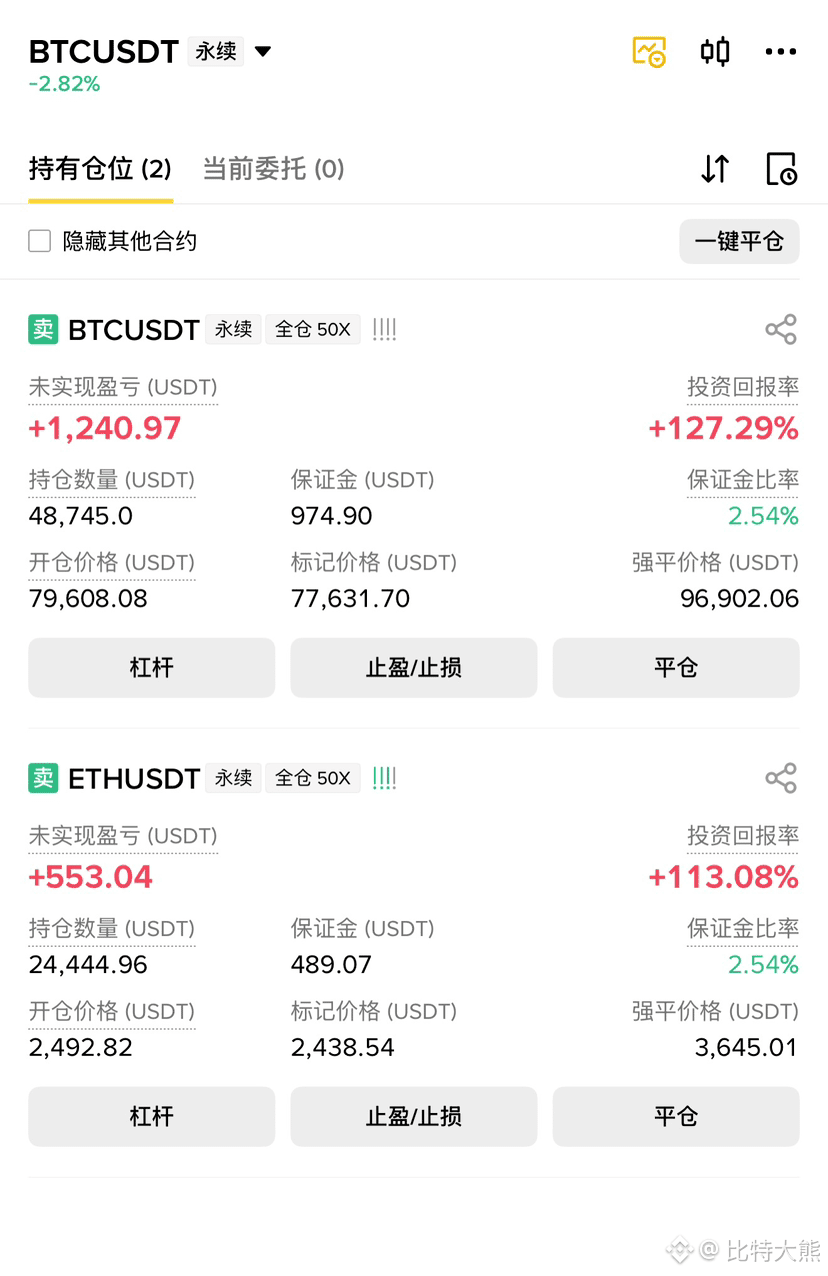
Black Friday—sure enough, a big drop
Everyone online should only have me going short at the top#Bitcoin falls 3.4% in 24 hours to $77.4k
Black Friday—sure enough, a big drop
Everyone online should only have me going short at the top#Bitcoin falls 3.4% in 24 hours to $77.4k
Everyone online should only have me going short at the top#Bitcoin falls 3.4% in 24 hours to $77.4k
188
·
--
Bearish
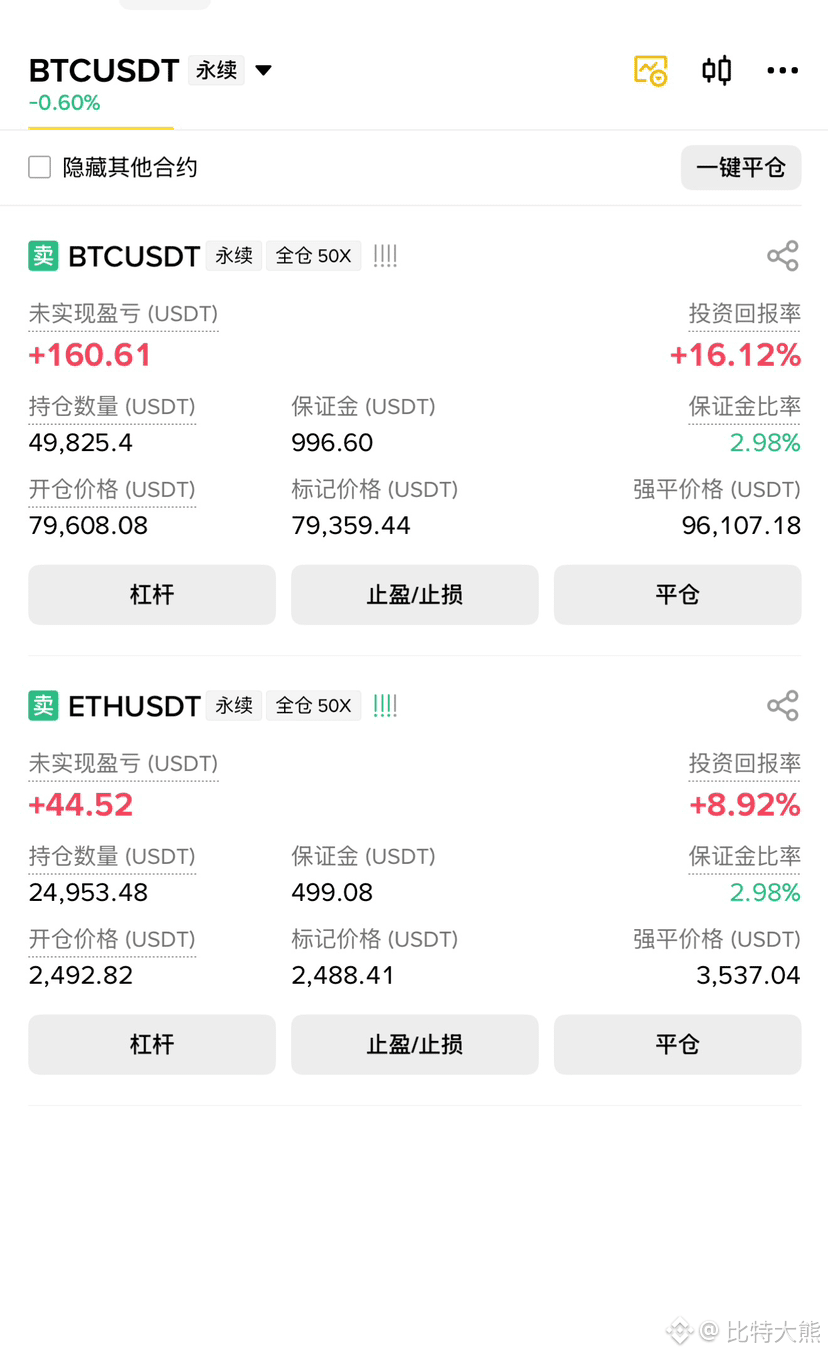
The genius trader finally made some profit—come on, hurry and congratulate me!
The genius trader finally made some profit—come on, hurry and congratulate me!
1
250
·
--
Brother Sun has yet another thing like this # Sun Yuchen Jingtian
Brother Sun has yet another thing like this # Sun Yuchen Jingtian

1
130
·
--
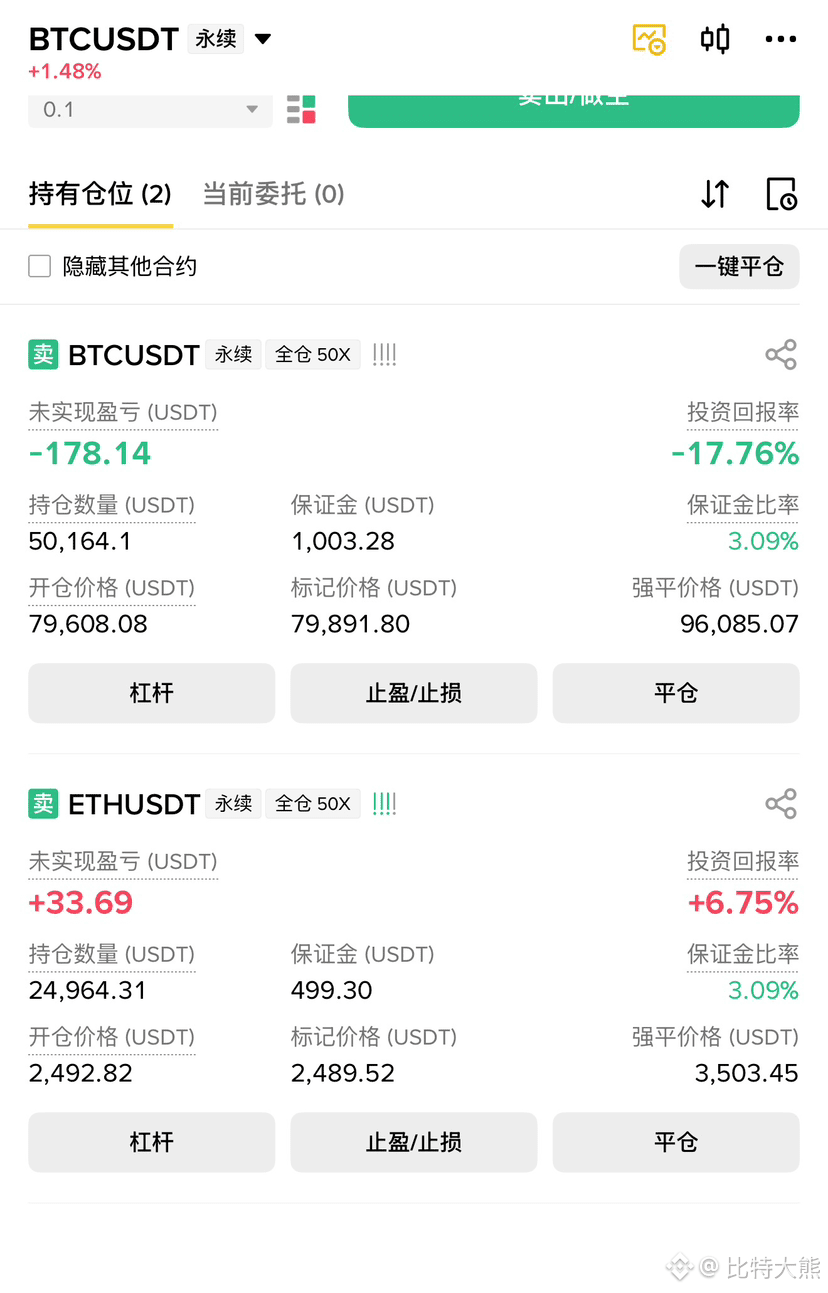
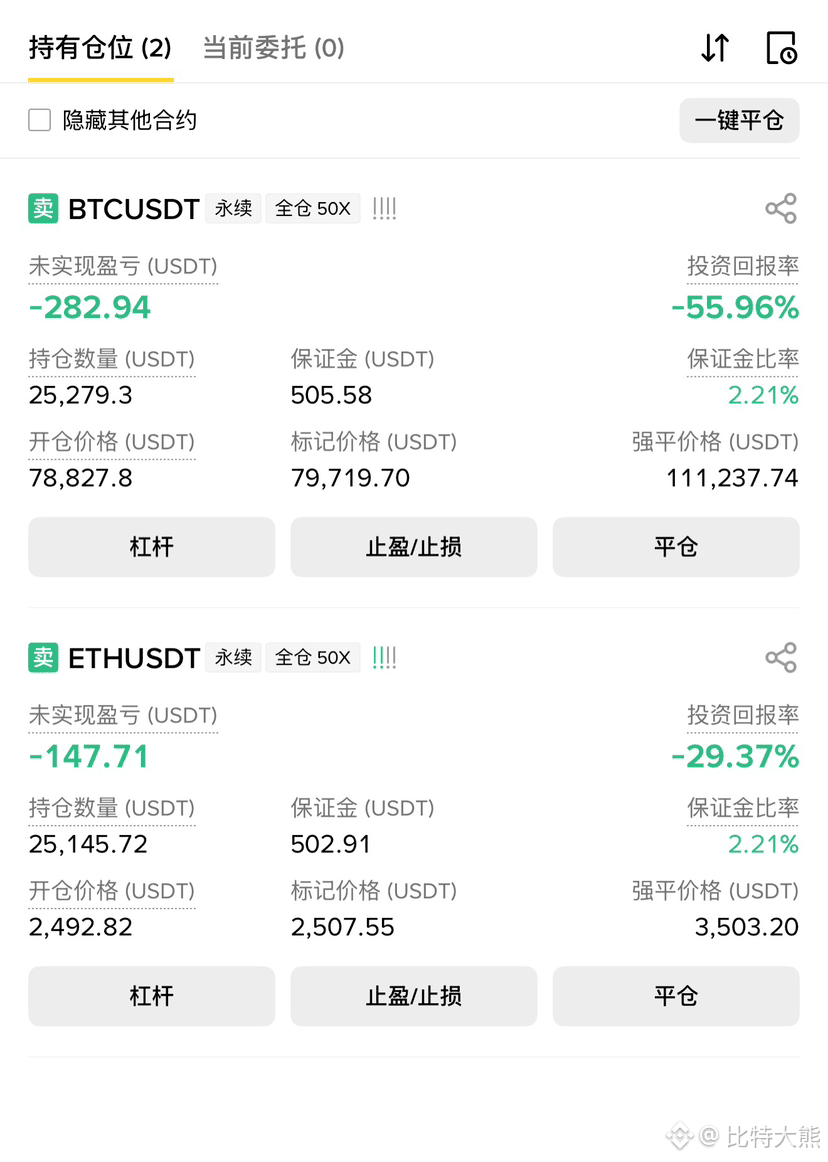
Teachers, what position is more appropriate to get?
Teachers, what position is more appropriate to get?
4
1
524
·
--
1
266
·
--
$BTC hourly chart analysis
Current price: 78795.2
1. Moving average status
MA30: 79293.7 (short-term resistance), MA60: 78547.4, MA120: 77829.8 (strong support below)
The price has fallen below the 30-period moving average and is consolidating near the 60-hour moving average. The 120-hour moving average continues to trend upward. The medium-term trend remains biased bullish; in the short term, the market has entered a corrective consolidation phase.
2. Price structure
After previously surging to the 81266.4 high, price faced pressure and fell back; each subsequent high has been lower.
The low at 76663.6 has not been broken—this is a pullback and consolidation in a high range, not an outright one-way crash.
The first resistance zone is 79200–79300. If price regains and holds above the 30 moving average, bulls could push back again.
Key supports are 78500 and 77800. 77800 is the 120-hour moving average; once it is effectively broken, the room for the pullback will open further.
3. Market logic
• Bulls: Medium-term moving averages are pointing upward, and the higher-level trend has not been fully broken. As long as 77800 holds, there is still a chance for a rebound and a push higher.
• Bears: Hourly highs are moving lower; short-term bullish momentum is weakening. If price rebounds into resistance, short-side ideas may be considered.
4. Key levels summary
✅ Resistance levels: 79300, 81266 (prior high)
✅ Support levels: 78500, 77800
$ETH hourly chart analysis
Current price: 2455.08
Moving average status
MA30: 2474.37 (short-term resistance)
MA60: 2467.57
MA120: 2445.28 (key support)
The price has broken below the MA30 short-term moving average and is consolidating above the MA120 moving average. The medium-to-long term moving averages are still trending upward; the larger trend has not completely reversed. On the hourly timeframe, bullish momentum is fading, and the market has entered a high-range pullback and consolidation phase.
Price structure
The prior high at 2533.32 surged up and then fell back under pressure, forming a low at 2413.56, followed by a modest rebound.
Hourly swing highs are gradually moving lower. This is consolidation after an upswing, not a one-way, massive selloff.
• Resistance overhead: 2467–2474 zone, then the prior high at 2533
• Support below: 2445 and the 2413 low
Market logic
1) Bearish view: If the rebound reaches the 2467–2474 moving-average resistance zone, it may be a good area to play for a pullback.
2) Bullish view: As long as the 2445 and 2413 supports are not broken, there is still an opportunity for another push higher.
3) If 2413 is effectively broken, the downside room for the pullback will expand further.
Key levels summary
Resistance: 2474, 2533
Support: 2445, 2413
$BTC hourly chart analysis
Current price: 78795.2
1. Moving average status
MA30: 79293.7 (short-term resistance), MA60: 78547.4, MA120: 77829.8 (strong support below)
The price has fallen below the 30-period moving average and is consolidating near the 60-hour moving average. The 120-hour moving average continues to trend upward. The medium-term trend remains biased bullish; in the short term, the market has entered a corrective consolidation phase.
2. Price structure
After previously surging to the 81266.4 high, price faced pressure and fell back; each subsequent high has been lower.
The low at 76663.6 has not been broken—this is a pullback and consolidation in a high range, not an outright one-way crash.
The first resistance zone is 79200–79300. If price regains and holds above the 30 moving average, bulls could push back again.
Key supports are 78500 and 77800. 77800 is the 120-hour moving average; once it is effectively broken, the room for the pullback will open further.
3. Market logic
• Bulls: Medium-term moving averages are pointing upward, and the higher-level trend has not been fully broken. As long as 77800 holds, there is still a chance for a rebound and a push higher.
• Bears: Hourly highs are moving lower; short-term bullish momentum is weakening. If price rebounds into resistance, short-side ideas may be considered.
4. Key levels summary
✅ Resistance levels: 79300, 81266 (prior high)
✅ Support levels: 78500, 77800
$ETH hourly chart analysis
Current price: 2455.08
Moving average status
MA30: 2474.37 (short-term resistance)
MA60: 2467.57
MA120: 2445.28 (key support)
The price has broken below the MA30 short-term moving average and is consolidating above the MA120 moving average. The medium-to-long term moving averages are still trending upward; the larger trend has not completely reversed. On the hourly timeframe, bullish momentum is fading, and the market has entered a high-range pullback and consolidation phase.
Price structure
The prior high at 2533.32 surged up and then fell back under pressure, forming a low at 2413.56, followed by a modest rebound.
Hourly swing highs are gradually moving lower. This is consolidation after an upswing, not a one-way, massive selloff.
• Resistance overhead: 2467–2474 zone, then the prior high at 2533
• Support below: 2445 and the 2413 low
Market logic
1) Bearish view: If the rebound reaches the 2467–2474 moving-average resistance zone, it may be a good area to play for a pullback.
2) Bullish view: As long as the 2445 and 2413 supports are not broken, there is still an opportunity for another push higher.
3) If 2413 is effectively broken, the downside room for the pullback will expand further.
Key levels summary
Resistance: 2474, 2533
Support: 2445, 2413
Current price: 78795.2
1. Moving average status
MA30: 79293.7 (short-term resistance), MA60: 78547.4, MA120: 77829.8 (strong support below)
The price has fallen below the 30-period moving average and is consolidating near the 60-hour moving average. The 120-hour moving average continues to trend upward. The medium-term trend remains biased bullish; in the short term, the market has entered a corrective consolidation phase.
2. Price structure
After previously surging to the 81266.4 high, price faced pressure and fell back; each subsequent high has been lower.
The low at 76663.6 has not been broken—this is a pullback and consolidation in a high range, not an outright one-way crash.
The first resistance zone is 79200–79300. If price regains and holds above the 30 moving average, bulls could push back again.
Key supports are 78500 and 77800. 77800 is the 120-hour moving average; once it is effectively broken, the room for the pullback will open further.
3. Market logic
• Bulls: Medium-term moving averages are pointing upward, and the higher-level trend has not been fully broken. As long as 77800 holds, there is still a chance for a rebound and a push higher.
• Bears: Hourly highs are moving lower; short-term bullish momentum is weakening. If price rebounds into resistance, short-side ideas may be considered.
4. Key levels summary
✅ Resistance levels: 79300, 81266 (prior high)
✅ Support levels: 78500, 77800
$ETH hourly chart analysis
Current price: 2455.08
Moving average status
MA30: 2474.37 (short-term resistance)
MA60: 2467.57
MA120: 2445.28 (key support)
The price has broken below the MA30 short-term moving average and is consolidating above the MA120 moving average. The medium-to-long term moving averages are still trending upward; the larger trend has not completely reversed. On the hourly timeframe, bullish momentum is fading, and the market has entered a high-range pullback and consolidation phase.
Price structure
The prior high at 2533.32 surged up and then fell back under pressure, forming a low at 2413.56, followed by a modest rebound.
Hourly swing highs are gradually moving lower. This is consolidation after an upswing, not a one-way, massive selloff.
• Resistance overhead: 2467–2474 zone, then the prior high at 2533
• Support below: 2445 and the 2413 low
Market logic
1) Bearish view: If the rebound reaches the 2467–2474 moving-average resistance zone, it may be a good area to play for a pullback.
2) Bullish view: As long as the 2445 and 2413 supports are not broken, there is still an opportunity for another push higher.
3) If 2413 is effectively broken, the downside room for the pullback will expand further.
Key levels summary
Resistance: 2474, 2533
Support: 2445, 2413
81
·
--
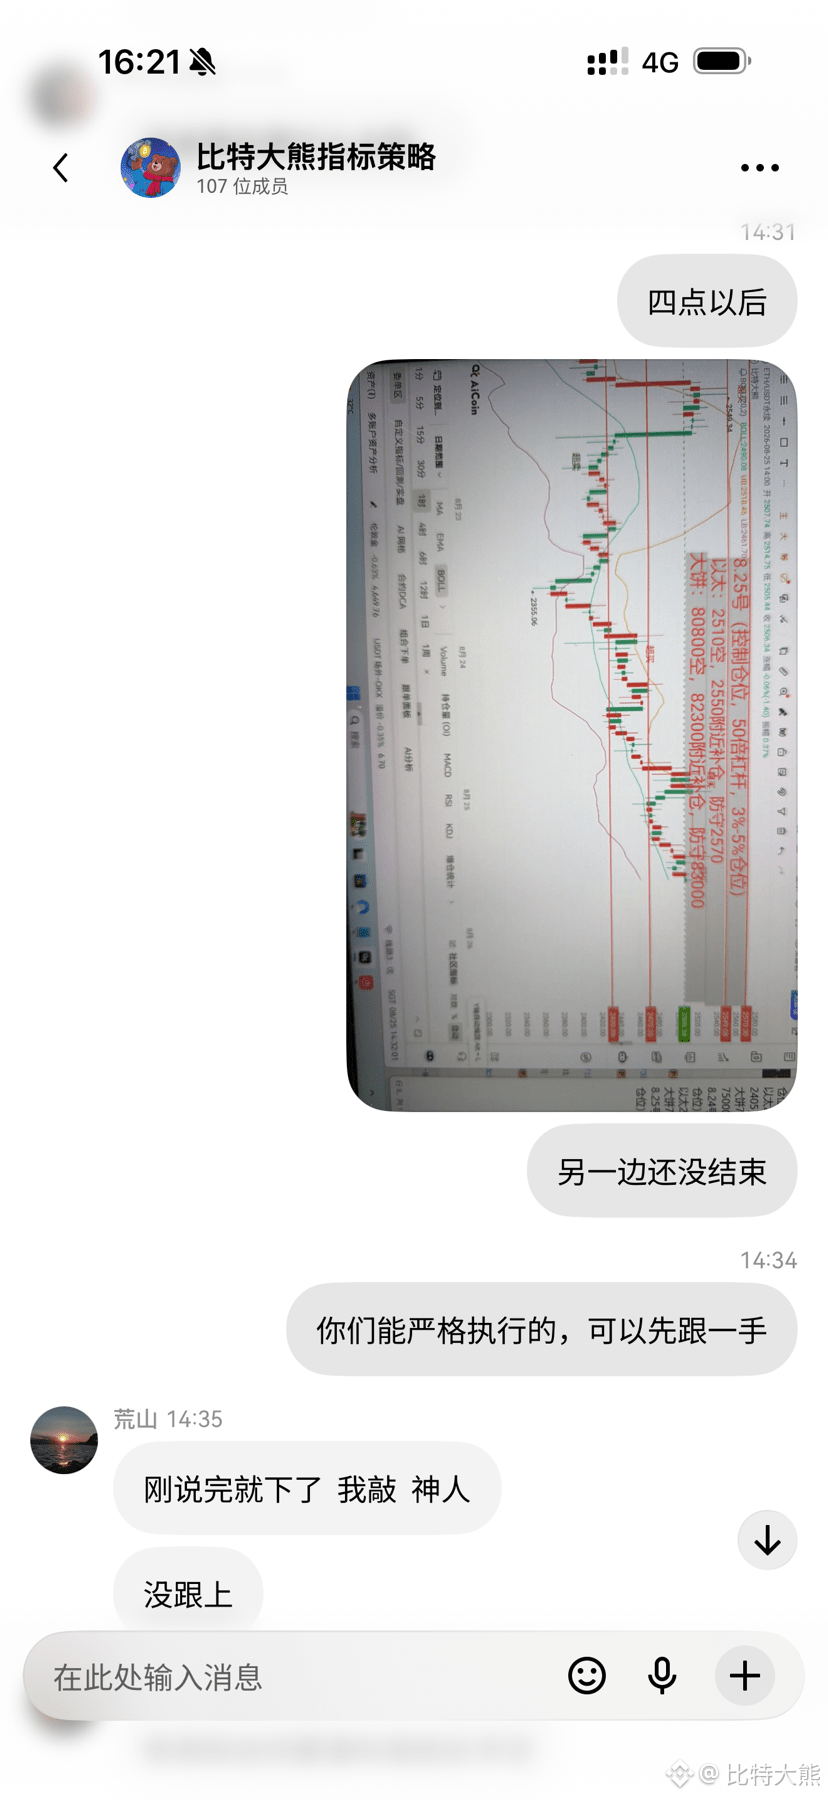
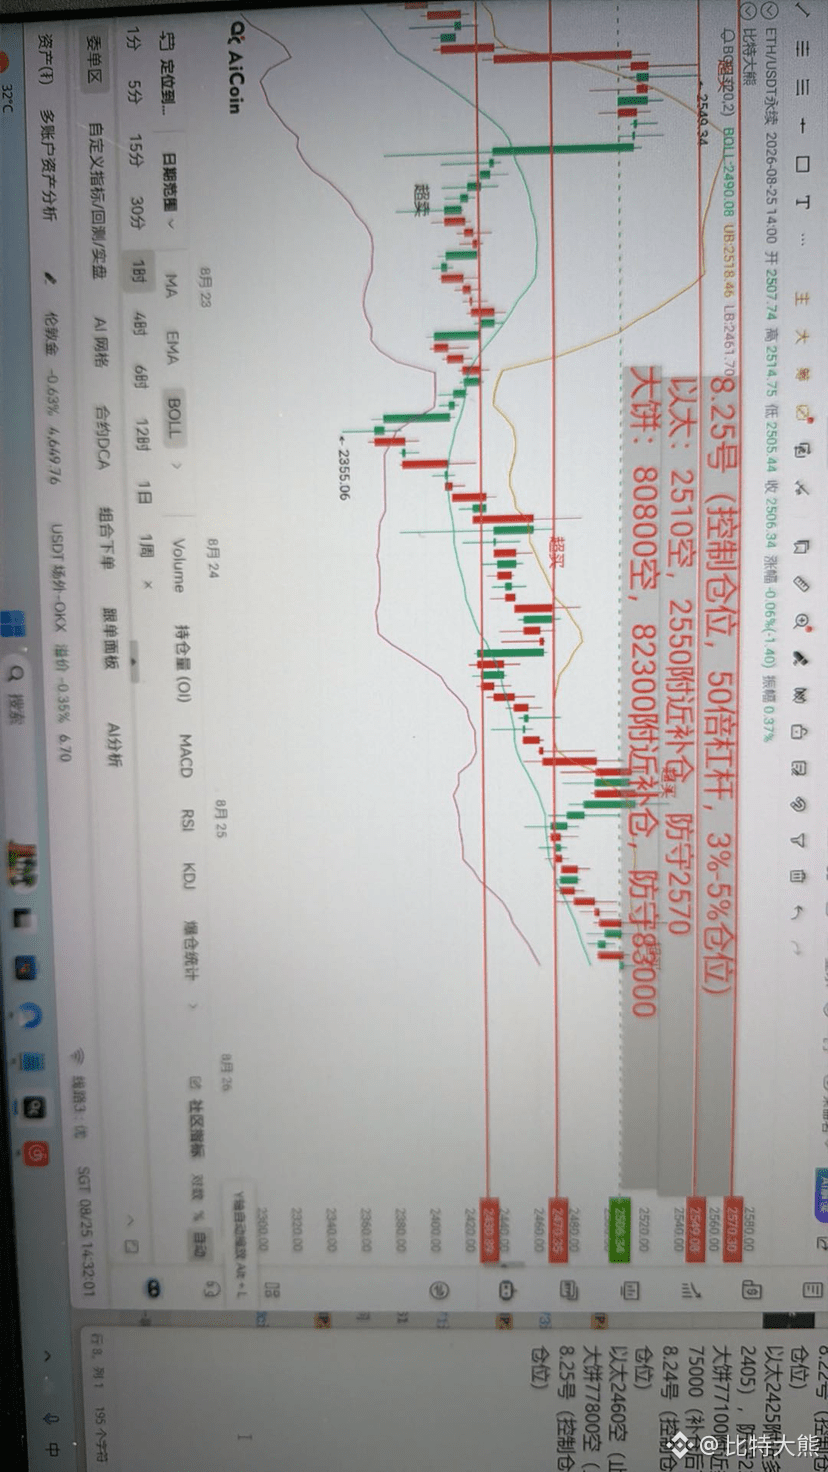
All today’s short positions have been fully closed for profit. The live room and the community are both being set up simultaneously—securing great profit opportunities together!
The big BTC short is at 80,800, and Ethereum is at 2,510.
Ethereum has fully reached its first target at 2,470, capturing a 40-point profit window. Meanwhile, BTC has also taken profit in sync, securing a 1,300-point profit window!
Next, the live room will keep setting up and keep taking the profits.
The market won’t give everyone a chance to board the train ⚡
The plan and the levels are provided; the rest depends entirely on execution.
You don’t need to trade frequently—pick one that’s right, and it can outweigh several scattered trades.
Maintain strict position sizing, set up your defense, and leave the rest to the market.
Respect the market—align knowledge with action 📈
All today’s short positions have been fully closed for profit. The live room and the community are both being set up simultaneously—securing great profit opportunities together!
The big BTC short is at 80,800, and Ethereum is at 2,510.
Ethereum has fully reached its first target at 2,470, capturing a 40-point profit window. Meanwhile, BTC has also taken profit in sync, securing a 1,300-point profit window!
Next, the live room will keep setting up and keep taking the profits.
The market won’t give everyone a chance to board the train ⚡
The plan and the levels are provided; the rest depends entirely on execution.
You don’t need to trade frequently—pick one that’s right, and it can outweigh several scattered trades.
Maintain strict position sizing, set up your defense, and leave the rest to the market.
Respect the market—align knowledge with action 📈
The big BTC short is at 80,800, and Ethereum is at 2,510.
Ethereum has fully reached its first target at 2,470, capturing a 40-point profit window. Meanwhile, BTC has also taken profit in sync, securing a 1,300-point profit window!
Next, the live room will keep setting up and keep taking the profits.
The market won’t give everyone a chance to board the train ⚡
The plan and the levels are provided; the rest depends entirely on execution.
You don’t need to trade frequently—pick one that’s right, and it can outweigh several scattered trades.
Maintain strict position sizing, set up your defense, and leave the rest to the market.
Respect the market—align knowledge with action 📈

1
180
·
--
Brothers, the opportunity to get rich is right in front of us
Success or failure is decided right here—one deal is enough for the rest of your life #Gulf
Brothers, the opportunity to get rich is right in front of us
Success or failure is decided right here—one deal is enough for the rest of your life #Gulf
Success or failure is decided right here—one deal is enough for the rest of your life #Gulf


63
·
--
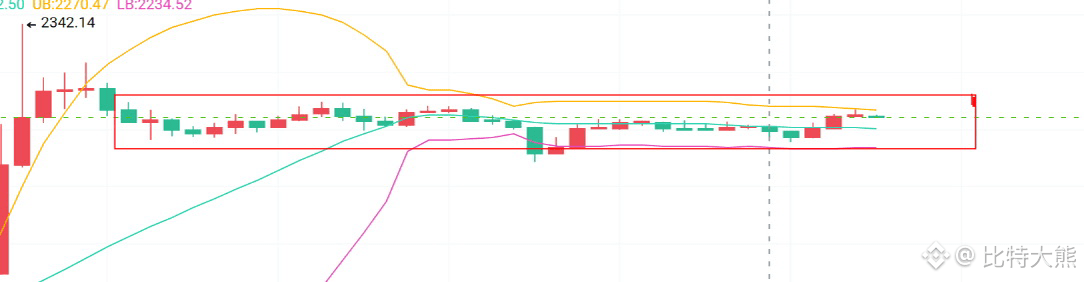
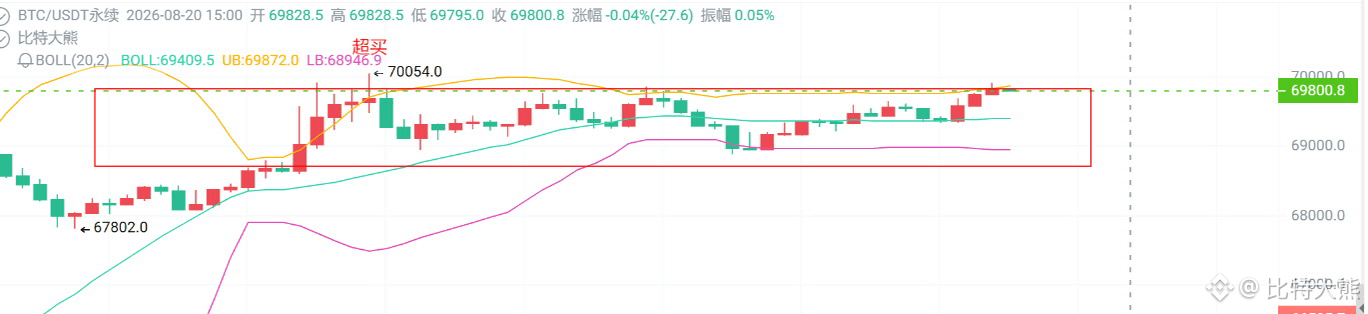
After the sharp surge, it starts to consolidate and oscillate; indicators on smaller timeframes begin to recover.
Currently, the 15-minute timeframe has clearly recovered.
For ETH: 2230-2260, and for BTC: 70000-688000-67800—trade short-term back and forth within these ranges.
After the sharp surge, it starts to consolidate and oscillate; indicators on smaller timeframes begin to recover.
Currently, the 15-minute timeframe has clearly recovered.
For ETH: 2230-2260, and for BTC: 70000-688000-67800—trade short-term back and forth within these ranges.
Currently, the 15-minute timeframe has clearly recovered.
For ETH: 2230-2260, and for BTC: 70000-688000-67800—trade short-term back and forth within these ranges.
342
·
--
What exactly is happening?
I woke up and the big pie (BTC) had surged more than 10%, while Ethereum (ETH) was up more than 20%.
No warning whatsoever—just pure brute-force pump.
Does that mean the US stock market is already nearing its end, and funds are about to switch to the crypto market?
Crypto liquidity is going to come back. From now on, BTC and ETH will be like a casino.
Big volatility coming isn’t a good thing. If it’s spot trading, it doesn’t matter.
But if you’re playing with futures/contracts—like this kind of wild, up-and-down行情—many people can’t control it; they’ll completely bungle it.
It’s like SanDisk (SD)—even though it’s had huge spikes and crashes, all I keep hearing is that people are losing money. Every time on the live stream, it’s always “I heard BTC/ETH is making money,” while SanDisk is losing money.
The best kind of market is still range-bound consolidation—like picking up money!
As for the next moves with $BTC and $ETH, for most of the time, you’ll probably be trading based on emotion and instinct. Many indicators will already be useless.
What exactly is happening?
I woke up and the big pie (BTC) had surged more than 10%, while Ethereum (ETH) was up more than 20%.
No warning whatsoever—just pure brute-force pump.
Does that mean the US stock market is already nearing its end, and funds are about to switch to the crypto market?
Crypto liquidity is going to come back. From now on, BTC and ETH will be like a casino.
Big volatility coming isn’t a good thing. If it’s spot trading, it doesn’t matter.
But if you’re playing with futures/contracts—like this kind of wild, up-and-down行情—many people can’t control it; they’ll completely bungle it.
It’s like SanDisk (SD)—even though it’s had huge spikes and crashes, all I keep hearing is that people are losing money. Every time on the live stream, it’s always “I heard BTC/ETH is making money,” while SanDisk is losing money.
The best kind of market is still range-bound consolidation—like picking up money!
As for the next moves with $BTC and $ETH, for most of the time, you’ll probably be trading based on emotion and instinct. Many indicators will already be useless.
I woke up and the big pie (BTC) had surged more than 10%, while Ethereum (ETH) was up more than 20%.
No warning whatsoever—just pure brute-force pump.
Does that mean the US stock market is already nearing its end, and funds are about to switch to the crypto market?
Crypto liquidity is going to come back. From now on, BTC and ETH will be like a casino.
Big volatility coming isn’t a good thing. If it’s spot trading, it doesn’t matter.
But if you’re playing with futures/contracts—like this kind of wild, up-and-down行情—many people can’t control it; they’ll completely bungle it.
It’s like SanDisk (SD)—even though it’s had huge spikes and crashes, all I keep hearing is that people are losing money. Every time on the live stream, it’s always “I heard BTC/ETH is making money,” while SanDisk is losing money.
The best kind of market is still range-bound consolidation—like picking up money!
As for the next moves with $BTC and $ETH, for most of the time, you’ll probably be trading based on emotion and instinct. Many indicators will already be useless.
1
611
·
--
Last night, Bitcoin continued to rise slightly with a modest increase; the upside was not very obvious. There are clear signs of heavy pressure and a pullback. From the current perspective, the top has basically formed at this stage of this week. Afterwards, it may continue to fall toward the target profit level we mentioned in the livestream.
After yesterday’s Bitcoin successfully filled the additional position at 645, the average entry price was raised to 640. As for Ethereum, it still hasn’t reached our additional entry price by a large margin; the buy wasn’t completed. However, Ethereum has now pulled back to around our cost basis. Overall, the price action is completely in line with our expectations. Next, it’s a test of patience.
Getting in now is still an opportunity. Over the next few days, it should gradually consume the gains from yesterday’s rally. In a market with low liquidity, the conditions remain very stable—there won’t be any major trend reversals caused by sudden changes. Make friends with time, and use time to create space for upside!
Last night, Bitcoin continued to rise slightly with a modest increase; the upside was not very obvious. There are clear signs of heavy pressure and a pullback. From the current perspective, the top has basically formed at this stage of this week. Afterwards, it may continue to fall toward the target profit level we mentioned in the livestream.
After yesterday’s Bitcoin successfully filled the additional position at 645, the average entry price was raised to 640. As for Ethereum, it still hasn’t reached our additional entry price by a large margin; the buy wasn’t completed. However, Ethereum has now pulled back to around our cost basis. Overall, the price action is completely in line with our expectations. Next, it’s a test of patience.
Getting in now is still an opportunity. Over the next few days, it should gradually consume the gains from yesterday’s rally. In a market with low liquidity, the conditions remain very stable—there won’t be any major trend reversals caused by sudden changes. Make friends with time, and use time to create space for upside!
After yesterday’s Bitcoin successfully filled the additional position at 645, the average entry price was raised to 640. As for Ethereum, it still hasn’t reached our additional entry price by a large margin; the buy wasn’t completed. However, Ethereum has now pulled back to around our cost basis. Overall, the price action is completely in line with our expectations. Next, it’s a test of patience.
Getting in now is still an opportunity. Over the next few days, it should gradually consume the gains from yesterday’s rally. In a market with low liquidity, the conditions remain very stable—there won’t be any major trend reversals caused by sudden changes. Make friends with time, and use time to create space for upside!
1
248
·
--
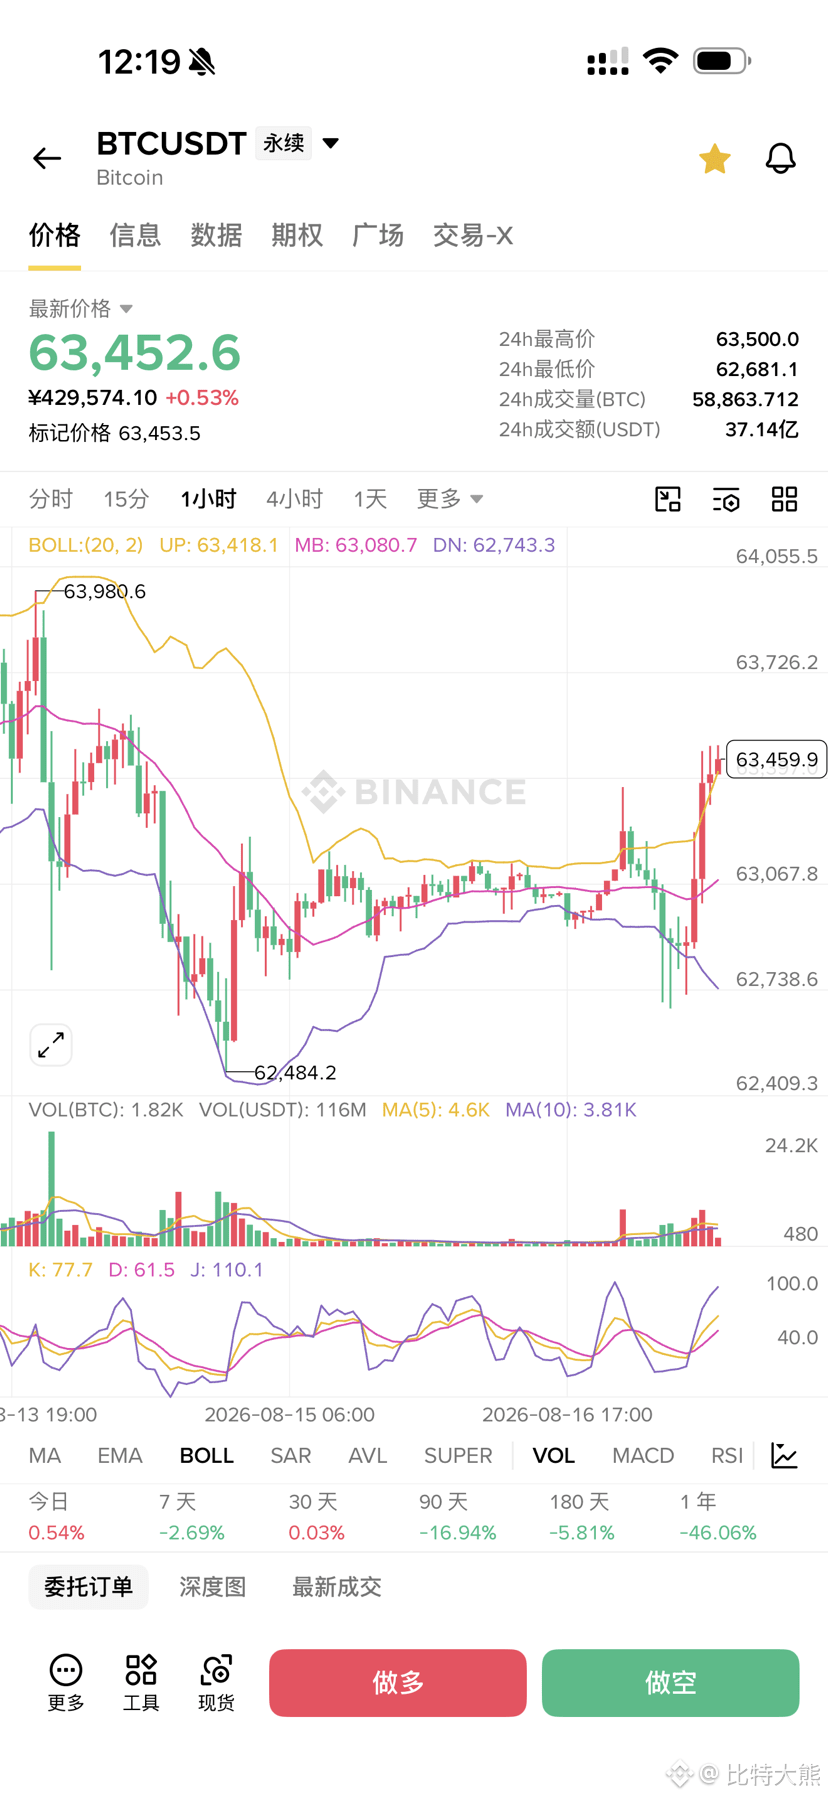
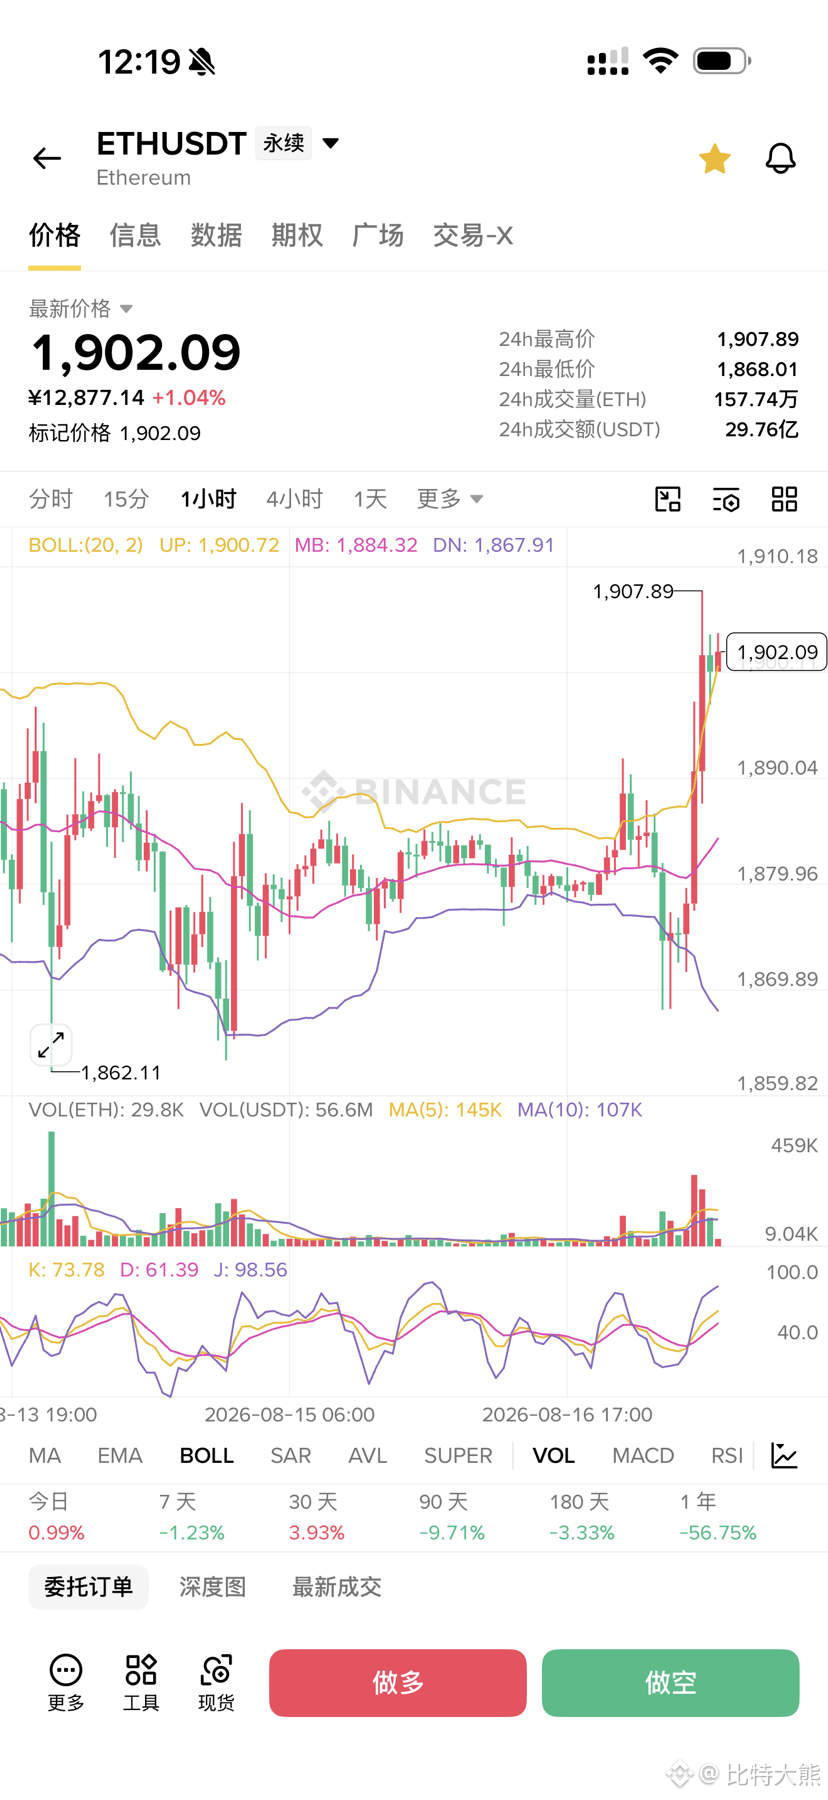
A new week has started, and Ether has arrived at 1900 again. I was seriously talking in the live room last Friday night as well; over the weekend, the market will definitely swing back and forth between longs and shorts, and people will be getting in and out repeatedly. On Friday night, the big pie at 62500 directly opened the live room for entries. The synchronized longs in Ether, entered at 1860–70. For this round of long positions, I said that the big pie can take profit in the 630–635 range, and Ether only needs to capture about 10 to 20 points of profit at the same time—then that’s enough. This wave of longs is just a minor rebound.
After that, Ether can also open shorts again at 1890–1900 to do another round 🈳. There won’t be too much fluctuation over the weekend. Don’t get greedy—having room for 10 to 20 points of profit is enough.
Today happens to be Monday. In the morning, there was a small pull-up. Ether’s current price is already above 1900. In contrast, the big pie is still around the 630s. When Ether was at 1900 last time, the big pie was above 640, so relatively speaking, the big pie’s rebound is very weak—it feels like it just can’t rise at all. Actually, liquidity in the crypto market right now is really poor.
Going forward, whether the big pie will catch up with a rebound and drive Ether higher further—we need to judge based on the actual situation on the chart, and be ready to enter at any time.
Slow is fast, steady is profit. Only when you’re not rushed and not impatient can you accurately grasp the trend and execute the right strategy!
A new week has started, and Ether has arrived at 1900 again. I was seriously talking in the live room last Friday night as well; over the weekend, the market will definitely swing back and forth between longs and shorts, and people will be getting in and out repeatedly. On Friday night, the big pie at 62500 directly opened the live room for entries. The synchronized longs in Ether, entered at 1860–70. For this round of long positions, I said that the big pie can take profit in the 630–635 range, and Ether only needs to capture about 10 to 20 points of profit at the same time—then that’s enough. This wave of longs is just a minor rebound.
After that, Ether can also open shorts again at 1890–1900 to do another round 🈳. There won’t be too much fluctuation over the weekend. Don’t get greedy—having room for 10 to 20 points of profit is enough.
Today happens to be Monday. In the morning, there was a small pull-up. Ether’s current price is already above 1900. In contrast, the big pie is still around the 630s. When Ether was at 1900 last time, the big pie was above 640, so relatively speaking, the big pie’s rebound is very weak—it feels like it just can’t rise at all. Actually, liquidity in the crypto market right now is really poor.
Going forward, whether the big pie will catch up with a rebound and drive Ether higher further—we need to judge based on the actual situation on the chart, and be ready to enter at any time.
Slow is fast, steady is profit. Only when you’re not rushed and not impatient can you accurately grasp the trend and execute the right strategy!
After that, Ether can also open shorts again at 1890–1900 to do another round 🈳. There won’t be too much fluctuation over the weekend. Don’t get greedy—having room for 10 to 20 points of profit is enough.
Today happens to be Monday. In the morning, there was a small pull-up. Ether’s current price is already above 1900. In contrast, the big pie is still around the 630s. When Ether was at 1900 last time, the big pie was above 640, so relatively speaking, the big pie’s rebound is very weak—it feels like it just can’t rise at all. Actually, liquidity in the crypto market right now is really poor.
Going forward, whether the big pie will catch up with a rebound and drive Ether higher further—we need to judge based on the actual situation on the chart, and be ready to enter at any time.
Slow is fast, steady is profit. Only when you’re not rushed and not impatient can you accurately grasp the trend and execute the right strategy!
1
293
Log in to explore more content
Join global crypto users on Binance Square
⚡️ Get latest and useful information about crypto.
💬 Trusted by the world’s largest crypto exchange.
👍 Discover real insights from verified creators.
Email / Phone number
Trending Topics
US10YTreasuryYieldHitsHighestSinceNov2023
0 views
3 Discussing
🚨 $METAB Looks Ready for the Next Move! Will Bulls Defend Support? 👀
📍 Entry: 643 – 646
🛑 Stop Loss: 638
🎯 TP1: 652
🎯 TP2: 657
🎯 TP3: 665
📊 Strong bullish structure remains intact, and the current pullback appears to be healthy consolidation rather than a trend reversal. A bounce from support could fuel the next leg higher.
⚠️ Wait for bullish confirmation before entering. Always manage your risk.
Trade Here 👇
#meta #US10YTreasuryYieldHitsHighestSinceNov2023 #BinanceSquareTalks #USADPWeeklyEmploymentRises12000 $IOST
Adeem Jutt
·1 Likes
·4 views
USTreasuryToBuyBackUpTo$6BLongDatedDebt
7,087 views
121 Discussing
BitcoinSurpasses$79K
48,957 views
243 Discussing