
新哥-带刺的韭黄
1.6k Posts

新哥-带刺的韭黄
每周一至周五晚上9点直播,没有方向的船,无论什么风都是逆风。微博:新哥-带刺的韭黄,推特:BTC新哥
55 Following
1.0K+ Followers
2.0K+ Liked
Posts
All
Quotes
Videos
Live
PINNED
Everyone can follow Twitter: @XinGeBtc

PINNED
Core Trading Philosophy: Do not predict rises and falls, short on resistance, long on support, only engage in high risk-reward ratio speculation within the system.
The market is unpredictable and may experience "sharp rises and falls" at any time, so the only thing that can be done is to manage risk well:
Before placing an order, think carefully about stop-loss and take-profit levels, and determine position size based on risk.
Calculate the risk first, then discuss profits.
You can find me in the chat room for interaction.
The market is unpredictable and may experience "sharp rises and falls" at any time, so the only thing that can be done is to manage risk well:
Before placing an order, think carefully about stop-loss and take-profit levels, and determine position size based on risk.
Calculate the risk first, then discuss profits.
You can find me in the chat room for interaction.

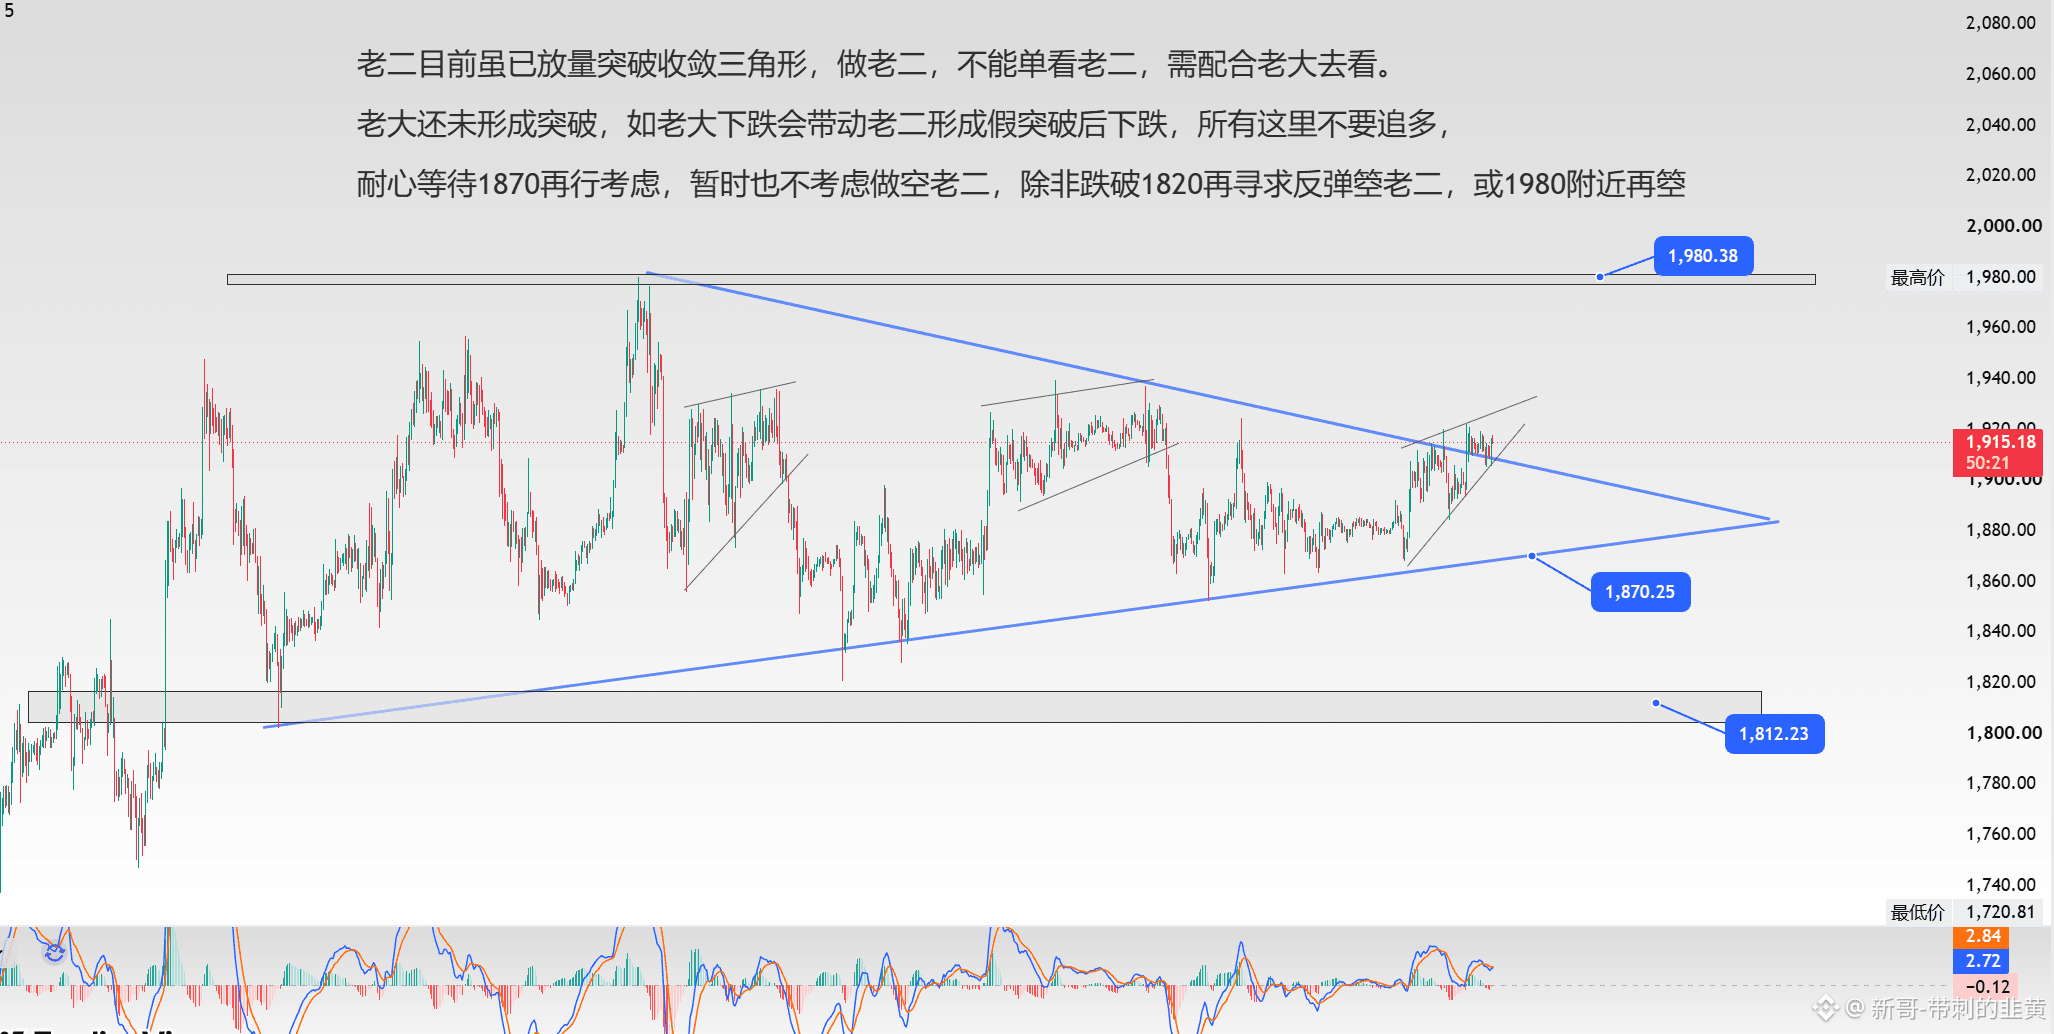
Although Lao Er has already expanded and broken through the contracting triangle, when trading Lao Er you can’t look at Lao Er alone—you need to pair it with Lao Da to assess it.
Lao Da has not yet formed a breakout. If Lao Da falls, it could cause Lao Er to form a false breakout followed by a decline. So don’t chase longs here.
Wait patiently until 1870 before considering again. For now, we also don’t consider shorting Lao Er, unless it breaks below 1820—then look for a rebound to trade Lao Er—or if it approaches around 1980 again to trade.
Lao Da has not yet formed a breakout. If Lao Da falls, it could cause Lao Er to form a false breakout followed by a decline. So don’t chase longs here.
Wait patiently until 1870 before considering again. For now, we also don’t consider shorting Lao Er, unless it breaks below 1820—then look for a rebound to trade Lao Er—or if it approaches around 1980 again to trade.
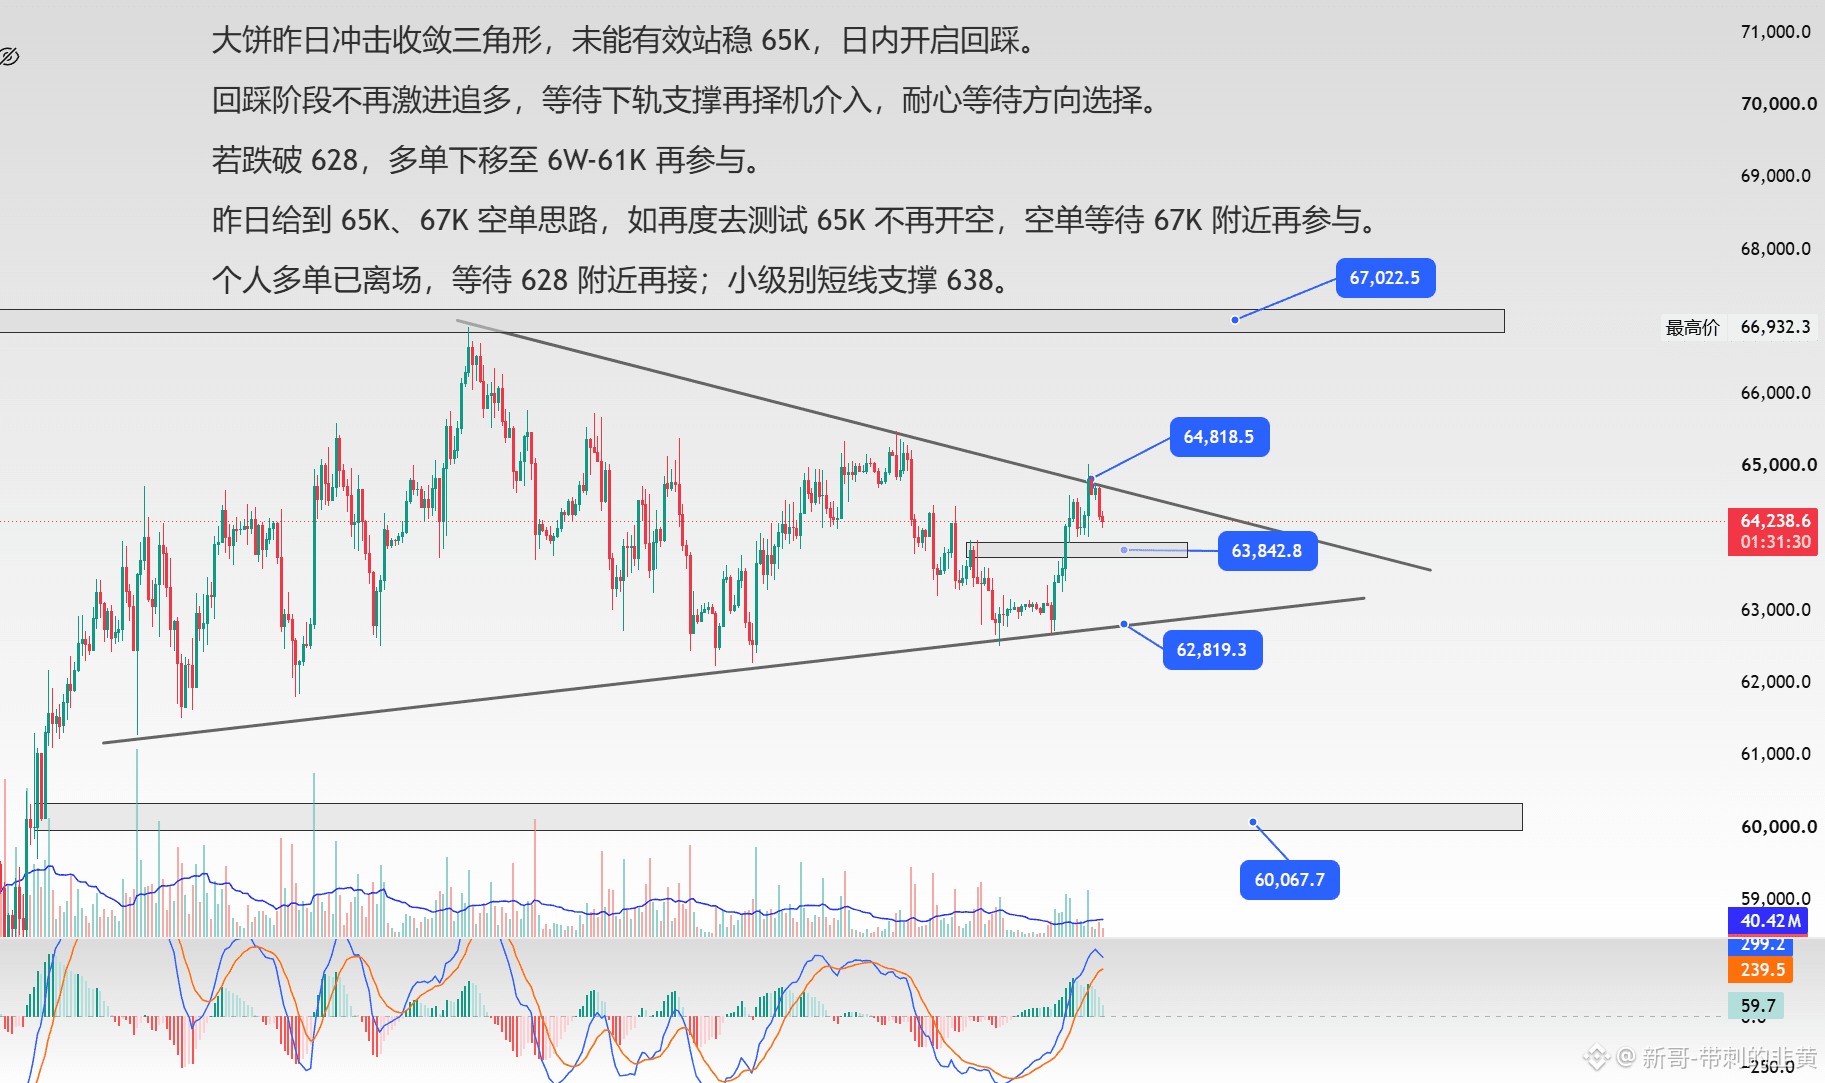
The big round yesterday broke into a converging triangle, but failed to effectively hold above 65K; the intraday is now initiating a pullback.
During the pullback phase, do not aggressively chase longs; wait for support at the lower band and then look for an opportunity to enter. Be patient and wait for the direction to be chosen.
If it breaks below 628, move the long entries down to 6W‑61K and participate again.
Yesterday I provided short ideas around 65K and 67K. If price again tests 65K, don’t open shorts; wait for the area around 67K before participating.
My personal long positions have exited; I’ll wait for around 628 to re-enter. For small timeframe short-term support, watch 638.
During the pullback phase, do not aggressively chase longs; wait for support at the lower band and then look for an opportunity to enter. Be patient and wait for the direction to be chosen.
If it breaks below 628, move the long entries down to 6W‑61K and participate again.
Yesterday I provided short ideas around 65K and 67K. If price again tests 65K, don’t open shorts; wait for the area around 67K before participating.
My personal long positions have exited; I’ll wait for around 628 to re-enter. For small timeframe short-term support, watch 638.
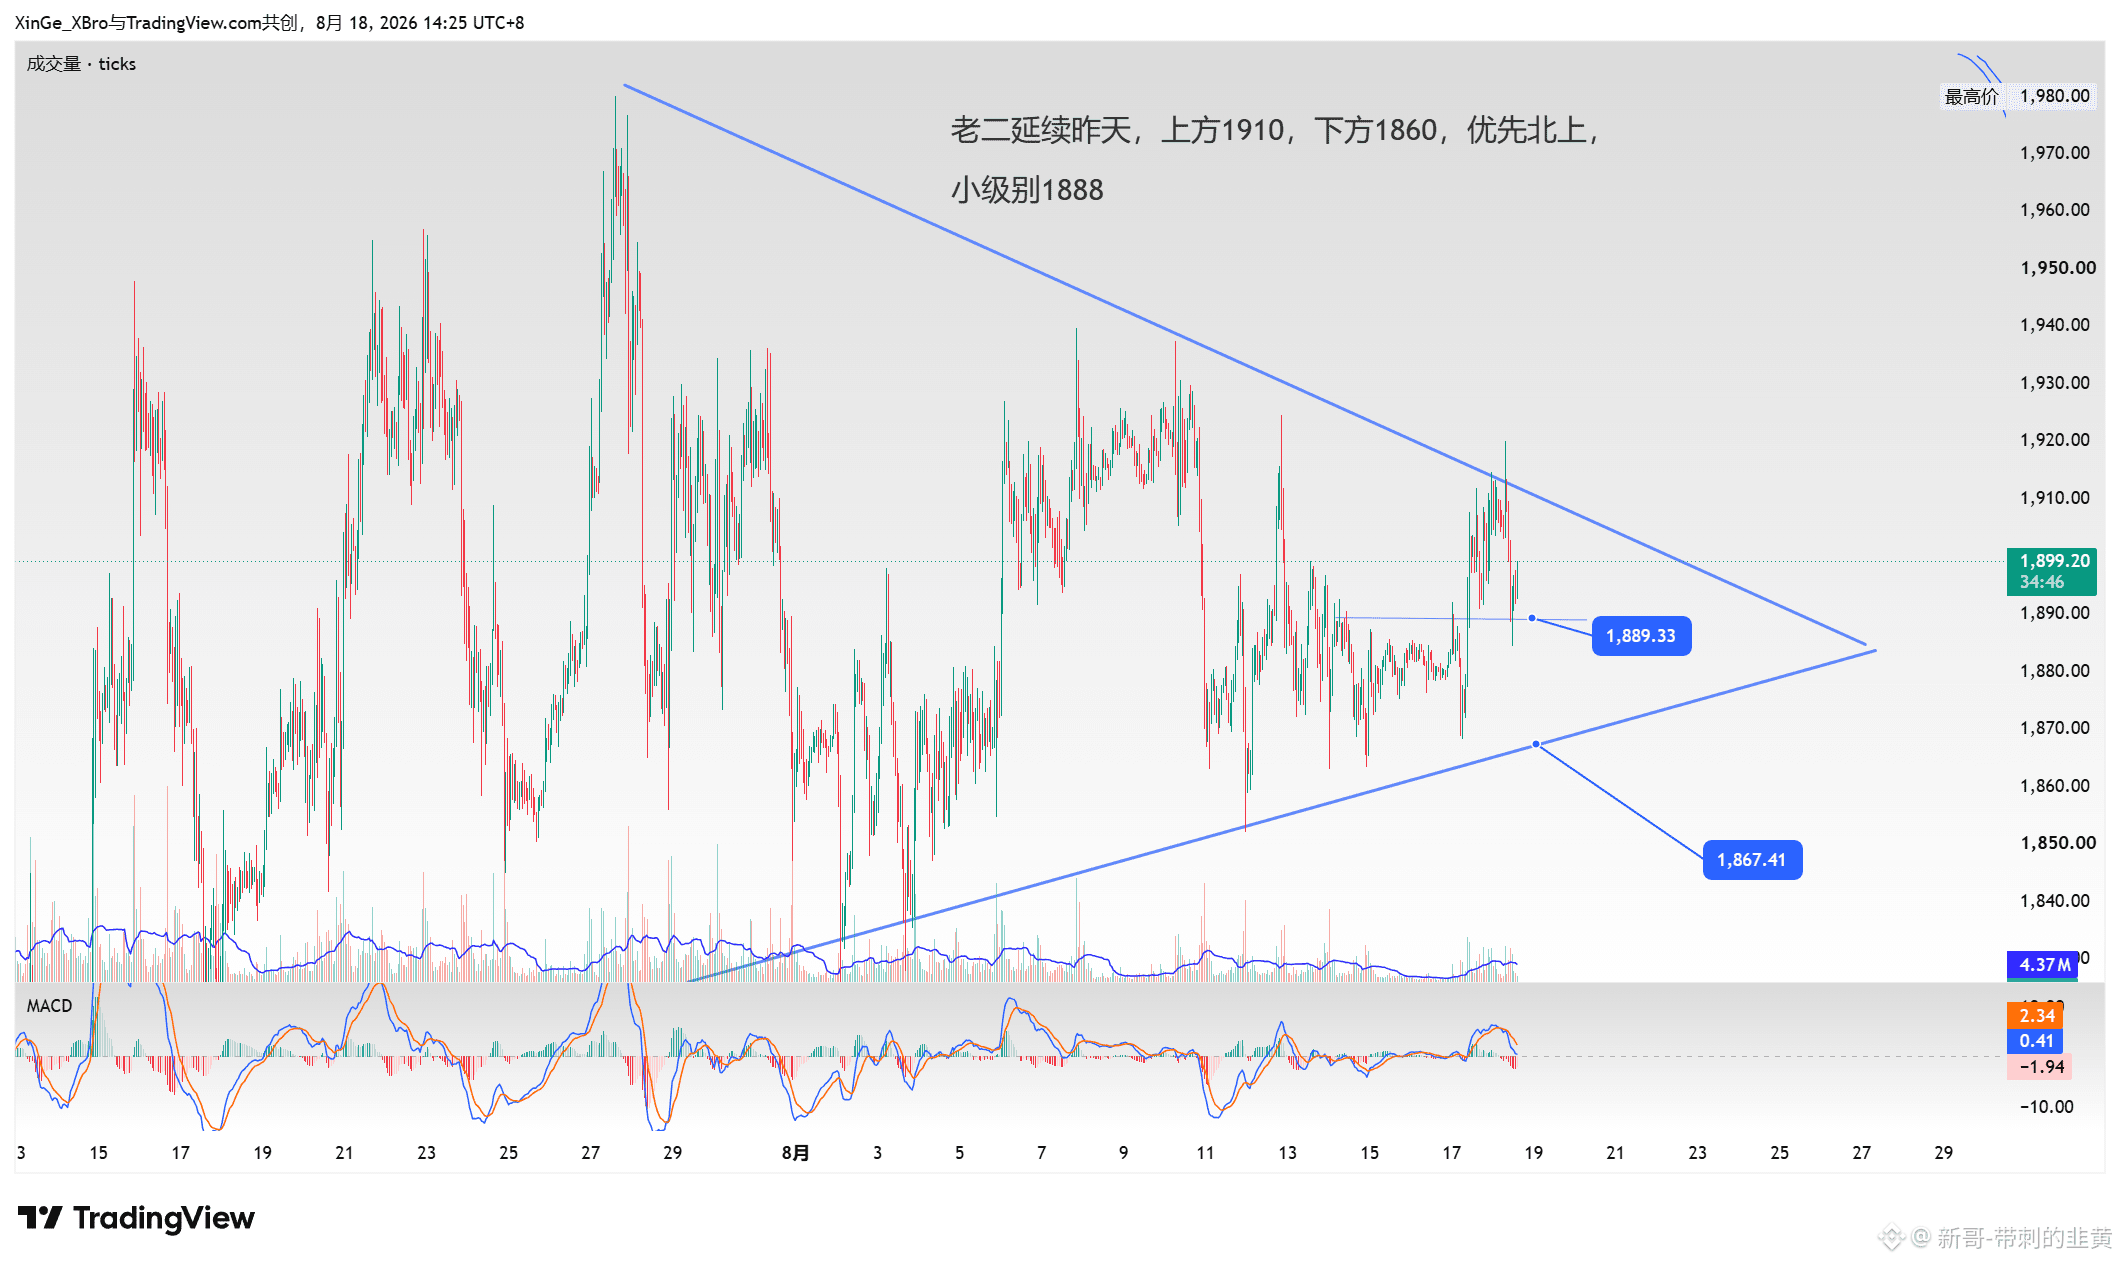
The second one continues from yesterday: above 1910, below 1860. Prefer going north.
On the smaller level: 1888
On the smaller level: 1888
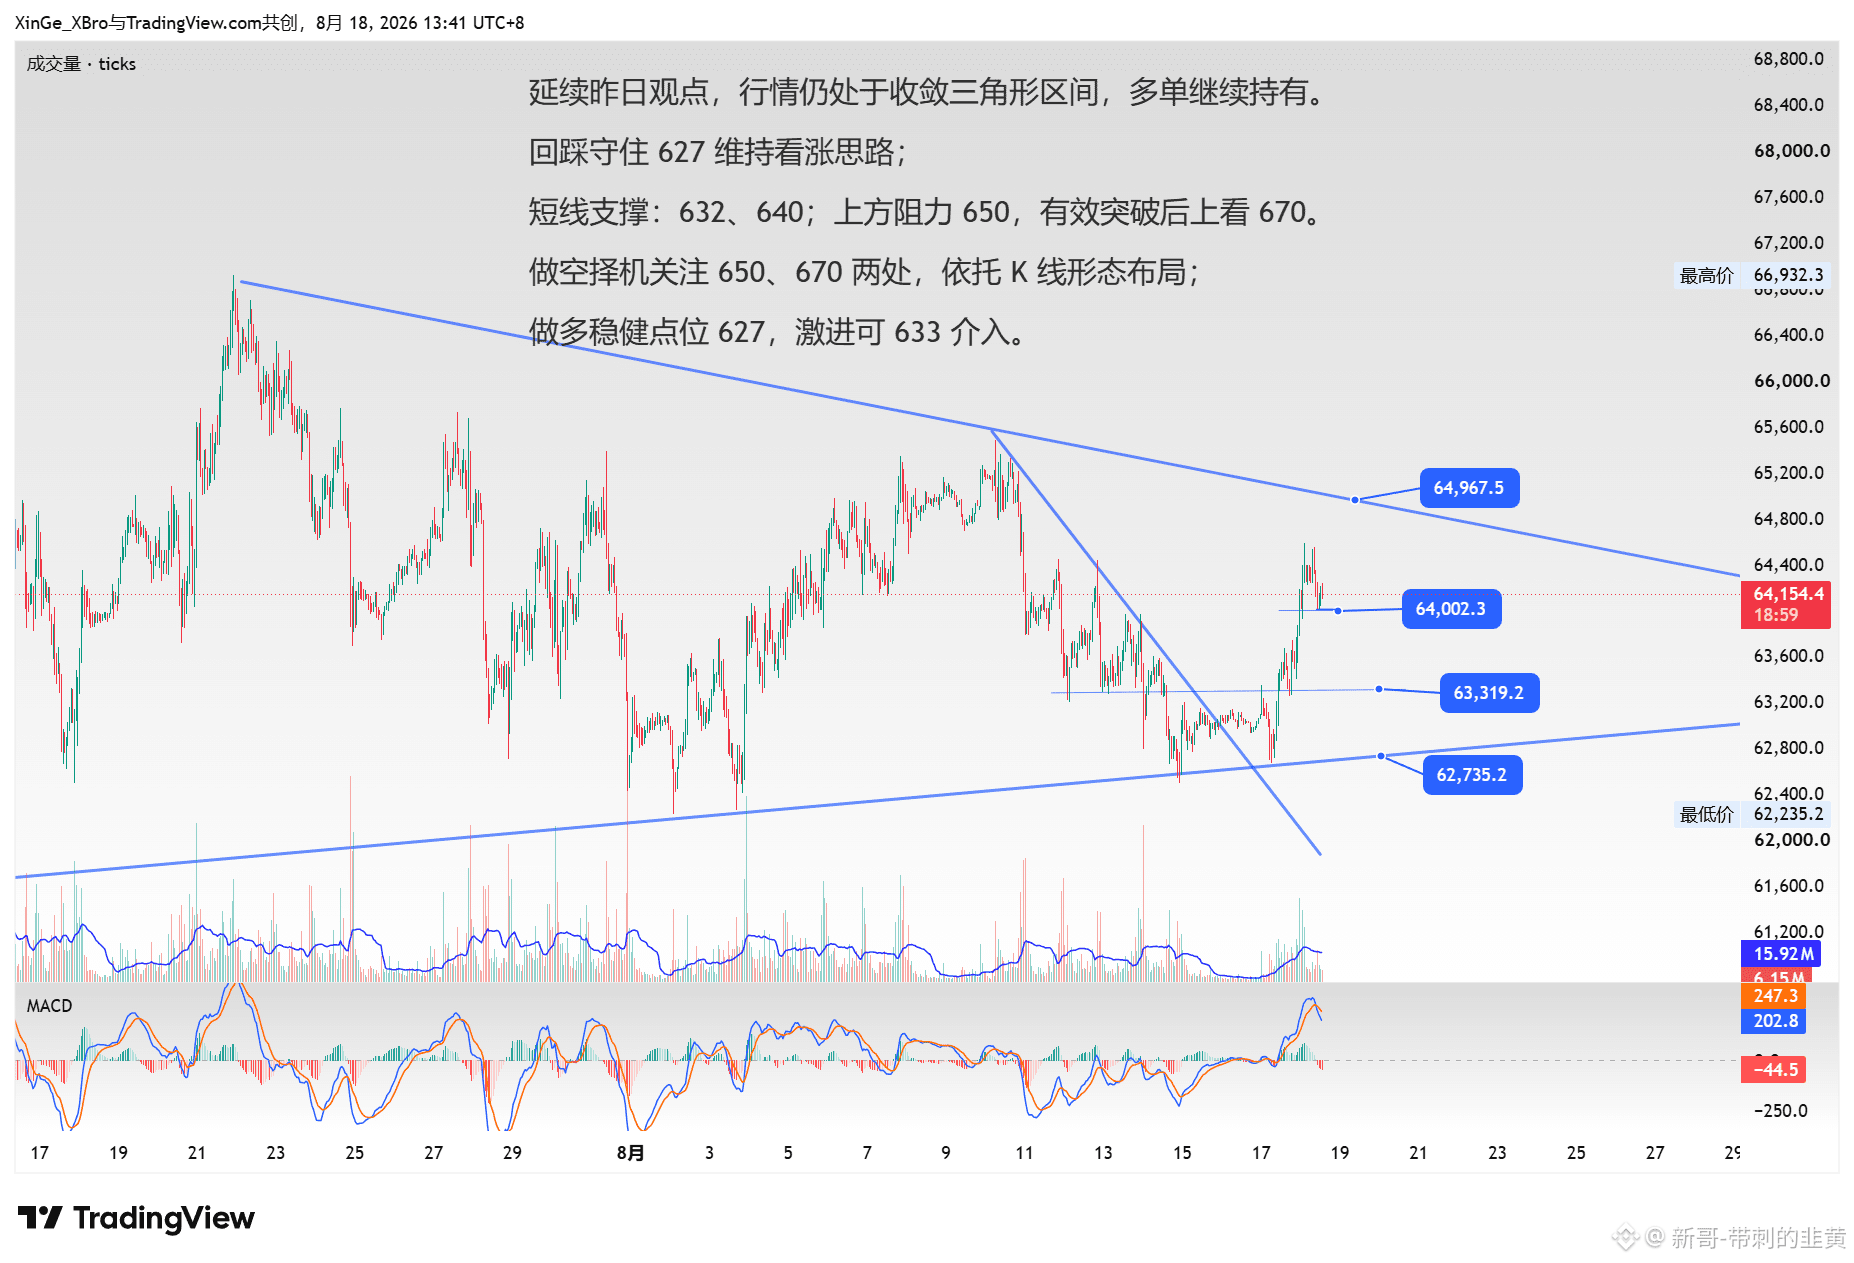
Continuing yesterday’s viewpoint, the market is still consolidating within a converging triangle range. Long positions can be continued.
Pullbacks: hold at 627 to maintain the bullish outlook;
Short-term support: 632, 640; resistance above: 650. After a valid breakout, look for 670.
For shorting, look for opportunities at 650 and 670, and position based on the candlestick patterns;
For going long, the more conservative entry is 627; aggressive traders can enter at 633.
Pullbacks: hold at 627 to maintain the bullish outlook;
Short-term support: 632, 640; resistance above: 650. After a valid breakout, look for 670.
For shorting, look for opportunities at 650 and 670, and position based on the candlestick patterns;
For going long, the more conservative entry is 627; aggressive traders can enter at 633.
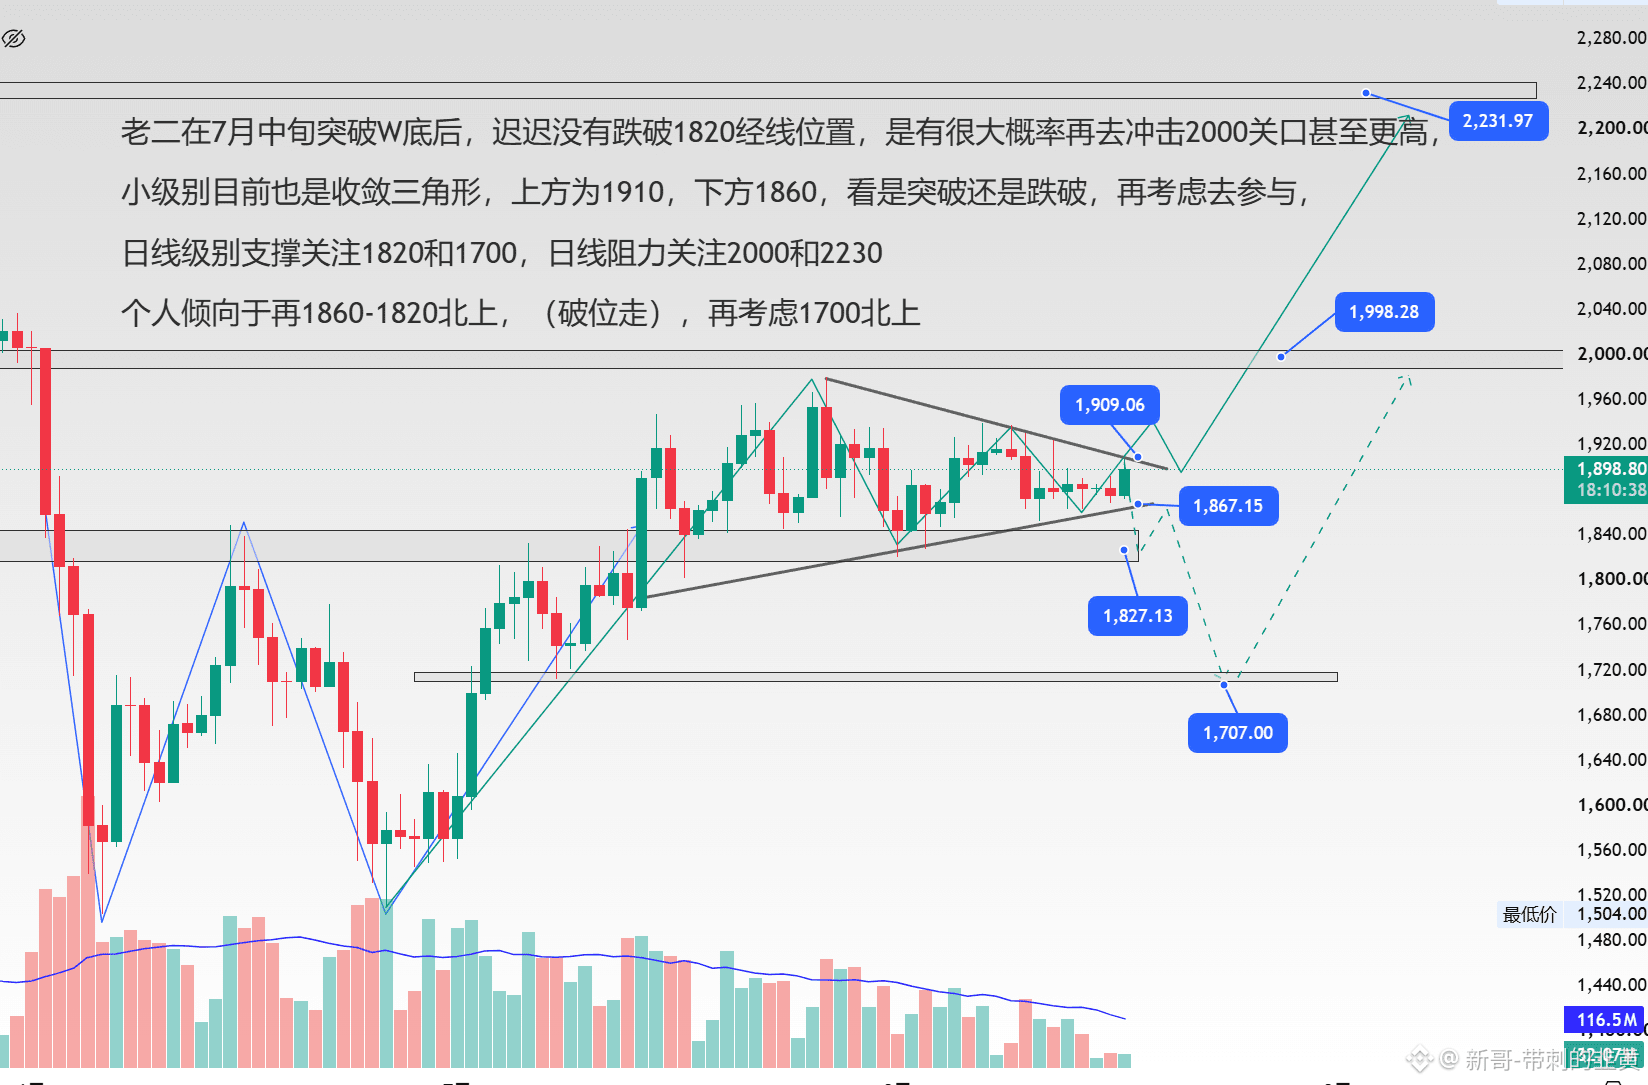
After Lao Er broke through the W bottom in mid-July, it has not yet fallen below the 1820 line position for a long time. There is a high probability that it will once again attempt to test the 2000 level, or even higher.
On the smaller timeframe, it is currently consolidating into a converging triangle: the resistance is at 1910, and the support is at 1860. It will depend on whether it breaks out or breaks down before considering participation.
On the daily timeframe, focus on support at 1820 and 1700. For resistance, watch 2000 and 2230.
Personally, I lean toward a move north from the 1860–1820 zone (if it breaks down, then exit), and then consider moving north again from 1700.
On the smaller timeframe, it is currently consolidating into a converging triangle: the resistance is at 1910, and the support is at 1860. It will depend on whether it breaks out or breaks down before considering participation.
On the daily timeframe, focus on support at 1820 and 1700. For resistance, watch 2000 and 2230.
Personally, I lean toward a move north from the 1860–1820 zone (if it breaks down, then exit), and then consider moving north again from 1700.
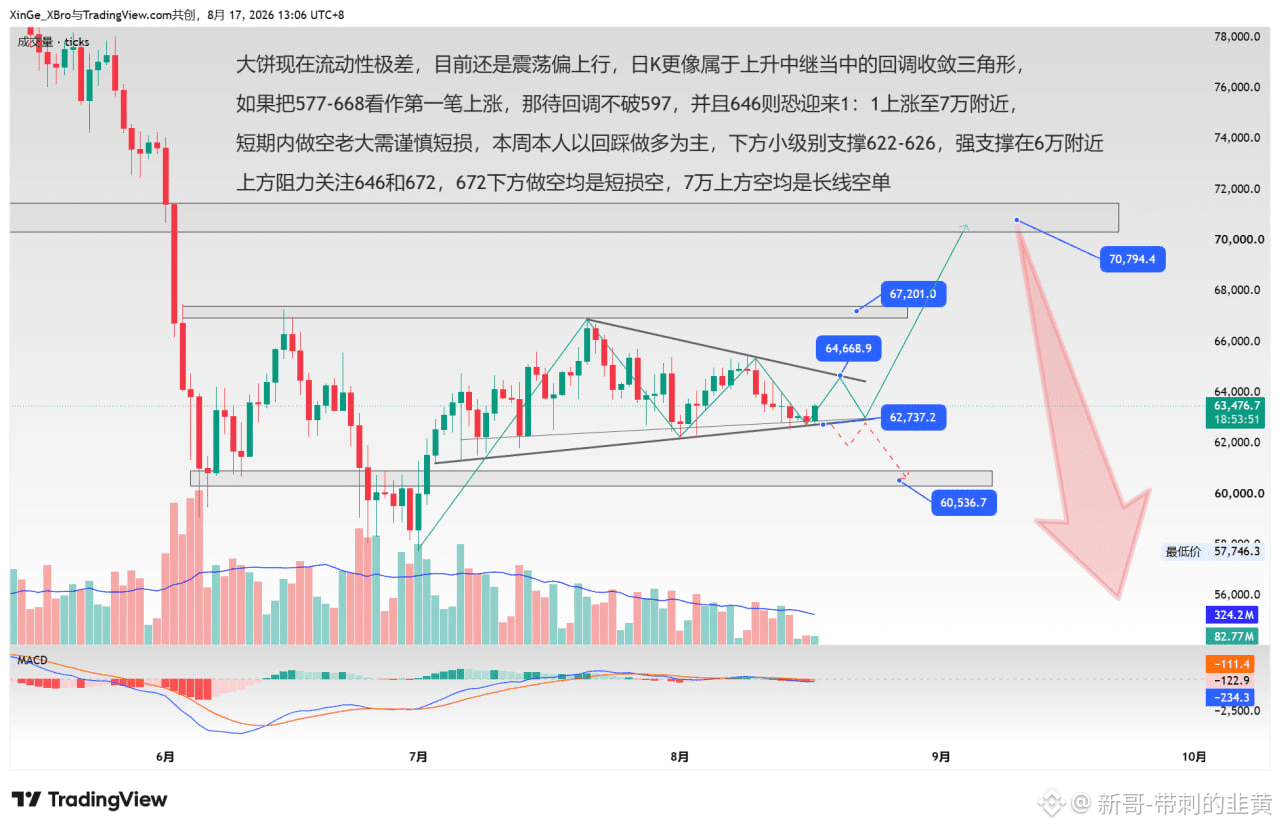
The big pancake’s liquidity is currently extremely poor. It’s still consolidating with an upward bias. On the daily chart, it looks more like a pullback within an uptrend continuation—converging triangle.
If we regard 577–668 as the first upward leg, then as long as the pullback doesn’t break 597, and if 646 holds, it may see a 1:1 upward move toward around 70,000.
For the short term, if you want to short “the big one,” be careful—keep your stop short to limit losses. This week, I’ll mainly focus on going long on pullbacks. Support on the lower small timeframe is 622–626, and the strong support is around 60,000.
For resistance, watch 646 and 672. Any short taken below 672 is a short-term loss-cut trade. Shorts above 70,000 are long-term short positions.
If we regard 577–668 as the first upward leg, then as long as the pullback doesn’t break 597, and if 646 holds, it may see a 1:1 upward move toward around 70,000.
For the short term, if you want to short “the big one,” be careful—keep your stop short to limit losses. This week, I’ll mainly focus on going long on pullbacks. Support on the lower small timeframe is 622–626, and the strong support is around 60,000.
For resistance, watch 646 and 672. Any short taken below 672 is a short-term loss-cut trade. Shorts above 70,000 are long-term short positions.
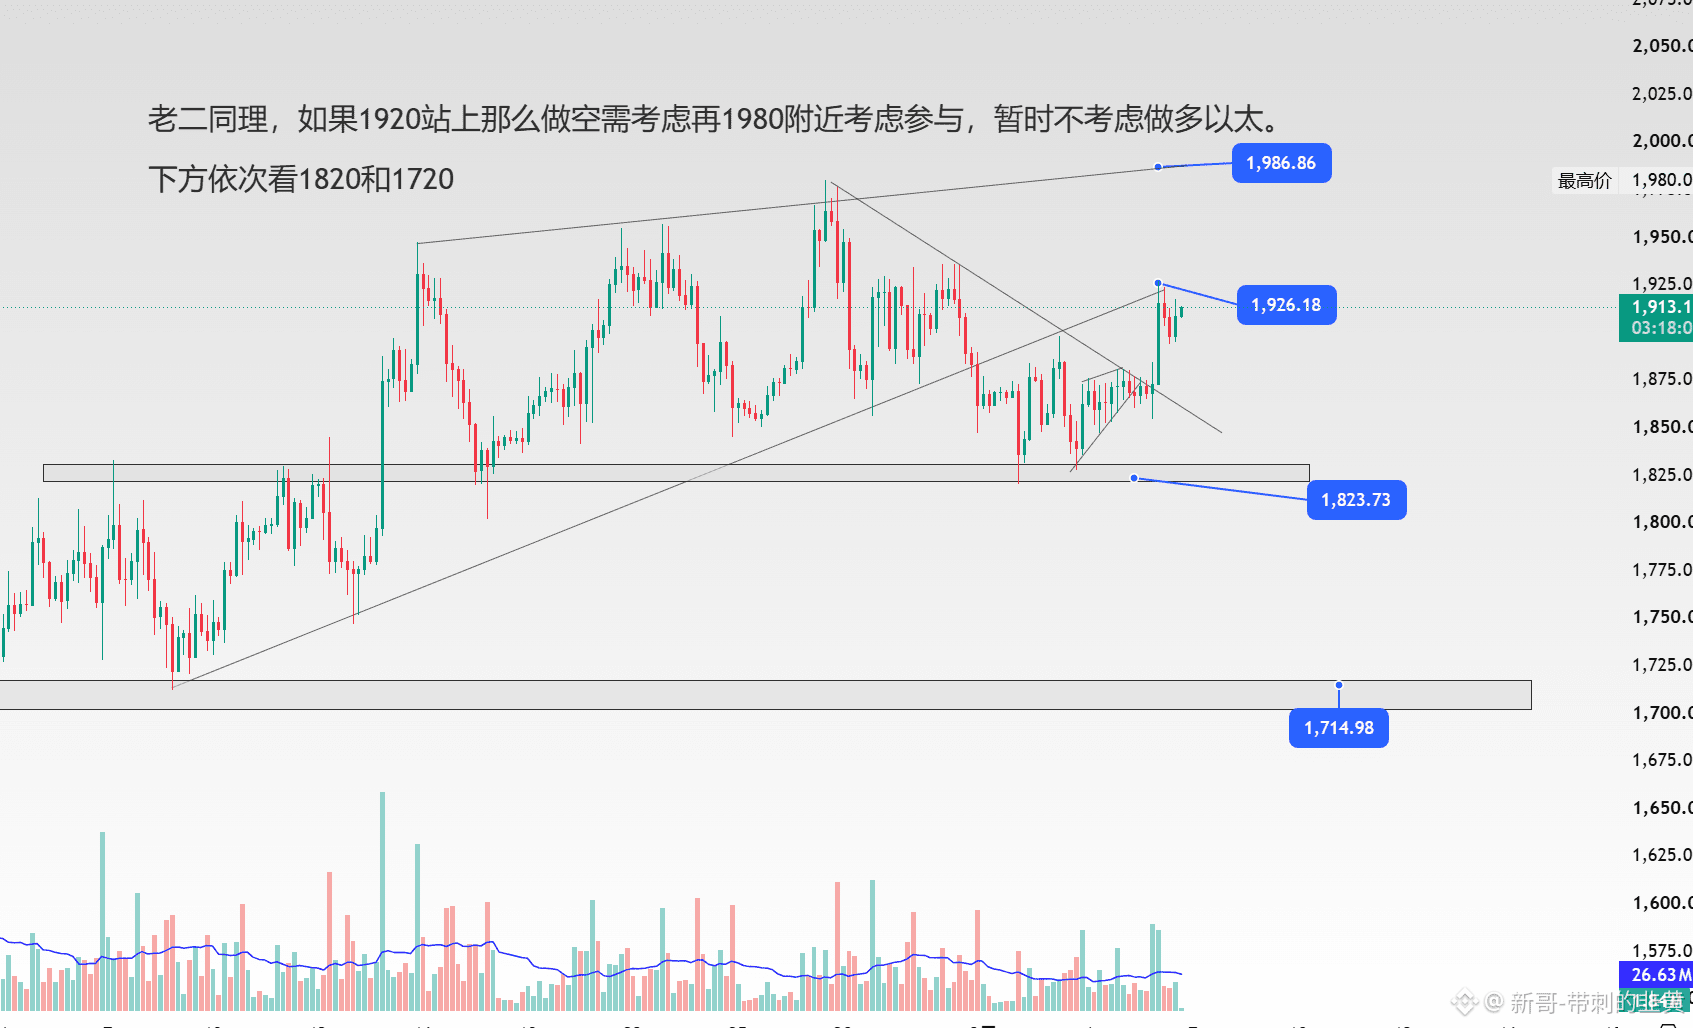
Second, in line with the logic, if 1920 holds, then for shorting you need to consider participating around 1980 as well. For now, we do not consider going long with Ether.
Next, look at 1820 and then 1720 below.
Next, look at 1820 and then 1720 below.
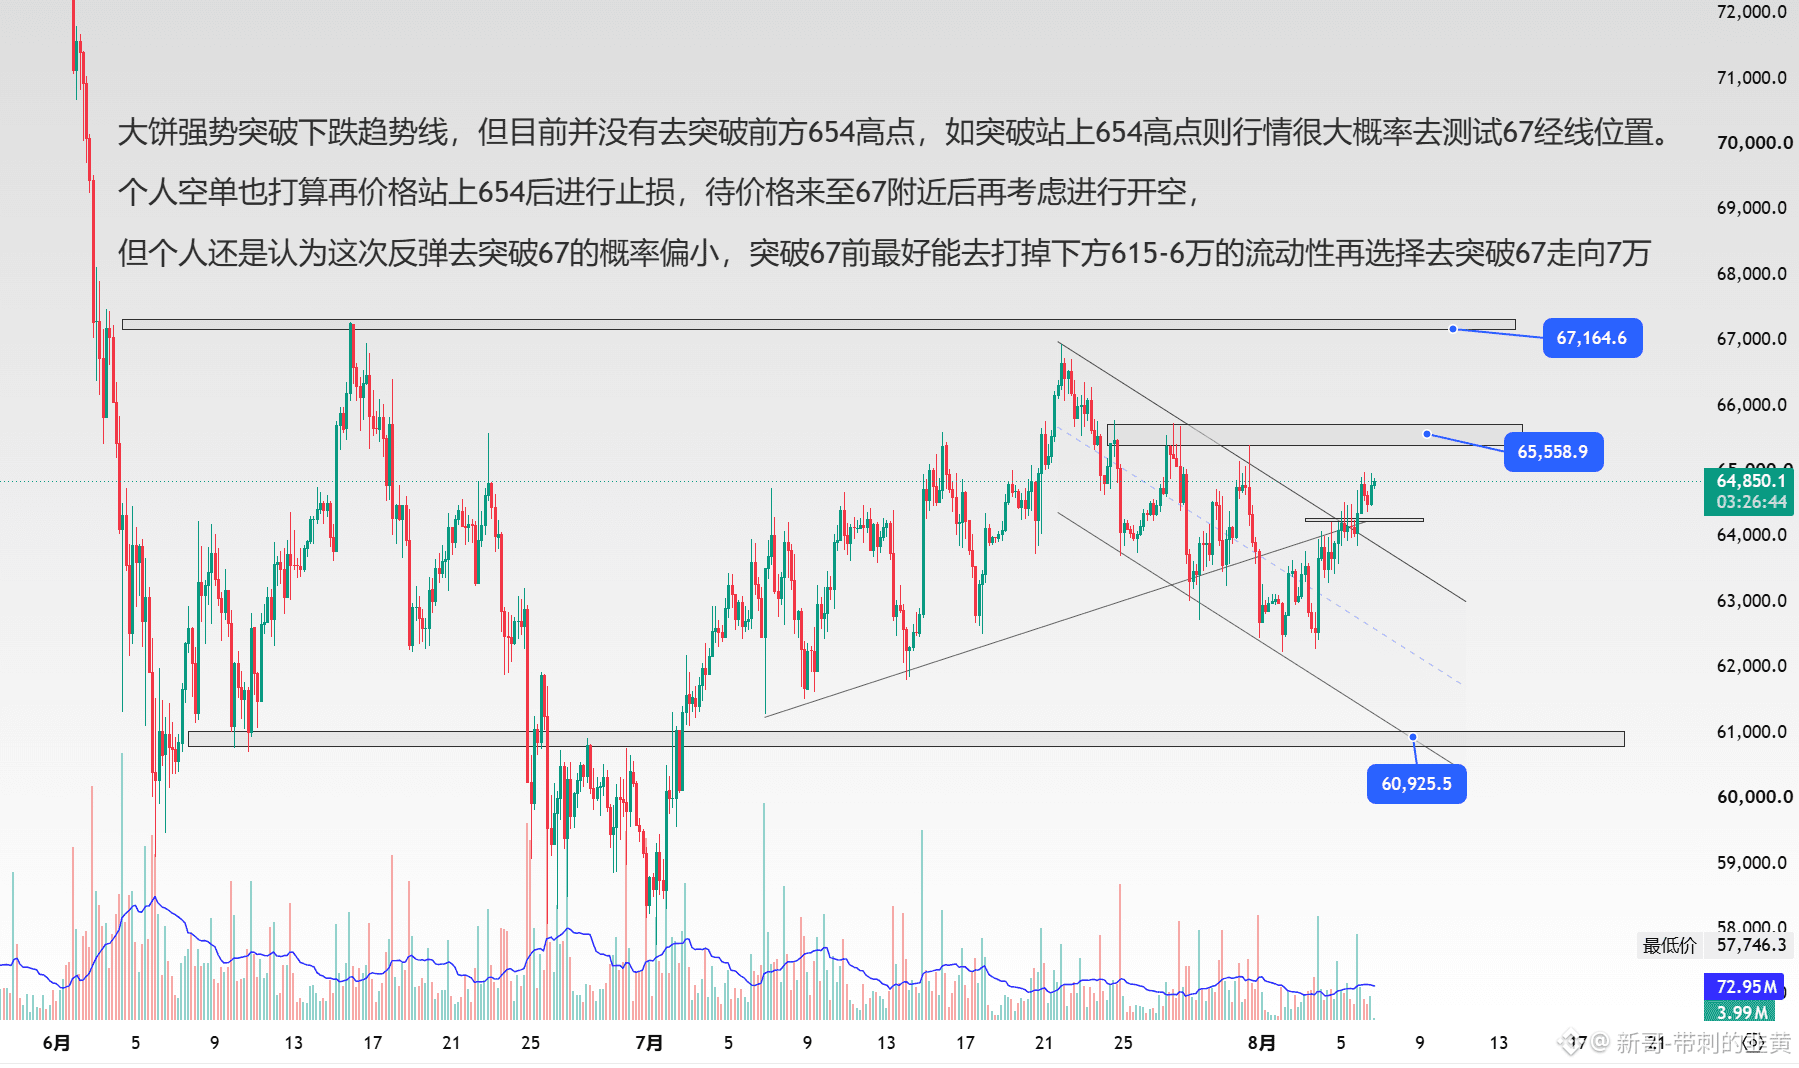
A large pancake has strongly broken through the downward trend line, but currently it has not yet broken above the 654 prior high. If it breaks and holds above 654, the market will very likely test the 67 midline.
My personal short position also plans to place the stop loss after the price stands above 654. Once the price comes near 67, I will consider opening a short again.
However, I personally still think the probability that this rebound will break through 67 is relatively low. Before breaking through 67, it would be better to first take out the liquidity below at 615–60,000, and then choose to push toward 67 toward 70,000 $BTC
My personal short position also plans to place the stop loss after the price stands above 654. Once the price comes near 67, I will consider opening a short again.
However, I personally still think the probability that this rebound will break through 67 is relatively low. Before breaking through 67, it would be better to first take out the liquidity below at 615–60,000, and then choose to push toward 67 toward 70,000 $BTC
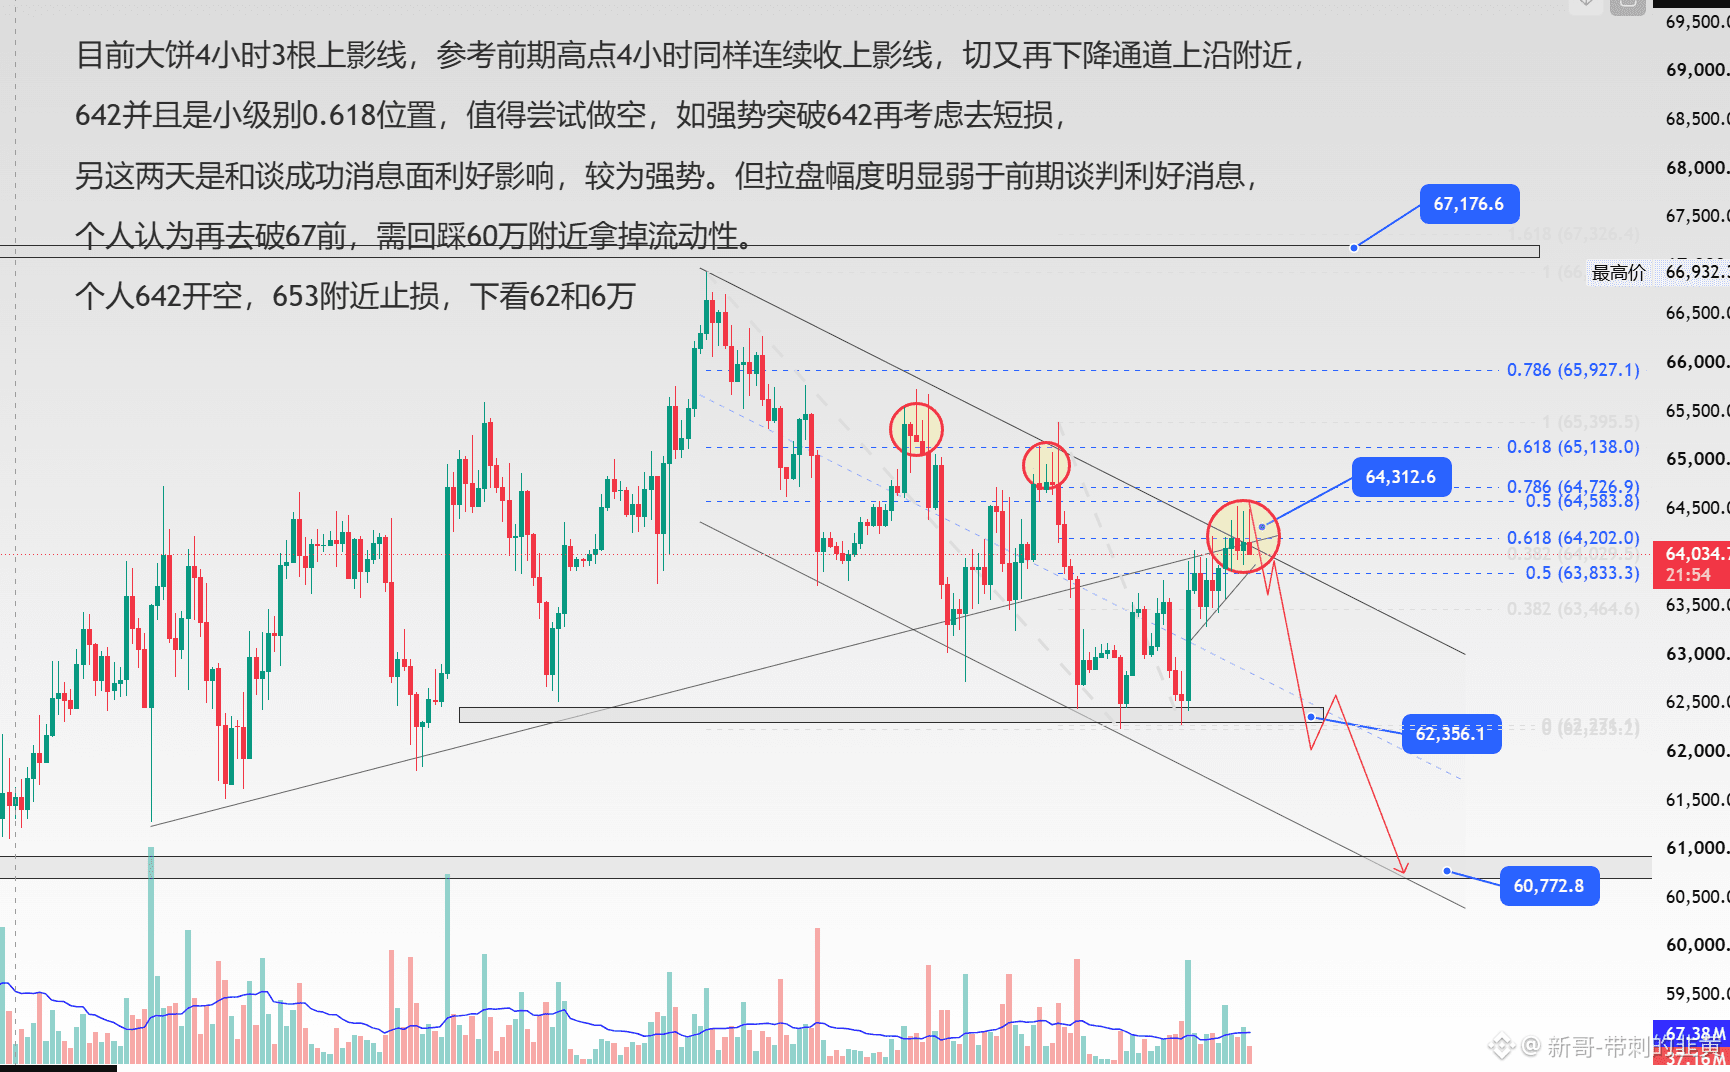
Currently, the big 4-hour candle has 3 long upper wicks. It is similar to the previous phase where, at the same 4-hour prior high, there were consecutive closes with upper wicks. After that, it fell again near the upper edge of the descending channel.
642 is also at the 0.618 level on a smaller timeframe. It is worth trying to short. If there is a strong breakout above 642, then consider going short with a tight stop.
Also, these past two days have been driven by positive news from the successful negotiations. However, the pullback strength is clearly weaker than the earlier negotiation news.
Personally, before breaking 67 again, I think it needs to pull back to around 600k to remove liquidity.
Personally I will short at 642, stop loss around 653, looking down to 62 and 600k.
642 is also at the 0.618 level on a smaller timeframe. It is worth trying to short. If there is a strong breakout above 642, then consider going short with a tight stop.
Also, these past two days have been driven by positive news from the successful negotiations. However, the pullback strength is clearly weaker than the earlier negotiation news.
Personally, before breaking 67 again, I think it needs to pull back to around 600k to remove liquidity.
Personally I will short at 642, stop loss around 653, looking down to 62 and 600k.
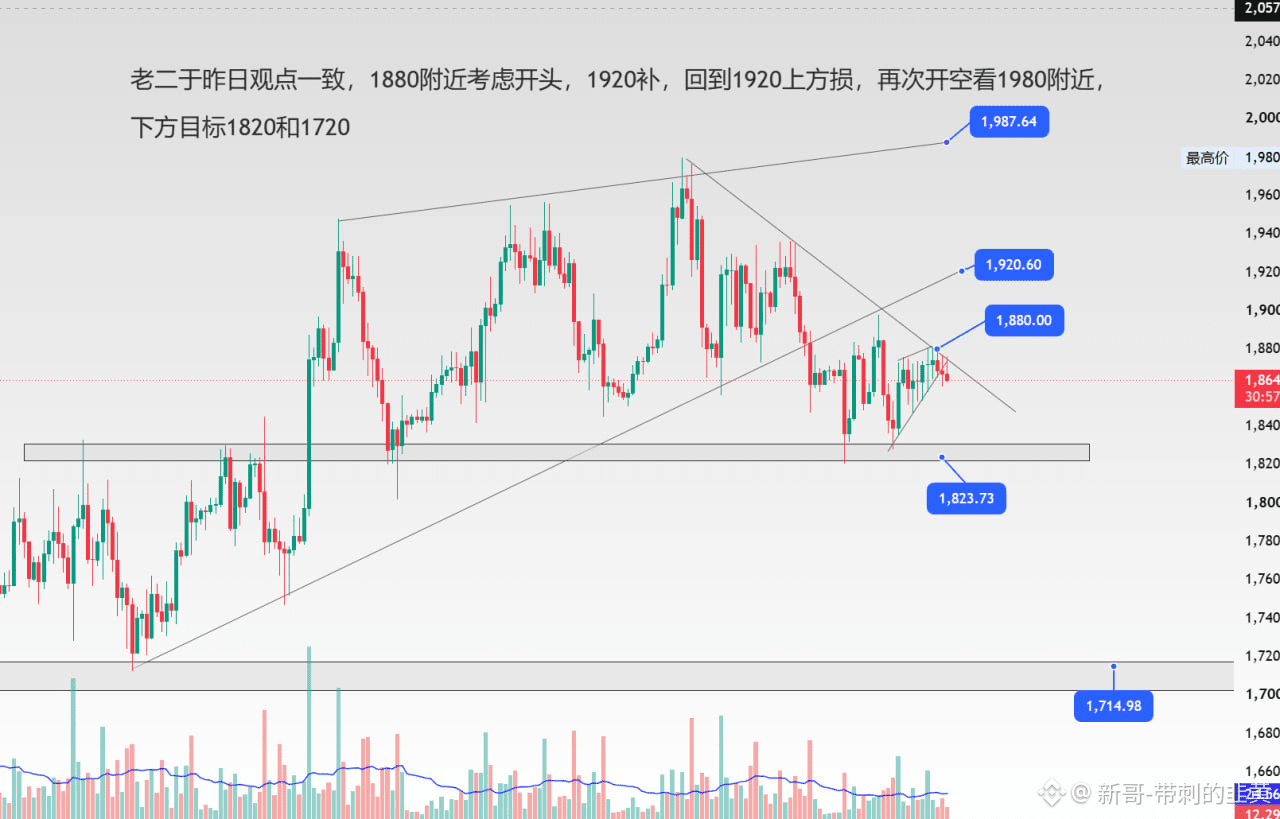
Second brother agreed with yesterday’s viewpoint. Consider starting around 1880, add at 1920, then if price returns above 1920 expect a loss again—go short once more to look for around 1980.
Downside targets are 1820 and 1720$ $BTC
Downside targets are 1820 and 1720$ $BTC
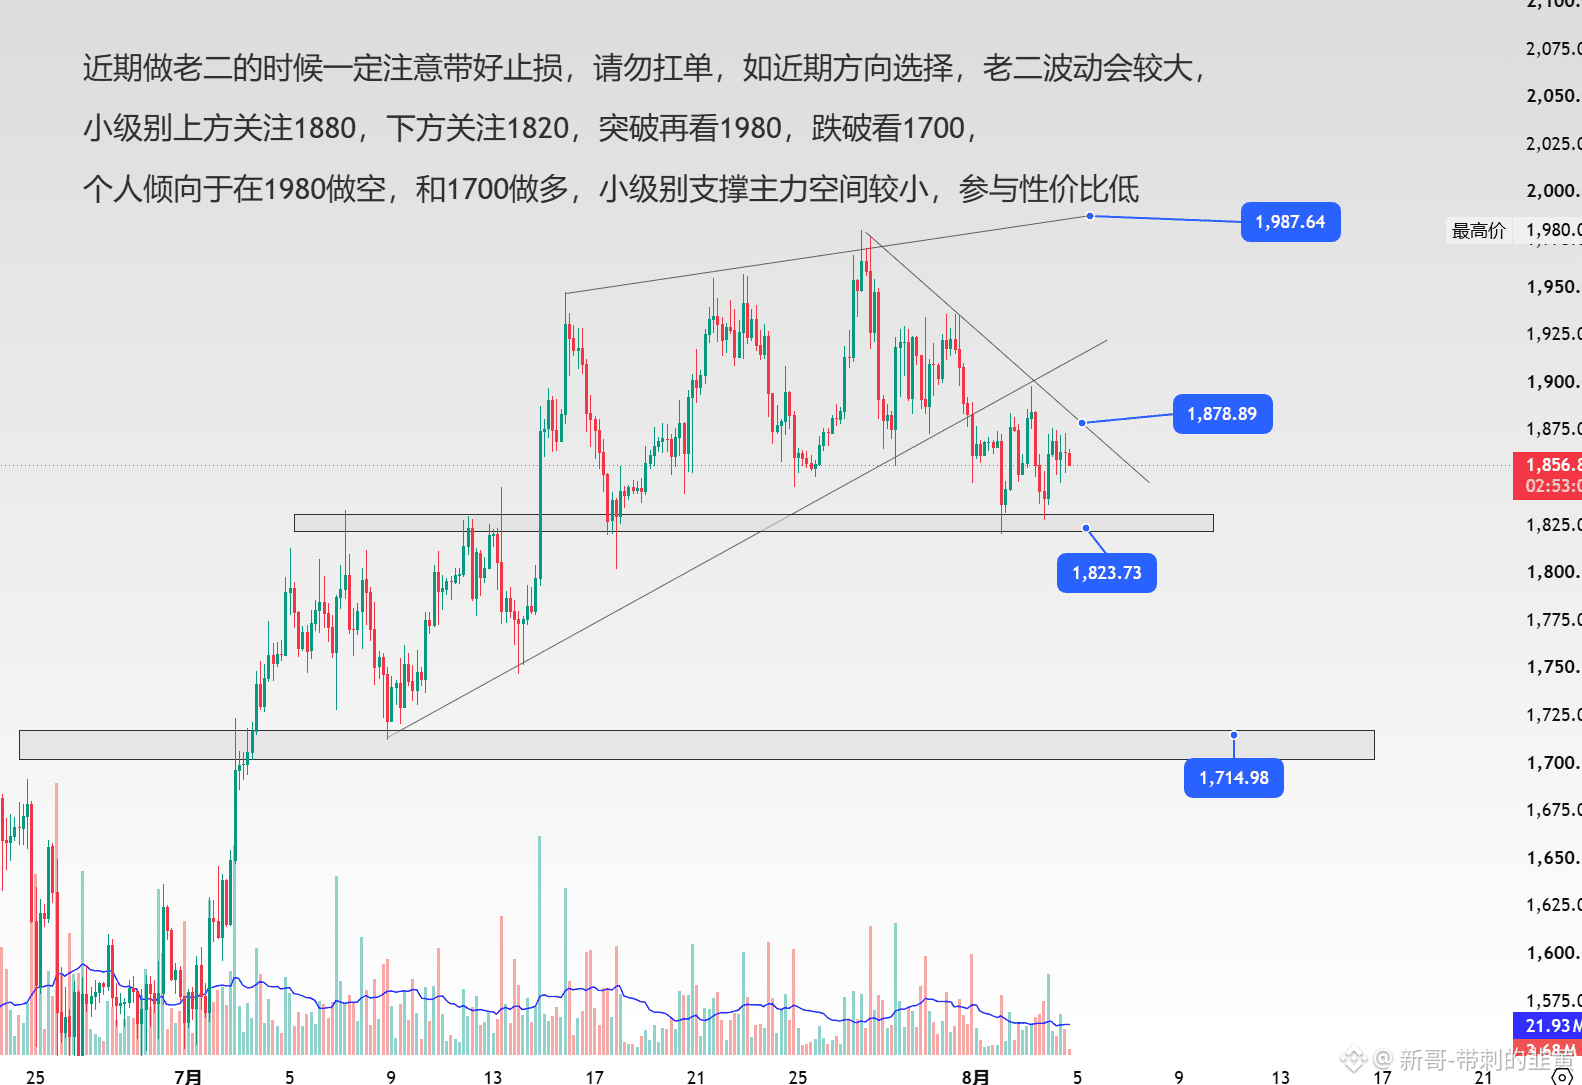
When doing the second leg recently, be sure to set a proper stop-loss. Do not hold the position through adverse moves. If you choose a direction in the near term, the second leg’s volatility will be relatively high.
On the smaller time frame, watch 1880 above for resistance, and 1820 below for support. If there is a breakout, then look toward 1980; if it breaks down, then look toward 1700.
Personally, I lean toward shorting at 1980 and going long at 1700. On the smaller time frame, the main support/resistance move has relatively limited space, so the trade-off value is low.
On the smaller time frame, watch 1880 above for resistance, and 1820 below for support. If there is a breakout, then look toward 1980; if it breaks down, then look toward 1700.
Personally, I lean toward shorting at 1980 and going long at 1700. On the smaller time frame, the main support/resistance move has relatively limited space, so the trade-off value is low.
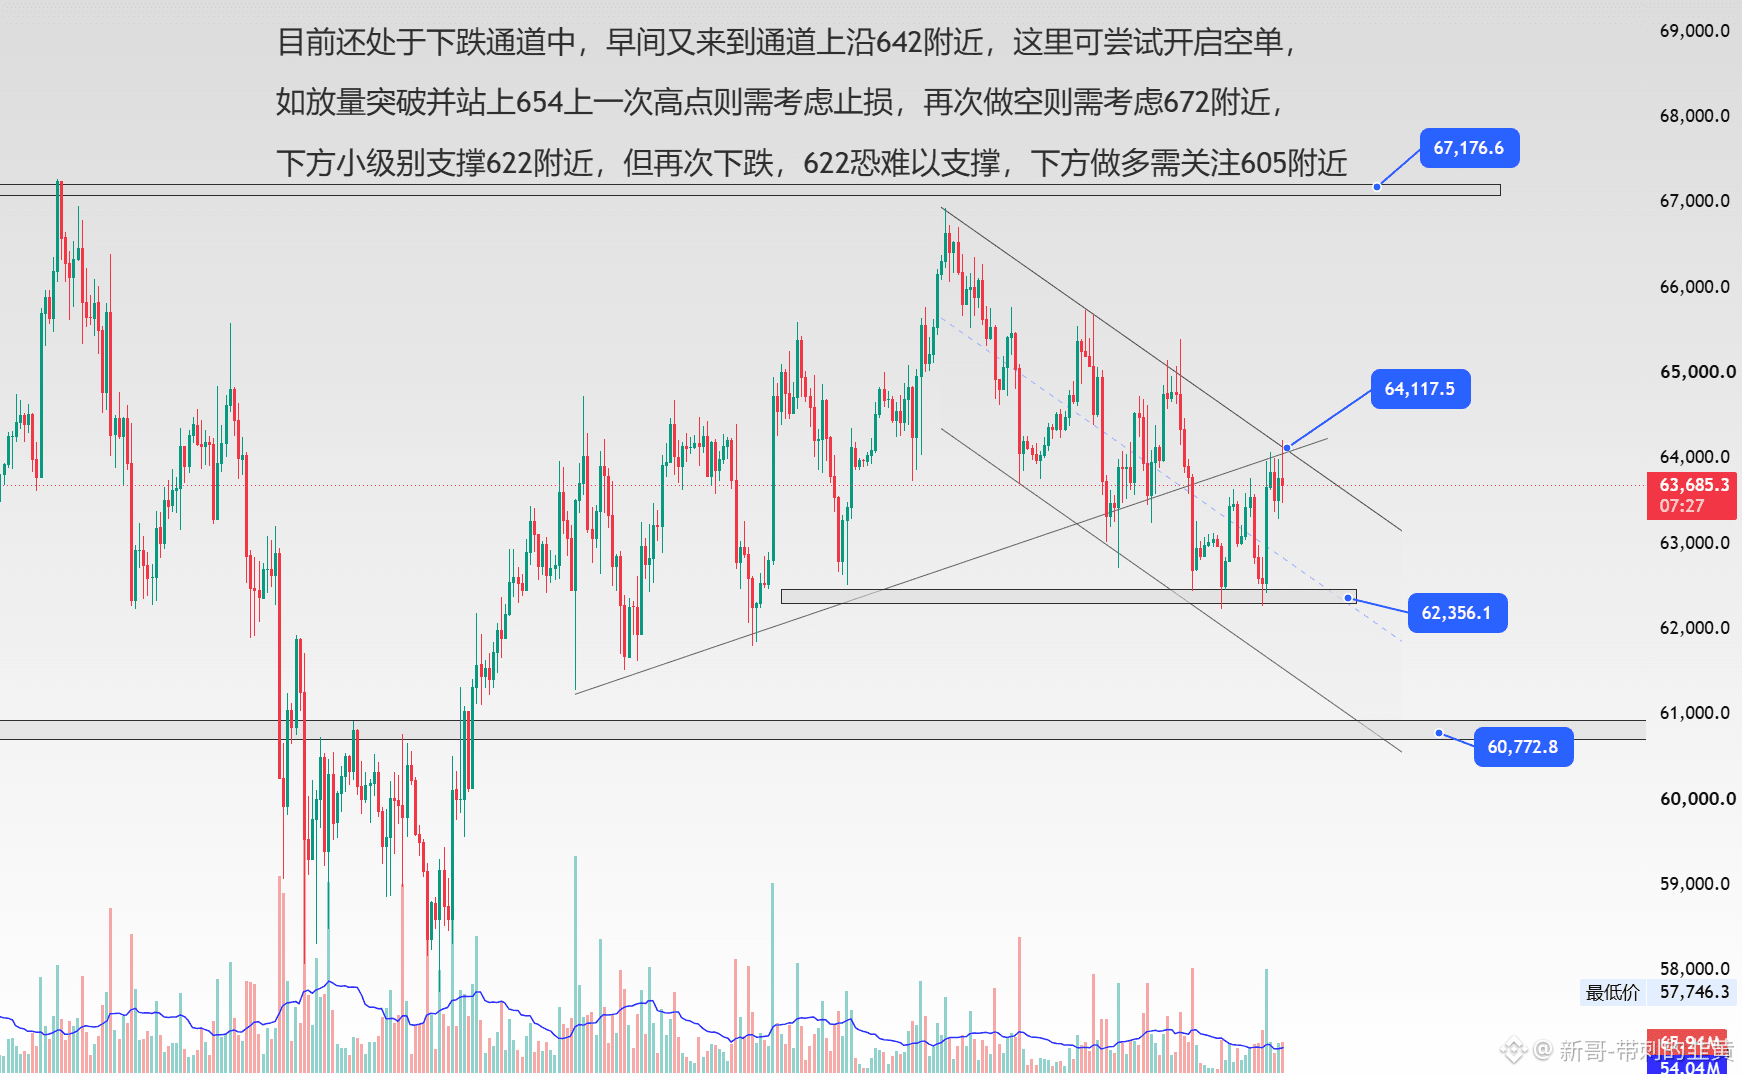
Currently it is still in a downward channel. In the morning it came back to the upper boundary of the channel around 642, where you may try initiating a short position.
If there is a breakout with increased volume and it holds above 654, which is the previous high, then you need to consider a stop loss. If you short again, you should consider around 672.
Below, support on a smaller timeframe is around 622, but if it falls again, 622 may not be able to hold. For a long position below, pay attention to around 605.
$BTC
If there is a breakout with increased volume and it holds above 654, which is the previous high, then you need to consider a stop loss. If you short again, you should consider around 672.
Below, support on a smaller timeframe is around 622, but if it falls again, 622 may not be able to hold. For a long position below, pay attention to around 605.
$BTC
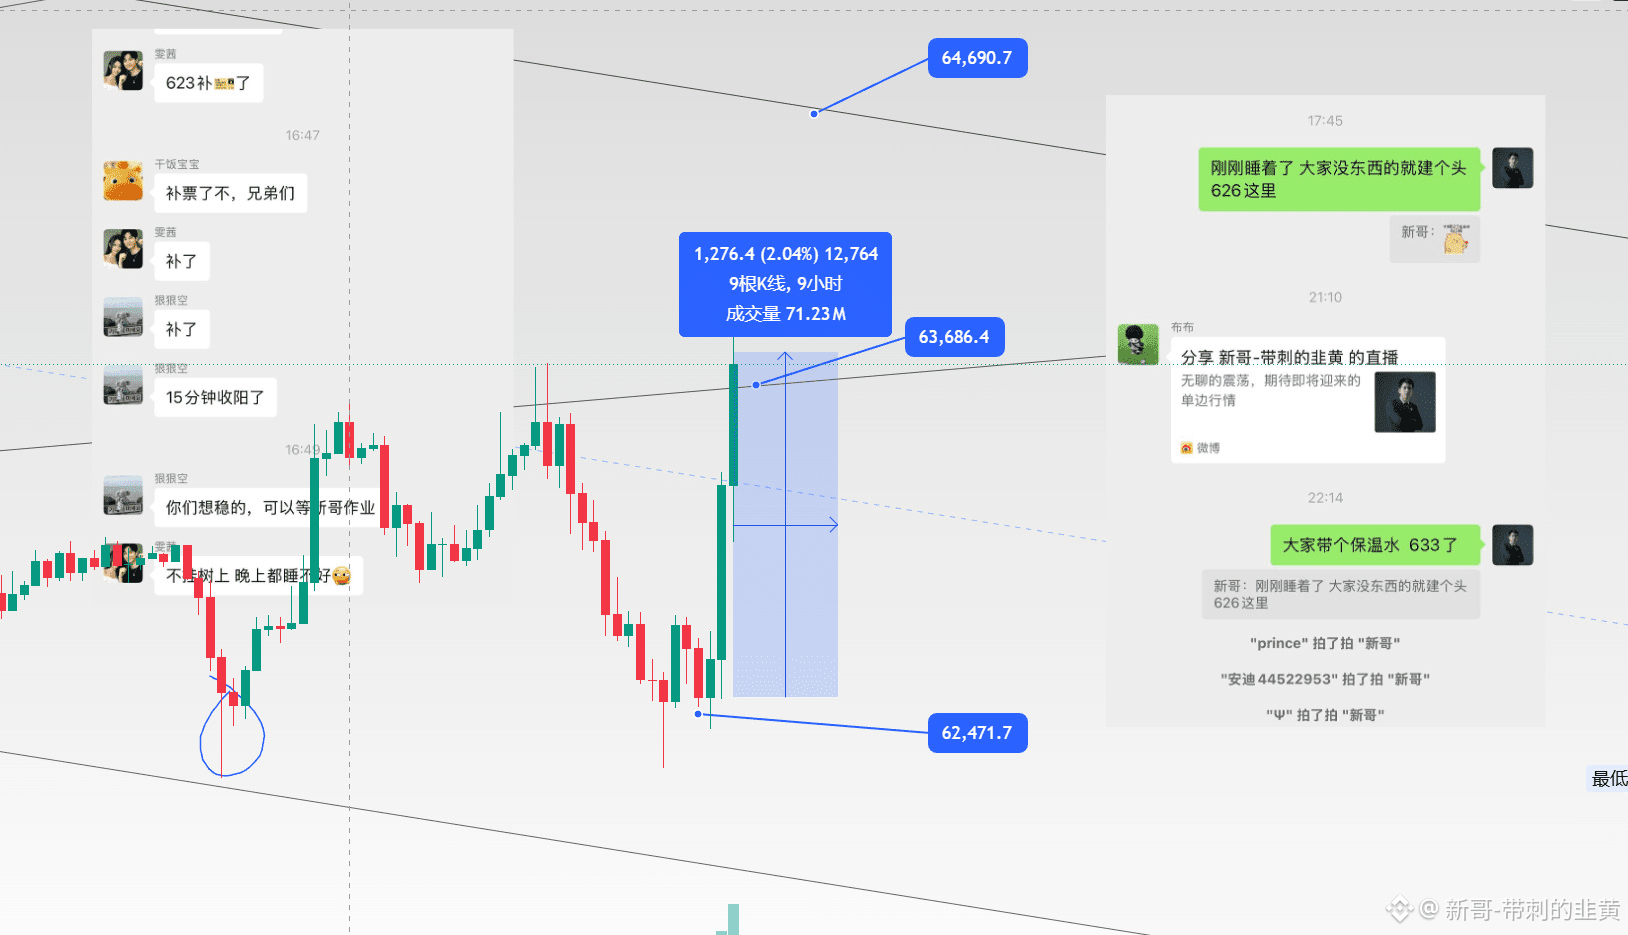
623 Northbound, up another 2%. Friends in the live room—who’s got something to eat?
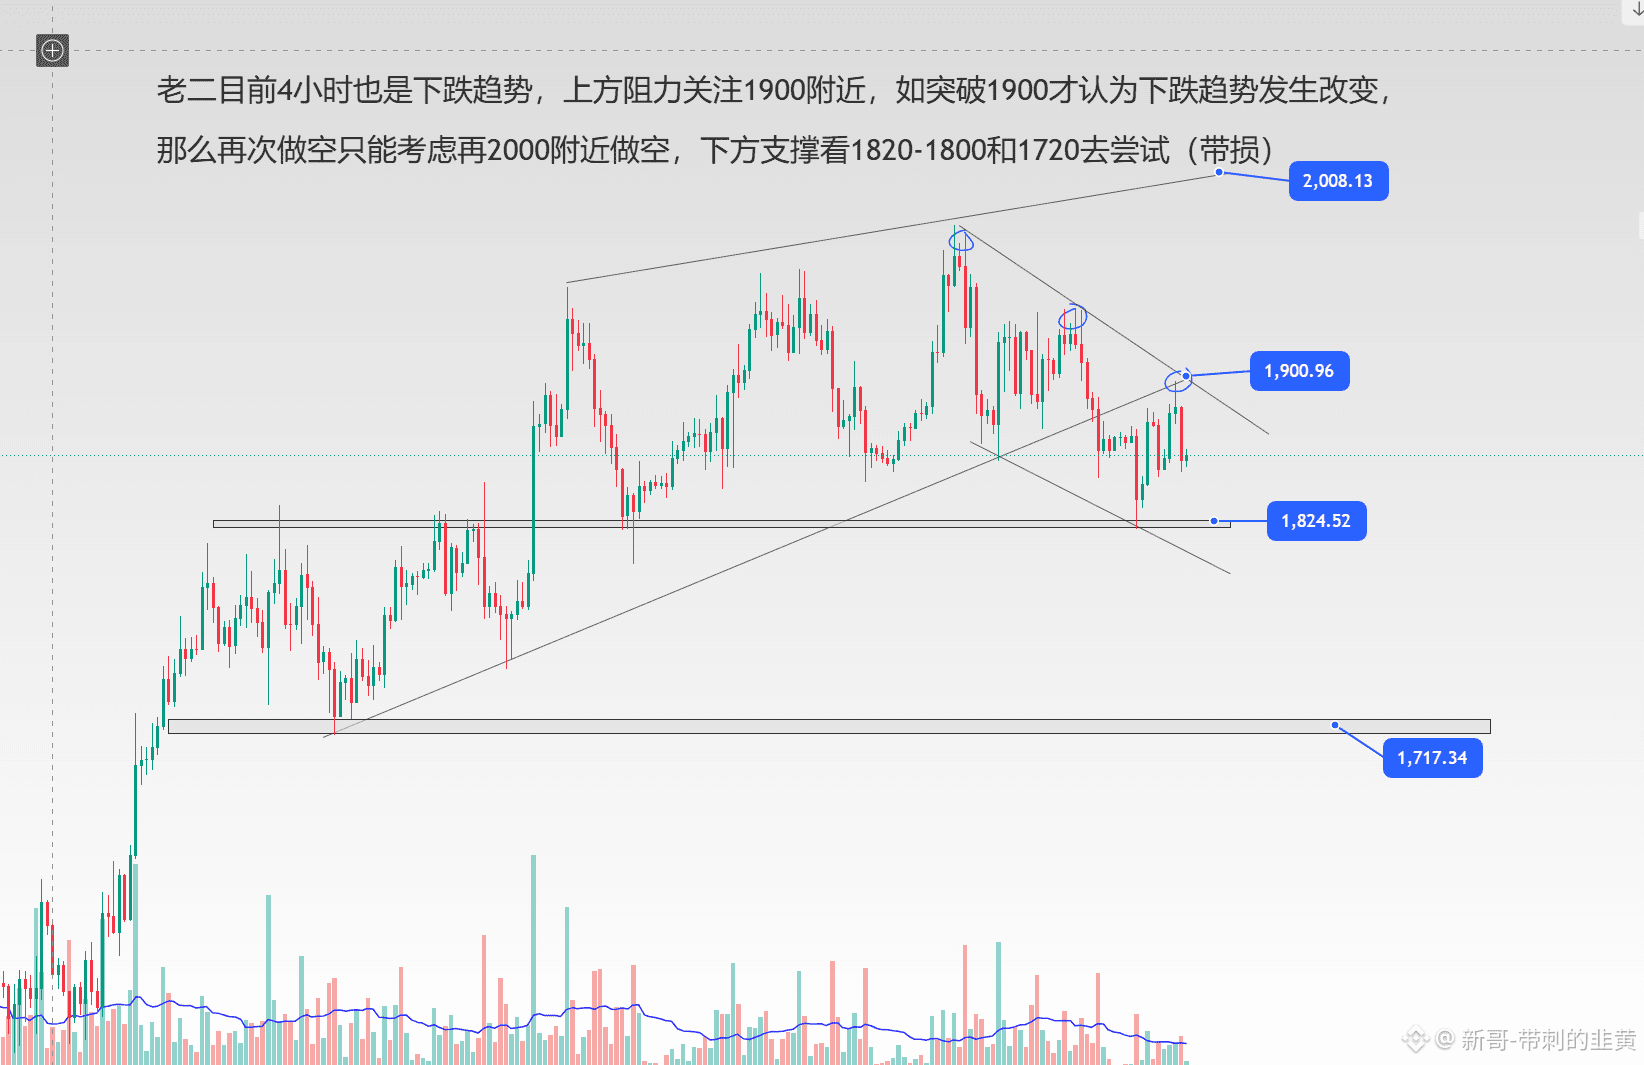
The second guy is currently in a downward trend for the past 4 hours as well. Watch resistance around 1900. Only if it breaks above 1900 can we say the downward trend has changed.
Then, for another short sell, it can only be considered around 2000. For support below, look at 1820-1800 and 1720 to try (with stop-loss) $ETH
Then, for another short sell, it can only be considered around 2000. For support below, look at 1820-1800 and 1720 to try (with stop-loss) $ETH
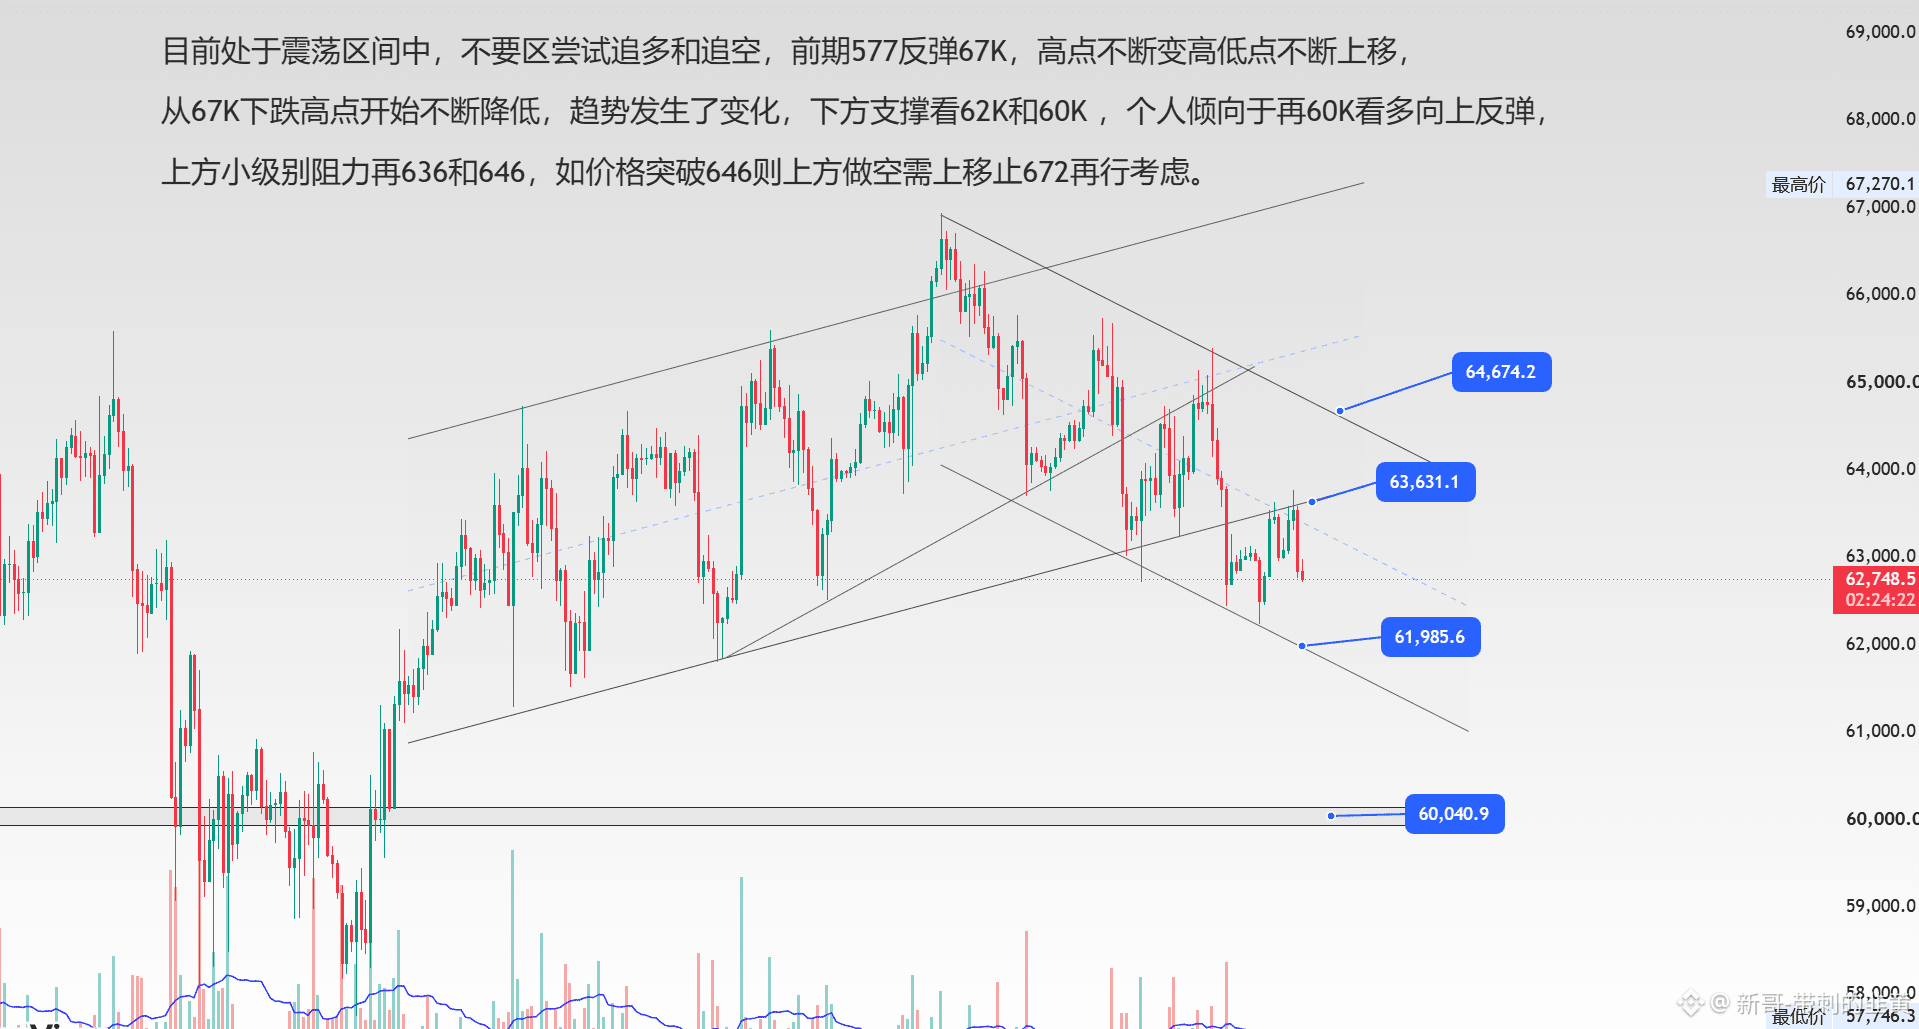
Currently we are in a consolidation/sideways range. Do not try to chase longs or shorts. Earlier, around 57.7K rebounded by 67K; the highs have been moving higher and the lows have been shifting upward.
From the downtrend high after the drop from 67K, it has been continuously lowering, and the trend has changed. The support below is around 62K and 60K. Personally, I lean toward going long again around 60K to rebound upward.
On the upside, the resistance on the smaller time frame is at 636 and 646. If the price breaks above 646, then any short positions from above should have the stop moved up to 672 for consideration again.$BTC
From the downtrend high after the drop from 67K, it has been continuously lowering, and the trend has changed. The support below is around 62K and 60K. Personally, I lean toward going long again around 60K to rebound upward.
On the upside, the resistance on the smaller time frame is at 636 and 646. If the price breaks above 646, then any short positions from above should have the stop moved up to 672 for consideration again.$BTC
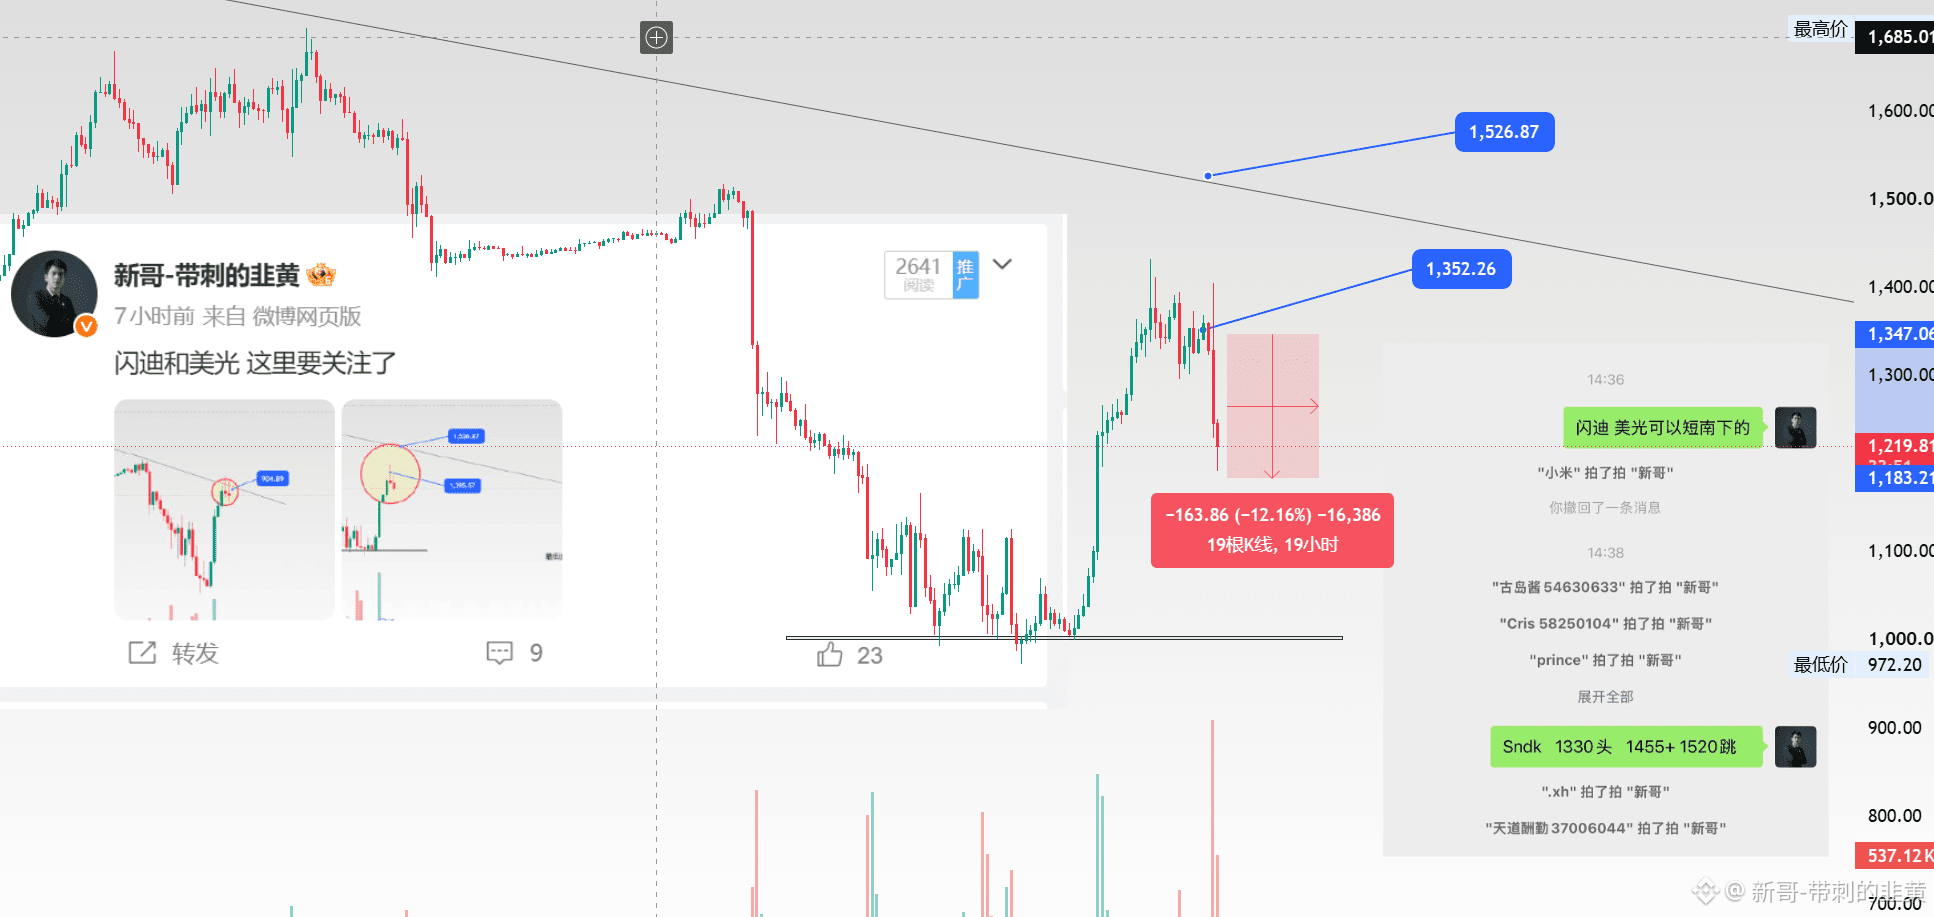
Boss and Number Two, don’t need captions—everyone can understand?
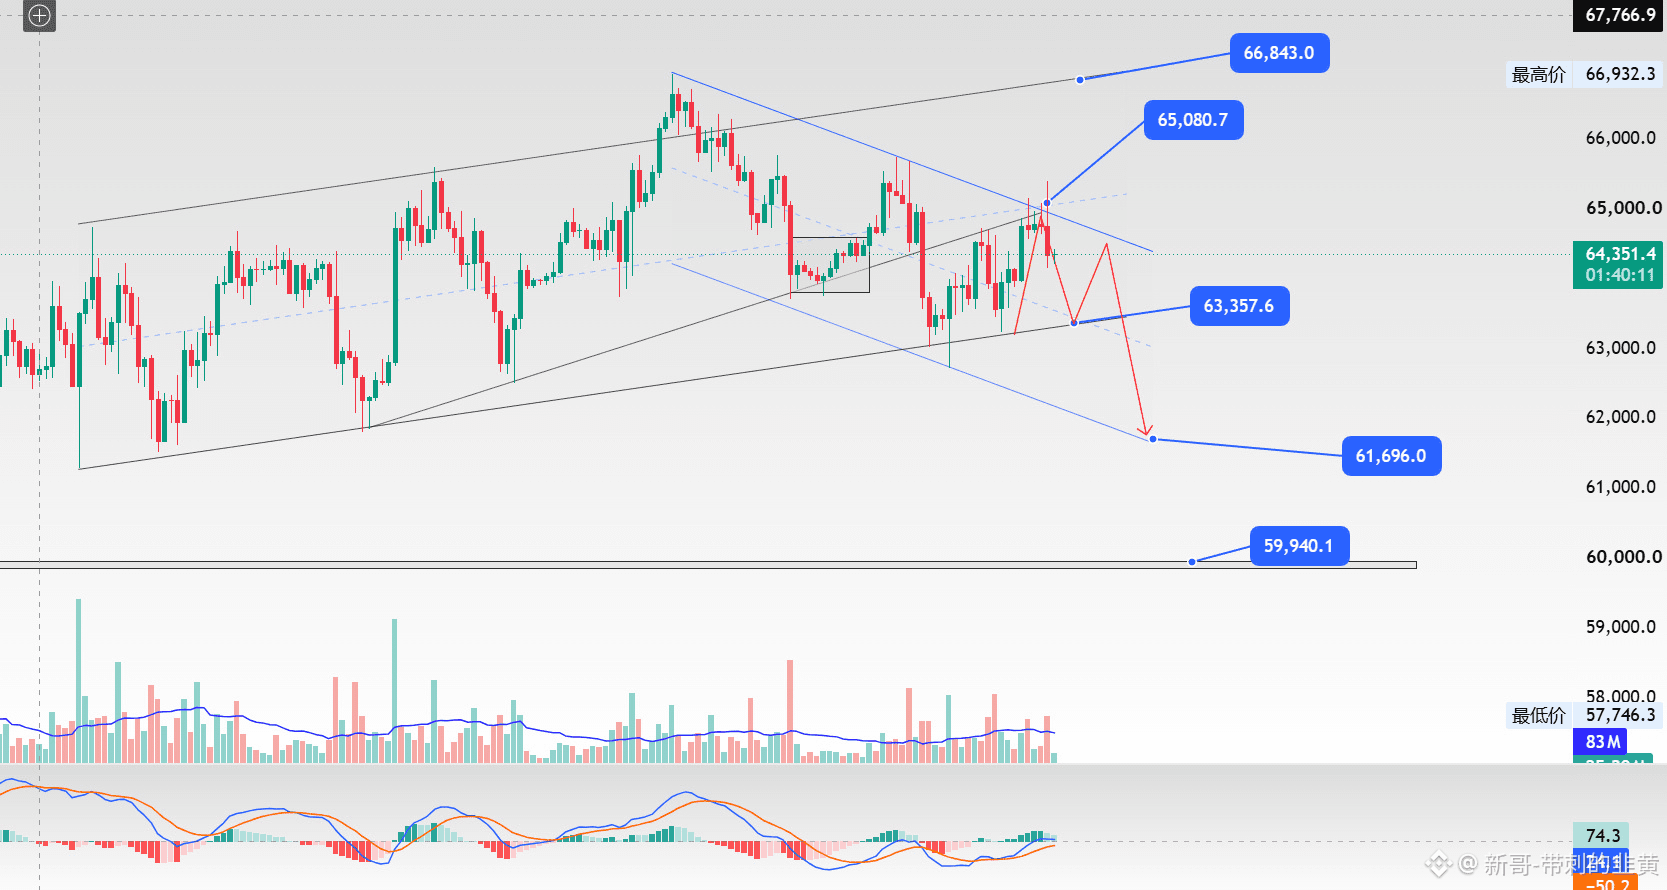
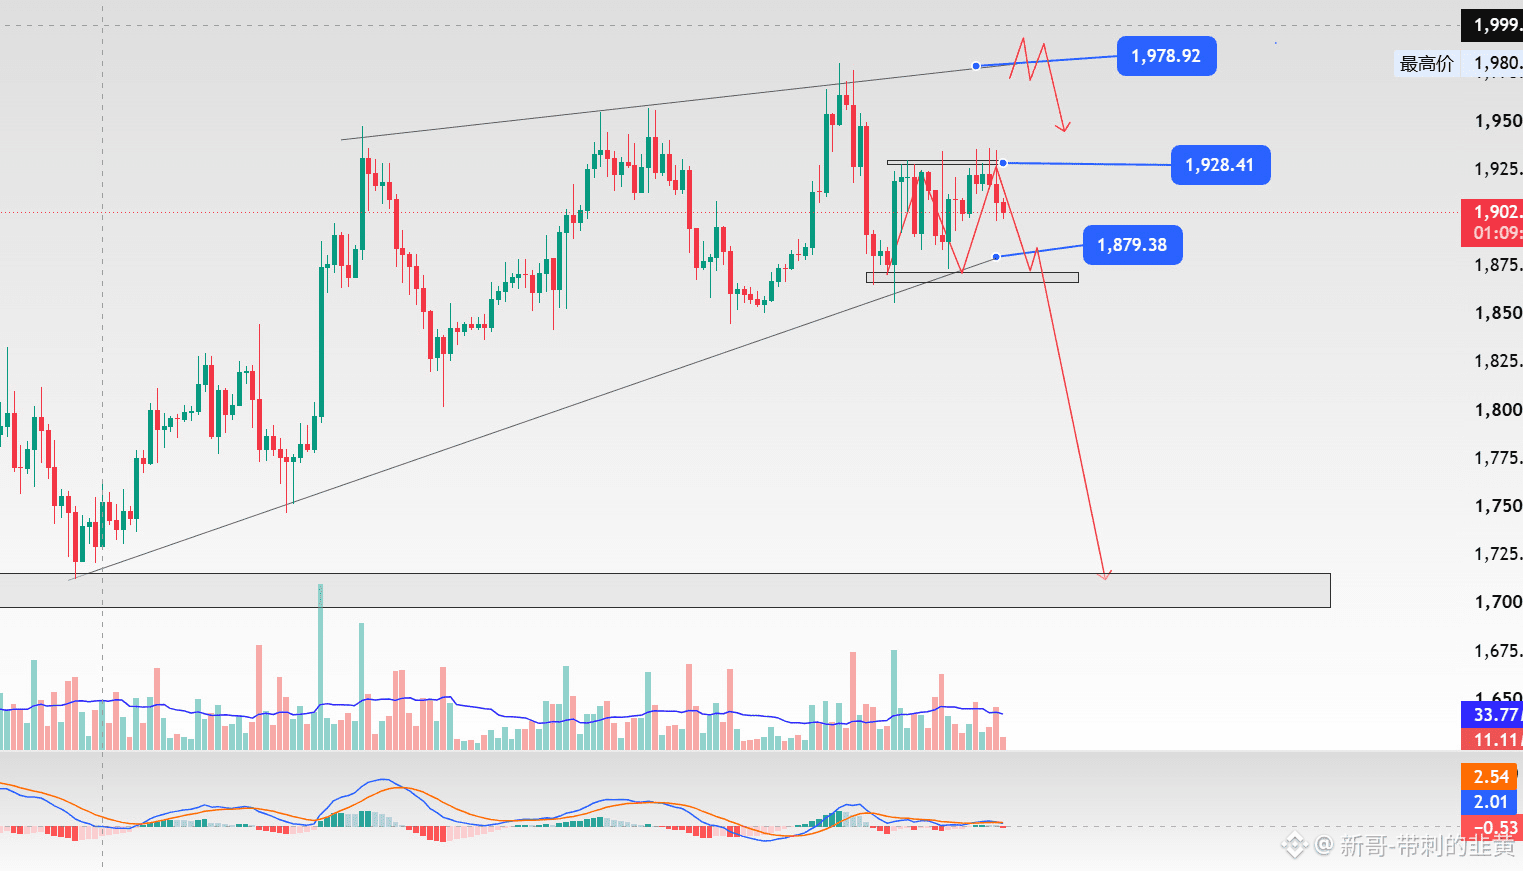
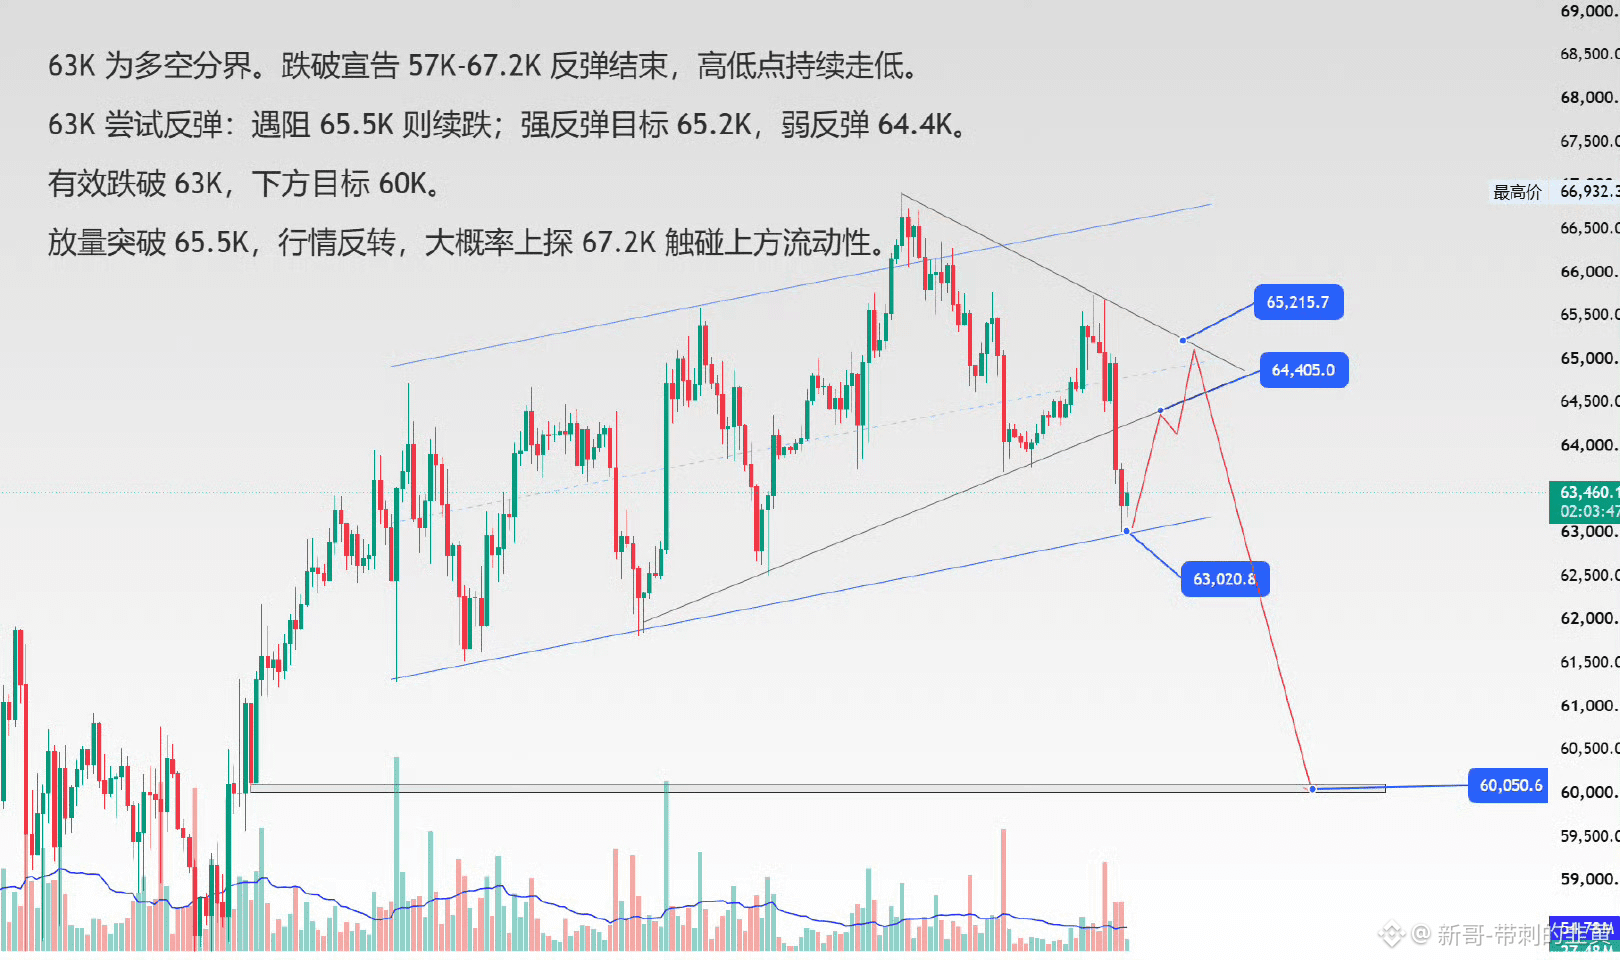
Everyone, look back at the picture from three days ago (63-653).
I want everyone to comment with just two words right now.
I want everyone to comment with just two words right now.
Log in to explore more content