
Crypto_阿冰
118 Posts

Crypto_阿冰
知行合一,止于至善;独立思考,明辨是非。
0 Following
137 Followers
466 Liked
Posts
All
Quotes
Videos
PINNED
Binance Chat Room
Simple to operate, convenient, fast
1️⃣ In the search bar, type 【Chat Room】 to find the entry
2️⃣ Click 【➕】 at the top right
3️⃣ Enter the ID: 1190437679
4️⃣ One-click search 🔍, and become my friend!
Simple to operate, convenient, fast
1️⃣ In the search bar, type 【Chat Room】 to find the entry
2️⃣ Click 【➕】 at the top right
3️⃣ Enter the ID: 1190437679
4️⃣ One-click search 🔍, and become my friend!

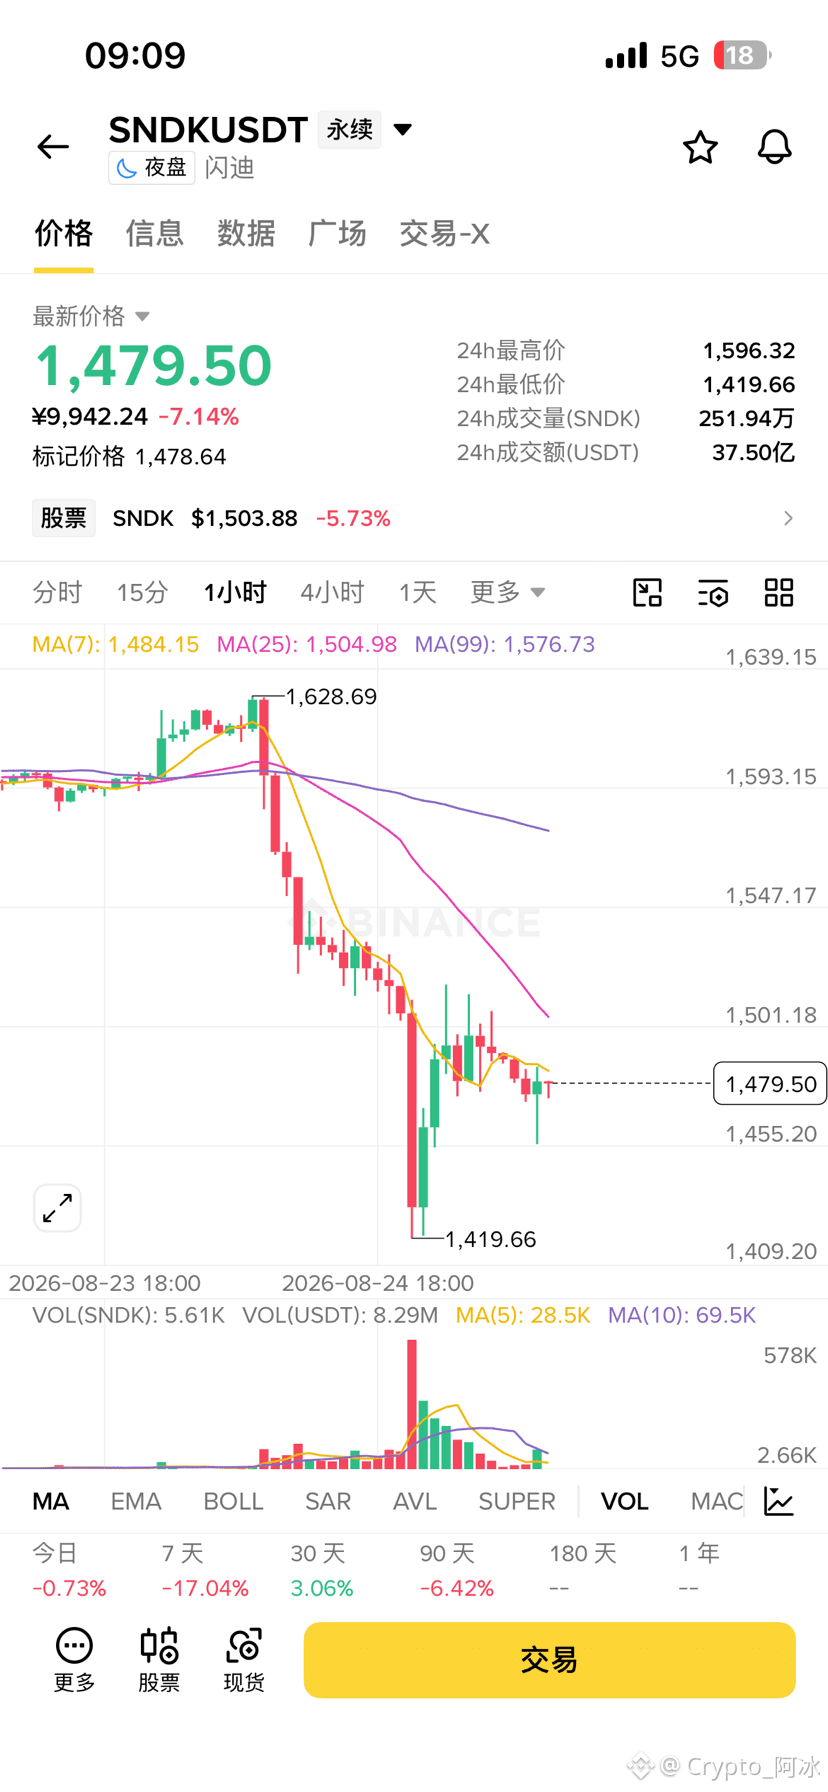
$SNDK :Buy the dip to go long (for a rebound), must strictly set a stop loss.
Key rationale (most convincing):
1. Rely on the life-or-death line: Current price (1477) is right around the key support 1478. As long as it has not effectively broken down, the bulls have the advantage.
2. Oversold mean reversion: The earlier panic selling has already been released. The price is far below the valuation center of 1807, so there is upward correction momentum.
3. Defensive strategy: If it breaks below 1450, the support fails. Then you must cut losses decisively and flip to look short.
“Foolproof” key price levels:
· Entry: Go long after stabilizing between 1478–1500.
· Targets: First take-profit at 1560, second take-profit at 1650.
· Stop loss: Unconditionally cut if it breaks below 1450 (or 1440).
· Avoid pitfalls: Note that the current price is at a premium versus the U.S. stock spot; watch for a premium reversion (to prevent getting stuck in a loss)
#美国财政部将回购上限翻倍至40亿美元
Key rationale (most convincing):
1. Rely on the life-or-death line: Current price (1477) is right around the key support 1478. As long as it has not effectively broken down, the bulls have the advantage.
2. Oversold mean reversion: The earlier panic selling has already been released. The price is far below the valuation center of 1807, so there is upward correction momentum.
3. Defensive strategy: If it breaks below 1450, the support fails. Then you must cut losses decisively and flip to look short.
“Foolproof” key price levels:
· Entry: Go long after stabilizing between 1478–1500.
· Targets: First take-profit at 1560, second take-profit at 1650.
· Stop loss: Unconditionally cut if it breaks below 1450 (or 1440).
· Avoid pitfalls: Note that the current price is at a premium versus the U.S. stock spot; watch for a premium reversion (to prevent getting stuck in a loss)
#美国财政部将回购上限翻倍至40亿美元
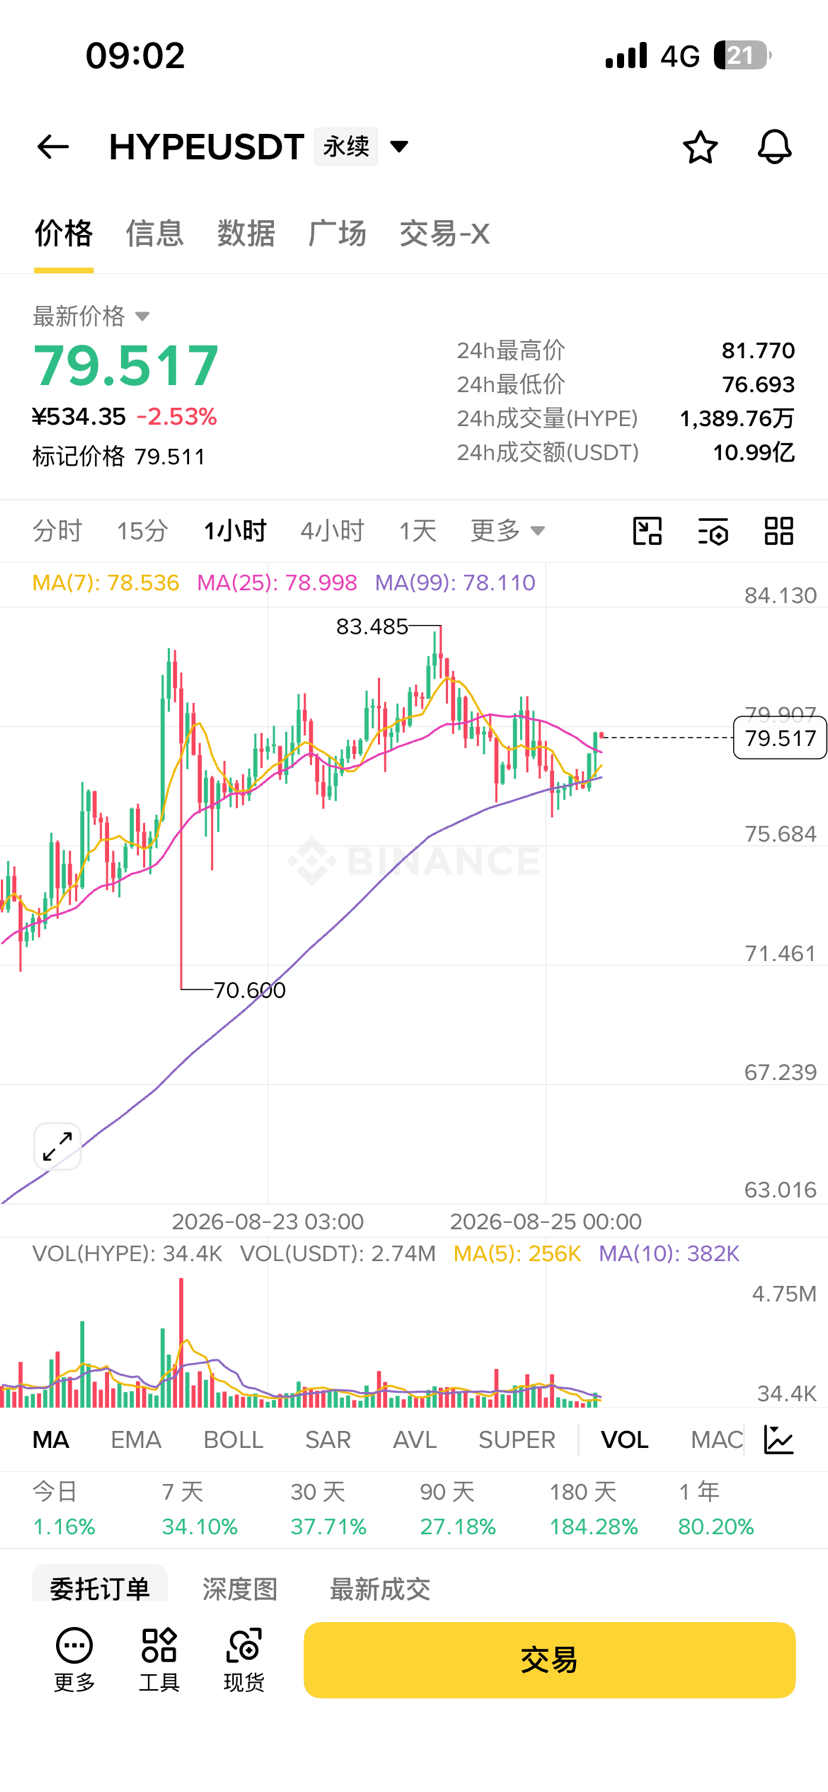
$HYPE After callback, focus mainly on either longer or short “high-level trial and air” setups, and the risk of chasing the rally is relatively high.
Currently, HYPE is in a high-level consolidation phase. Due to excessive futures positioning being crowded, there may be a violent shakeout in the short term.
📊 Key rationale
· Long-side crowding cools and profit-taking appears: the funding rate has dropped by 51.8% within three days, and there are also large sell orders of $58 million posted (mainly in the $92–$100 range) in preparation for unloading at high levels. Although the largest on-chain long is still up by more than $56.5 million, it has already paid $5.03 million in funding fees, and its cost basis is being continuously eroded.
· Weekly momentum divergence: price broke above $83 to set a new high, but the RSI level is lower than it was in the previous uptrend, indicating that the rally momentum is already weakening.
· Previous setback and good news being digested: profits were given back as price moved between $83–$84, leading to a rejection of further upside attempts. In addition, the surge on August 19 driven by a White House compliance-related positive news may have already consumed too much of the longs’ strength.
⚠️ Risk factors
· Institutional shorting: Wintermute currently holds roughly $5.7 million worth of HYPE short exposure. As a top market maker, its actions are an important reference point for market risk appetite.
· Shakeout risk: high-level consolidation accompanied by a surge in open contracts makes it easy to trigger concentrated long liquidation. Pay close attention to whether $77–$78 (break of support) holds effectively. If it breaks, be prepared for further pullback; to the upside, you need to see price discovery only if it can hold above $84.
#美国财政部将回购上限翻倍至40亿美元
Currently, HYPE is in a high-level consolidation phase. Due to excessive futures positioning being crowded, there may be a violent shakeout in the short term.
📊 Key rationale
· Long-side crowding cools and profit-taking appears: the funding rate has dropped by 51.8% within three days, and there are also large sell orders of $58 million posted (mainly in the $92–$100 range) in preparation for unloading at high levels. Although the largest on-chain long is still up by more than $56.5 million, it has already paid $5.03 million in funding fees, and its cost basis is being continuously eroded.
· Weekly momentum divergence: price broke above $83 to set a new high, but the RSI level is lower than it was in the previous uptrend, indicating that the rally momentum is already weakening.
· Previous setback and good news being digested: profits were given back as price moved between $83–$84, leading to a rejection of further upside attempts. In addition, the surge on August 19 driven by a White House compliance-related positive news may have already consumed too much of the longs’ strength.
⚠️ Risk factors
· Institutional shorting: Wintermute currently holds roughly $5.7 million worth of HYPE short exposure. As a top market maker, its actions are an important reference point for market risk appetite.
· Shakeout risk: high-level consolidation accompanied by a surge in open contracts makes it easy to trigger concentrated long liquidation. Pay close attention to whether $77–$78 (break of support) holds effectively. If it breaks, be prepared for further pullback; to the upside, you need to see price discovery only if it can hold above $84.
#美国财政部将回购上限翻倍至40亿美元
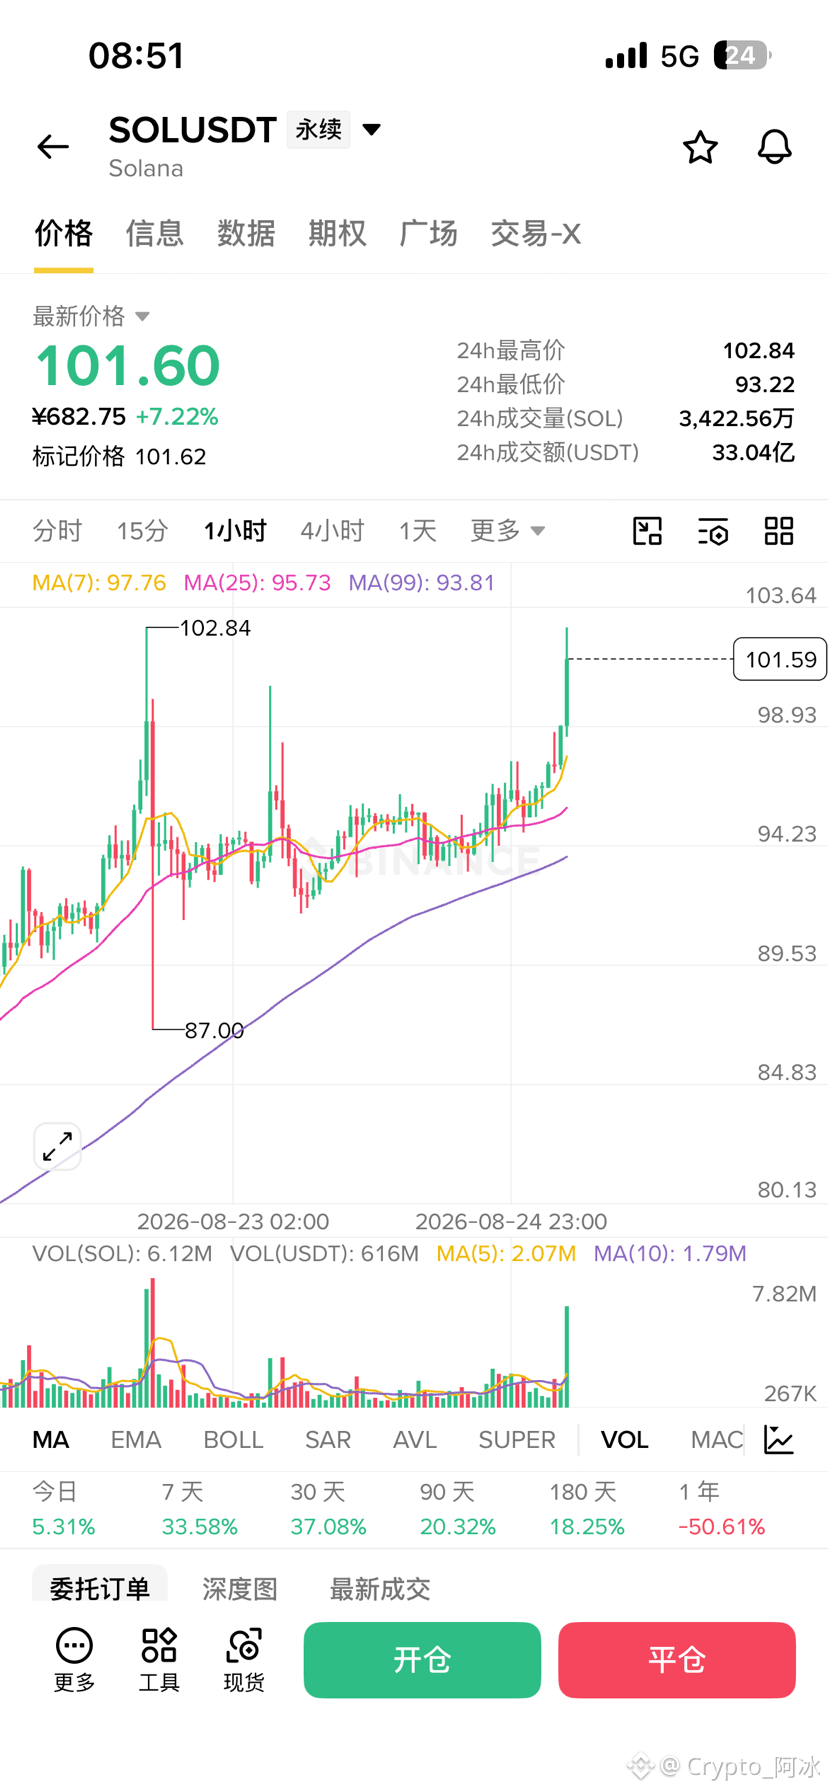
$SOL : Buy on dips.
The price has just broken through the recent high, and the overall trend shows a bullish alignment.
📊 Order Direction and Rationale
· Technical breakout: The 1-hour K-line surged with increased volume, and the MACD histogram expanded; a consolidation/holding area formed around 96.3.
· Funding/positioning structure: The funding rate is only about 0.0029%, suggesting that the longs are not excessively crowded, with room for further upside.
· Whales’ behavior: Professional institutions such as Wintermute opened a short position on SOL of around $17.63 million, indicating cautious sentiment.
· Fundamental data: Last week’s app revenue reached $35 million, a new high over 29 weeks, and the ecosystem’s outlook has improved.
⚠️ Risk Warning
· Counter-trend short signal: Since Wintermute has actively built short positions at higher levels, the market at highs may face selling pressure. Additionally, although the long-account share is about 72.7%, indicating strong retail bullish sentiment, larger capital (institutions) seems more cautious. Therefore, going long has a higher probability, but be wary of potential pullback risk.
· Trading advice: Futures/contract trading is extremely volatile—keep position sizing under control and consider using a small position or a per-lot/isolated margin mode. Focus on support near $96 below; if it breaks down on increased volume, you must strictly follow the stop-loss.
#比特币周涨23.6%
The price has just broken through the recent high, and the overall trend shows a bullish alignment.
📊 Order Direction and Rationale
· Technical breakout: The 1-hour K-line surged with increased volume, and the MACD histogram expanded; a consolidation/holding area formed around 96.3.
· Funding/positioning structure: The funding rate is only about 0.0029%, suggesting that the longs are not excessively crowded, with room for further upside.
· Whales’ behavior: Professional institutions such as Wintermute opened a short position on SOL of around $17.63 million, indicating cautious sentiment.
· Fundamental data: Last week’s app revenue reached $35 million, a new high over 29 weeks, and the ecosystem’s outlook has improved.
⚠️ Risk Warning
· Counter-trend short signal: Since Wintermute has actively built short positions at higher levels, the market at highs may face selling pressure. Additionally, although the long-account share is about 72.7%, indicating strong retail bullish sentiment, larger capital (institutions) seems more cautious. Therefore, going long has a higher probability, but be wary of potential pullback risk.
· Trading advice: Futures/contract trading is extremely volatile—keep position sizing under control and consider using a small position or a per-lot/isolated margin mode. Focus on support near $96 below; if it breaks down on increased volume, you must strictly follow the stop-loss.
#比特币周涨23.6%
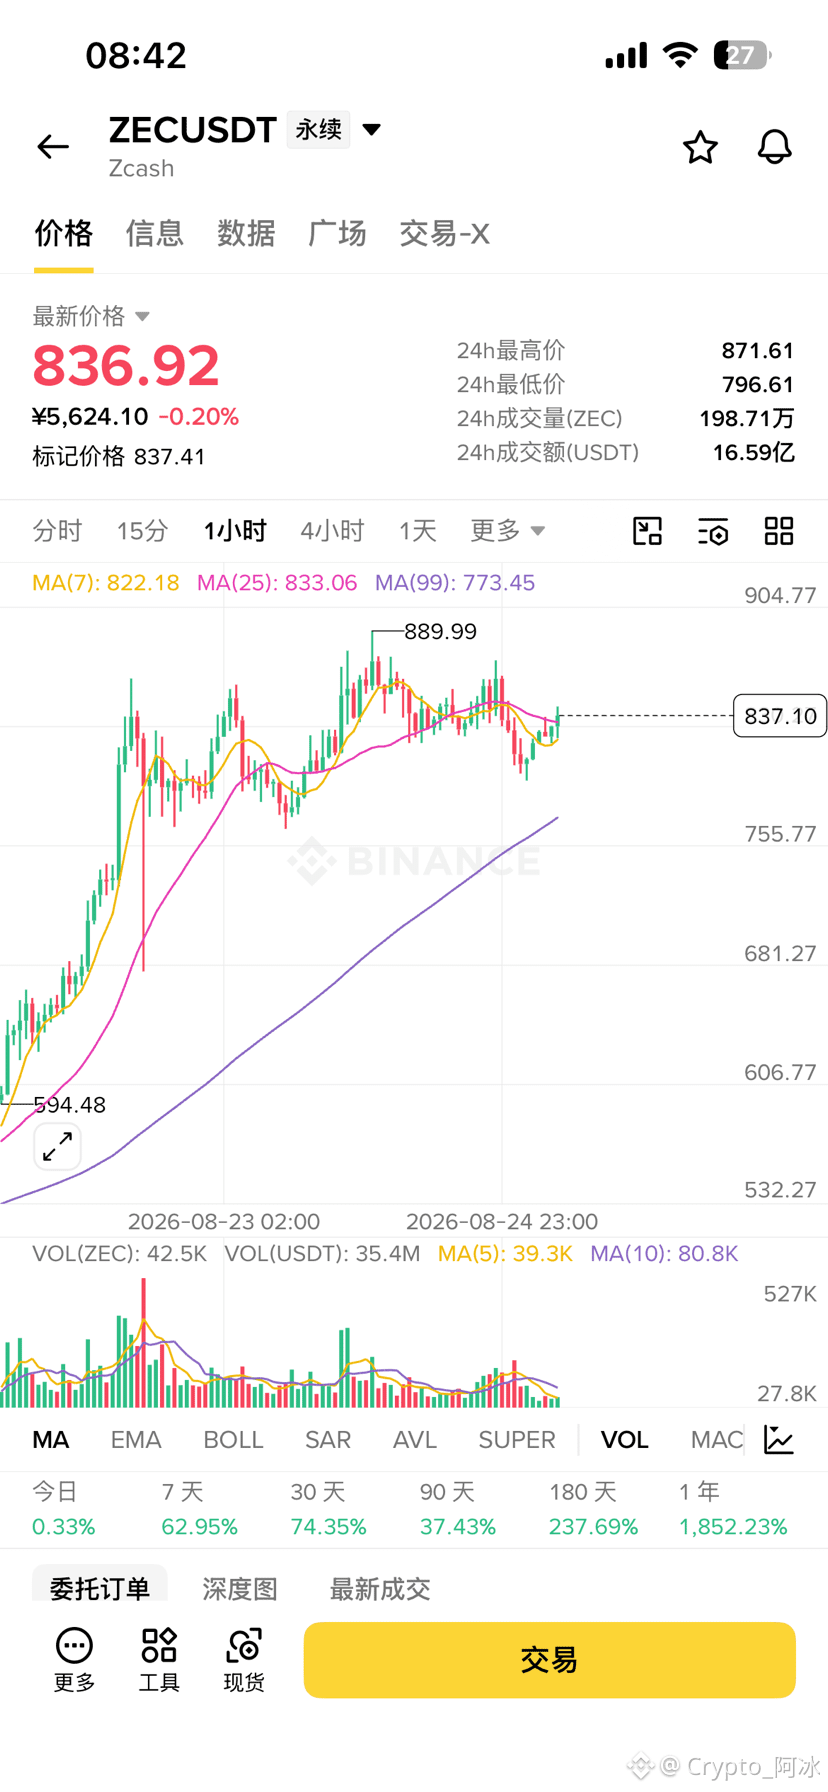
$ZEC Buy the dips on strength!
This is mainly based on the strong bullish momentum and support from expectations of Grayscale ETF capital inflows. As long as the price can hold above the key support level of $800, it will likely continue to rebound toward the $900 range and higher.
📈 Price Action and Key Rationale
· Technical Resistance: Volume remains in high-level consolidation within the 810–885 range (the high reached 888). 850–870 is a strong resistance zone. Consider buying in the 836–847 area. If price pushes up to 900, the target zone can be 906–942, with a stop-loss set at 799.
· Fundamental Positives: Bullish momentum is 100/100, in an extremely strong state. The Grayscale (ZEC) spot ETF has driven a bullish triangle formation. DCG plans to deploy about 200,000 ZEC, providing a strong catalyst.
· Capital Support: Leveraged positioning is active. Open interest has risen from 960 million to $1.8 billion. The positive funding rate suggests a strong market “queueing up” atmosphere, which can easily trigger a short squeeze.
⚠️ Key Risks and Trading Notes
· Support Levels and Stop-Loss: If the daily closing price falls below the pivot zone of 800–820, it indicates the breakout has failed. In that case, it’s recommended to cut losses immediately. At that time, it’s neither long nor short—direction will likely turn downward to test the lows around $760, even down to $700.
· Risk Warning: The current short-term rally has been too large. The RSI is in overbought territory, and futures leverage is relatively heavy. When going long, make sure to control position size to avoid getting shaken out at high levels—try not to go all-in.
#ZECUSDT
This is mainly based on the strong bullish momentum and support from expectations of Grayscale ETF capital inflows. As long as the price can hold above the key support level of $800, it will likely continue to rebound toward the $900 range and higher.
📈 Price Action and Key Rationale
· Technical Resistance: Volume remains in high-level consolidation within the 810–885 range (the high reached 888). 850–870 is a strong resistance zone. Consider buying in the 836–847 area. If price pushes up to 900, the target zone can be 906–942, with a stop-loss set at 799.
· Fundamental Positives: Bullish momentum is 100/100, in an extremely strong state. The Grayscale (ZEC) spot ETF has driven a bullish triangle formation. DCG plans to deploy about 200,000 ZEC, providing a strong catalyst.
· Capital Support: Leveraged positioning is active. Open interest has risen from 960 million to $1.8 billion. The positive funding rate suggests a strong market “queueing up” atmosphere, which can easily trigger a short squeeze.
⚠️ Key Risks and Trading Notes
· Support Levels and Stop-Loss: If the daily closing price falls below the pivot zone of 800–820, it indicates the breakout has failed. In that case, it’s recommended to cut losses immediately. At that time, it’s neither long nor short—direction will likely turn downward to test the lows around $760, even down to $700.
· Risk Warning: The current short-term rally has been too large. The RSI is in overbought territory, and futures leverage is relatively heavy. When going long, make sure to control position size to avoid getting shaken out at high levels—try not to go all-in.
#ZECUSDT
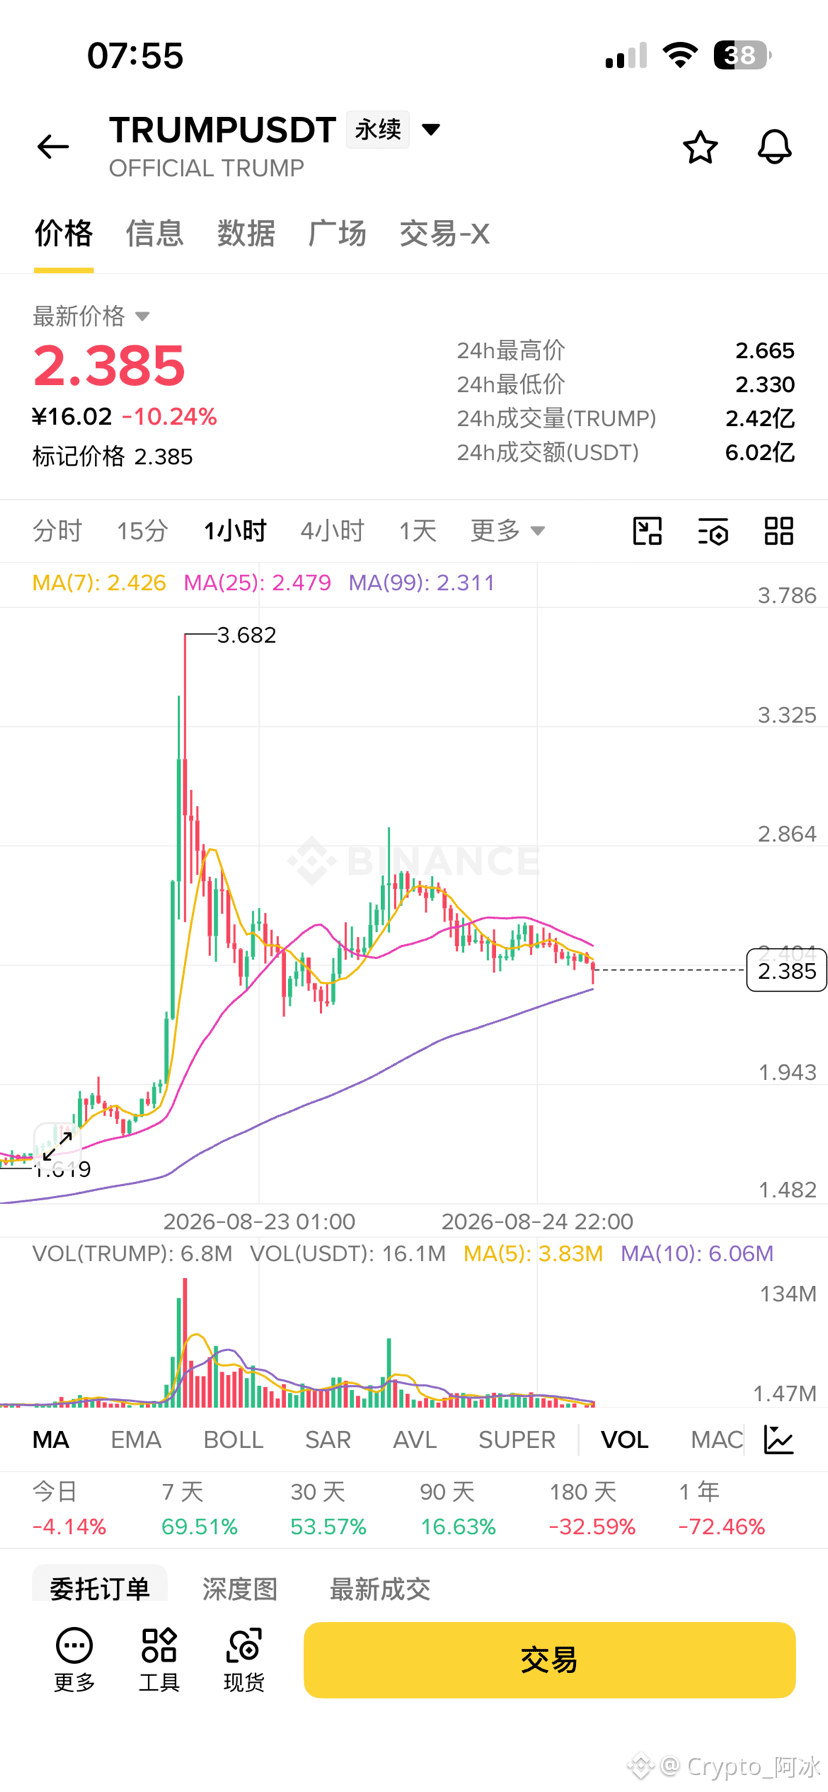
$TRUMP :Enter the Void
Core Basis
I. Technical Factors (1-hour K-line)
1. Key highs and the moving-average system impose strong resistance
TRUMP’s current price is 2.388. It has clearly fallen below MA5 (2.420), MA10 (2.444), and MA20 (2.463). The moving averages are also arranged in a bearish order (short-term MAs below long-term MAs). The previous blow-off top at 3.684 formed a massive trapped order book. Any rebound fails to break to new highs. The 2.420–2.463 range has shifted from support to strong resistance, with heavy sell pressure above.
2. The sentiment from the “pig-butchering scheme” fades; profit-taking pressure increases
Based on the top news: “Trump’s ‘pig-butchering scheme’ guide: rumor pump, massive dump, father-and-son clarify rumors,” this Meme coin has already gone through the most brutal phase of hype. It is now in the stage where good news has been exhausted and sentiment is cooling down. Long-side confidence has been severely shaken. On the market, profit-takers and bargain-buyers are strongly inclined to cut losses. Under the suppression of these negative headlines, any rebound will attract selling, and the downtrend is likely to continue.
3. Trading volume contracts; momentum severely exhausts
Compared with the earlier blow-off phase’s sky-high volume (large green bars on the left side), during the current right-side decline, rebound volume has shrunk to the extreme, and the price keeps drifting downward without stopping. This is a typical “low-volume, sluggish sell-off,” indicating that there is no incremental capital willing to enter and support the market. Relying only on existing liquidity cannot reverse the deterioration; the price will most likely continue downward to test support.
⚠️ Trading Suggestions (Risk Warning):
Focus on shorting in line with the trend. Defensive level for short positions can be placed above MA20 (2.463). If there is a breakout with increased volume, a stop-loss is required. The first target below is the 24-hour low at 2.346; if that level breaks, then look toward the 2.300 area.
#标普500期货下跌
Core Basis
I. Technical Factors (1-hour K-line)
1. Key highs and the moving-average system impose strong resistance
TRUMP’s current price is 2.388. It has clearly fallen below MA5 (2.420), MA10 (2.444), and MA20 (2.463). The moving averages are also arranged in a bearish order (short-term MAs below long-term MAs). The previous blow-off top at 3.684 formed a massive trapped order book. Any rebound fails to break to new highs. The 2.420–2.463 range has shifted from support to strong resistance, with heavy sell pressure above.
2. The sentiment from the “pig-butchering scheme” fades; profit-taking pressure increases
Based on the top news: “Trump’s ‘pig-butchering scheme’ guide: rumor pump, massive dump, father-and-son clarify rumors,” this Meme coin has already gone through the most brutal phase of hype. It is now in the stage where good news has been exhausted and sentiment is cooling down. Long-side confidence has been severely shaken. On the market, profit-takers and bargain-buyers are strongly inclined to cut losses. Under the suppression of these negative headlines, any rebound will attract selling, and the downtrend is likely to continue.
3. Trading volume contracts; momentum severely exhausts
Compared with the earlier blow-off phase’s sky-high volume (large green bars on the left side), during the current right-side decline, rebound volume has shrunk to the extreme, and the price keeps drifting downward without stopping. This is a typical “low-volume, sluggish sell-off,” indicating that there is no incremental capital willing to enter and support the market. Relying only on existing liquidity cannot reverse the deterioration; the price will most likely continue downward to test support.
⚠️ Trading Suggestions (Risk Warning):
Focus on shorting in line with the trend. Defensive level for short positions can be placed above MA20 (2.463). If there is a breakout with increased volume, a stop-loss is required. The first target below is the 24-hour low at 2.346; if that level breaks, then look toward the 2.300 area.
#标普500期货下跌
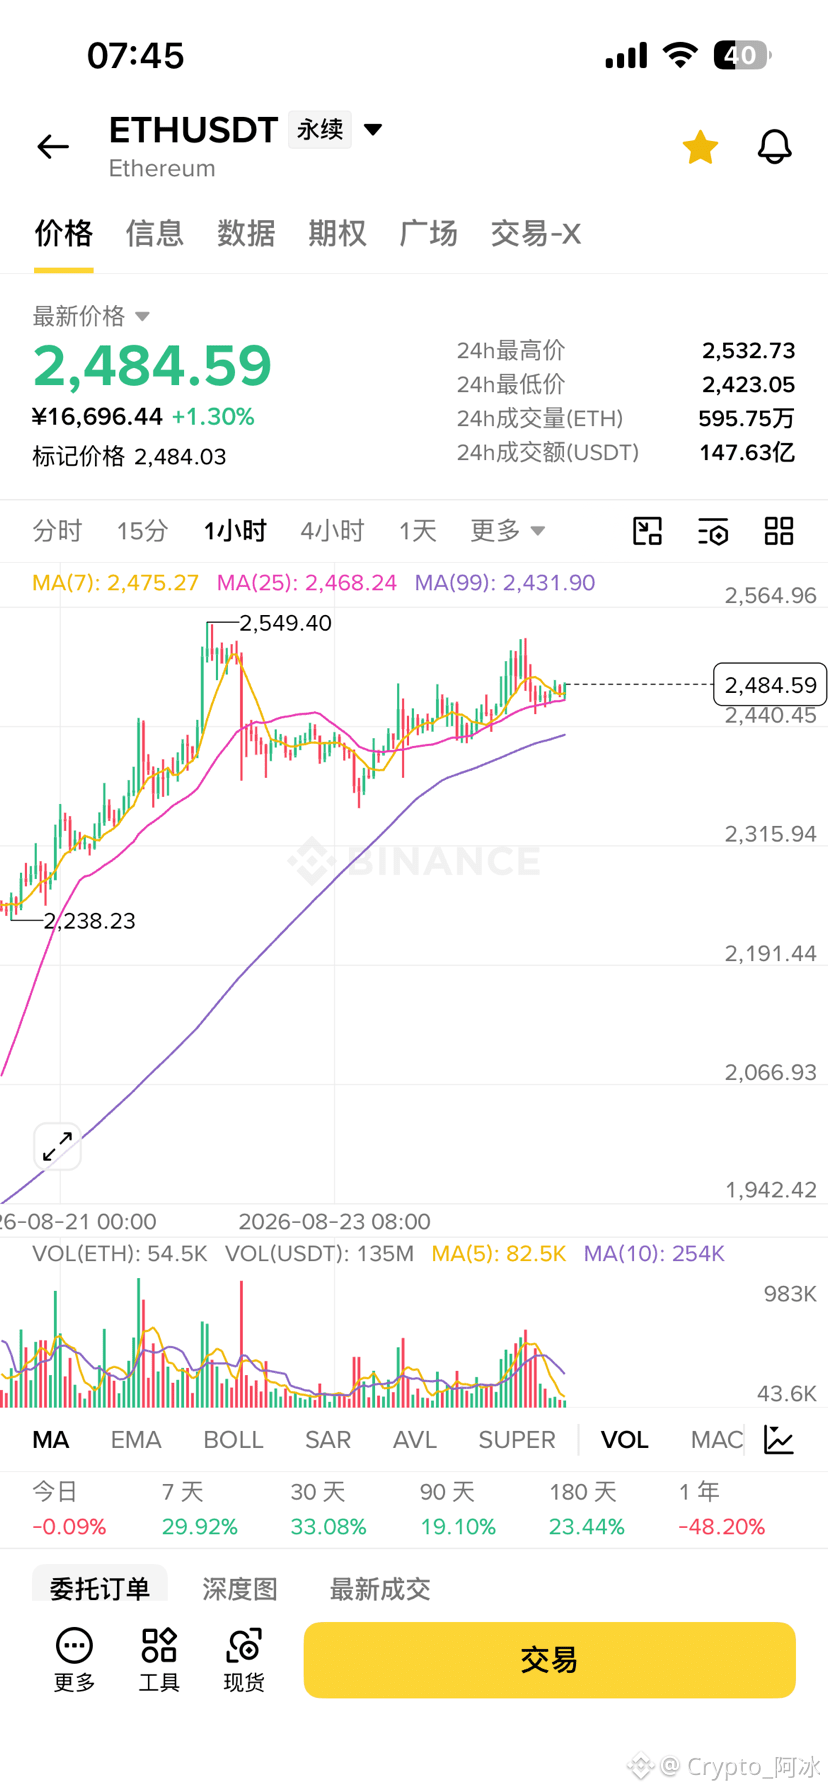
$ETH :Buy on the rebound (go long)
Key rationale
1. Technical indicators (15-minute candlesticks)
1) Key moving averages provide strong support at the bottom
ETH’s current price is 2485.77. The price is firmly holding above MA5 (2478.80), MA10 (2479.71), and MA20 (2476.22), and short-term moving averages are showing a bullish alignment. MA20 around 2476 forms a clear dynamic support zone, and the downside room for the short term has been effectively sealed off.
2) Bottoming structure rising confirms the exhaustion of bearish momentum
After a clear rebound with increased volume from the 24-hour low of 2423.00, the second pullback’s low has risen to around 2460 and did not break the previous low. This indicates that bearish selling pressure has been fully released. Bulls show strong willingness to absorb at low levels and are forming a typical stabilization-and-rebound pattern.
3) Tight volume consolidation; downside selling momentum is drying up
During the earlier sharp drop, volume expanded, and then the right-side rebound followed with momentum. Currently, the market is entering a phase of reduced-volume consolidation, suggesting that the selling pressure from trapped higher-level positions and short-term profit-taking has already eased. In the absence of new bearish capital dumping, price is likely to consolidate and then break upward through the 2500 psychological level (first resistance).
Special reminder: This is a rebound repair move within a downtrend. For short-term longs, you must set a strict stop-loss below the dense moving-average area (e.g., below 2472). For take-profit, the first target is 2500; the second target is around 2520. When resistance is reached, reduce positions promptly to lock in gains.
#以太坊ETF周净流入6.97亿美元
Key rationale
1. Technical indicators (15-minute candlesticks)
1) Key moving averages provide strong support at the bottom
ETH’s current price is 2485.77. The price is firmly holding above MA5 (2478.80), MA10 (2479.71), and MA20 (2476.22), and short-term moving averages are showing a bullish alignment. MA20 around 2476 forms a clear dynamic support zone, and the downside room for the short term has been effectively sealed off.
2) Bottoming structure rising confirms the exhaustion of bearish momentum
After a clear rebound with increased volume from the 24-hour low of 2423.00, the second pullback’s low has risen to around 2460 and did not break the previous low. This indicates that bearish selling pressure has been fully released. Bulls show strong willingness to absorb at low levels and are forming a typical stabilization-and-rebound pattern.
3) Tight volume consolidation; downside selling momentum is drying up
During the earlier sharp drop, volume expanded, and then the right-side rebound followed with momentum. Currently, the market is entering a phase of reduced-volume consolidation, suggesting that the selling pressure from trapped higher-level positions and short-term profit-taking has already eased. In the absence of new bearish capital dumping, price is likely to consolidate and then break upward through the 2500 psychological level (first resistance).
Special reminder: This is a rebound repair move within a downtrend. For short-term longs, you must set a strict stop-loss below the dense moving-average area (e.g., below 2472). For take-profit, the first target is 2500; the second target is around 2520. When resistance is reached, reduce positions promptly to lock in gains.
#以太坊ETF周净流入6.97亿美元
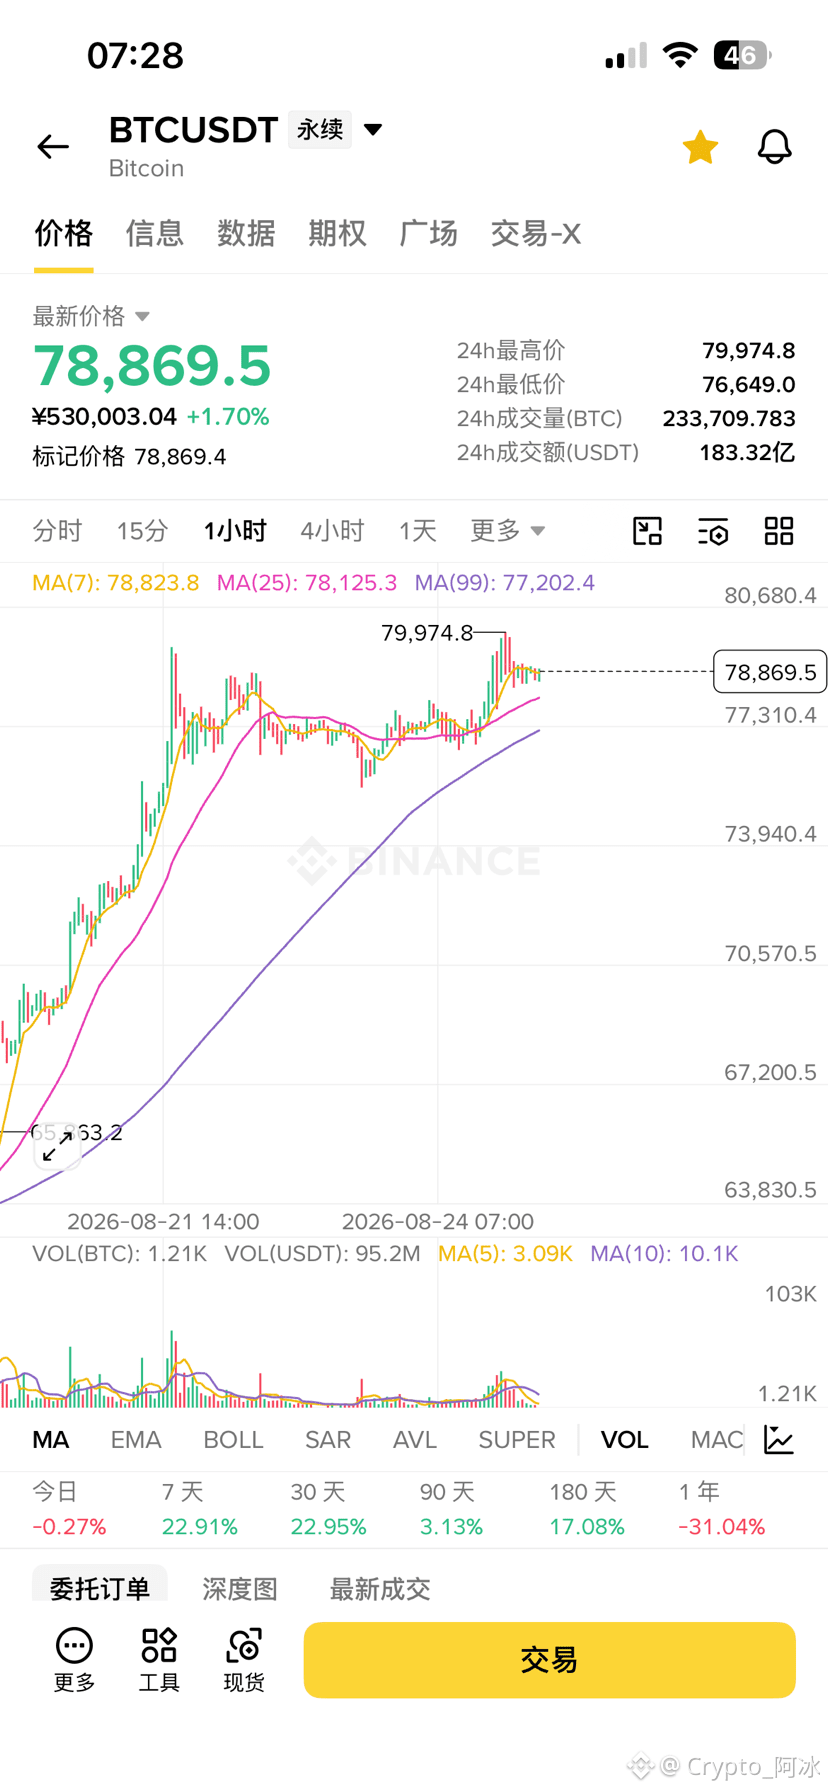
$BTC : Selling short
Core basis
I. Technical analysis (1-hour K-line)
1. Key high points form strong resistance to pressure
The BTC hourly high point 79974.8 has formed a clear pressure level, while the current price is 78869.5. After pushing toward and around the 80,000 mark, the price failed to continue making new highs, and following a spike it showed sluggish consolidation. The 79,000–80,000 range has accumulated a large number of chase-buying trapped positions. A break upward through resistance would be heavily burdened.
2. Pressure from profit-taking after a round of sharp gains
From the low around 65,000, there was sustained large-scale rally with a huge cumulative rise. Once reaching high price areas, longs have accumulated substantial unrealized profits, and the desire to take profit at the highs has strengthened; selling pressure will continue to weigh on the market. The MA7 short-term moving average has already flattened, the upward slope has slowed, and the offensive strength of the bulls has begun to weaken.
3. Volume fails to keep up with new highs; momentum fades
Price has set a local high, but trading volume has not increased in parallel—this is a volume-price divergence. Without incremental capital entering the market to absorb orders, it is difficult to push prices higher relying only on existing capital. After high-level consolidation, the probability of a pullback increases.
II. Negative news catalyst (U.S. Treasury secondary sanctions)
The U.S. Treasury announced that it will include the digital asset industry within the potential scope of secondary sanctions. This news will suppress market risk sentiment:
1. It will trigger concerns among institutions and some funds about compliance risk, causing some capital to choose to exit and take precautionary measures from high levels;
2. The news is a potentially negative variable. When the market is already in a high-level sluggish phase, negative news is more likely to become the spark that triggers a pullback.
3. High-level sluggishness combined with negative news easily creates a resonance pullback
Technically, the market is already unable to rise further. When external risk news adds pressure, once buy-side momentum dries up, the following will appear: a resonance effect of late-chasing longs cutting losses + long-term profit-taking exiting the market, driving the price to move downward and retest lower levels.
#比特币未平仓合约降至两月低点
Core basis
I. Technical analysis (1-hour K-line)
1. Key high points form strong resistance to pressure
The BTC hourly high point 79974.8 has formed a clear pressure level, while the current price is 78869.5. After pushing toward and around the 80,000 mark, the price failed to continue making new highs, and following a spike it showed sluggish consolidation. The 79,000–80,000 range has accumulated a large number of chase-buying trapped positions. A break upward through resistance would be heavily burdened.
2. Pressure from profit-taking after a round of sharp gains
From the low around 65,000, there was sustained large-scale rally with a huge cumulative rise. Once reaching high price areas, longs have accumulated substantial unrealized profits, and the desire to take profit at the highs has strengthened; selling pressure will continue to weigh on the market. The MA7 short-term moving average has already flattened, the upward slope has slowed, and the offensive strength of the bulls has begun to weaken.
3. Volume fails to keep up with new highs; momentum fades
Price has set a local high, but trading volume has not increased in parallel—this is a volume-price divergence. Without incremental capital entering the market to absorb orders, it is difficult to push prices higher relying only on existing capital. After high-level consolidation, the probability of a pullback increases.
II. Negative news catalyst (U.S. Treasury secondary sanctions)
The U.S. Treasury announced that it will include the digital asset industry within the potential scope of secondary sanctions. This news will suppress market risk sentiment:
1. It will trigger concerns among institutions and some funds about compliance risk, causing some capital to choose to exit and take precautionary measures from high levels;
2. The news is a potentially negative variable. When the market is already in a high-level sluggish phase, negative news is more likely to become the spark that triggers a pullback.
3. High-level sluggishness combined with negative news easily creates a resonance pullback
Technically, the market is already unable to rise further. When external risk news adds pressure, once buy-side momentum dries up, the following will appear: a resonance effect of late-chasing longs cutting losses + long-term profit-taking exiting the market, driving the price to move downward and retest lower levels.
#比特币未平仓合约降至两月低点

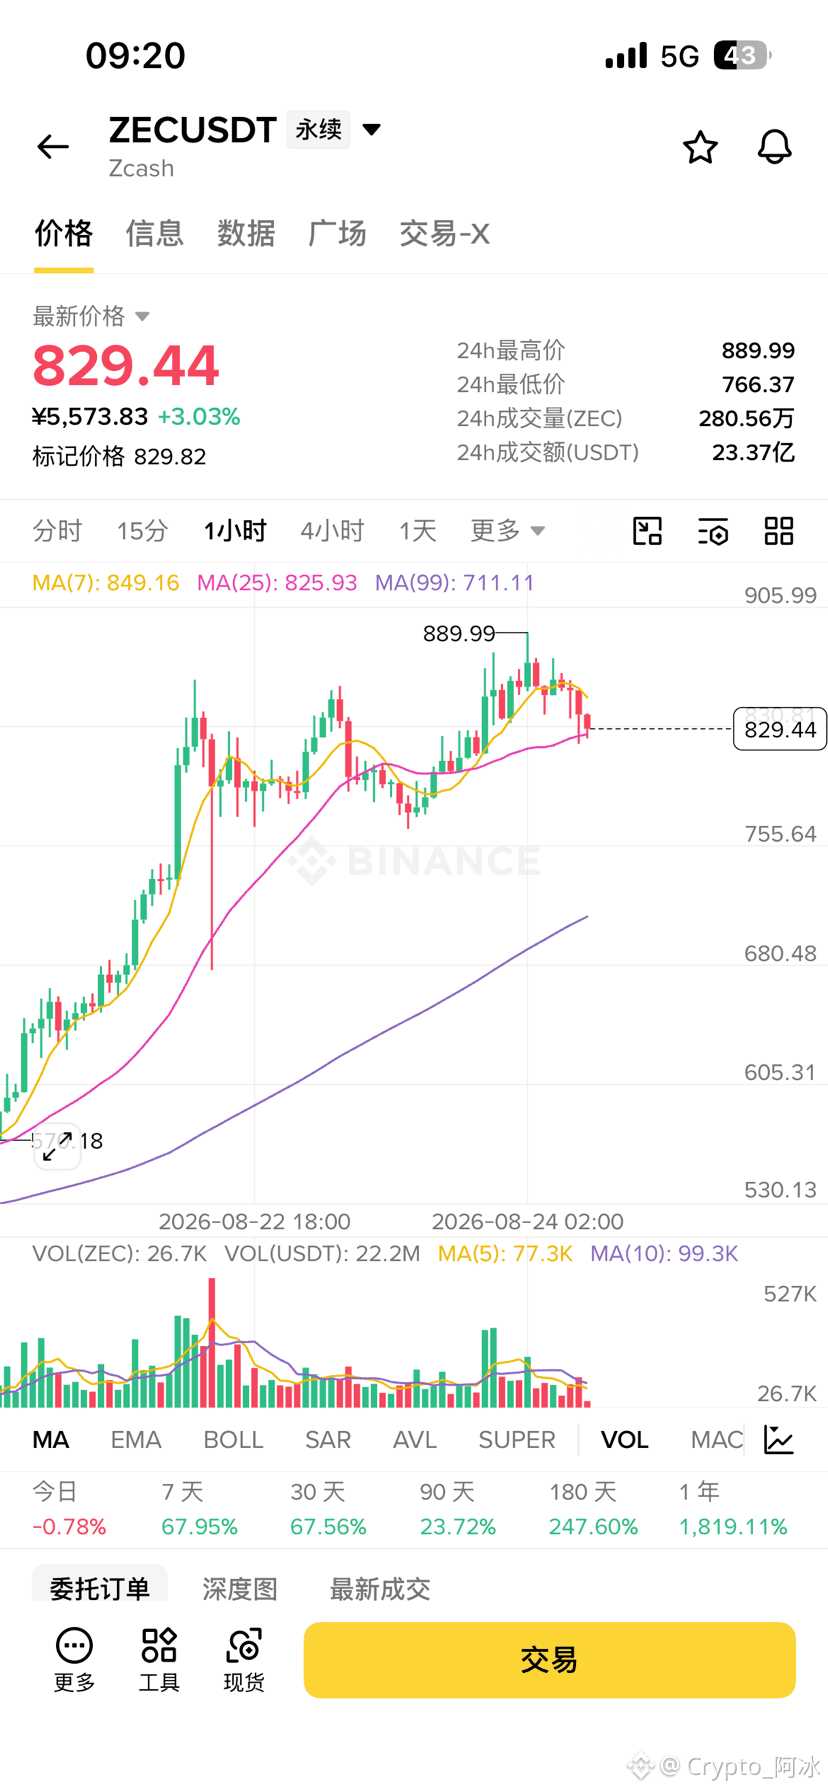
Direction $ZEC : Look back for the callback (empty)
Core logic reasons
1. The upper strong pressure zone is suppressing
On the ZEC 15-minute chart, the early-session high at 889.20 forms a key resistance level; the current price is 828.90. The 845–889 range is a dense sell-off zone. After price spikes upward, it failed to hold the higher level and quickly dropped. That area is now piled with a large amount of trapped positions, making resistance to a renewed upside breakout relatively strong.
2. After the rebound and rally, there is a need for profit-taking pullback
After starting from the low at 766.00, the market launched a strong rebound. The upward move was significant in a short time, and short-term longs accumulated a large amount of unrealized profit. After reaching the high, long positions began taking profits. This will continue to create selling pressure on the order book, making it easy for price to adjust further downward.
3. Short-term moving averages have turned downward; upside momentum is fading
MA5, MA10, and MA20 have all turned down. The current price has already fallen below all short-term moving averages, forming a bearish alignment. After the spike, there are no longer strong bullish long candles; instead, there are consecutive pullback candles. The short-term buying power has clearly weakened, and there is insufficient motivation to push upward.
4. Spike-and-fall: once the high level is lost, a synchronized pullback is likely to be triggered
The price attempted to break the 889.20 high but failed and did not hold above resistance; it then turned downward directly. Once the high level is broken, it can trigger two kinds of selling pressure: stop-loss exits from longs that entered at the high, plus concentrated profit-taking from short-term winners. Together, this resonance can further open up the space for the pullback.
#ZEC
Core logic reasons
1. The upper strong pressure zone is suppressing
On the ZEC 15-minute chart, the early-session high at 889.20 forms a key resistance level; the current price is 828.90. The 845–889 range is a dense sell-off zone. After price spikes upward, it failed to hold the higher level and quickly dropped. That area is now piled with a large amount of trapped positions, making resistance to a renewed upside breakout relatively strong.
2. After the rebound and rally, there is a need for profit-taking pullback
After starting from the low at 766.00, the market launched a strong rebound. The upward move was significant in a short time, and short-term longs accumulated a large amount of unrealized profit. After reaching the high, long positions began taking profits. This will continue to create selling pressure on the order book, making it easy for price to adjust further downward.
3. Short-term moving averages have turned downward; upside momentum is fading
MA5, MA10, and MA20 have all turned down. The current price has already fallen below all short-term moving averages, forming a bearish alignment. After the spike, there are no longer strong bullish long candles; instead, there are consecutive pullback candles. The short-term buying power has clearly weakened, and there is insufficient motivation to push upward.
4. Spike-and-fall: once the high level is lost, a synchronized pullback is likely to be triggered
The price attempted to break the 889.20 high but failed and did not hold above resistance; it then turned downward directly. Once the high level is broken, it can trigger two kinds of selling pressure: stop-loss exits from longs that entered at the high, plus concentrated profit-taking from short-term winners. Together, this resonance can further open up the space for the pullback.
#ZEC
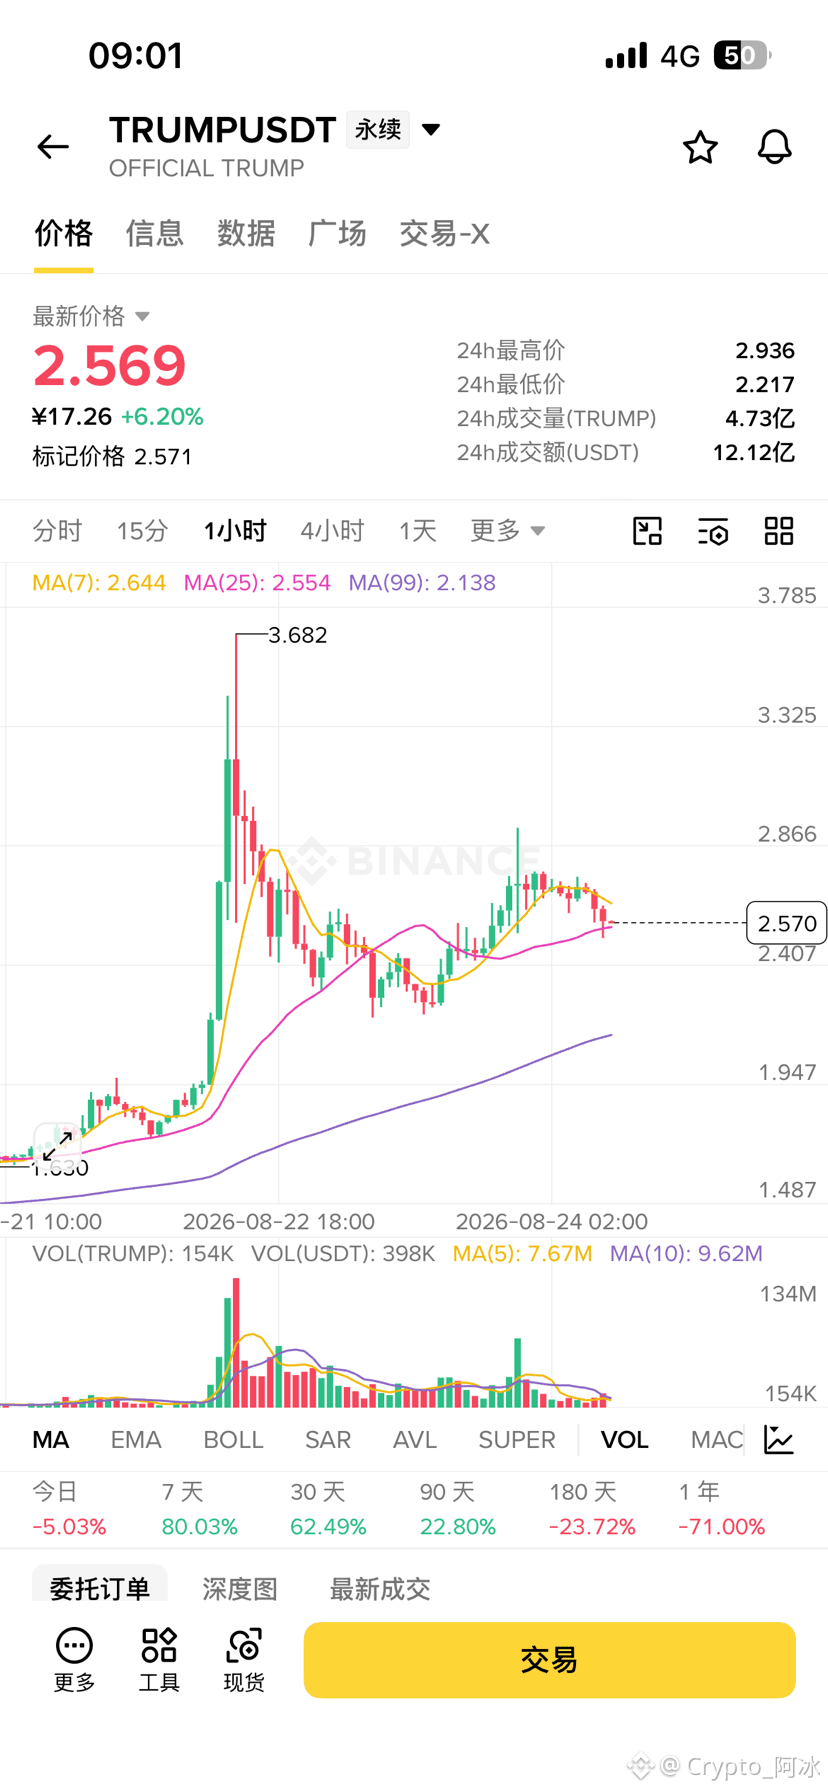
$TRUMP Direction: Look back at the callback (empty)
Key logic and reasons
1. The upper strong pressure zone suppresses price
On the TRUMP 30-minute chart, the early-stage high at 3.684 forms a massive resistance/pull-down pressure, while the current price is 2.555. The next level of resistance is in the 2.8–2.936 range. In this rebound, the price surged to around 2.9 and then met resistance, rolling over and falling back. This area is packed with trapped positions; repeated attempts have been unable to break upward, so overhead selling pressure is heavy.
2. After a large surge, profit-taking creates strong sell pressure
The market launched a violent rally from the low at 0.743, with a huge overall percentage increase. During the advance, a very large amount of long positions accumulated unrealized profit. After the rebound reached around 2.9, longs began to take profit and escape. Since Meme coins have a strong speculative/market-momentum trading attribute, concentrated profit-taking leaving the market can easily drive the price to continue correcting downward.
3. Short-term moving averages have turned downward; upside momentum has fully faded
MA5, MA10, and MA20 have all formed a bearish “death cross,” pointing downward. The current price has already fallen below all the short-term moving averages. During the rebound, there was no sustained continuation with large bullish candles. After the initial push higher, the market closed in consecutive red candles; buying power quickly exhausted, leaving insufficient short-term upward offensive momentum.
4. Rejection on the rebound can lead to a second round of pressure and synchronized downside decline
The price’s rebound failed to break through the previous high resistance zone; instead, it turned and moved downward immediately. Meme coin sentiment cools off quickly. Once a rebound fails, it is easy to trigger a “synchronization” effect: bargain-buying longs cutting losses plus concentrated profit-taking from high levels, which can push the price further down for another corrective drop.
#TRUMP Breaks $3.4 to set a new high since March 21
Key logic and reasons
1. The upper strong pressure zone suppresses price
On the TRUMP 30-minute chart, the early-stage high at 3.684 forms a massive resistance/pull-down pressure, while the current price is 2.555. The next level of resistance is in the 2.8–2.936 range. In this rebound, the price surged to around 2.9 and then met resistance, rolling over and falling back. This area is packed with trapped positions; repeated attempts have been unable to break upward, so overhead selling pressure is heavy.
2. After a large surge, profit-taking creates strong sell pressure
The market launched a violent rally from the low at 0.743, with a huge overall percentage increase. During the advance, a very large amount of long positions accumulated unrealized profit. After the rebound reached around 2.9, longs began to take profit and escape. Since Meme coins have a strong speculative/market-momentum trading attribute, concentrated profit-taking leaving the market can easily drive the price to continue correcting downward.
3. Short-term moving averages have turned downward; upside momentum has fully faded
MA5, MA10, and MA20 have all formed a bearish “death cross,” pointing downward. The current price has already fallen below all the short-term moving averages. During the rebound, there was no sustained continuation with large bullish candles. After the initial push higher, the market closed in consecutive red candles; buying power quickly exhausted, leaving insufficient short-term upward offensive momentum.
4. Rejection on the rebound can lead to a second round of pressure and synchronized downside decline
The price’s rebound failed to break through the previous high resistance zone; instead, it turned and moved downward immediately. Meme coin sentiment cools off quickly. Once a rebound fails, it is easy to trigger a “synchronization” effect: bargain-buying longs cutting losses plus concentrated profit-taking from high levels, which can push the price further down for another corrective drop.
#TRUMP Breaks $3.4 to set a new high since March 21
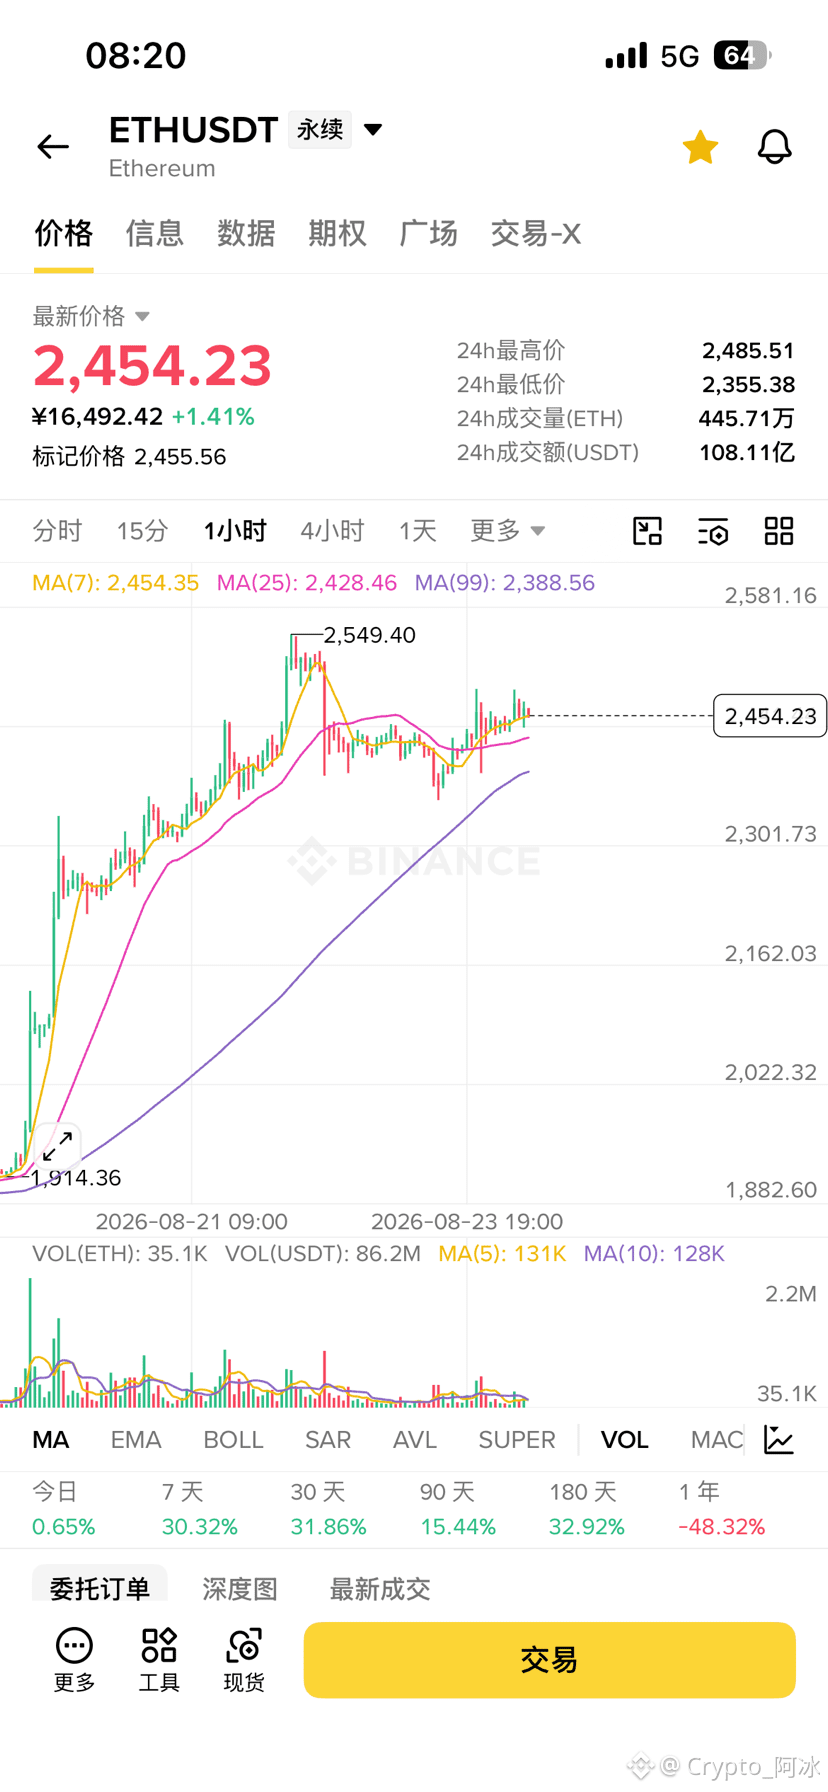
$ETH Direction: Look back at the callback (empty)
Core logic rationale
1. The upper strong pressure zone suppresses price
On the ETH hourly chart, the prior high at 2549.34 formed a clear resistance. The current price is around 2451, leaving limited room to move up from the high. A large amount of earlier trapped positions is stacked at the prior high area. After multiple attempts to probe upward, it has repeatedly failed to effectively break through the 2549 level, so upward movement faces heavy pressure.
2. After one round of上涨, profit-taking leads to pullbacks
The market started from the 2220.88 low and moved upward, completing a notable bullish leg. Long positions have accumulated considerable unrealized gains. At this stage, the market is entering a high-range consolidation phase. High-level profit-taking may close positions at any time, which can easily trigger a pullback and adjustment.
3. Hourly-level breakout momentum is weakening
Although the short-term moving averages still support the price, there is no longer strong momentum to drive upward with powerful bullish candles. After reaching highs, price keeps oscillating back and forth. The buying power from the long side is gradually being consumed, so there is insufficient motivation to continue pushing higher.
4. High-range sideways trading—after a long time without a breakthrough, a synchronized pullback becomes likely
Price has been lingering below the resistance level for an extended period, consolidating without a breakout with sufficient volume. As time passes, the patience of long positions will be worn down. This makes it easier to trigger profit-taking stop-outs combined with long liquidation stop-losses, resulting in a pullback行情.
#ETH走势分析
Core logic rationale
1. The upper strong pressure zone suppresses price
On the ETH hourly chart, the prior high at 2549.34 formed a clear resistance. The current price is around 2451, leaving limited room to move up from the high. A large amount of earlier trapped positions is stacked at the prior high area. After multiple attempts to probe upward, it has repeatedly failed to effectively break through the 2549 level, so upward movement faces heavy pressure.
2. After one round of上涨, profit-taking leads to pullbacks
The market started from the 2220.88 low and moved upward, completing a notable bullish leg. Long positions have accumulated considerable unrealized gains. At this stage, the market is entering a high-range consolidation phase. High-level profit-taking may close positions at any time, which can easily trigger a pullback and adjustment.
3. Hourly-level breakout momentum is weakening
Although the short-term moving averages still support the price, there is no longer strong momentum to drive upward with powerful bullish candles. After reaching highs, price keeps oscillating back and forth. The buying power from the long side is gradually being consumed, so there is insufficient motivation to continue pushing higher.
4. High-range sideways trading—after a long time without a breakthrough, a synchronized pullback becomes likely
Price has been lingering below the resistance level for an extended period, consolidating without a breakout with sufficient volume. As time passes, the patience of long positions will be worn down. This makes it easier to trigger profit-taking stop-outs combined with long liquidation stop-losses, resulting in a pullback行情.
#ETH走势分析
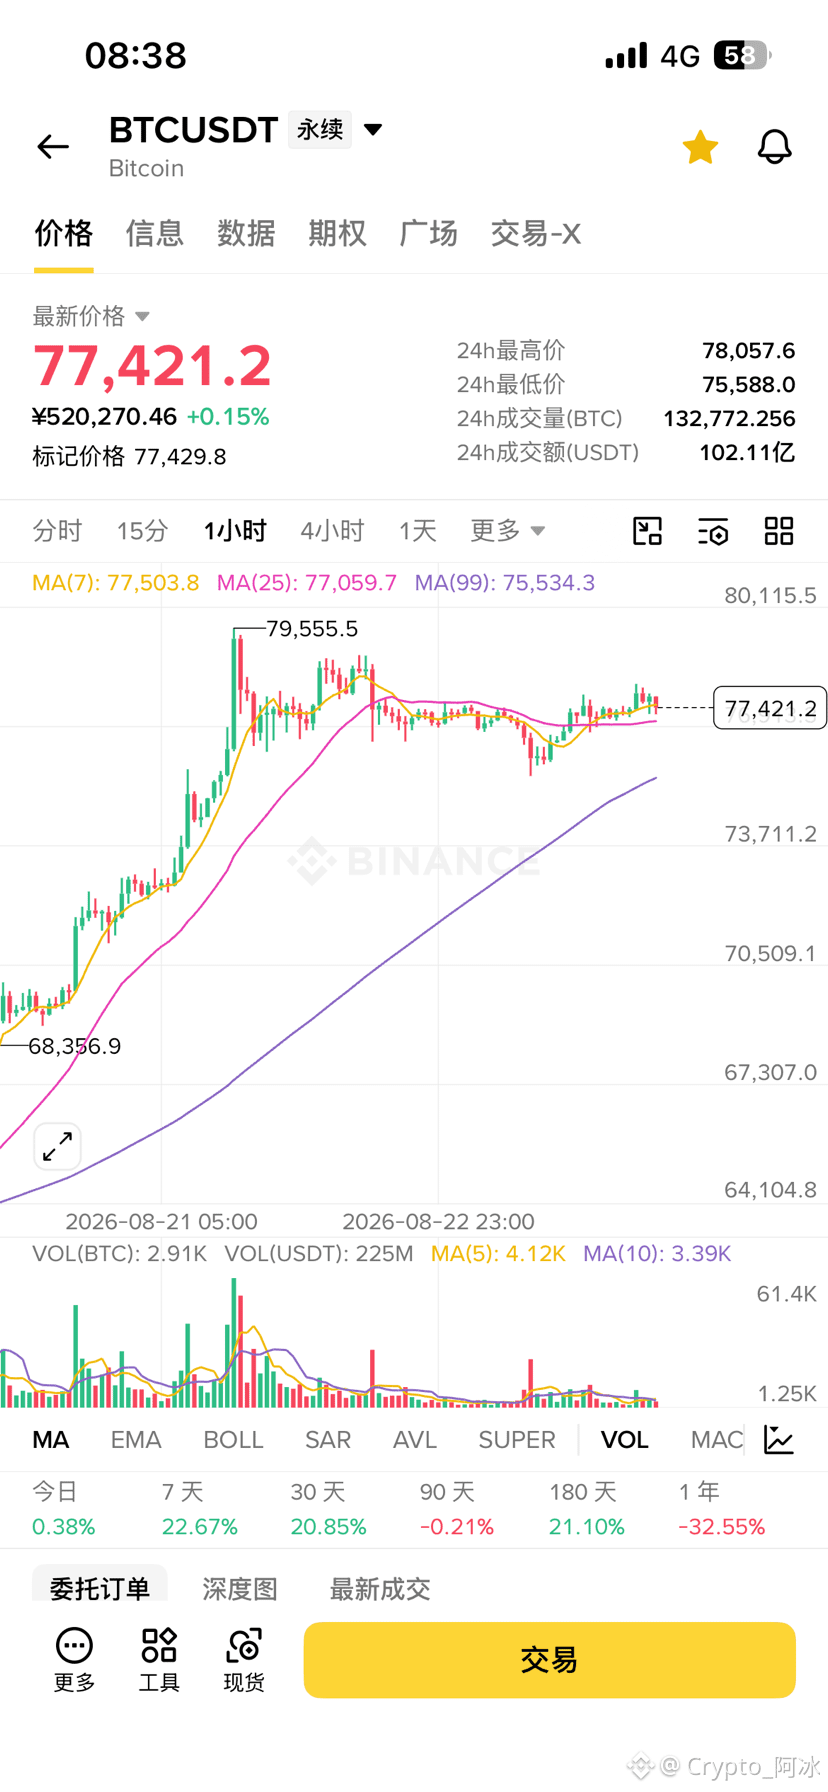
$BTC Direction: Look for a callback (empty)
Logical reasons
1. The key pressure levels are clearly suppressing
Current price is moving around 77394. Above 78000–79000 is a dense resistance zone created by the previous spike. Earlier, the market’s high reached 79603, but it then met resistance and pulled back. Repeated attempts to test this range failed to break through effectively with volume. A large number of trapped sell orders remain stacked overhead, so resistance to further upside is very strong.
2. After a swing rise, there is a demand to realize profits
The market started its upward move from the low point 71068 and has already accumulated a considerable swing gain. Long positions have obtained substantial floating profit. During the high-level consolidation phase, profit-taking funds may choose to exit at any time, which can cause the price to dip and experience a pullback.
3. On the hourly timeframe, the upside momentum is gradually weakening
Although the hourly K-lines still have moving averages below the price, the strength of the push higher has clearly diminished. It is no longer producing consecutive strong bullish candles, instead turning into back-and-forth choppy oscillation. This suggests that bullish power is being gradually consumed. Follow-up buying is insufficient, making it difficult to keep pushing the price to refresh new highs.
4. In a choppy range, repeated failure to break through often leads to a pullback
Consolidation below the resistance level for a long time, without a strong breakout to support it, tends to exhaust patience on the long side. This can easily trigger a synchronization between long stop-outs and profit-taking, and then lead into a pullback phase.
#比特币创2023年3月来最强周涨幅
Logical reasons
1. The key pressure levels are clearly suppressing
Current price is moving around 77394. Above 78000–79000 is a dense resistance zone created by the previous spike. Earlier, the market’s high reached 79603, but it then met resistance and pulled back. Repeated attempts to test this range failed to break through effectively with volume. A large number of trapped sell orders remain stacked overhead, so resistance to further upside is very strong.
2. After a swing rise, there is a demand to realize profits
The market started its upward move from the low point 71068 and has already accumulated a considerable swing gain. Long positions have obtained substantial floating profit. During the high-level consolidation phase, profit-taking funds may choose to exit at any time, which can cause the price to dip and experience a pullback.
3. On the hourly timeframe, the upside momentum is gradually weakening
Although the hourly K-lines still have moving averages below the price, the strength of the push higher has clearly diminished. It is no longer producing consecutive strong bullish candles, instead turning into back-and-forth choppy oscillation. This suggests that bullish power is being gradually consumed. Follow-up buying is insufficient, making it difficult to keep pushing the price to refresh new highs.
4. In a choppy range, repeated failure to break through often leads to a pullback
Consolidation below the resistance level for a long time, without a strong breakout to support it, tends to exhaust patience on the long side. This can easily trigger a synchronization between long stop-outs and profit-taking, and then lead into a pullback phase.
#比特币创2023年3月来最强周涨幅
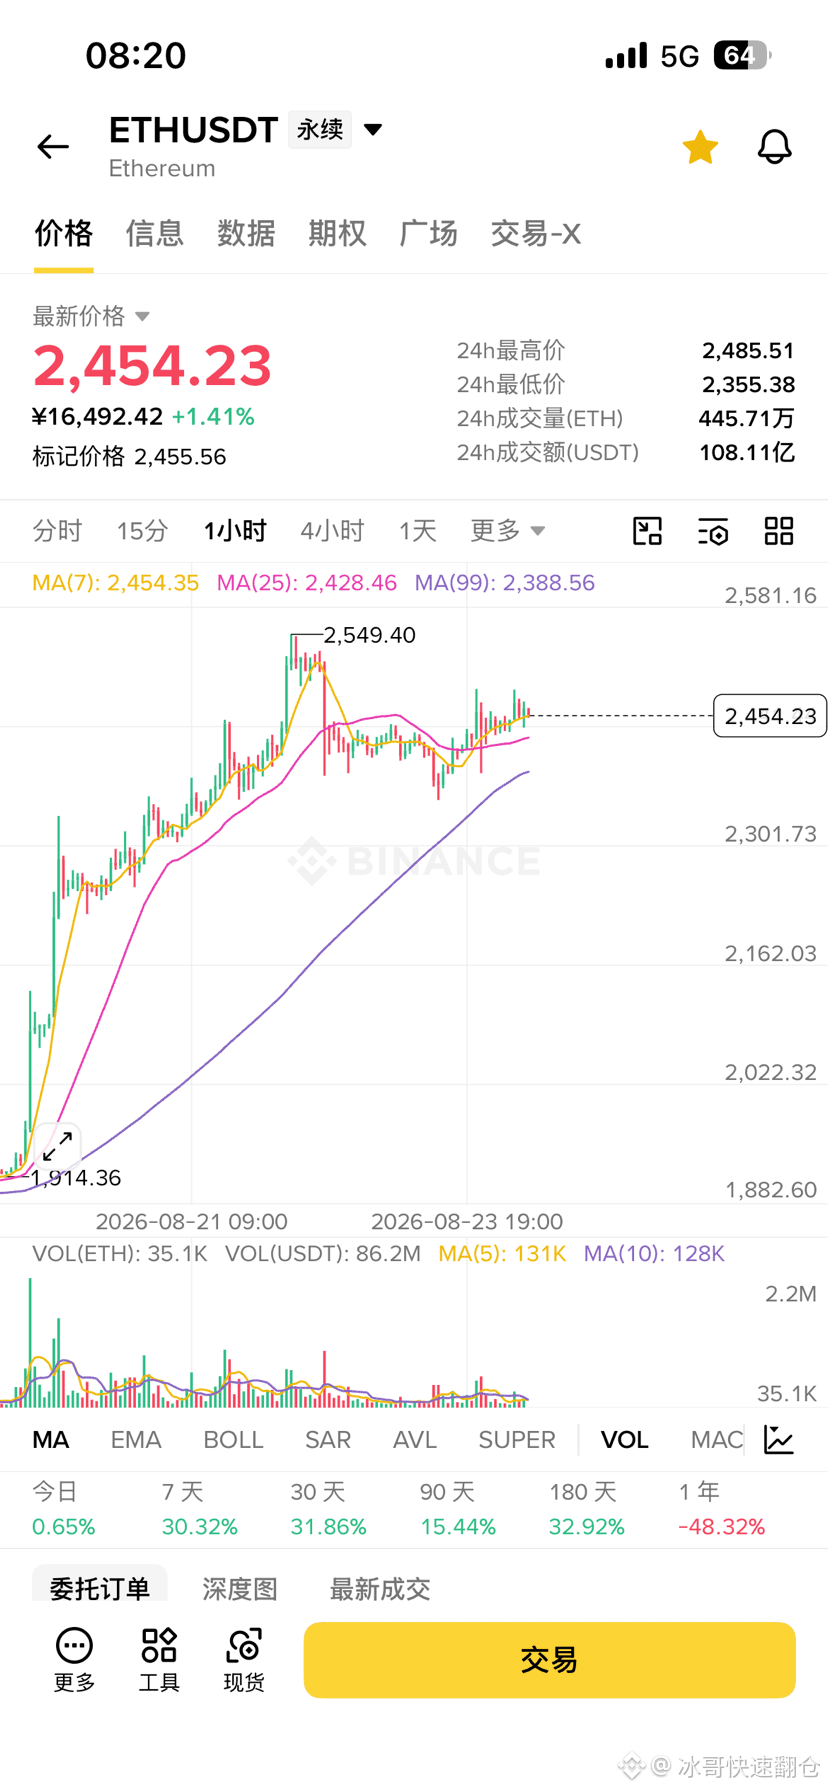
$ETH Wow, this move by the guy is just hilarious! Over on the BTC side, he just cut his losses and admitted the loss, and then—turns around and runs to ETH to throw $75 million into a long position. Isn’t that basically sticking his head out for the market maker to chop?
Look at the 1-hour chart. He surged up to 2549 and couldn’t get past it no matter what, then started a slow grind down. Why should that dog maker pay out of pocket to help him realize his dream, and let him pocket nearly $2 million for free? There’s no way it’s that easy!
Everyone in the圈 knows that this kind of high-profile “beacon” is the main force’s cash-out machine. As long as he keeps that $75 million long tightly in hand, the market maker will definitely smash the price lower to harvest him. Let’s follow this backward indicator and short it—wait for the big waterfall to flush the market, and open a short!
#比特币创2023年3月来最强周涨幅
Look at the 1-hour chart. He surged up to 2549 and couldn’t get past it no matter what, then started a slow grind down. Why should that dog maker pay out of pocket to help him realize his dream, and let him pocket nearly $2 million for free? There’s no way it’s that easy!
Everyone in the圈 knows that this kind of high-profile “beacon” is the main force’s cash-out machine. As long as he keeps that $75 million long tightly in hand, the market maker will definitely smash the price lower to harvest him. Let’s follow this backward indicator and short it—wait for the big waterfall to flush the market, and open a short!
#比特币创2023年3月来最强周涨幅

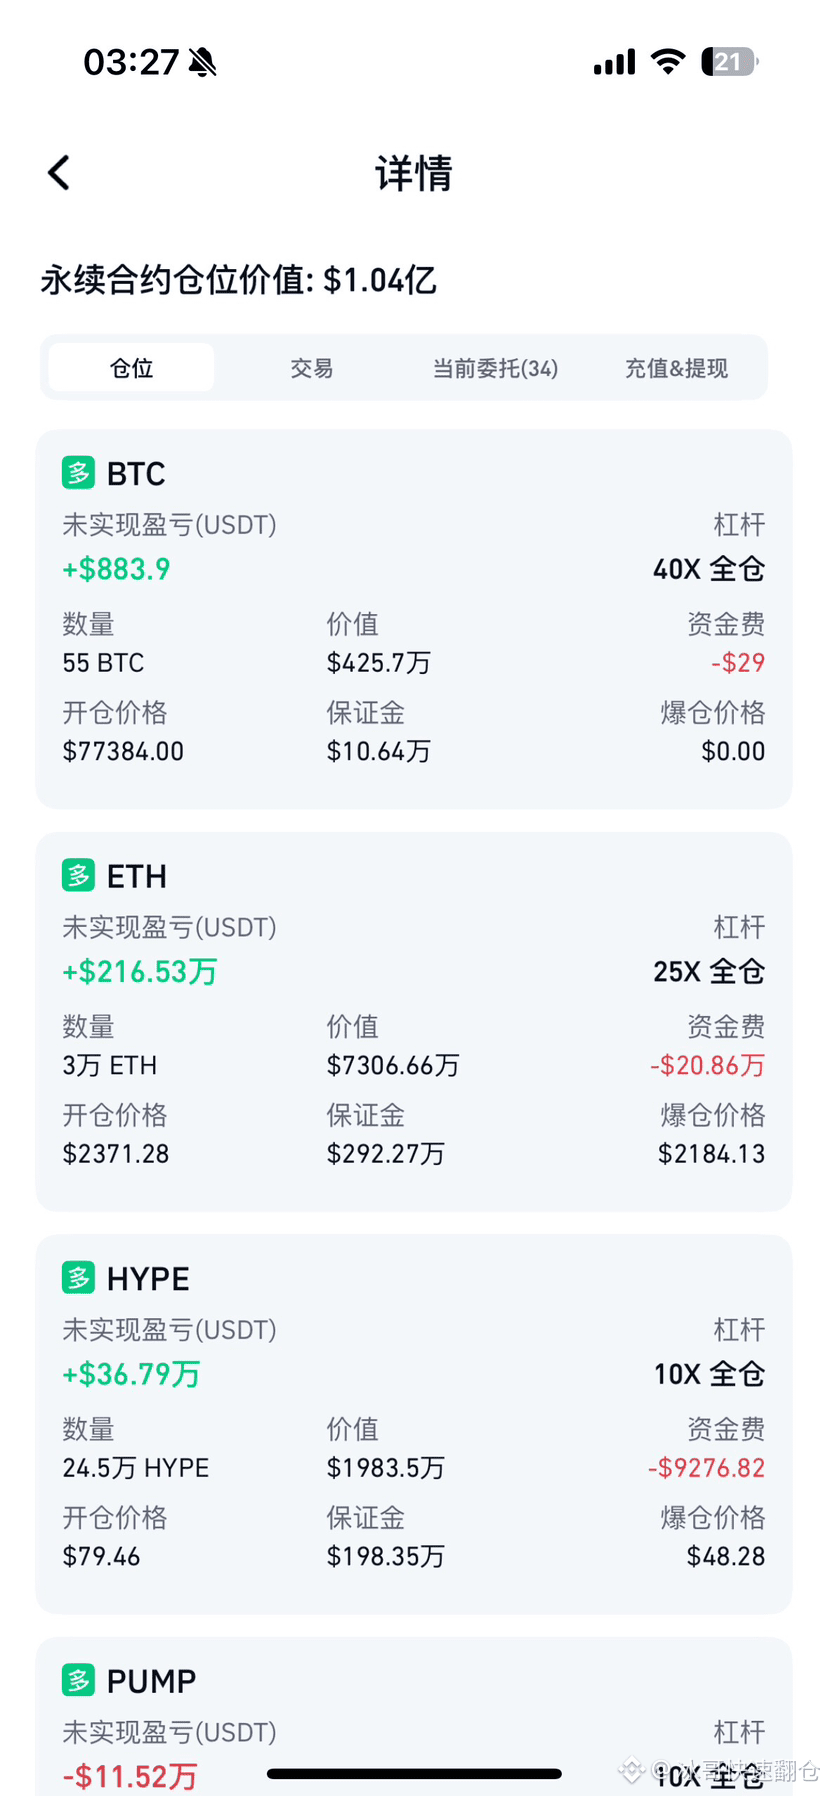
🐮, no arguing

叶枫实时策略
·
--
36k USD, 64k has also fallen!
With this momentum 🤔, it takes real guts to catch the bottom 👍🏻
#美联储点阵鹰派收益率曲线趋平
$ETH
With this momentum 🤔, it takes real guts to catch the bottom 👍🏻
#美联储点阵鹰派收益率曲线趋平
$ETH
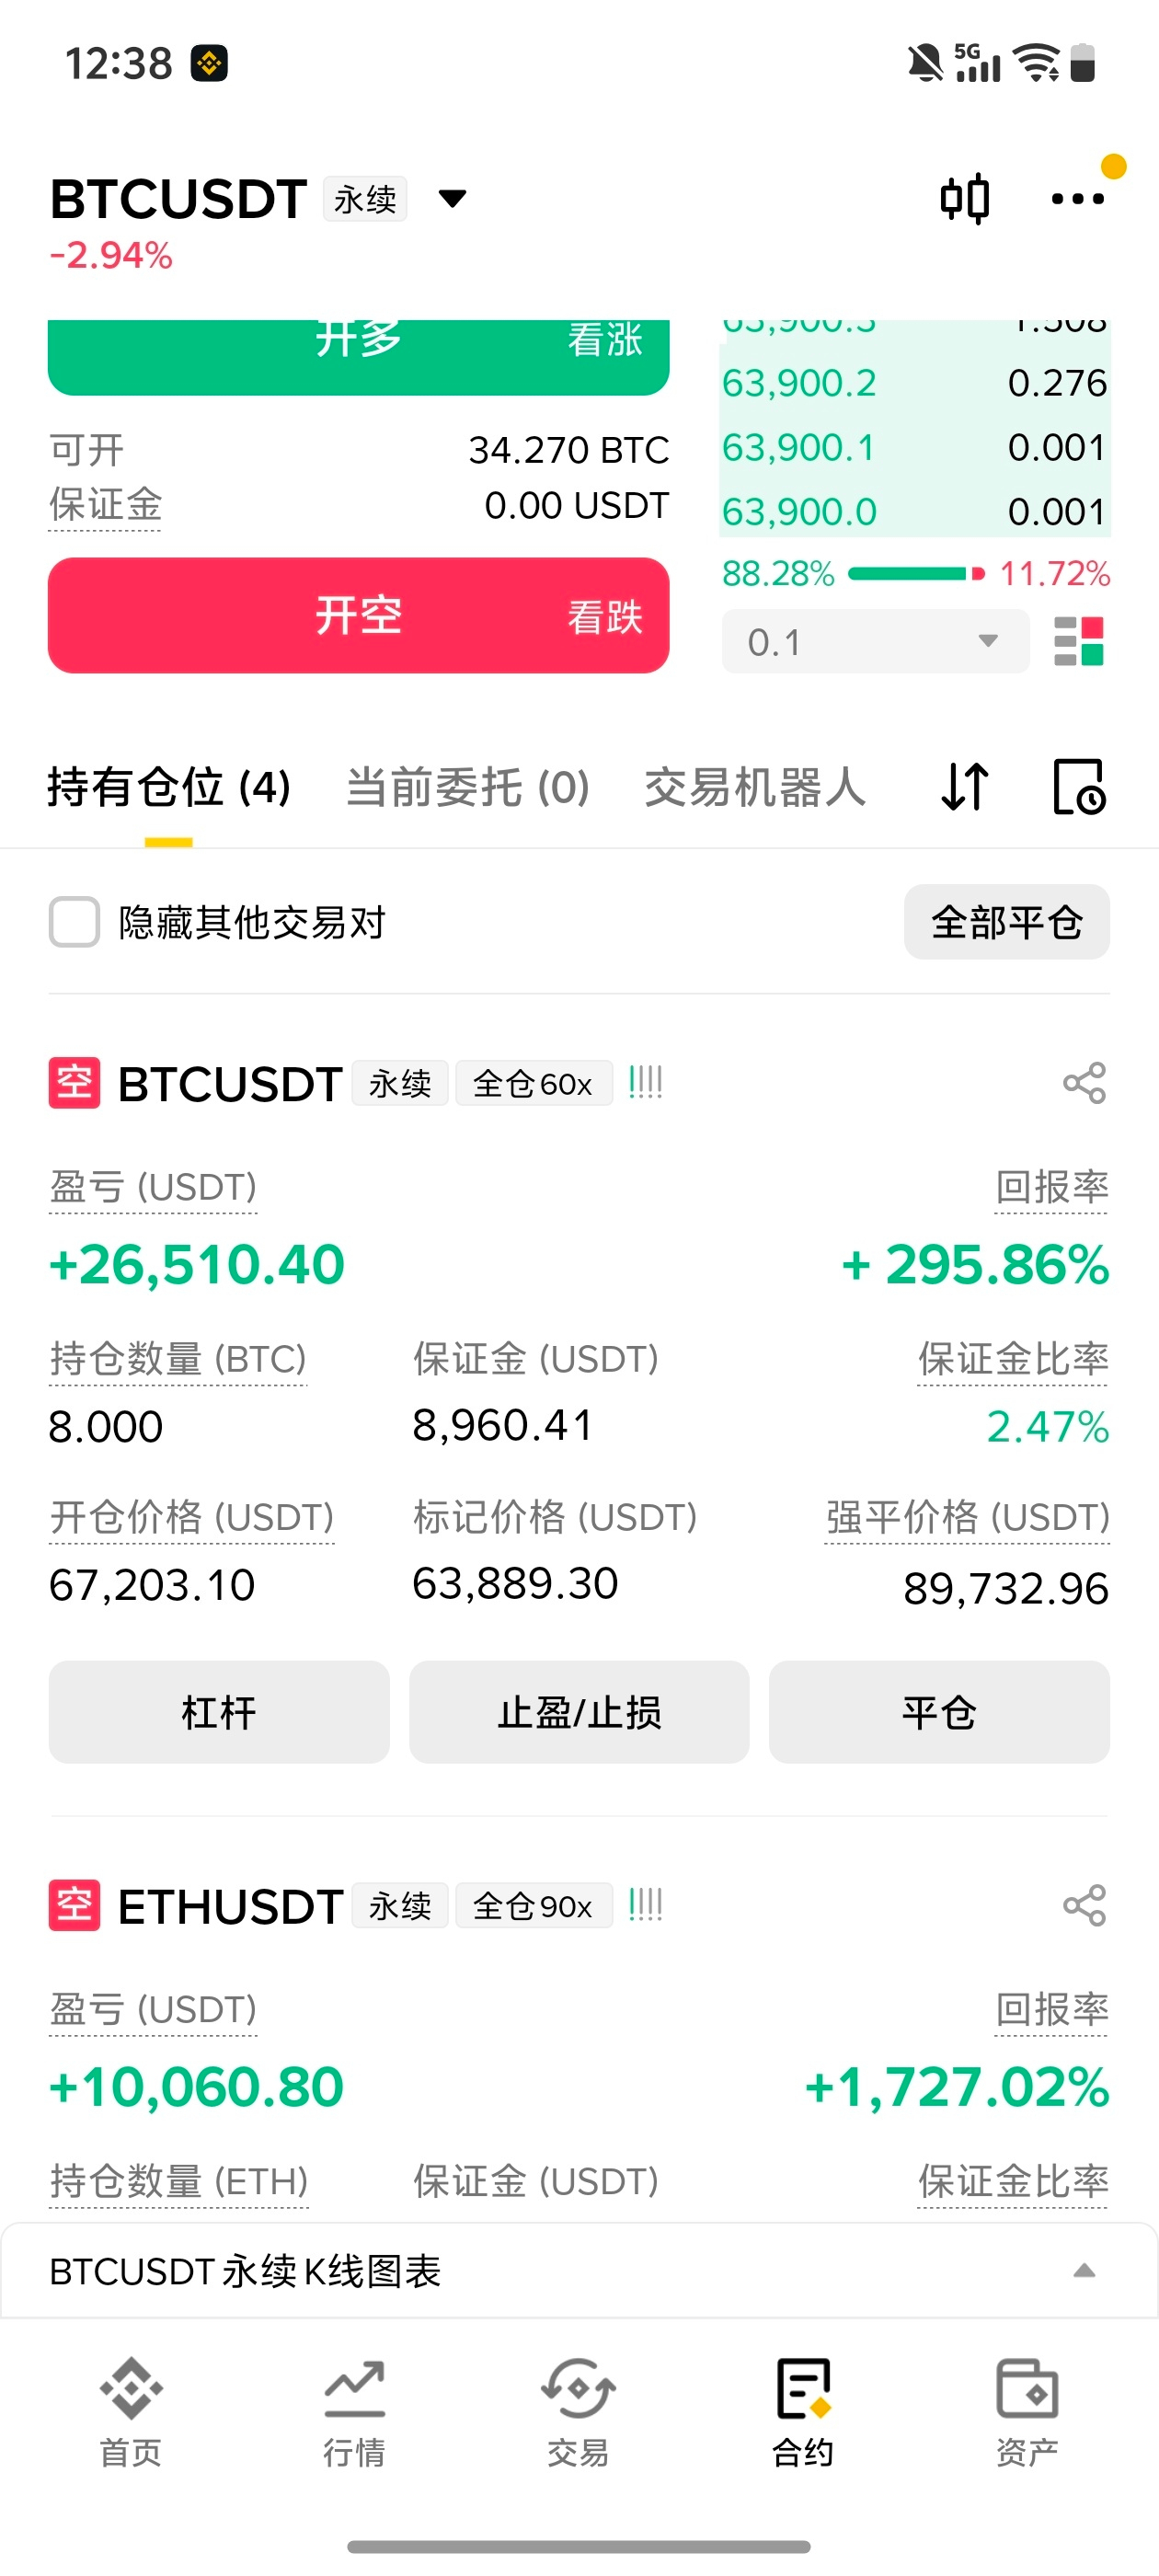

Bro, you’re really spot-on.
叶枫实时策略
·
--
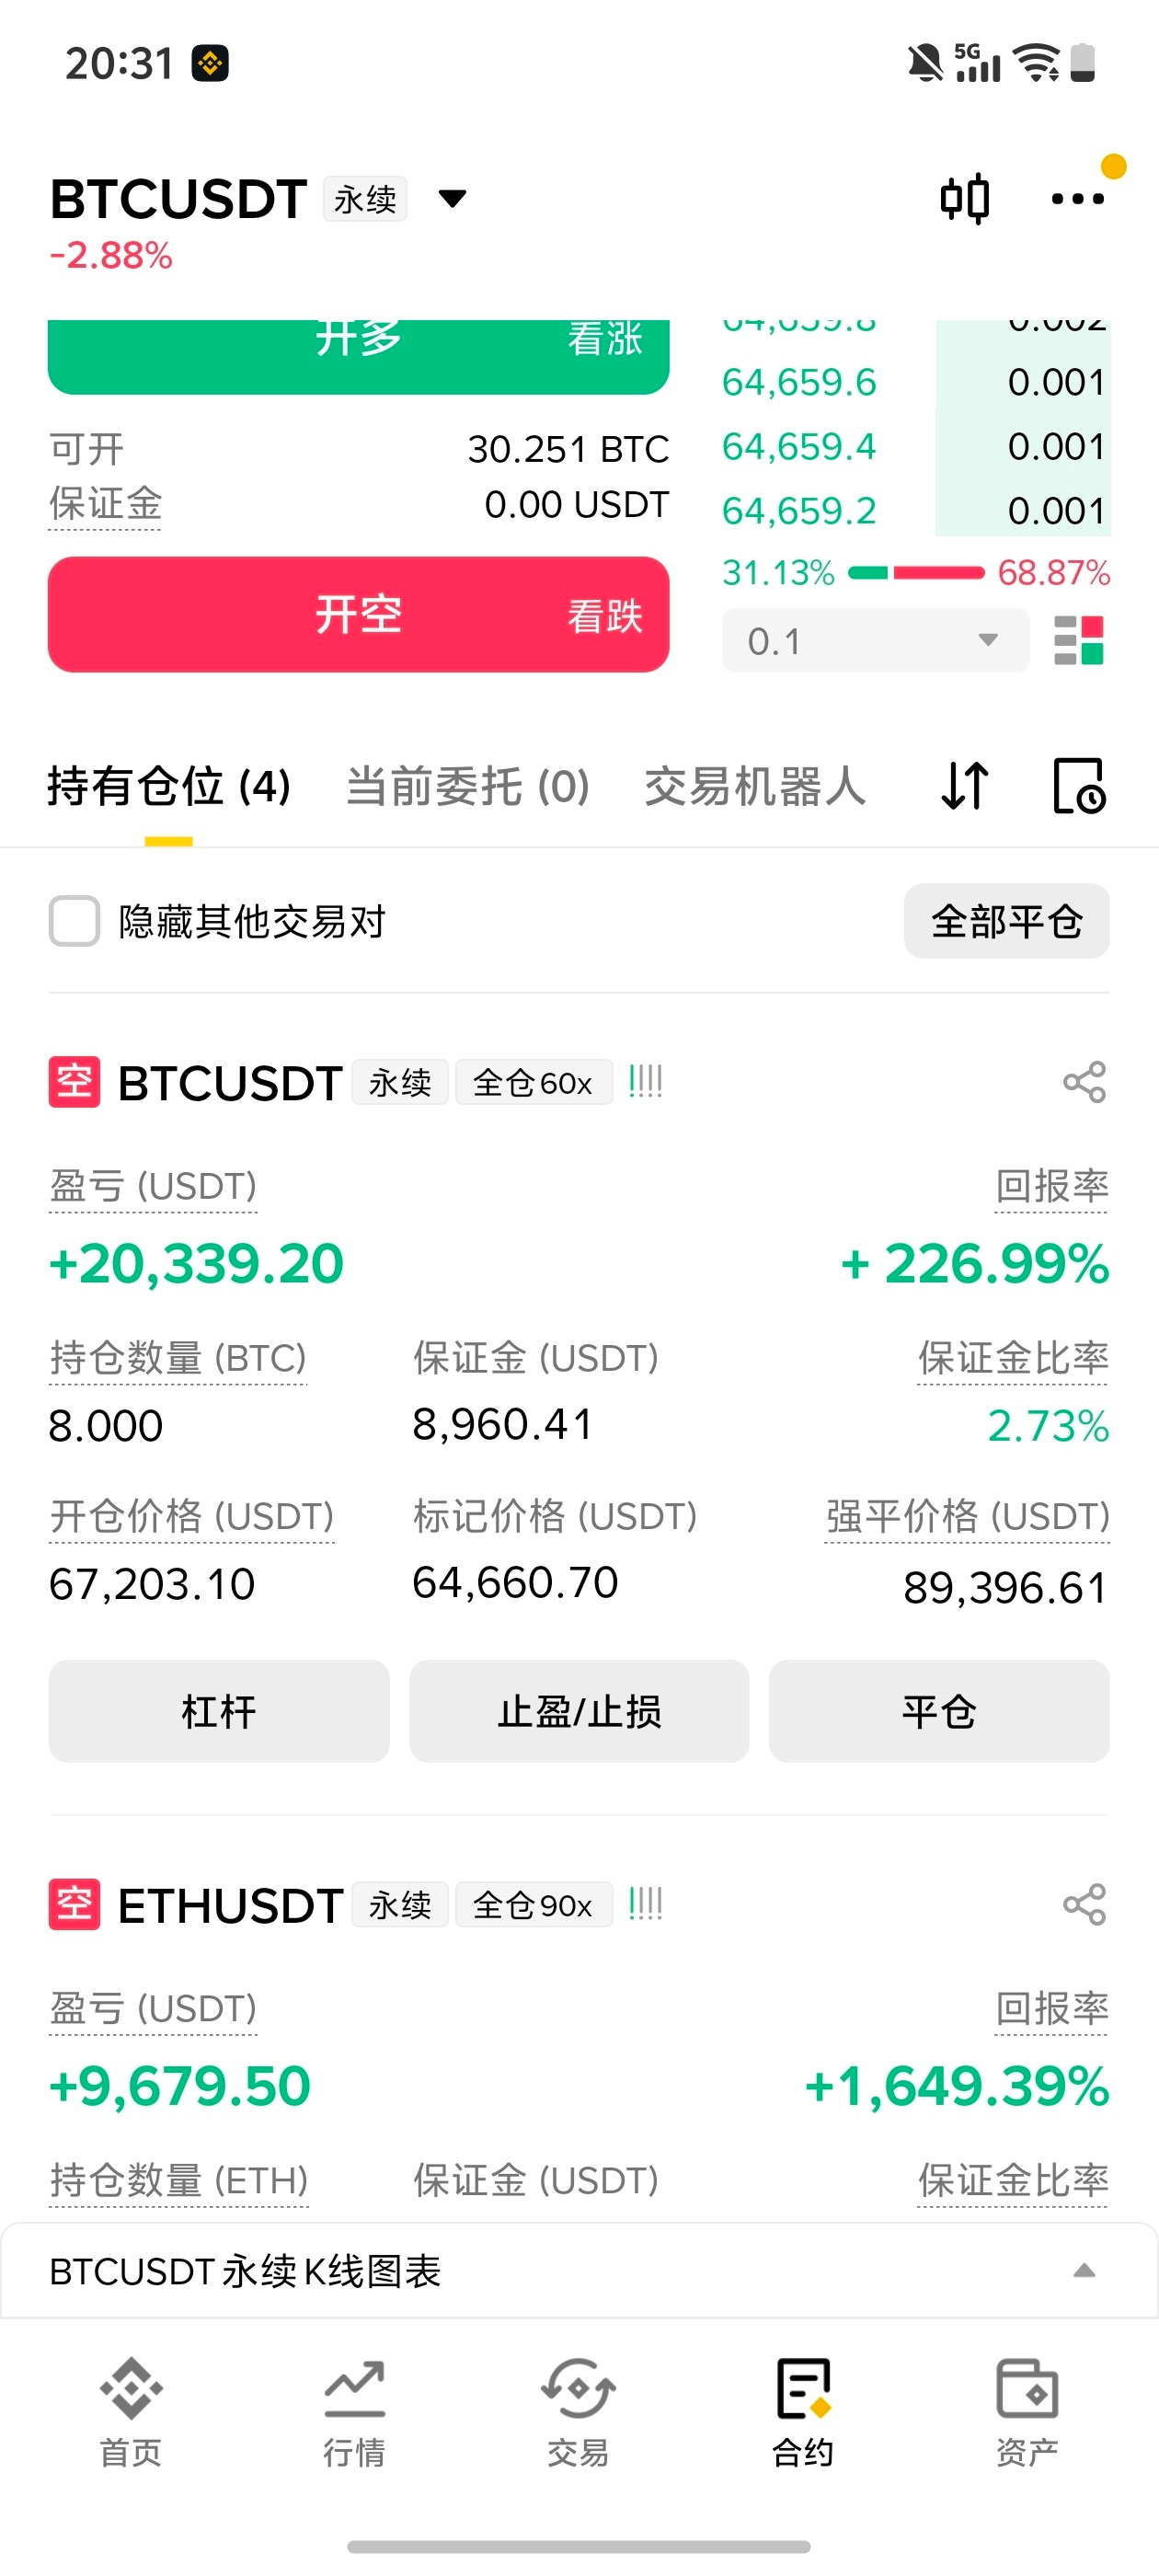
30k USDT, shorting is the way to go
At this rate 🤔, 64k won't hold up!
At this rate 🤔, 64k won't hold up!
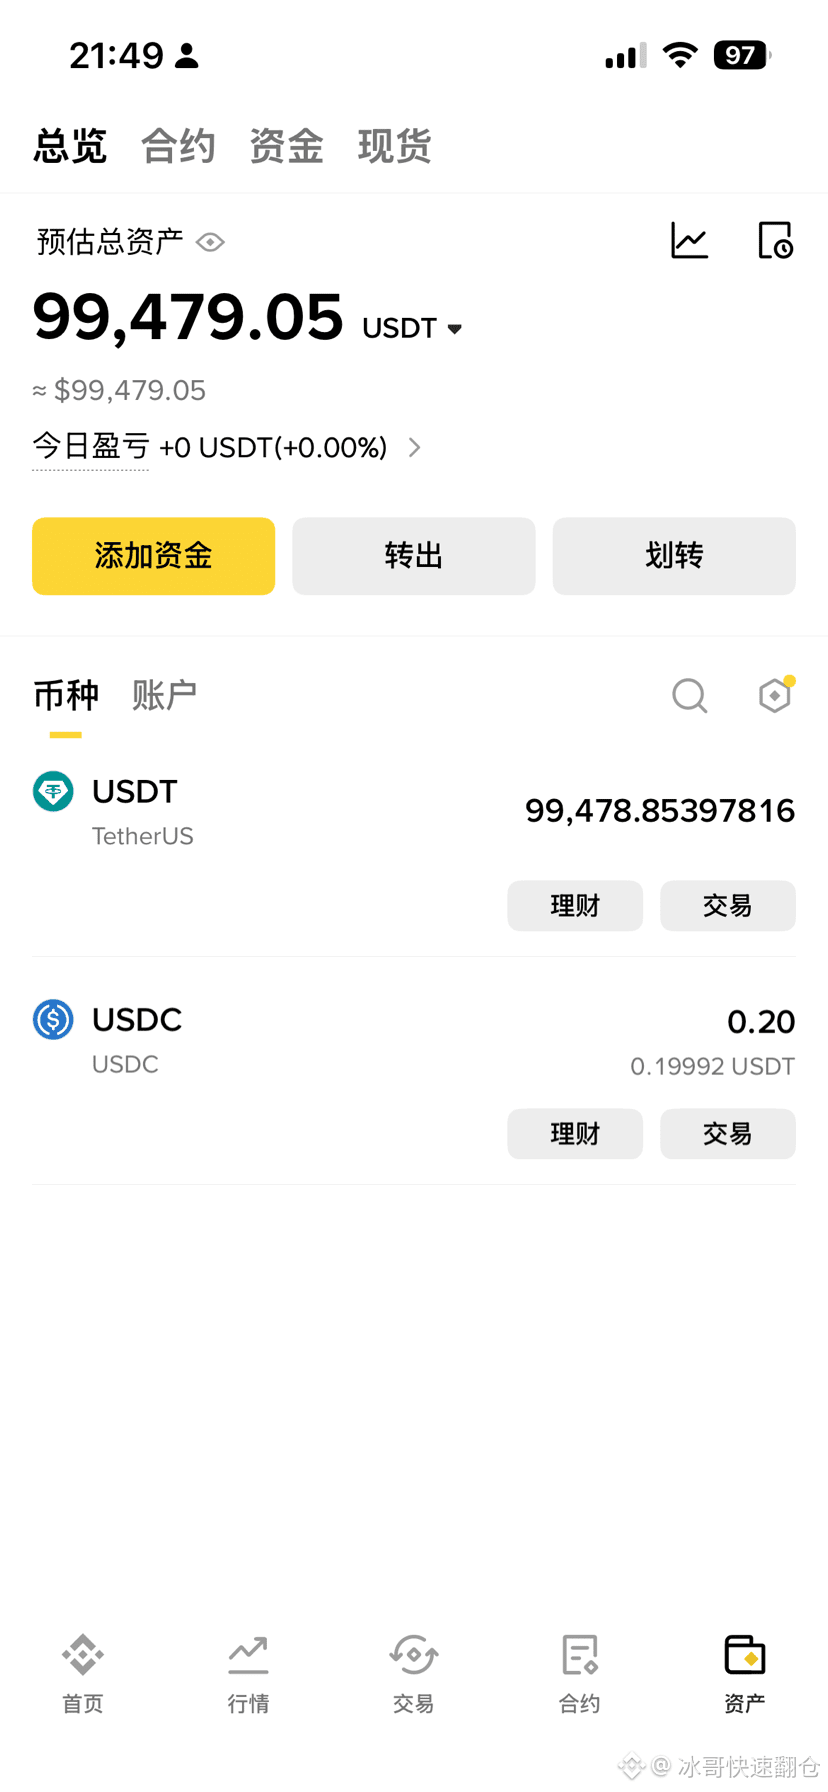
Bumpy all the way, so tired... Started with 10,000 U, reached 90,000 U, that's a ninefold increase!!!
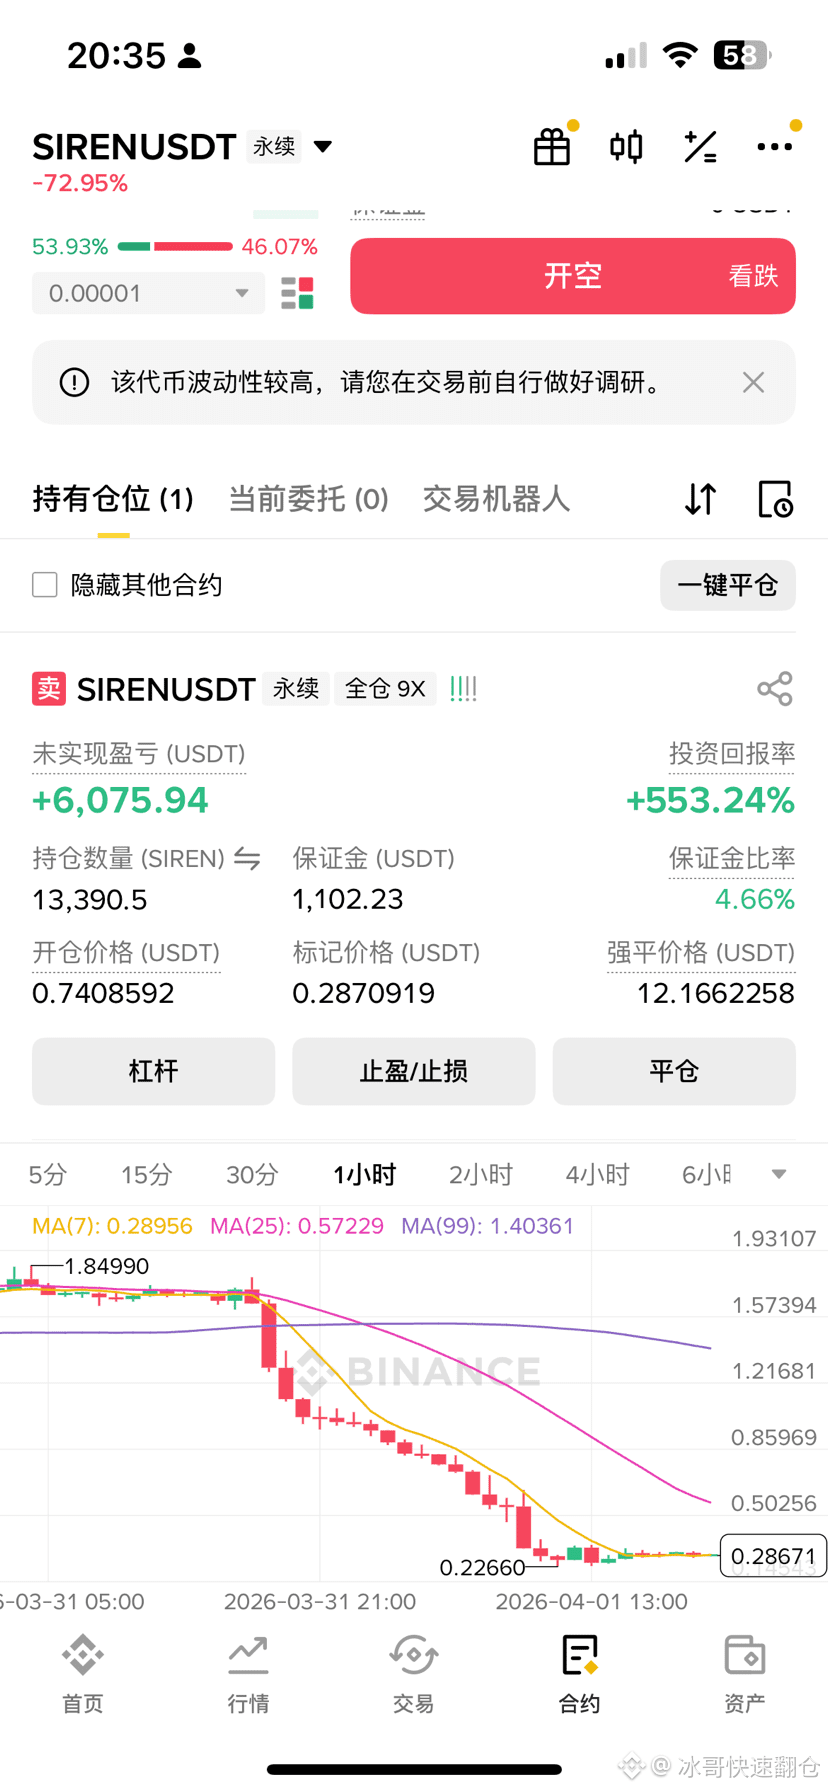
60000u! The market has risen as expected! The entire strategy has been disclosed in advance
If you want to follow the benefit orders, like and follow to avoid getting lost!
If you want to follow the benefit orders, like and follow to avoid getting lost!
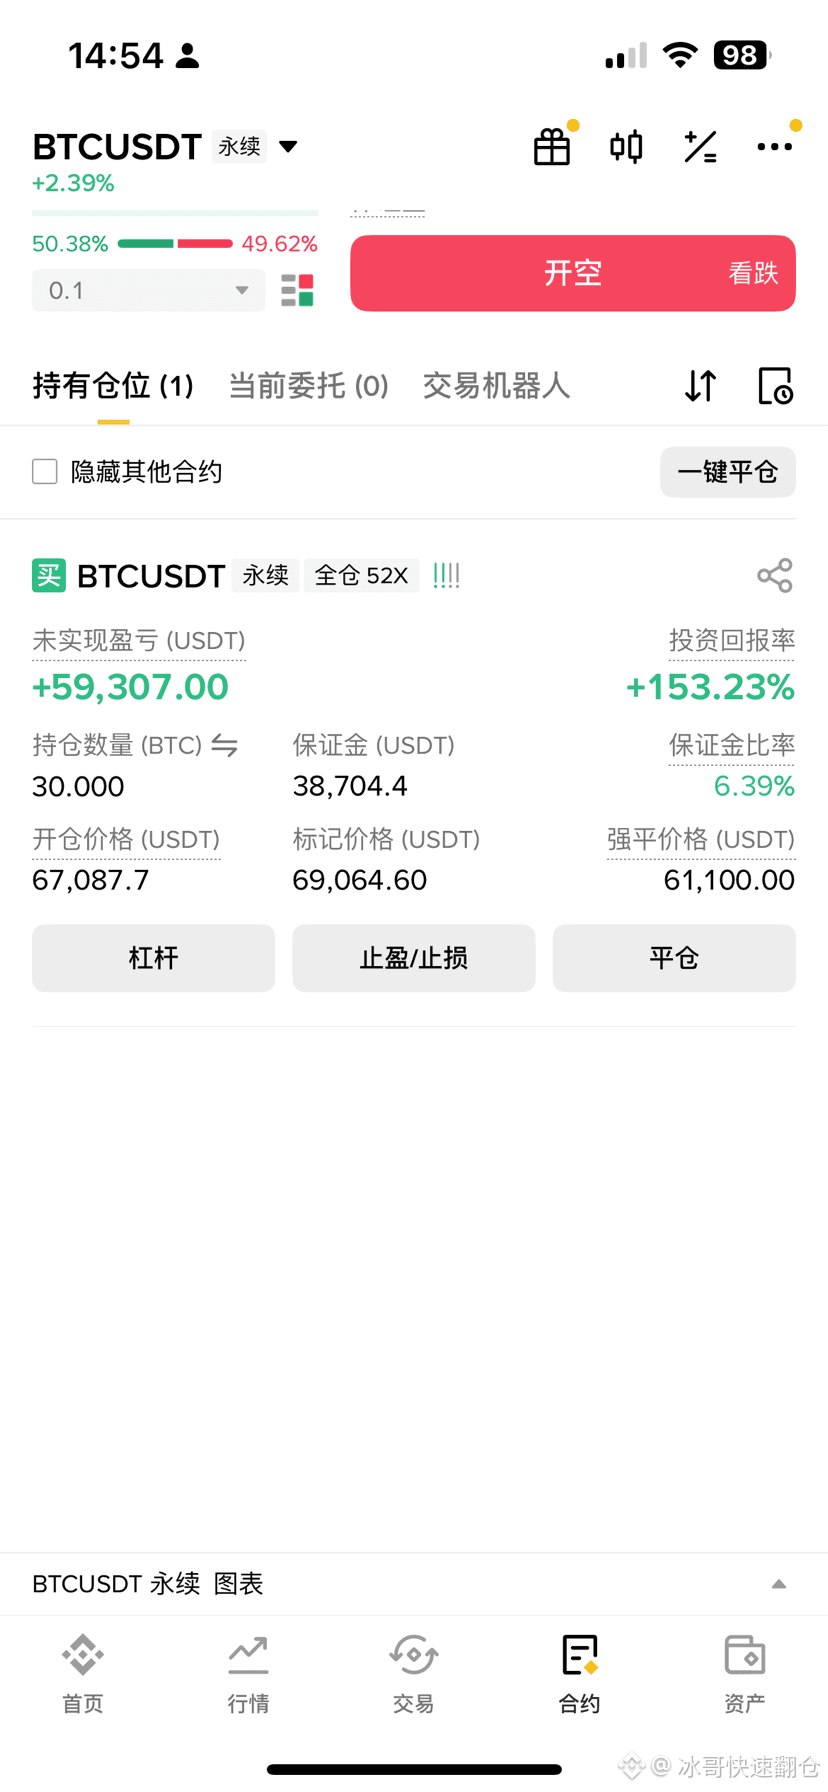
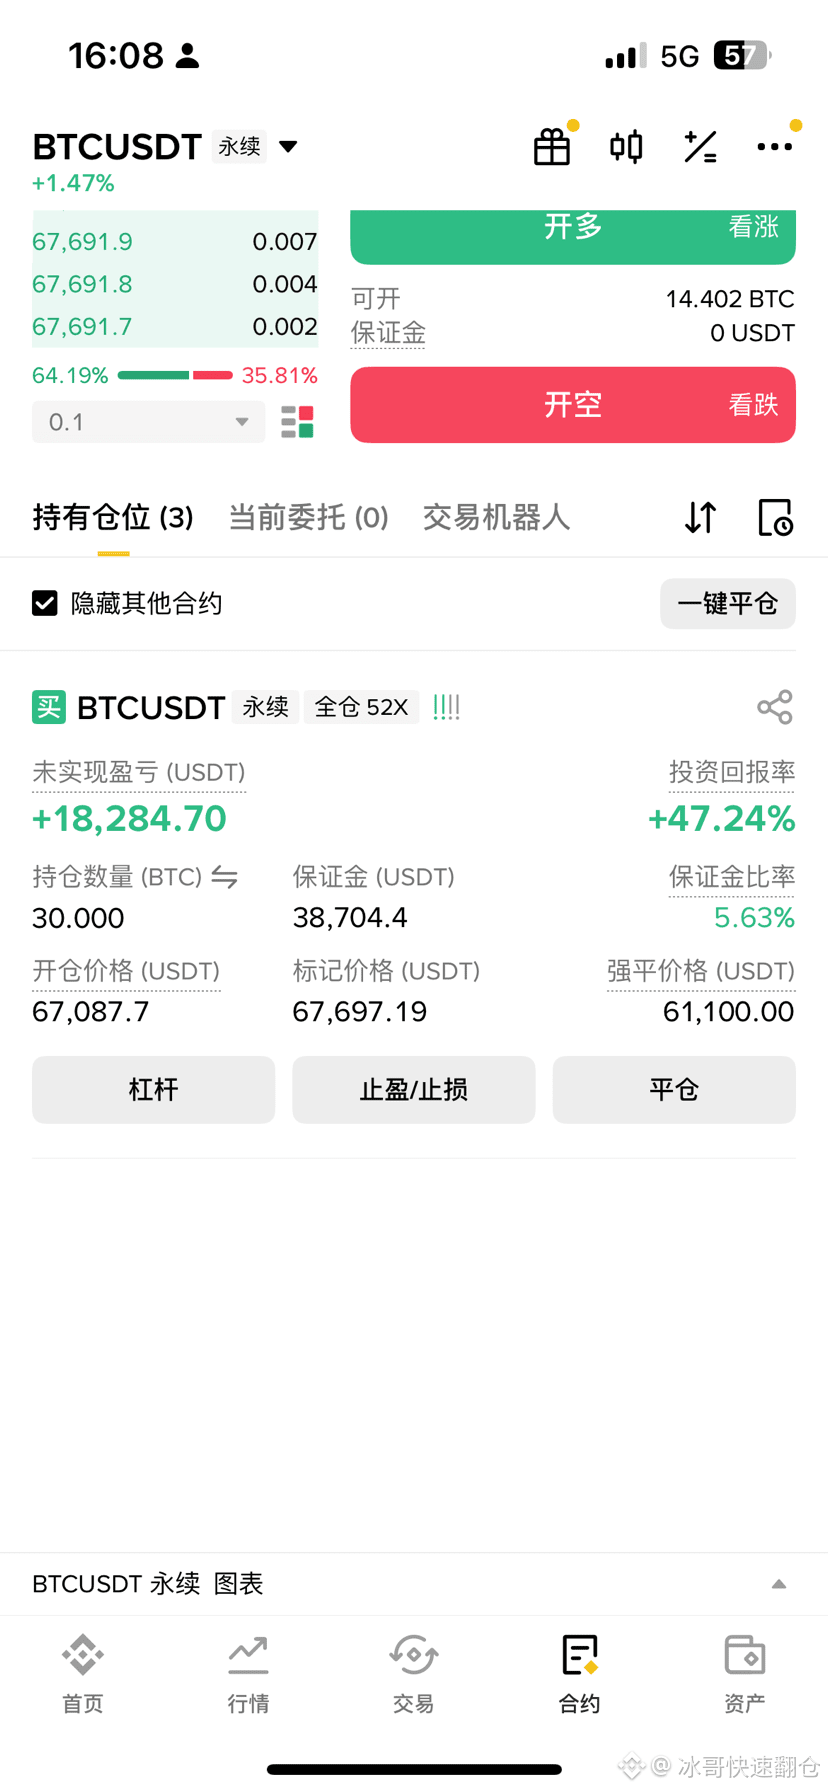
Opened for 4 hours, currently profitable 18,000 USD! Continue to hold, looking up to 69,000!
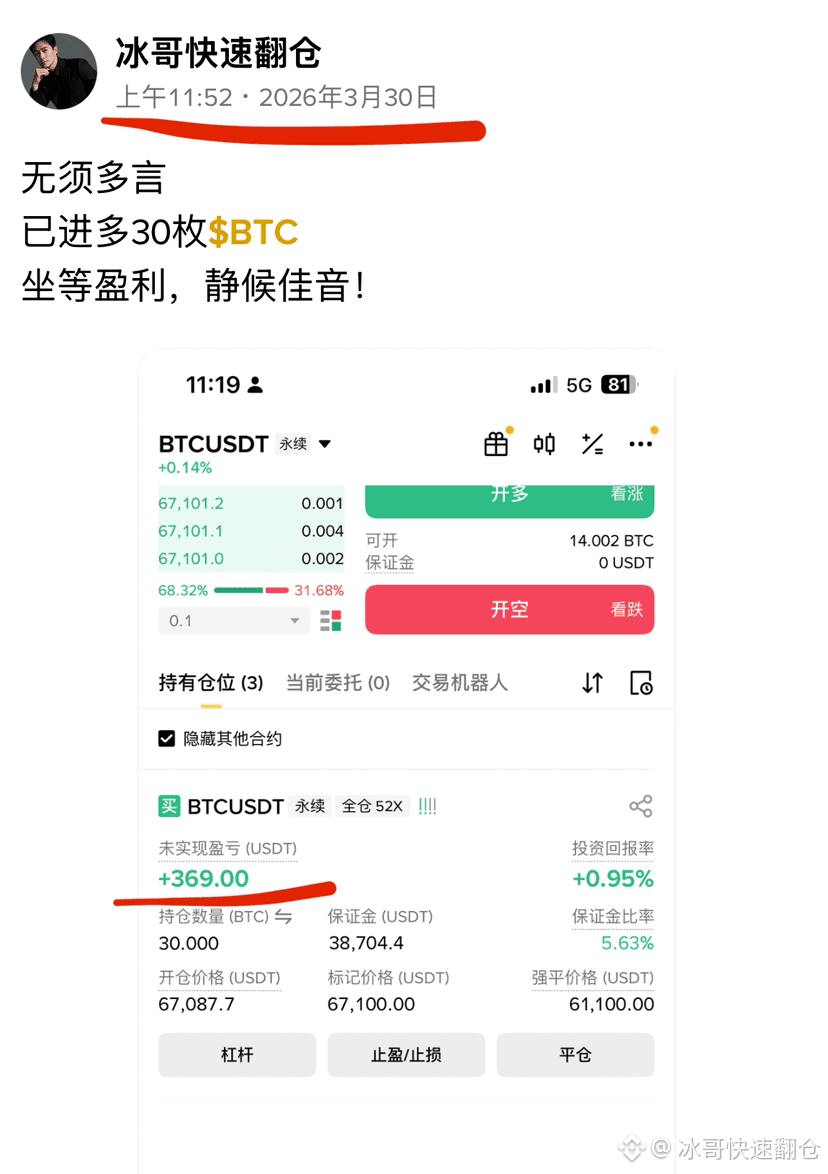
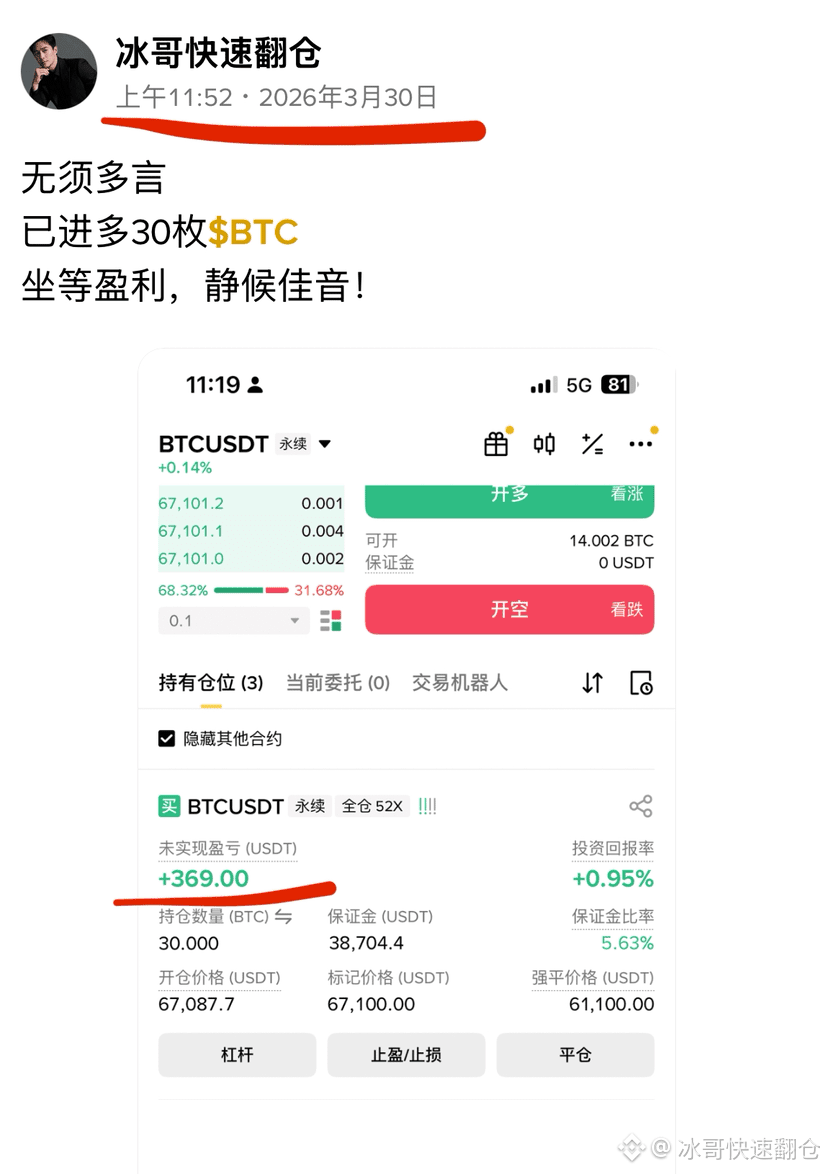
No need for more words
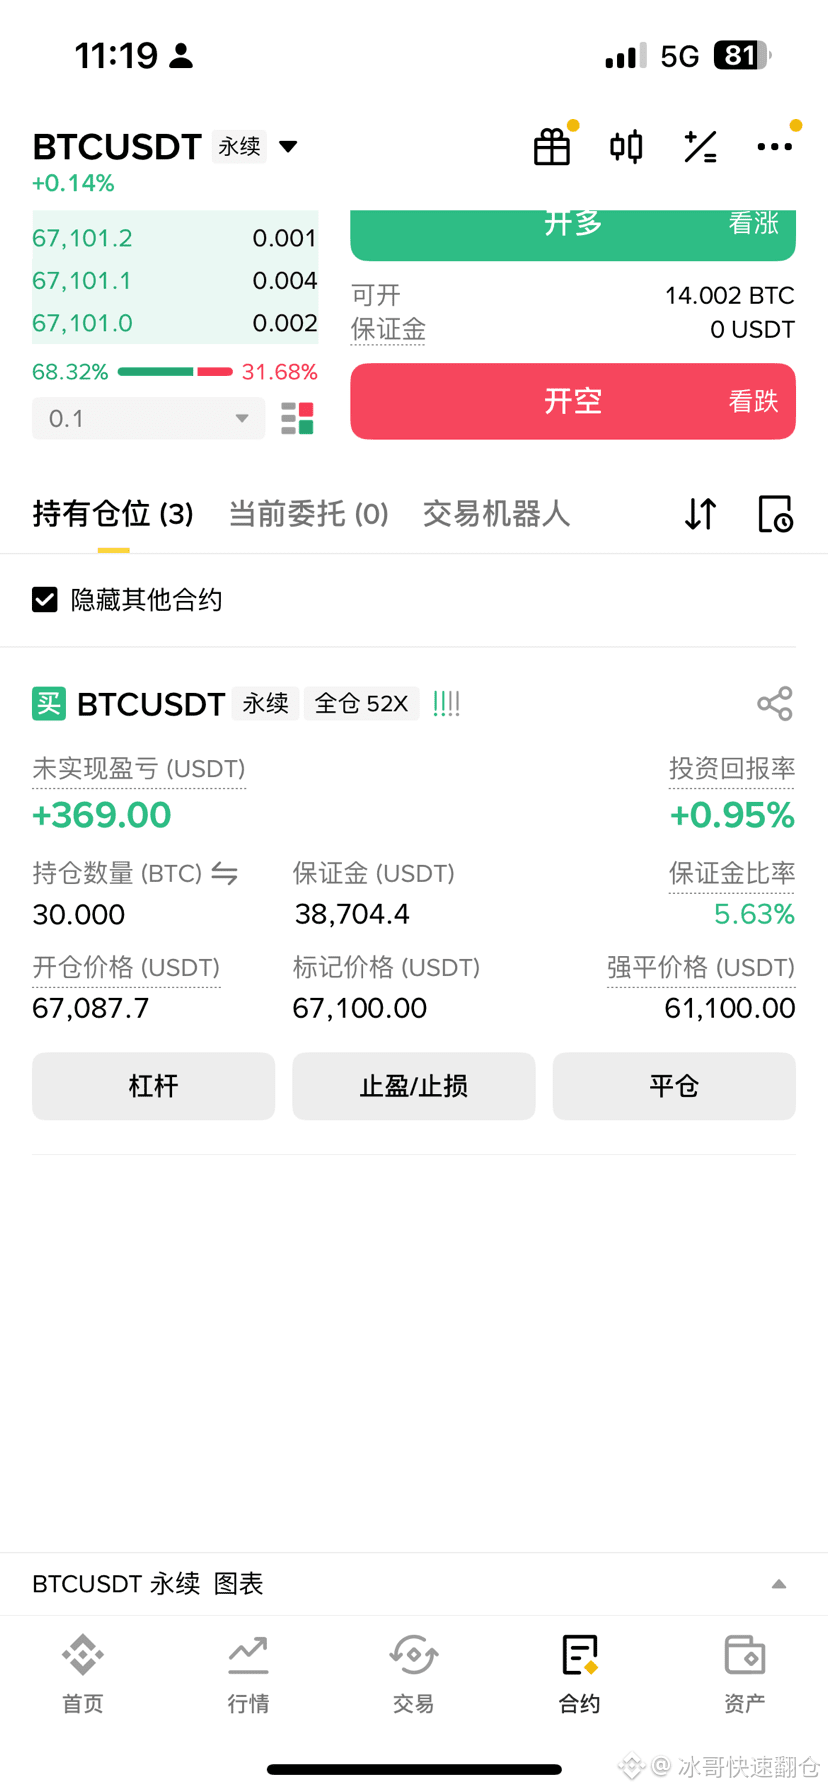
Already in more than 30 pieces $BTC
Waiting for profit, patiently awaiting good news!
Already in more than 30 pieces $BTC
Waiting for profit, patiently awaiting good news!
Log in to explore more content