
Bryan Invest Crypto
11 Posts

Bryan Invest Crypto
Report
Block User
"Análisis técnico, estratégicas (DCA) y trading de futuros Construyendo patrimonio con disciplina a largo plazo."
Frequent Trader
1.4 Months
65 Following
5 Followers
16 Liked
Posts
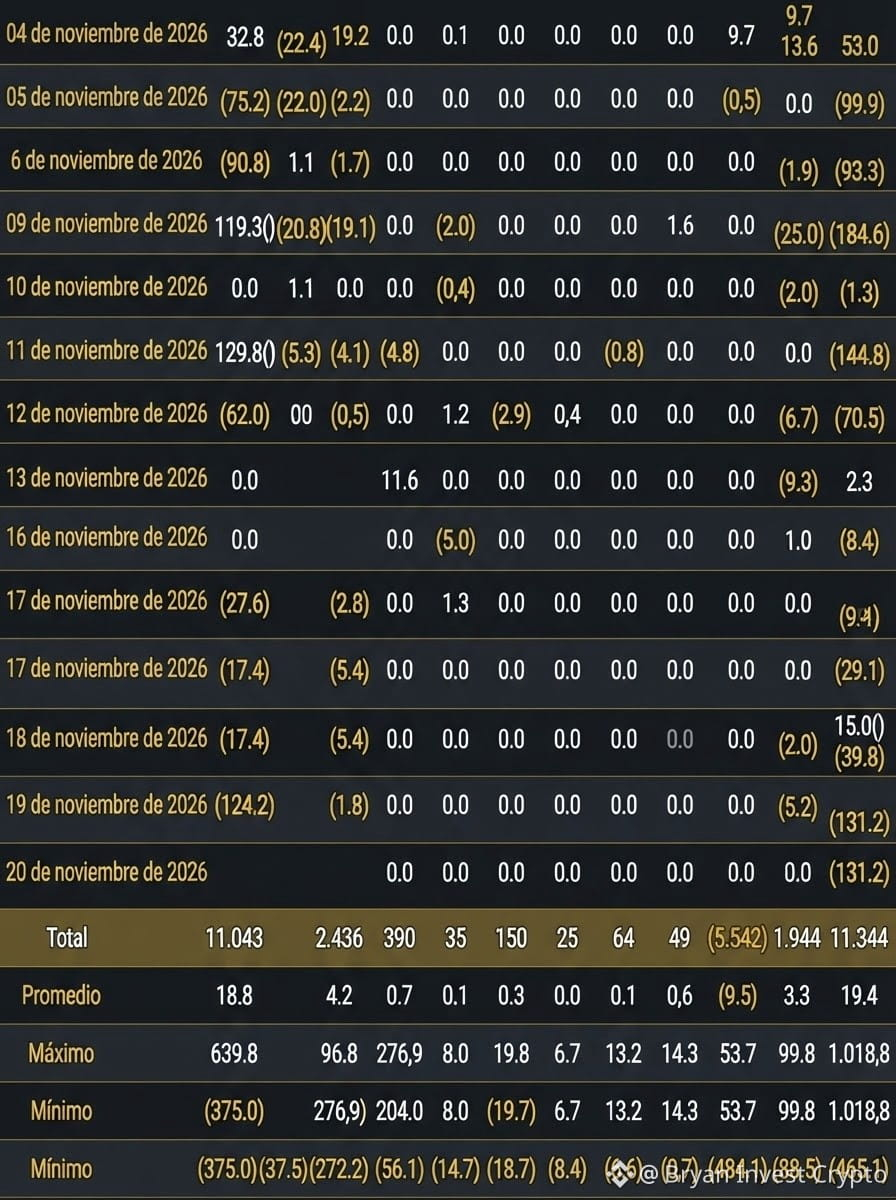
📊 Institutional Flow Analysis (November 4–19, 2026) 📉📈 Net outflows of $-68.6M, led by withdrawals on 04/11 ($-22.4 M), 05/11 ($-22.0M), and 09/11 ($-20.8M). The only notable upticks were on 06/11 ($+1.1M) and 10/11 ($+1.1M).
📈 Overview: The total cumulative figure stands at $750m (average of $4.2M; range between $96.8 M and $-37.5 M / minimum, at -37.5).
Short-term selling pressure in ETH, although the cumulative balance remains positive.
Watch for a return of inflows.
#BinanceSquare #ETH #Ethereum #Crypto #Trading
📊 Institutional Flow Analysis (November 4–19, 2026) 📉📈 Net outflows of $-68.6M, led by withdrawals on 04/11 ($-22.4 M), 05/11 ($-22.0M), and 09/11 ($-20.8M). The only notable upticks were on 06/11 ($+1.1M) and 10/11 ($+1.1M).
📈 Overview: The total cumulative figure stands at $750m (average of $4.2M; range between $96.8 M and $-37.5 M / minimum, at -37.5).
Short-term selling pressure in ETH, although the cumulative balance remains positive.
Watch for a return of inflows.
#BinanceSquare #ETH #Ethereum #Crypto #Trading
📈 Overview: The total cumulative figure stands at $750m (average of $4.2M; range between $96.8 M and $-37.5 M / minimum, at -37.5).
Short-term selling pressure in ETH, although the cumulative balance remains positive.
Watch for a return of inflows.
#BinanceSquare #ETH #Ethereum #Crypto #Trading
2
250
🚨 ETHUSDT Breakdown (1H)
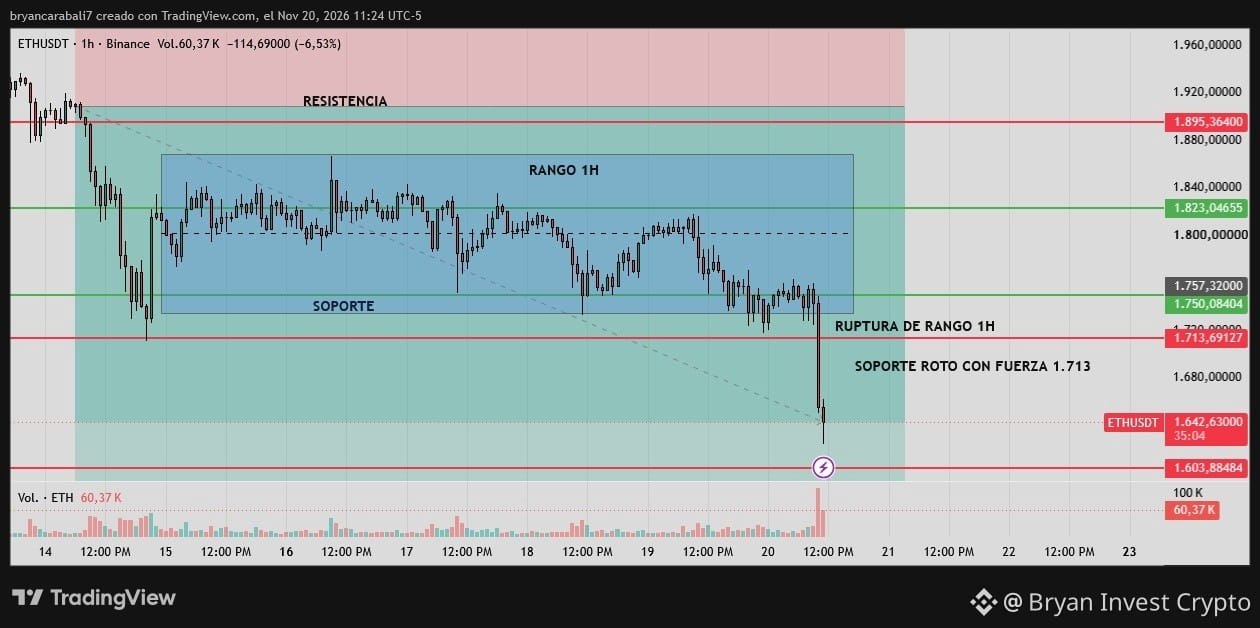
After staying in a 1H range, ETH decisively lost the 1,713.69 level amid a notable increase in volume and is trading around 1,642.63.
Next marked lower level: 1,603.88
Zones to watch above in case of a rebound: 1,713.69 / 1,750
Will the price rebound to retest 1,713, or head straight toward 1,603? 👇
#ETHUSDT #Crypto #TradingView #Binance
🚨 ETHUSDT Breakdown (1H)
After staying in a 1H range, ETH decisively lost the 1,713.69 level amid a notable increase in volume and is trading around 1,642.63.
Next marked lower level: 1,603.88
Zones to watch above in case of a rebound: 1,713.69 / 1,750
Will the price rebound to retest 1,713, or head straight toward 1,603? 👇
#ETHUSDT #Crypto #TradingView #Binance
After staying in a 1H range, ETH decisively lost the 1,713.69 level amid a notable increase in volume and is trading around 1,642.63.
Next marked lower level: 1,603.88
Zones to watch above in case of a rebound: 1,713.69 / 1,750
Will the price rebound to retest 1,713, or head straight toward 1,603? 👇
#ETHUSDT #Crypto #TradingView #Binance
1
355
A trader doesn’t need much capital to trade. What matters is clearly defining your risk—how much you’re willing to lose. Risk a little and earn more.
Example with a $10 margin
Capital: $100
Lot size: 0.02, equivalent to $0.20
Margin: $10
Leverage: ×20
Position: $200
Risk/reward: 1:2
Favorable 2% move: +$4
Unfavorable 1% move: -$2
Stop loss
Don’t think you’re a Super Saiyan who’ll earn more just by having more capital. Consistency and discipline matter in the long run. Stick to your system and keep climbing the mountain ⛰️ one step at a time.
Learn: 📚 Smart Money Concepts (SMC) and
Order Flow
Blessings
A trader doesn’t need much capital to trade. What matters is clearly defining your risk—how much you’re willing to lose. Risk a little and earn more.
Example with a $10 margin
Capital: $100
Lot size: 0.02, equivalent to $0.20
Margin: $10
Leverage: ×20
Position: $200
Risk/reward: 1:2
Favorable 2% move: +$4
Unfavorable 1% move: -$2
Stop loss
Don’t think you’re a Super Saiyan who’ll earn more just by having more capital. Consistency and discipline matter in the long run. Stick to your system and keep climbing the mountain ⛰️ one step at a time.
Learn: 📚 Smart Money Concepts (SMC) and
Order Flow
Blessings
Example with a $10 margin
Capital: $100
Lot size: 0.02, equivalent to $0.20
Margin: $10
Leverage: ×20
Position: $200
Risk/reward: 1:2
Favorable 2% move: +$4
Unfavorable 1% move: -$2
Stop loss
Don’t think you’re a Super Saiyan who’ll earn more just by having more capital. Consistency and discipline matter in the long run. Stick to your system and keep climbing the mountain ⛰️ one step at a time.
Learn: 📚 Smart Money Concepts (SMC) and
Order Flow
Blessings

3
227
📊 Quick Analysis: ETH/USDT (1H)
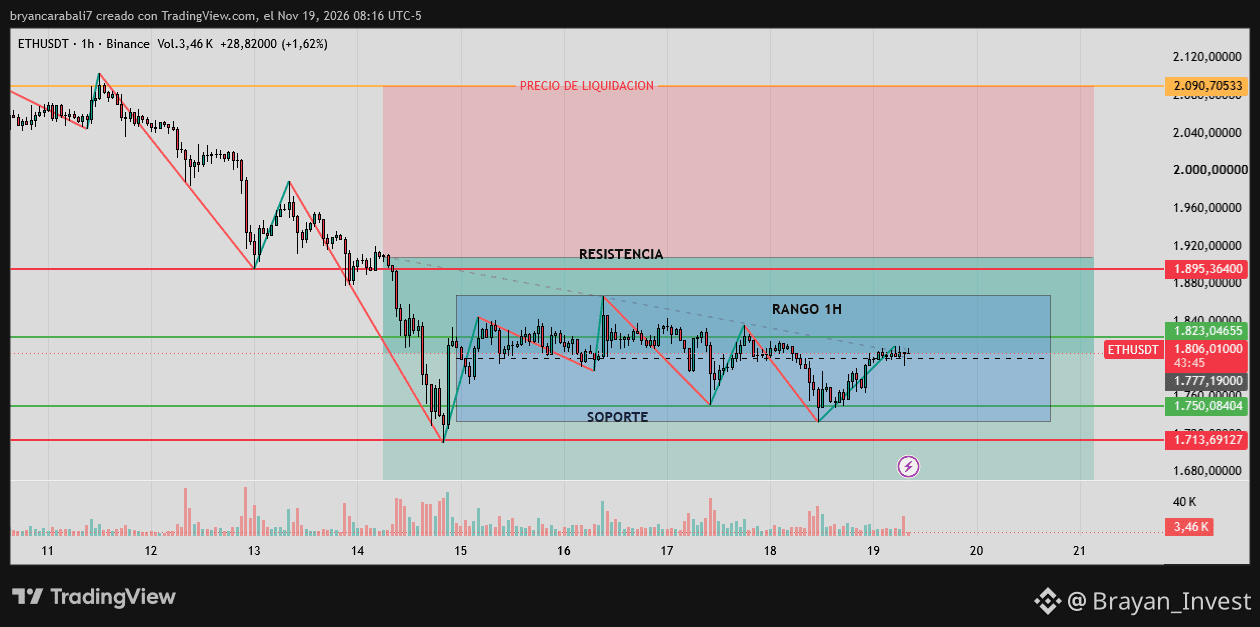
Ethereum is currently consolidating within a clear accumulation/sideways range structure on the 1-hour timeframe, after coming from a prior bearish impulse.
Current Price: ~$1.806 USDT
Range Top (Resistance): $1.868 USDT (with a key higher resistance at $1.895)
Range Bottom (Support): $1.734 USDT (strong liquidity zone around $1.750 - $1.713)
🔍 Scenarios to watch:
Rejection in the mid/high zone: The price is testing the internal bearish trendline and the immediate resistance at $1.823. If it fails to consolidate above that level, it is very likely to seek liquidity again toward the support at $1.750 - $1.734.
Bullish breakout (BOS): If it manages to break the bearish trendline with volume and overcome $1.868, the next natural technical target will be in the $1.895 - $1.900 zone.
⚠️ Trading within ranges requires patience: wait for confirmations at the extremes ($1.868 or $1.734) and manage your risk well.
#ETH #ETHUSDT #Trading #CryptoAnalysis #BinanceSquare $ETH
{future}(ETHUSDT)
📊 Quick Analysis: ETH/USDT (1H)
Ethereum is currently consolidating within a clear accumulation/sideways range structure on the 1-hour timeframe, after coming from a prior bearish impulse.
Current Price: ~$1.806 USDT
Range Top (Resistance): $1.868 USDT (with a key higher resistance at $1.895)
Range Bottom (Support): $1.734 USDT (strong liquidity zone around $1.750 - $1.713)
🔍 Scenarios to watch:
Rejection in the mid/high zone: The price is testing the internal bearish trendline and the immediate resistance at $1.823. If it fails to consolidate above that level, it is very likely to seek liquidity again toward the support at $1.750 - $1.734.
Bullish breakout (BOS): If it manages to break the bearish trendline with volume and overcome $1.868, the next natural technical target will be in the $1.895 - $1.900 zone.
⚠️ Trading within ranges requires patience: wait for confirmations at the extremes ($1.868 or $1.734) and manage your risk well.
#ETH #ETHUSDT #Trading #CryptoAnalysis #BinanceSquare $ETH
Ethereum is currently consolidating within a clear accumulation/sideways range structure on the 1-hour timeframe, after coming from a prior bearish impulse.
Current Price: ~$1.806 USDT
Range Top (Resistance): $1.868 USDT (with a key higher resistance at $1.895)
Range Bottom (Support): $1.734 USDT (strong liquidity zone around $1.750 - $1.713)
🔍 Scenarios to watch:
Rejection in the mid/high zone: The price is testing the internal bearish trendline and the immediate resistance at $1.823. If it fails to consolidate above that level, it is very likely to seek liquidity again toward the support at $1.750 - $1.734.
Bullish breakout (BOS): If it manages to break the bearish trendline with volume and overcome $1.868, the next natural technical target will be in the $1.895 - $1.900 zone.
⚠️ Trading within ranges requires patience: wait for confirmations at the extremes ($1.868 or $1.734) and manage your risk well.
#ETH #ETHUSDT #Trading #CryptoAnalysis #BinanceSquare $ETH
1
100
⚡ BINANCE | EPIC BATTLE: BUYERS VS. SELLERS IN A RANGE 🥊
The ETH/USDT market is holding within a narrow sideways range. Bulls are strongly defending the lower zone while bears are applying pressure from above.
🟢 Key Support: $1,780
🔴 Key Resistance: $1,850
📊 Current Price: Fluctuating between $1,780 and $1,850
The market is showing high intraday volatility within this narrow range. Stay alert for a potential breakout!
Who will win the battle and break out of this range? Share your analysis in the comments! 👇
#Ethereum #ETH #BinanceSquare #CryptoTrading #AnalisisTecnico
⚡ BINANCE | EPIC BATTLE: BUYERS VS. SELLERS IN A RANGE 🥊
The ETH/USDT market is holding within a narrow sideways range. Bulls are strongly defending the lower zone while bears are applying pressure from above.
🟢 Key Support: $1,780
🔴 Key Resistance: $1,850
📊 Current Price: Fluctuating between $1,780 and $1,850
The market is showing high intraday volatility within this narrow range. Stay alert for a potential breakout!
Who will win the battle and break out of this range? Share your analysis in the comments! 👇
#Ethereum #ETH #BinanceSquare #CryptoTrading #AnalisisTecnico
The ETH/USDT market is holding within a narrow sideways range. Bulls are strongly defending the lower zone while bears are applying pressure from above.
🟢 Key Support: $1,780
🔴 Key Resistance: $1,850
📊 Current Price: Fluctuating between $1,780 and $1,850
The market is showing high intraday volatility within this narrow range. Stay alert for a potential breakout!
Who will win the battle and break out of this range? Share your analysis in the comments! 👇
#Ethereum #ETH #BinanceSquare #CryptoTrading #AnalisisTecnico

2
76
📉 Flow Analysis: What’s Happening with Spot Ethereum ETFs in November
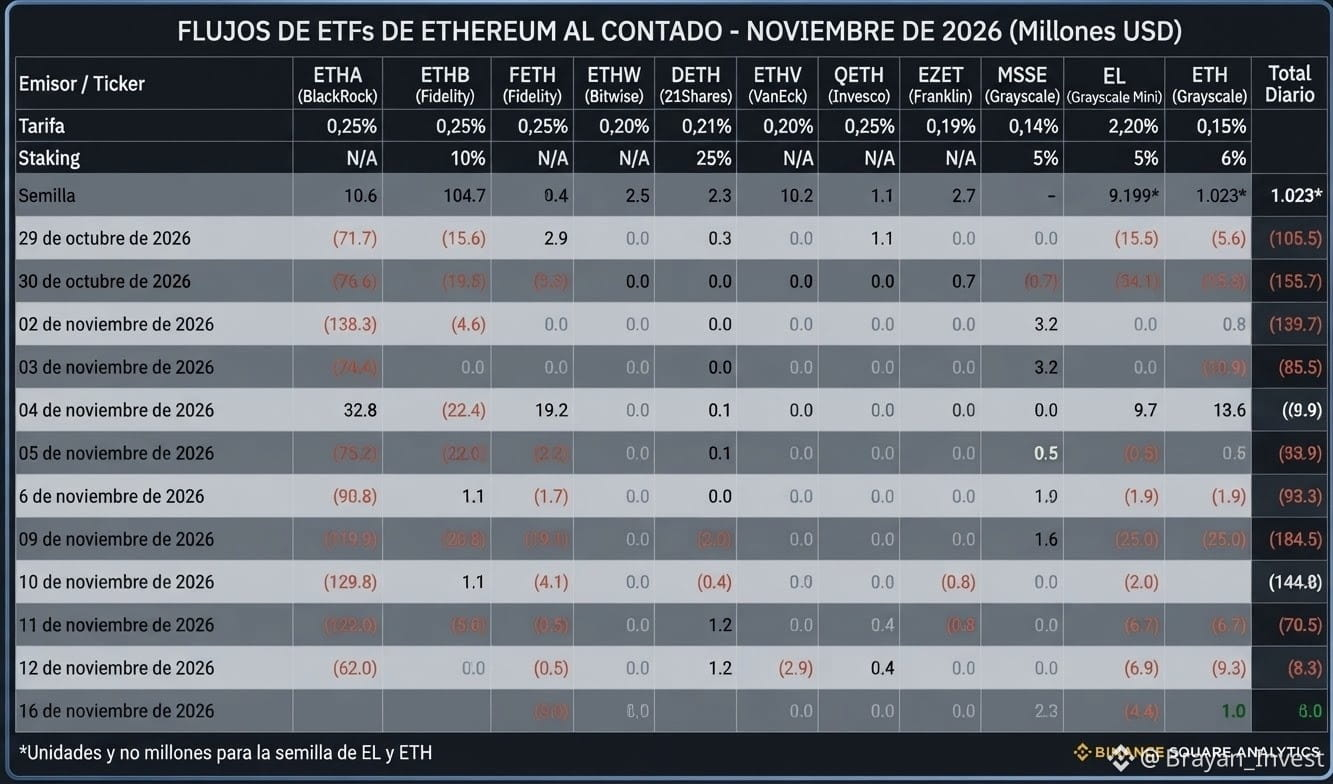
Institutional activity in spot Ethereum ETFs shows a clear phase of caution and predominant selling pressure during the first weeks of November 2026.
Overwhelming dominance of outflows: Days with heavy liquidations far outnumber those with net inflows. Days such as November 9 (-$184.6M), October 30 (-$155.7M), and November 11 (-$144.8M) reflect a significant short-term decline in institutional risk appetite.
The heavyweight leads the outflows: ETHA (BlackRock), despite being one of the largest funds, has seen the biggest individual liquidations in several key sessions (for example, -138.3M on November 2 and -129.8M on November 11), setting the tone for overall institutional market sentiment.
Very brief respites: Positive net inflows have been scarce and low in volume (such as +$53.0M on November 4 or a marginal +$2.3M on November 13), showing that institutional capital prefers to stay on the sidelines or secure liquidity rather than aggressively accumulate at these levels.
Market Outlook (Smart Money / Structure): This bearish dynamic in ETF flows coincides with periods of correction or macroeconomic indecision in ETH price action. As long as flows continue to record steady net outflows, organic bullish momentum in the spot market will be held back, requiring patience and close monitoring of key technical support levels.
💡 Do you think the market will find a floor soon and reverse these red numbers, or will we see institutional outflows continue? Let me know in the comments! 👇
#Ethereum #ETH #ETFs #CryptoAnalysis #SmartMoney #BinanceSquare
📉 Flow Analysis: What’s Happening with Spot Ethereum ETFs in November
Institutional activity in spot Ethereum ETFs shows a clear phase of caution and predominant selling pressure during the first weeks of November 2026.
Overwhelming dominance of outflows: Days with heavy liquidations far outnumber those with net inflows. Days such as November 9 (-$184.6M), October 30 (-$155.7M), and November 11 (-$144.8M) reflect a significant short-term decline in institutional risk appetite.
The heavyweight leads the outflows: ETHA (BlackRock), despite being one of the largest funds, has seen the biggest individual liquidations in several key sessions (for example, -138.3M on November 2 and -129.8M on November 11), setting the tone for overall institutional market sentiment.
Very brief respites: Positive net inflows have been scarce and low in volume (such as +$53.0M on November 4 or a marginal +$2.3M on November 13), showing that institutional capital prefers to stay on the sidelines or secure liquidity rather than aggressively accumulate at these levels.
Market Outlook (Smart Money / Structure): This bearish dynamic in ETF flows coincides with periods of correction or macroeconomic indecision in ETH price action. As long as flows continue to record steady net outflows, organic bullish momentum in the spot market will be held back, requiring patience and close monitoring of key technical support levels.
💡 Do you think the market will find a floor soon and reverse these red numbers, or will we see institutional outflows continue? Let me know in the comments! 👇
#Ethereum #ETH #ETFs #CryptoAnalysis #SmartMoney #BinanceSquare
Institutional activity in spot Ethereum ETFs shows a clear phase of caution and predominant selling pressure during the first weeks of November 2026.
Overwhelming dominance of outflows: Days with heavy liquidations far outnumber those with net inflows. Days such as November 9 (-$184.6M), October 30 (-$155.7M), and November 11 (-$144.8M) reflect a significant short-term decline in institutional risk appetite.
The heavyweight leads the outflows: ETHA (BlackRock), despite being one of the largest funds, has seen the biggest individual liquidations in several key sessions (for example, -138.3M on November 2 and -129.8M on November 11), setting the tone for overall institutional market sentiment.
Very brief respites: Positive net inflows have been scarce and low in volume (such as +$53.0M on November 4 or a marginal +$2.3M on November 13), showing that institutional capital prefers to stay on the sidelines or secure liquidity rather than aggressively accumulate at these levels.
Market Outlook (Smart Money / Structure): This bearish dynamic in ETF flows coincides with periods of correction or macroeconomic indecision in ETH price action. As long as flows continue to record steady net outflows, organic bullish momentum in the spot market will be held back, requiring patience and close monitoring of key technical support levels.
💡 Do you think the market will find a floor soon and reverse these red numbers, or will we see institutional outflows continue? Let me know in the comments! 👇
#Ethereum #ETH #ETFs #CryptoAnalysis #SmartMoney #BinanceSquare
2
136
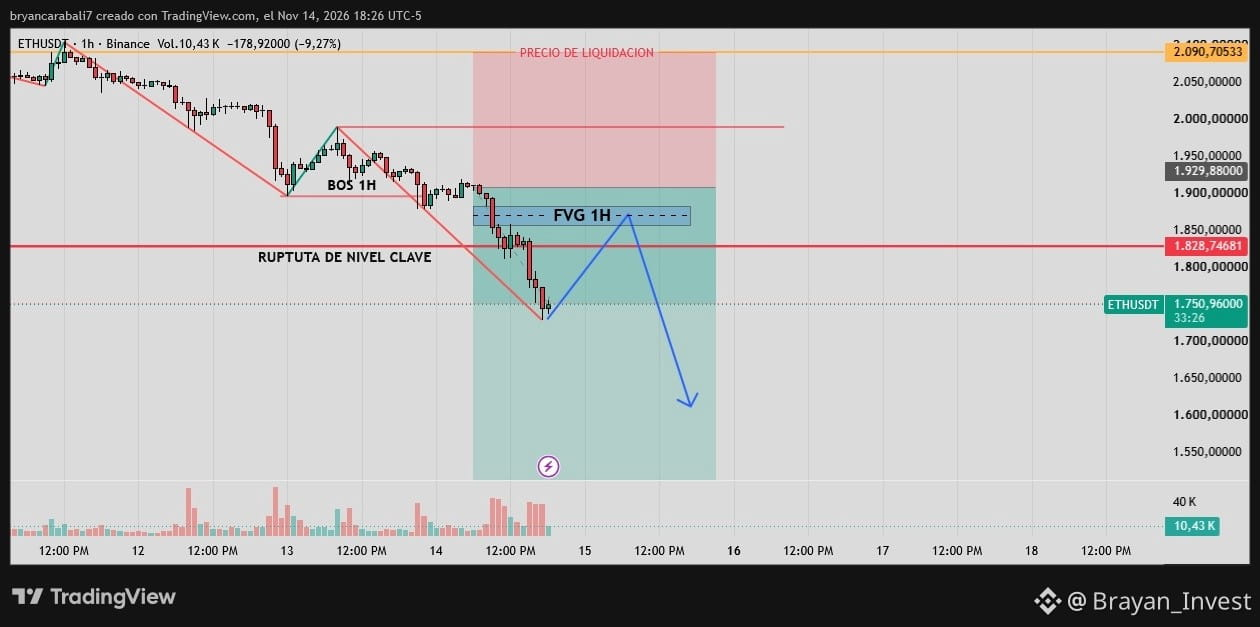
1H Technical Analysis – Bearish Continuation After Bounce to the FVG
📉 Outlook: Bearish (Short)
⏱ Timeframe: 1 Hour (1h)
🪙 Asset: ETH / USDT
🔍 Chart Analysis:
Market Structure (BOS 1H): Following a sharp drop and a bearish structural break (BOS 1H), the price has maintained a clear downtrend, breaking through previous key support levels.
Area of Interest (FVG 1H): The price is currently trading around 1,750 USD. A possible corrective upward move (pullback) toward the imbalance zone or Fair Value Gap (FVG 1H) in the upper range is projected.
Price Projection: The main hypothesis is that after mitigating the FVG and retesting the break of the key level (red zone around ~1,828 USD), the price will face strong selling pressure and continue the main downtrend in search of lower targets (toward the 1,600–1,650 USD zone).
💡 What do you think of this move for ETH? Are you expecting a retest of the FVG or a direct drop? Leave your thoughts in the comments!
#Ethereum #ETHUSDT #Trading #TechnicalAnalysis #Crypto #BinanceFeed
1H Technical Analysis – Bearish Continuation After Bounce to the FVG
📉 Outlook: Bearish (Short)
⏱ Timeframe: 1 Hour (1h)
🪙 Asset: ETH / USDT
🔍 Chart Analysis:
Market Structure (BOS 1H): Following a sharp drop and a bearish structural break (BOS 1H), the price has maintained a clear downtrend, breaking through previous key support levels.
Area of Interest (FVG 1H): The price is currently trading around 1,750 USD. A possible corrective upward move (pullback) toward the imbalance zone or Fair Value Gap (FVG 1H) in the upper range is projected.
Price Projection: The main hypothesis is that after mitigating the FVG and retesting the break of the key level (red zone around ~1,828 USD), the price will face strong selling pressure and continue the main downtrend in search of lower targets (toward the 1,600–1,650 USD zone).
💡 What do you think of this move for ETH? Are you expecting a retest of the FVG or a direct drop? Leave your thoughts in the comments!
#Ethereum #ETHUSDT #Trading #TechnicalAnalysis #Crypto #BinanceFeed
📉 Outlook: Bearish (Short)
⏱ Timeframe: 1 Hour (1h)
🪙 Asset: ETH / USDT
🔍 Chart Analysis:
Market Structure (BOS 1H): Following a sharp drop and a bearish structural break (BOS 1H), the price has maintained a clear downtrend, breaking through previous key support levels.
Area of Interest (FVG 1H): The price is currently trading around 1,750 USD. A possible corrective upward move (pullback) toward the imbalance zone or Fair Value Gap (FVG 1H) in the upper range is projected.
Price Projection: The main hypothesis is that after mitigating the FVG and retesting the break of the key level (red zone around ~1,828 USD), the price will face strong selling pressure and continue the main downtrend in search of lower targets (toward the 1,600–1,650 USD zone).
💡 What do you think of this move for ETH? Are you expecting a retest of the FVG or a direct drop? Leave your thoughts in the comments!
#Ethereum #ETHUSDT #Trading #TechnicalAnalysis #Crypto #BinanceFeed
2
106
Log in to explore more content
Join global crypto users on Binance Square
⚡️ Get latest and useful information about crypto.
💬 Trusted by the world’s largest crypto exchange.
👍 Discover real insights from verified creators.
Email / Phone number
Trending Topics
CanBTCReboundAfterFallingBelow60K?
138,954 views
583 Discussing
Bitcoin News | Bitcoin Falls Below $60,000 for the First Time Since July as IBIT Posts Record $541 Million Outflow
Binance News
·41 Likes
·74.2k views
GlobalStocksFaceLongestLosingStreakSince2023
58,584 views
545 Discussing
AnthropicPlungesTowardIPOPriceonDay2
20,918 views
230 Discussing