
TVBee
1.5k Posts

TVBee
 Square Verified
Creator of the Year

原创之星
Open Trade
Frequent Trader
7.3 Years
229 Following
8.8K+ Followers
8.4K+ Liked
2 Badges
Posts
Portfolio
All
Quotes
Videos
Live
BTC feels like this: it doesn’t want to fall, but it also doesn’t dare to rise.
Since August 27, the USDT market cap has been fluctuating within a certain range.
There’s no clear inflow of funds, but for now there’s also no obvious outflow. (There is slightly some outflow, and USDT has a slightly negative premium trend, but it’s not significant.)
The CPI data this Friday may meet expectations or even come in below expectations, but it still might not show a clear downward trend—so it may not be able to provide a definite answer on whether the Fed will hold or raise rates.
Brother Feng doesn’t think the Fed will hike rates in September. But the dot plot is likely to be hawkish; the chance of it being dovish is low.
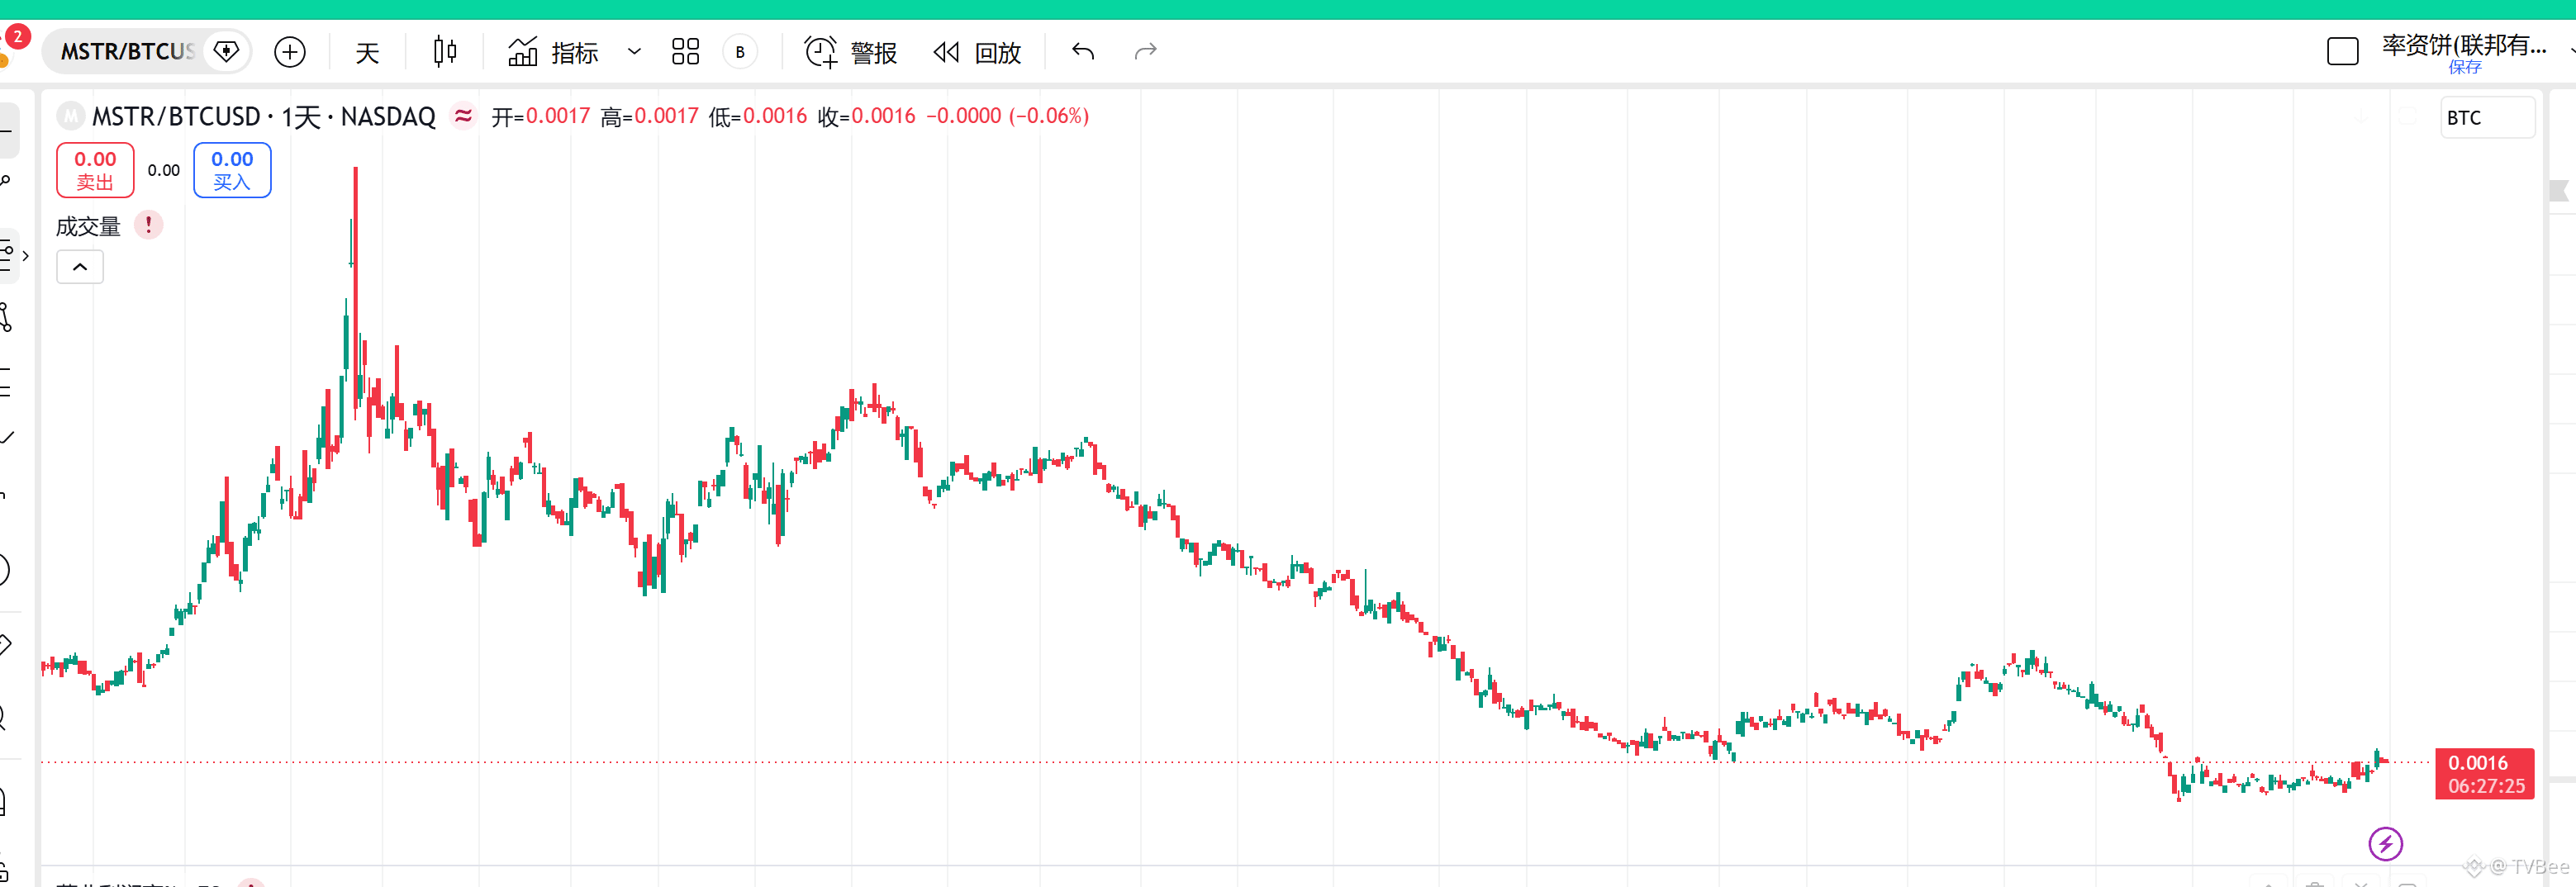
So for now, we’ll treat it as a range. I set up an LP for MSTR between $120 and 165. If it breaks below 120, I’ll just hold it. Even if the bear market hasn’t ended, and even if there’s still a third dip, without a liquidity black-swan event, the third dip probably won’t go very low.
If it moves up in a one-way rally, then you’d end up selling all the way up until 165—missing out on the upside—but that’s still better than being left out of the trade, and this scenario is unlikely in the short term.
With range-bound movement, you’re just right to earn trading fees.
Since August 27, the USDT market cap has been fluctuating within a certain range.
There’s no clear inflow of funds, but for now there’s also no obvious outflow. (There is slightly some outflow, and USDT has a slightly negative premium trend, but it’s not significant.)
The CPI data this Friday may meet expectations or even come in below expectations, but it still might not show a clear downward trend—so it may not be able to provide a definite answer on whether the Fed will hold or raise rates.
Brother Feng doesn’t think the Fed will hike rates in September. But the dot plot is likely to be hawkish; the chance of it being dovish is low.
So for now, we’ll treat it as a range. I set up an LP for MSTR between $120 and 165. If it breaks below 120, I’ll just hold it. Even if the bear market hasn’t ended, and even if there’s still a third dip, without a liquidity black-swan event, the third dip probably won’t go very low.
If it moves up in a one-way rally, then you’d end up selling all the way up until 165—missing out on the upside—but that’s still better than being left out of the trade, and this scenario is unlikely in the short term.
With range-bound movement, you’re just right to earn trading fees.


Recently, it can be said that the on-chain chaos has been in full swing
Old guard: Solana
Middle guard: BSC
New guard: Robinhood
◆ The old-guard chain’s total DEX trading volume over the past 7 days was $13.935 billion, with no particularly new narratives or MEMEs.
◆ The middle-guard chain’s total DEX trading volume over the past 7 days was $8.254 billion, and its characteristic is the emergence of a breakout MEME, “Niu Lai.”
◆ The new-guard chain’s total DEX trading volume over the past 7 days was $10.424 billion. Its characteristic is that, apart from the platform token $PONS , there does not seem to be any particularly breakout MEME, but its overall scale and influence are larger.
Moreover, funds are flowing frequently among ecosystems. Over the past week, in deBridge cross-chain fund flows:
◆ Solana↔BSC:
$1,969,521 flowed from Solana to BSC,
$1,548,777 flowed from BSC to Solana,
BSC received a net inflow from Solana of $420.7k.
◆ Solana↔Robinhook:
$15,177,756 flowed from Solana to Robinhook,
$10,824,517 flowed from Robinhook to Solana,
Robinhook received a net inflow from Solana of $4.3532M.
◆ BSC↔Robinhook:
$1,392,327 flowed from BSC to Robinhook,
$2,214,221 flowed from Robinhook to BSC,
BSC received a net inflow from Robinhook of $801.9k.
In addition, deBridge also recorded $4.4111M in internal transactions on the Robinhook chain and $484.6k in internal transactions on the BSC chain.
Overall:
The old-guard Solana still has a very large trading scale, but there is a certain outflow trend;
The middle-guard BSC has a relatively small trading scale, but there is a slight inflow trend;
The new-guard Robinhood has a medium trading scale, with both inflow and outflow trends, but inflow is dominant.
What do you think, can the new guard’s trading volume surpass the old guard’s?
Old guard: Solana
Middle guard: BSC
New guard: Robinhood
◆ The old-guard chain’s total DEX trading volume over the past 7 days was $13.935 billion, with no particularly new narratives or MEMEs.
◆ The middle-guard chain’s total DEX trading volume over the past 7 days was $8.254 billion, and its characteristic is the emergence of a breakout MEME, “Niu Lai.”
◆ The new-guard chain’s total DEX trading volume over the past 7 days was $10.424 billion. Its characteristic is that, apart from the platform token $PONS , there does not seem to be any particularly breakout MEME, but its overall scale and influence are larger.
Moreover, funds are flowing frequently among ecosystems. Over the past week, in deBridge cross-chain fund flows:
◆ Solana↔BSC:
$1,969,521 flowed from Solana to BSC,
$1,548,777 flowed from BSC to Solana,
BSC received a net inflow from Solana of $420.7k.
◆ Solana↔Robinhook:
$15,177,756 flowed from Solana to Robinhook,
$10,824,517 flowed from Robinhook to Solana,
Robinhook received a net inflow from Solana of $4.3532M.
◆ BSC↔Robinhook:
$1,392,327 flowed from BSC to Robinhook,
$2,214,221 flowed from Robinhook to BSC,
BSC received a net inflow from Robinhook of $801.9k.
In addition, deBridge also recorded $4.4111M in internal transactions on the Robinhook chain and $484.6k in internal transactions on the BSC chain.
Overall:
The old-guard Solana still has a very large trading scale, but there is a certain outflow trend;
The middle-guard BSC has a relatively small trading scale, but there is a slight inflow trend;
The new-guard Robinhood has a medium trading scale, with both inflow and outflow trends, but inflow is dominant.
What do you think, can the new guard’s trading volume surpass the old guard’s?

Coinbase's order book makes BTC seem not very optimistic right now.
Feng has also been continuously watching Coinbase's BTC order book. After last night's non-farm payroll data was released and expectations for rate hikes rose, the buy orders on Coinbase did indeed become stronger.
However, starting around the second half of the night,
the sell side became a bit steeper.
Below 81,000, there are a total of about 411 BTC in sell orders.
But above 78,260, there are a total of about 270 BTC in buy orders.
Feng has been monitoring this continuously. From late last night, through this afternoon and into the evening, it has basically been in this state.
Feng has also been continuously watching Coinbase's BTC order book. After last night's non-farm payroll data was released and expectations for rate hikes rose, the buy orders on Coinbase did indeed become stronger.
However, starting around the second half of the night,
the sell side became a bit steeper.
Below 81,000, there are a total of about 411 BTC in sell orders.
But above 78,260, there are a total of about 270 BTC in buy orders.
Feng has been monitoring this continuously. From late last night, through this afternoon and into the evening, it has basically been in this state.

Verified
Stay calm! Stay calm! Just take a look at the non-farm payroll data!
August non-farm payrolls far exceeded expectations, with forecasts at 550,000, the previous figure at -230,000, and the actual number at 1.62 million.
BTC fell on the news.
Brother Feng just said that the U.S. is in a midterm election market and needs to create prosperity. So non-farm payrolls definitely can’t be too low.
Don’t forget the downward trend in ADP’s small non-farm data. The non-farm figures will most likely be revised down later.
The unemployment rate stayed unchanged, and the labor force participation rate increased. Same logic — all for the sake of “prosperity.”
On the other hand, the wage data was not very favorable. The annual wage growth exceeded expectations, and the monthly growth matched expectations but was above the previous value. This is not very good for CPI.
But in order to maintain “prosperity,” I guess August CPI won’t be bad either.
The Federal Reserve is not going to raise rates just because of one month of employment data in August.
And don’t forget, Waller said in his speech last night that he would look at August CPI data to consider whether to support a rate hike — he didn’t mention non-farm payrolls at all!
August non-farm payrolls far exceeded expectations, with forecasts at 550,000, the previous figure at -230,000, and the actual number at 1.62 million.
BTC fell on the news.
Brother Feng just said that the U.S. is in a midterm election market and needs to create prosperity. So non-farm payrolls definitely can’t be too low.
Don’t forget the downward trend in ADP’s small non-farm data. The non-farm figures will most likely be revised down later.
The unemployment rate stayed unchanged, and the labor force participation rate increased. Same logic — all for the sake of “prosperity.”
On the other hand, the wage data was not very favorable. The annual wage growth exceeded expectations, and the monthly growth matched expectations but was above the previous value. This is not very good for CPI.
But in order to maintain “prosperity,” I guess August CPI won’t be bad either.
The Federal Reserve is not going to raise rates just because of one month of employment data in August.
And don’t forget, Waller said in his speech last night that he would look at August CPI data to consider whether to support a rate hike — he didn’t mention non-farm payrolls at all!

TVBee
·
--
How do you think the bear market still hasn’t ended?
┈➤Let’s start with a casual take
In principle, each bear market should lead people to realize something. Last round’s takeaway was that “copycat” coins were the ones to cut others—i.e., people got harvested.
But now it looks like it’s still MEMEs. Has the narrative really not changed at all? Did this round end up teaching us nothing?
┈➤Now another serious viewpoint
Also, let’s talk about a serious point: we’re currently in the middle of an election cycle, and that has brought about a round of market activity.
The U.S. House and Senate are both up for elections: the entire House is being re-elected, and one-third of the Senate is being re-elected.
However, the Treasury Department, the Department of Labor, the Department of Commerce… these 15 cabinet-level executive departments haven’t been replaced. They’re still led by Trump.
Although institutions like the Federal Reserve and the SEC are, in principle, independent, most officials probably wouldn’t feel the need to “make trouble for Trump” at this particular time.
The current majority party (the Republicans) is trying to manufacture prosperity—leaving voters with one last good impression—so they can secure victory in the midterm elections.
But this kind of prosperity is temporary; it isn’t real U.S. economic prosperity.
Of course, the midterm election campaign might just be getting started:
Maybe new candidates have already started working, but right now the sitting members of the House need to return to their states in late September to focus on election work.
And the accelerated purchase of long-term bonds proposed by the Treasury Department will only begin on September 9.
┈➤Let’s start with a casual take
In principle, each bear market should lead people to realize something. Last round’s takeaway was that “copycat” coins were the ones to cut others—i.e., people got harvested.
But now it looks like it’s still MEMEs. Has the narrative really not changed at all? Did this round end up teaching us nothing?
┈➤Now another serious viewpoint
Also, let’s talk about a serious point: we’re currently in the middle of an election cycle, and that has brought about a round of market activity.
The U.S. House and Senate are both up for elections: the entire House is being re-elected, and one-third of the Senate is being re-elected.
However, the Treasury Department, the Department of Labor, the Department of Commerce… these 15 cabinet-level executive departments haven’t been replaced. They’re still led by Trump.
Although institutions like the Federal Reserve and the SEC are, in principle, independent, most officials probably wouldn’t feel the need to “make trouble for Trump” at this particular time.
The current majority party (the Republicans) is trying to manufacture prosperity—leaving voters with one last good impression—so they can secure victory in the midterm elections.
But this kind of prosperity is temporary; it isn’t real U.S. economic prosperity.
Of course, the midterm election campaign might just be getting started:
Maybe new candidates have already started working, but right now the sitting members of the House need to return to their states in late September to focus on election work.
And the accelerated purchase of long-term bonds proposed by the Treasury Department will only begin on September 9.
How do you think the bear market still hasn’t ended?
┈➤Let’s start with a casual take
In principle, each bear market should lead people to realize something. Last round’s takeaway was that “copycat” coins were the ones to cut others—i.e., people got harvested.
But now it looks like it’s still MEMEs. Has the narrative really not changed at all? Did this round end up teaching us nothing?
┈➤Now another serious viewpoint
Also, let’s talk about a serious point: we’re currently in the middle of an election cycle, and that has brought about a round of market activity.
The U.S. House and Senate are both up for elections: the entire House is being re-elected, and one-third of the Senate is being re-elected.
However, the Treasury Department, the Department of Labor, the Department of Commerce… these 15 cabinet-level executive departments haven’t been replaced. They’re still led by Trump.
Although institutions like the Federal Reserve and the SEC are, in principle, independent, most officials probably wouldn’t feel the need to “make trouble for Trump” at this particular time.
The current majority party (the Republicans) is trying to manufacture prosperity—leaving voters with one last good impression—so they can secure victory in the midterm elections.
But this kind of prosperity is temporary; it isn’t real U.S. economic prosperity.
Of course, the midterm election campaign might just be getting started:
Maybe new candidates have already started working, but right now the sitting members of the House need to return to their states in late September to focus on election work.
And the accelerated purchase of long-term bonds proposed by the Treasury Department will only begin on September 9.
┈➤Let’s start with a casual take
In principle, each bear market should lead people to realize something. Last round’s takeaway was that “copycat” coins were the ones to cut others—i.e., people got harvested.
But now it looks like it’s still MEMEs. Has the narrative really not changed at all? Did this round end up teaching us nothing?
┈➤Now another serious viewpoint
Also, let’s talk about a serious point: we’re currently in the middle of an election cycle, and that has brought about a round of market activity.
The U.S. House and Senate are both up for elections: the entire House is being re-elected, and one-third of the Senate is being re-elected.
However, the Treasury Department, the Department of Labor, the Department of Commerce… these 15 cabinet-level executive departments haven’t been replaced. They’re still led by Trump.
Although institutions like the Federal Reserve and the SEC are, in principle, independent, most officials probably wouldn’t feel the need to “make trouble for Trump” at this particular time.
The current majority party (the Republicans) is trying to manufacture prosperity—leaving voters with one last good impression—so they can secure victory in the midterm elections.
But this kind of prosperity is temporary; it isn’t real U.S. economic prosperity.
Of course, the midterm election campaign might just be getting started:
Maybe new candidates have already started working, but right now the sitting members of the House need to return to their states in late September to focus on election work.
And the accelerated purchase of long-term bonds proposed by the Treasury Department will only begin on September 9.
Breaking: There may not be much time left for the encrypted “CLEAR Act”! The situation is really not very optimistic!
┈➤ House schedule is tight
The House has canceled the votes for September 21 and September 28 for two weeks.
The House will begin work on September 14, convene a four-day session, and then leave Washington to return to their states to focus on campaign work for the midterm elections—after all, members of the House can keep getting re-elected indefinitely.
┈➤ The Senate is undecided
The problem is that the encrypted “CLEAR Act” is currently stuck in the Senate, and the Senate version is not the same as the House version.
So at the fastest, it would require: Senate pre-approval (procedural vote) passing, Senate final approval vote passing, and then the House voting again to approve the Senate version.
After the procedural vote is passed, there may also be formal debate, and amendments may still be made. After the Senate passes it, the House is not sure whether it will modify it again.
Only 4 days from September 15 to September 18—there really isn’t much time left for the encrypted “CLEAR Act.”
┈➤ The bigger issue is that Democrats may retake both chambers
The bigger issue is that current polling by various media outlets, including Polymarket’s market, shows Democrats’ support is higher than Republicans’.
If Democrats retake both chambers—especially the Senate—then whether the encrypted “CLEAR Act” can truly pass is really not certain at all…
┈➤ House schedule is tight
The House has canceled the votes for September 21 and September 28 for two weeks.
The House will begin work on September 14, convene a four-day session, and then leave Washington to return to their states to focus on campaign work for the midterm elections—after all, members of the House can keep getting re-elected indefinitely.
┈➤ The Senate is undecided
The problem is that the encrypted “CLEAR Act” is currently stuck in the Senate, and the Senate version is not the same as the House version.
So at the fastest, it would require: Senate pre-approval (procedural vote) passing, Senate final approval vote passing, and then the House voting again to approve the Senate version.
After the procedural vote is passed, there may also be formal debate, and amendments may still be made. After the Senate passes it, the House is not sure whether it will modify it again.
Only 4 days from September 15 to September 18—there really isn’t much time left for the encrypted “CLEAR Act.”
┈➤ The bigger issue is that Democrats may retake both chambers
The bigger issue is that current polling by various media outlets, including Polymarket’s market, shows Democrats’ support is higher than Republicans’.
If Democrats retake both chambers—especially the Senate—then whether the encrypted “CLEAR Act” can truly pass is really not certain at all…

Verified
Strange! Why is BTC falling? The small non-farm data has been declining for three consecutive months, and has been below expectations for three consecutive months.
#美国8月ADP就业创1月来最小增幅
This small non-farm data is weaker than expected. The expectation was 480K, but the actual figure was 380K.
The small non-farm data has been falling for three straight months and has been below expectations for three straight months.
This small non-farm data is compiled by ADP, a data company in the market—not the Department of Labor, and not one of Trump’s affiliated agencies. Its credibility is still fairly high.
Moreover, the trend of the small non-farm data is the same as the trend in the Department of Labor’s non-farm payroll data.
This is a headwind for Fed rate hikes. Actually, it’s a bit good news. I don’t understand why at 8:30 PM the market still dropped.
Maybe it’s just sentiment. Yesterday, Brother Feng sold his 2450 ETH too, but there are buy orders resting around 2350—so far it hasn’t been filled……
#美国8月ADP就业创1月来最小增幅
This small non-farm data is weaker than expected. The expectation was 480K, but the actual figure was 380K.
The small non-farm data has been falling for three straight months and has been below expectations for three straight months.
This small non-farm data is compiled by ADP, a data company in the market—not the Department of Labor, and not one of Trump’s affiliated agencies. Its credibility is still fairly high.
Moreover, the trend of the small non-farm data is the same as the trend in the Department of Labor’s non-farm payroll data.
This is a headwind for Fed rate hikes. Actually, it’s a bit good news. I don’t understand why at 8:30 PM the market still dropped.
Maybe it’s just sentiment. Yesterday, Brother Feng sold his 2450 ETH too, but there are buy orders resting around 2350—so far it hasn’t been filled……

Robinhood is going crazy—funds are accelerating into the chain
In the past 30 days, $12.585 million was net flowed into the Robinhood chain via deBridge, averaging a net inflow of $419,500 per day.
In the past 7 days, $5.035 million flowed into the Robinhood chain via deBridge, averaging a net inflow of $719,300 per day.
On August 31, in just one day, $1.688 million flowed into the Robinhood chain via deBridge.
Funds are accelerating into the Robinhood chain!
According to deBridge data, among the funds flowing into the Robinhood chain, most come from Solana, followed by Ethereum, Arbitrum, Base, and the BSC chain.
In this kind of ecosystem transition, deBridge is especially useful—you only need one step to use funds from other chains to cross-chain buy tokens on the Robinhood chain, for example. You don’t even need to prepare Gas on the Robinhood chain in advance.
Save this! When a particular on-chain network suddenly spikes, you can cross-chain buy coins very quickly and are less likely to miss the buying window.
In the past 30 days, $12.585 million was net flowed into the Robinhood chain via deBridge, averaging a net inflow of $419,500 per day.
In the past 7 days, $5.035 million flowed into the Robinhood chain via deBridge, averaging a net inflow of $719,300 per day.
On August 31, in just one day, $1.688 million flowed into the Robinhood chain via deBridge.
Funds are accelerating into the Robinhood chain!
According to deBridge data, among the funds flowing into the Robinhood chain, most come from Solana, followed by Ethereum, Arbitrum, Base, and the BSC chain.
In this kind of ecosystem transition, deBridge is especially useful—you only need one step to use funds from other chains to cross-chain buy tokens on the Robinhood chain, for example. You don’t even need to prepare Gas on the Robinhood chain in advance.
Save this! When a particular on-chain network suddenly spikes, you can cross-chain buy coins very quickly and are less likely to miss the buying window.

The biggest misconception in Web3—MicroStrategy “chases highs and sells lows”?
MicroStrategy isn’t a “sell-lows” case for any reason. The previous article already analyzed it thoroughly. This time, let’s talk about why MicroStrategy doesn’t “chase highs.”
To know: MicroStrategy isn’t buying BTC with savings—it’s issuing financing of $MSTR to buy BTC.
When BTC is expensive, MSTR is also expensive. The higher BTC goes, the higher the MSTR premium becomes. Issuing MSTR to buy BTC is actually more cost-effective!
At the bottom, issuing 10,000 MSTR only allows you to buy 14 BTC. At the top, issuing 10,000 MSTR can buy 40 to 60 BTC.
So clearly, issuing MSTR to buy BTC at the top is more value for money.
No wonder Saylor is a genius. Even SBF might not be able to catch up in his lifetime. The real point for MicroStrategy isn’t the book profit.
◆ For corporate entities: Because MicroStrategy didn’t sell BTC at a high point, there are no distributable profits, so there’s no need to pay traditional corporate income tax.
◆ For preferred shareholders: Preferred shareholders like $STRC also don’t have to pay dividend withholding tax.
◆ For common shareholders: Even though the company has no distributable profits and MSTR shareholders don’t receive dividend payouts, they can still make money as BTC rises.
The result is a win-win-win! The only one potentially losing is the U.S. Treasury, which collects less tax.
MicroStrategy isn’t a “sell-lows” case for any reason. The previous article already analyzed it thoroughly. This time, let’s talk about why MicroStrategy doesn’t “chase highs.”
To know: MicroStrategy isn’t buying BTC with savings—it’s issuing financing of $MSTR to buy BTC.
When BTC is expensive, MSTR is also expensive. The higher BTC goes, the higher the MSTR premium becomes. Issuing MSTR to buy BTC is actually more cost-effective!
At the bottom, issuing 10,000 MSTR only allows you to buy 14 BTC. At the top, issuing 10,000 MSTR can buy 40 to 60 BTC.
So clearly, issuing MSTR to buy BTC at the top is more value for money.
No wonder Saylor is a genius. Even SBF might not be able to catch up in his lifetime. The real point for MicroStrategy isn’t the book profit.
◆ For corporate entities: Because MicroStrategy didn’t sell BTC at a high point, there are no distributable profits, so there’s no need to pay traditional corporate income tax.
◆ For preferred shareholders: Preferred shareholders like $STRC also don’t have to pay dividend withholding tax.
◆ For common shareholders: Even though the company has no distributable profits and MSTR shareholders don’t receive dividend payouts, they can still make money as BTC rises.
The result is a win-win-win! The only one potentially losing is the U.S. Treasury, which collects less tax.
TVBee
·
--
Brothers!! I finally understand why MicroStrategy sold BTC at the bottom!
Damn it, you’re still the boss!
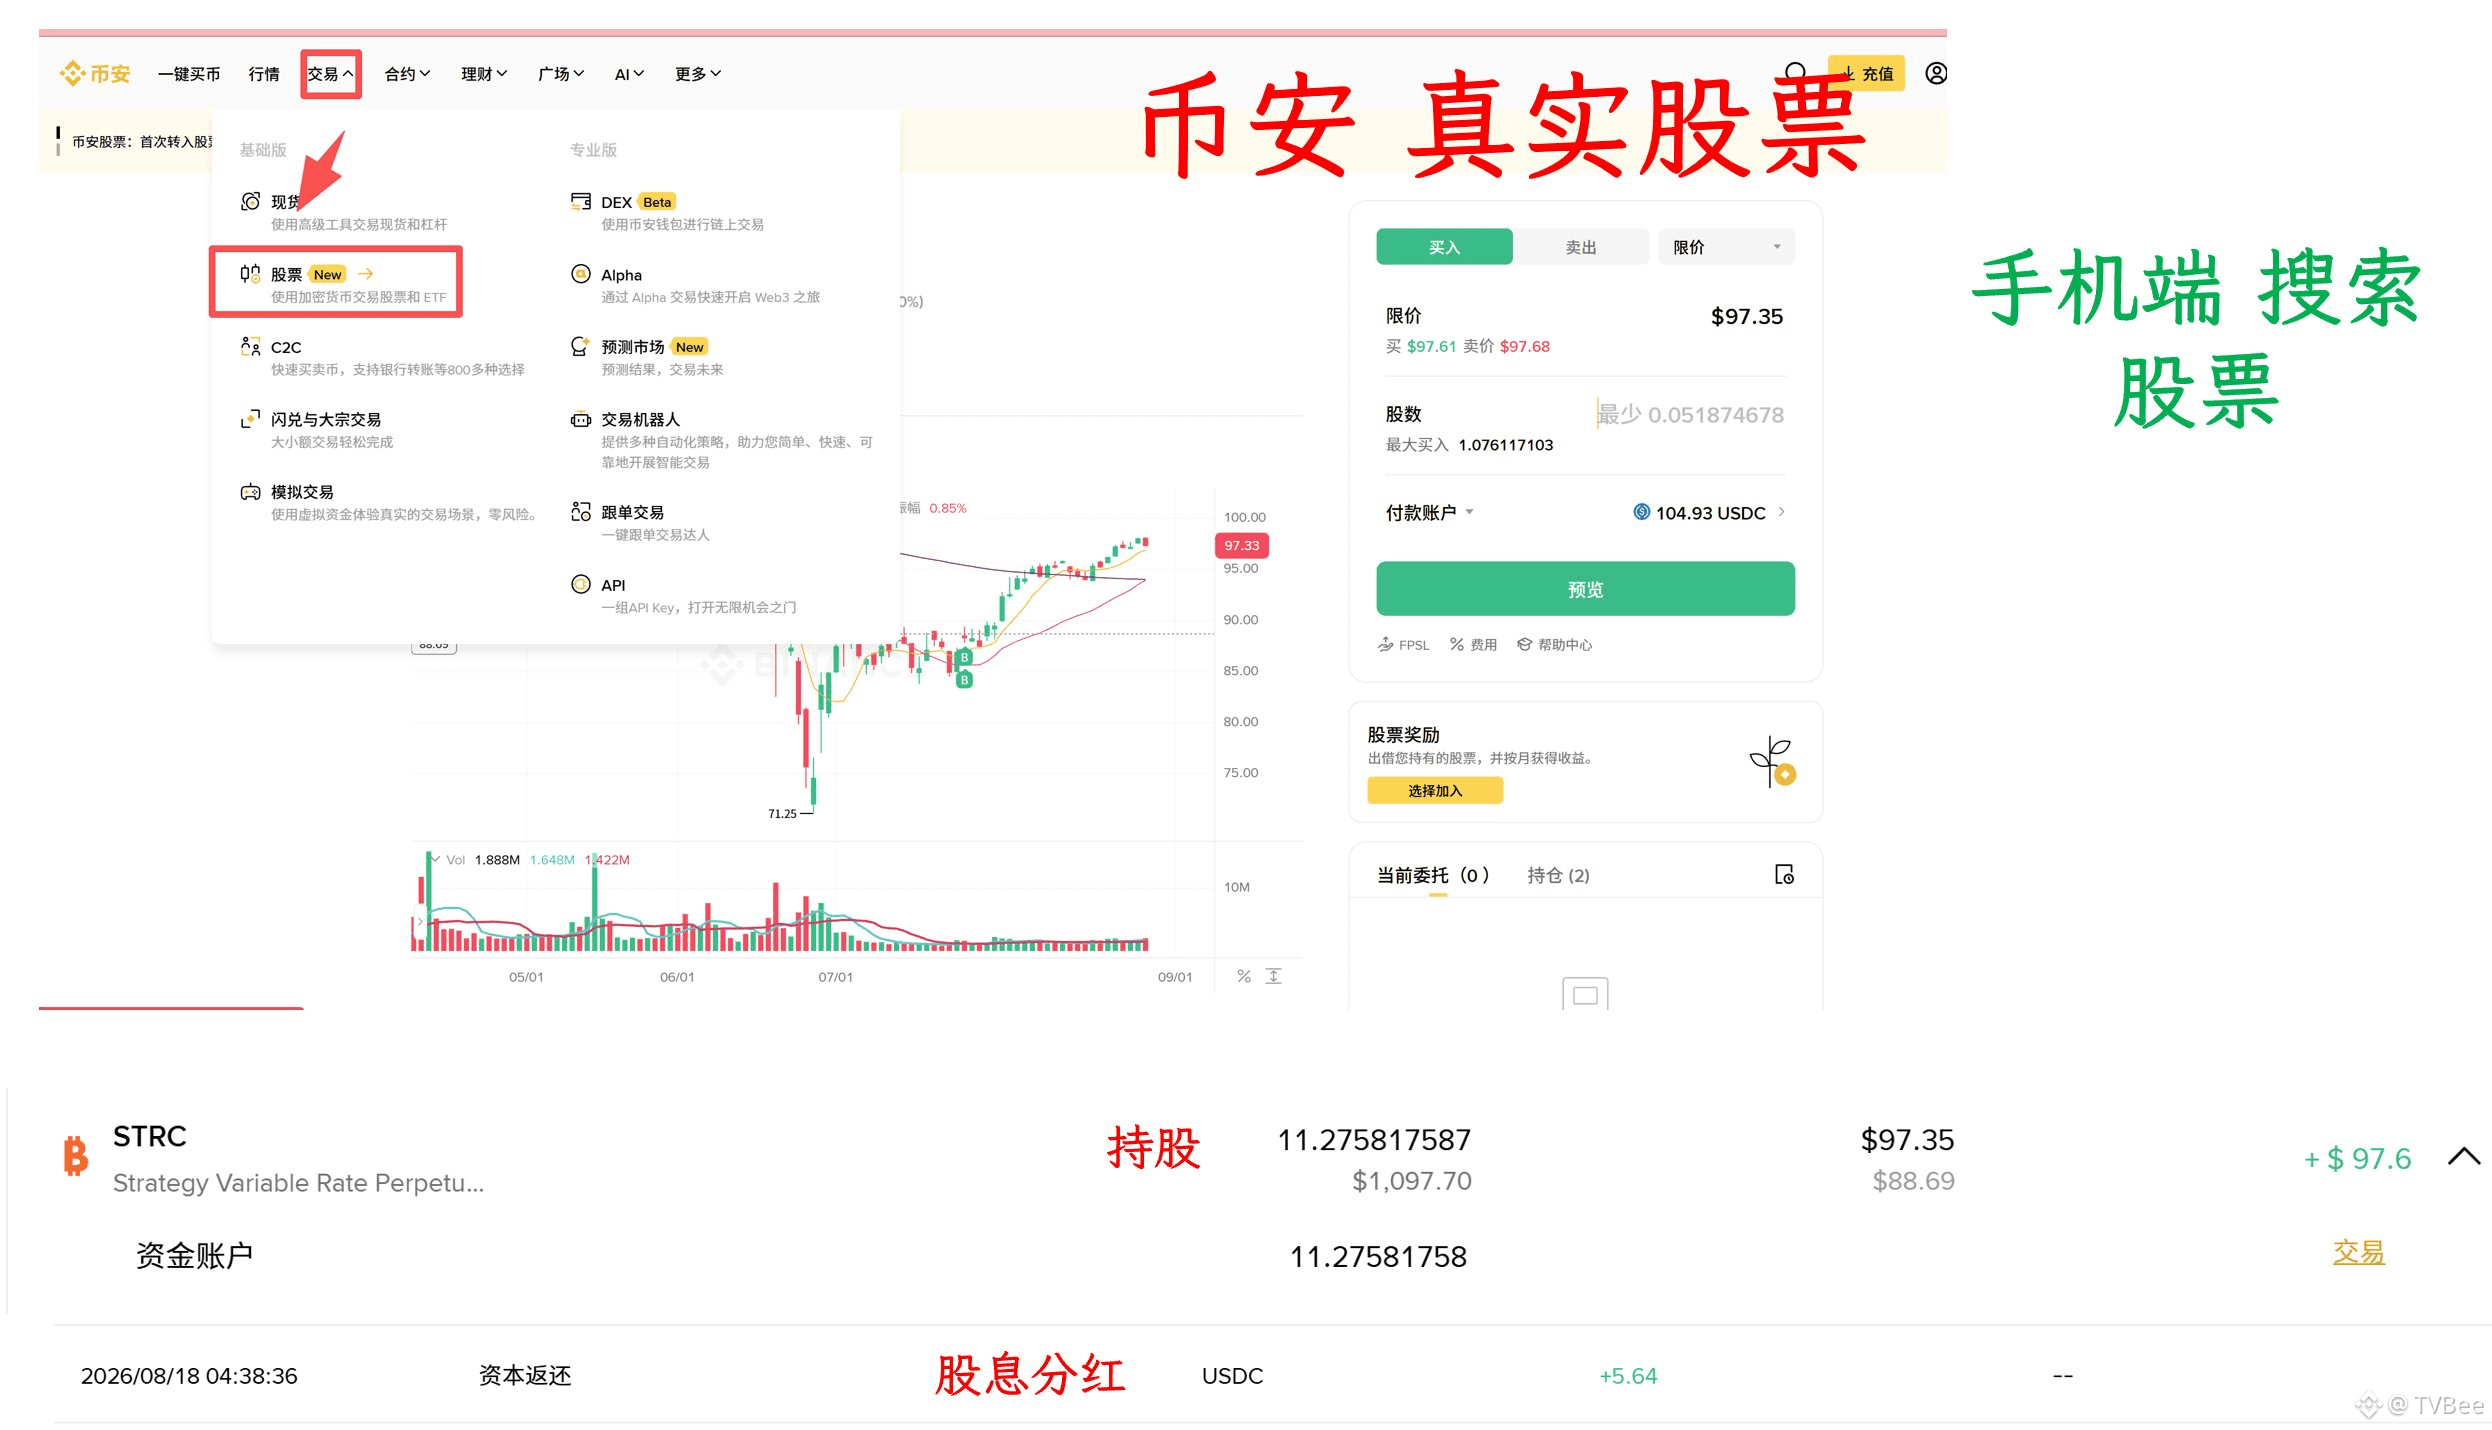
Here’s the deal: Fengge coin is over in the US stock market through Anzhen America—after buying $STRC , it received STRC dividends. Half a month is $5.64.
The holdings are 11.27581758 shares, and the par value per share is $100.
The annualized return is 5.64/(11.27581758*100)*24 = 12%.
This is the STRC dividend yield—somehow there’s no tax on receiving preferred stock dividends
(tax rate 30%). (They keep promoting Bstocks, but Binance’s real stocks are also pretty good. Fengge also benefits from STRC’s rise from $88 to $97, plus a 12% annualized dividend yield.)
Why no tax on preferred stock dividends? After some digging, Fengge found out that the US rule is: if a listed company has no distributable profits, then preferred stock dividends don’t have to be taxed!
When MicroStrategy sells BTC below its cost basis, it creates a realized loss. At that point, preferred stock shareholders don’t have to pay tax.
Now BTC is already above MicroStrategy’s cost, but even if MicroStrategy sells BTC at this time, any profits must first cover the previous losses. Only after that could there be distributable profits. So even if MicroStrategy is in a profitable state, as long as it doesn’t sell too much BTC, STRC shareholders can still avoid paying tax and directly take the 12% annualized return.
Salor was originally fighting for benefits for STRC shareholders—and the source of these benefits isn’t paid for by holders of $MSTR, nor is it borne by BTC holders. It’s simply that the US Treasury collects less tax.
At the same time, this also means that once MicroStrategy is in profit, the amount of BTC it’s willing to sell is very small.
Doesn’t it feel like double happiness at once? 😂
Damn it, you’re still the boss!
Here’s the deal: Fengge coin is over in the US stock market through Anzhen America—after buying $STRC , it received STRC dividends. Half a month is $5.64.
The holdings are 11.27581758 shares, and the par value per share is $100.
The annualized return is 5.64/(11.27581758*100)*24 = 12%.
This is the STRC dividend yield—somehow there’s no tax on receiving preferred stock dividends
(tax rate 30%). (They keep promoting Bstocks, but Binance’s real stocks are also pretty good. Fengge also benefits from STRC’s rise from $88 to $97, plus a 12% annualized dividend yield.)
Why no tax on preferred stock dividends? After some digging, Fengge found out that the US rule is: if a listed company has no distributable profits, then preferred stock dividends don’t have to be taxed!
When MicroStrategy sells BTC below its cost basis, it creates a realized loss. At that point, preferred stock shareholders don’t have to pay tax.
Now BTC is already above MicroStrategy’s cost, but even if MicroStrategy sells BTC at this time, any profits must first cover the previous losses. Only after that could there be distributable profits. So even if MicroStrategy is in a profitable state, as long as it doesn’t sell too much BTC, STRC shareholders can still avoid paying tax and directly take the 12% annualized return.
Salor was originally fighting for benefits for STRC shareholders—and the source of these benefits isn’t paid for by holders of $MSTR, nor is it borne by BTC holders. It’s simply that the US Treasury collects less tax.
At the same time, this also means that once MicroStrategy is in profit, the amount of BTC it’s willing to sell is very small.
Doesn’t it feel like double happiness at once? 😂
The midterm election is just around the corner, and the U.S. military strikes Iran again. Who gave Trump the courage—was it Lin Qingxia?
Does Trump not want the Strait of Hormuz to open? Is he not afraid of oil prices rising?
Of course not!
┈➤ The U.S. and Venezuela reach an oil deal
Trump’s confidence lies in Venezuela.
◆ August 28: Trump announced an oil agreement with Venezuela.
◆ August 29–30: Venezuela’s side released more details of the agreement.
◆ August 30–31: U.S. forces attacked Iran again.
This timeline, and the fact that the two events are so close together, inevitably makes people think there’s a cause-and-effect relationship.
┈➤ A respectable deal
U.S. Secretary of State Rubio posted on X, confirming that $100 billion in private investment would support Venezuela’s oil extraction.
Venezuela’s interim president, Delcy Rodríguez, has also made it clear that both sides have signed a 25-year energy agreement, with the goal of developing 17 strategic oil fields.
Bro Bee looked into some media reports, and this time the U.S.–Venezuela deal is, by and large, fairly respectable.
The cooperation this time is between the U.S. government and Venezuela’s private enterprise NABEP. NABEP does not have ownership of the oil fields—only the right to develop them.
In terms of controlling shares, the U.S. has 35%, and Venezuela has 65%.
An important detail in the agreement is that the U.S. can buy 20% of the oil production first at cost price.
Some Chinese-language media’s reports about so-called “major control rights” are too vague.
In reality, Venezuela’s equity is higher—65%—while the U.S. has the higher allocation right for oil production, at 55%.
Therefore, Venezuela still retains sovereign control over the oil and resources. What the U.S. gets is future crude oil supply.
┈➤ To wrap up
It’s precisely because of this agreement that Trump has the confidence. After Venezuela’s oil industry is rebuilt, it can increase crude production and export to the U.S., helping to push down U.S. oil prices.
Of course, rebuilding oil infrastructure in Venezuela after years of disruption also takes time. So in the short term, it can at most provide emotional reassurance about oil prices. In the short run, Trump likely won’t take large-scale action against Iran—at least not before the midterm election.
Does Trump not want the Strait of Hormuz to open? Is he not afraid of oil prices rising?
Of course not!
┈➤ The U.S. and Venezuela reach an oil deal
Trump’s confidence lies in Venezuela.
◆ August 28: Trump announced an oil agreement with Venezuela.
◆ August 29–30: Venezuela’s side released more details of the agreement.
◆ August 30–31: U.S. forces attacked Iran again.
This timeline, and the fact that the two events are so close together, inevitably makes people think there’s a cause-and-effect relationship.
┈➤ A respectable deal
U.S. Secretary of State Rubio posted on X, confirming that $100 billion in private investment would support Venezuela’s oil extraction.
Venezuela’s interim president, Delcy Rodríguez, has also made it clear that both sides have signed a 25-year energy agreement, with the goal of developing 17 strategic oil fields.
Bro Bee looked into some media reports, and this time the U.S.–Venezuela deal is, by and large, fairly respectable.
The cooperation this time is between the U.S. government and Venezuela’s private enterprise NABEP. NABEP does not have ownership of the oil fields—only the right to develop them.
In terms of controlling shares, the U.S. has 35%, and Venezuela has 65%.
An important detail in the agreement is that the U.S. can buy 20% of the oil production first at cost price.
Some Chinese-language media’s reports about so-called “major control rights” are too vague.
In reality, Venezuela’s equity is higher—65%—while the U.S. has the higher allocation right for oil production, at 55%.
Therefore, Venezuela still retains sovereign control over the oil and resources. What the U.S. gets is future crude oil supply.
┈➤ To wrap up
It’s precisely because of this agreement that Trump has the confidence. After Venezuela’s oil industry is rebuilt, it can increase crude production and export to the U.S., helping to push down U.S. oil prices.
Of course, rebuilding oil infrastructure in Venezuela after years of disruption also takes time. So in the short term, it can at most provide emotional reassurance about oil prices. In the short run, Trump likely won’t take large-scale action against Iran—at least not before the midterm election.

Has this BTC rally finished?
┈➤ Angle 1: Daily RSI divergence
First, a quick correction: in the 4-hour chart, the last point’s RSI is not diverging—you need to look at the closing price, because RSI is calculated based on closes. Using the wicks alone isn’t accurate.
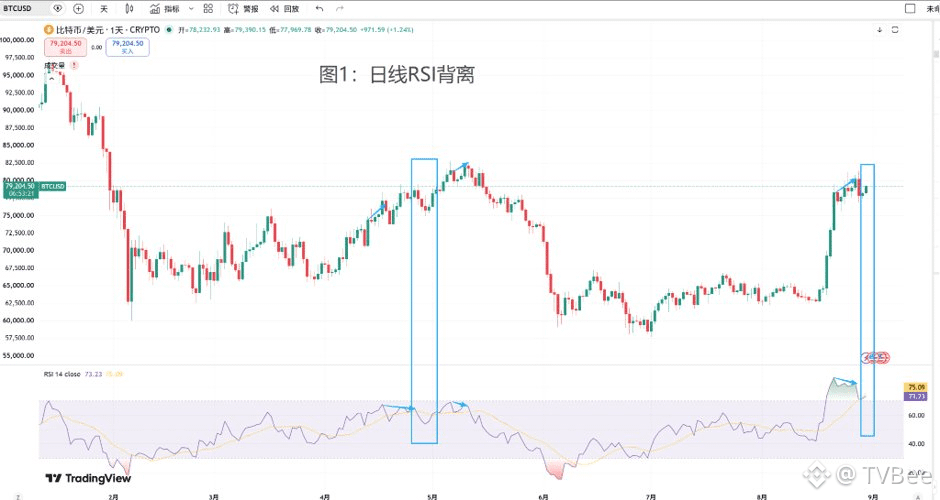
However, on the daily timeframe, the RSI divergence is real. As shown in Figure 1.
During the May rally where Kezhou reached a high, after the daily RSI14 divergence, there was a pullback—then price surged upward again.
So for the daily timeframe’s divergence, when BTC retraces to around 77,000, we can’t yet conclude that the rally has ended—unlike the May situation, the divergence here still doesn’t confirm the end of the trend.
┈➤ Angle 2: USDT fund flows
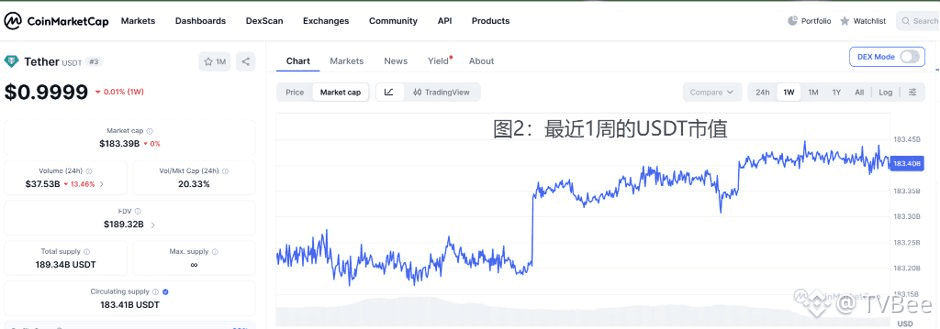
As shown in Figure 2, over the past week, the total USDT market value has been generally trending upward. After Waller’s comments, it dipped, but it quickly recovered again.
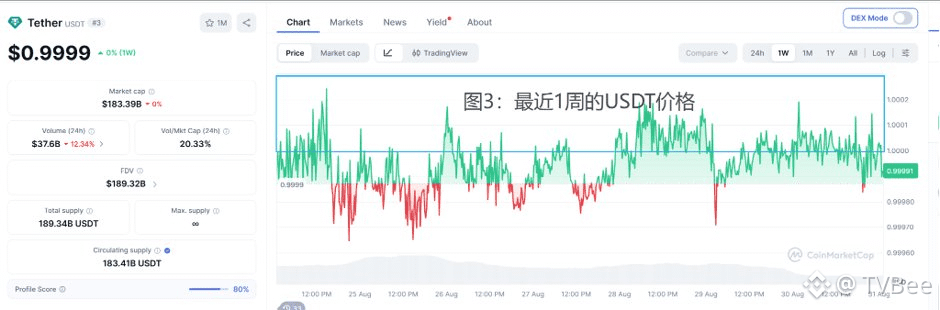
Also as shown in Figure 3, over the past week USDT has been ranging around $1, with about half the time trading at a positive premium. After Waller’s comments it fell, but it soon returned to around $1—currently it’s at $0.9999.
There are no signs of funds leaving, suggesting that this leg may not be over yet.
But the inflow magnitude isn’t very large—possibly because the market still can’t be sure the bull market has started.
┈➤ Angle 3: Waller’s speech
Waller is still somewhat hawkish, but that doesn’t necessarily mean they will raise rates immediately.
The Fed has to build expectations for rate hikes—no need to overanalyze. In one sentence, it’s to curb the "wage-inflation" spiral.
Although CME rate futures show a 59.7% probability of a rate hike in September, and a 40.3% probability that rates will stay unchanged.
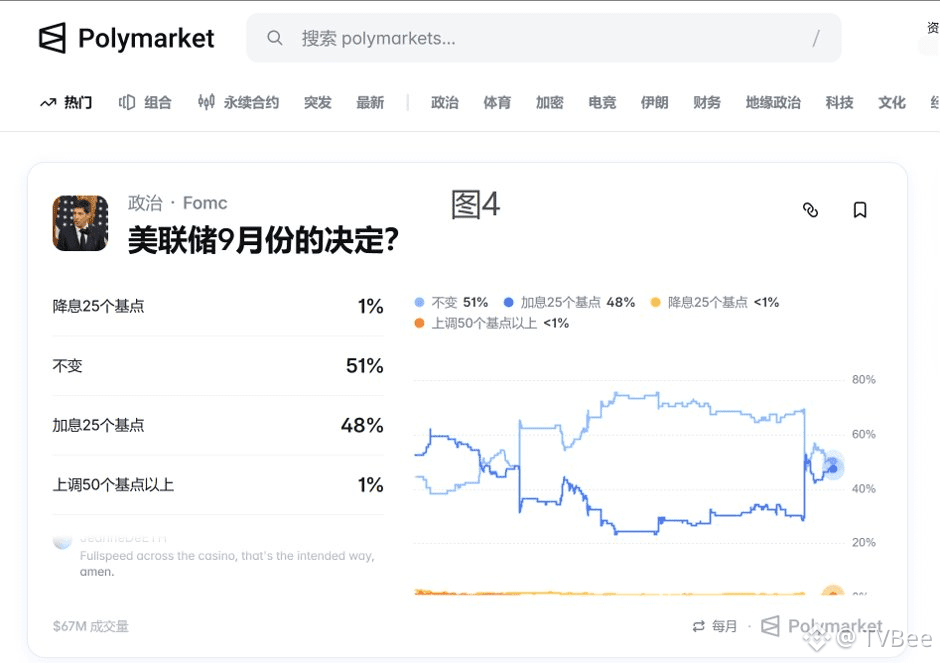
However, PM forecasts a 51% probability that rates will remain unchanged in September, as shown in Figure 4. So a rate hike in September is not certain. “Bee brother’s” analysis is that they won’t hike. If there is a hike, it would be a negative surprise—but not extremely unexpected. On the contrary, not hiking could be a positive.
┈➤ Angle 4: Other events
There are two other events. One is the CLEAR Act. At Trump’s urging, it is tentatively set to begin pre-voting on September 15. Currently, Polymarket’s prediction for the probability that this bill passes this year is only 14%, which means the expectation for it to pass in September is nearly nonexistent.
So from today’s timing, if the bill doesn’t pass, that would be in line with expectations—but if it does pass, that would be a positive catalyst.
The second event is that Circle’s ARC permissioned chain will go live on the mainnet on September 16. That’s the same day as the Fed’s FOMC meeting, so it could also stir up sentiment.
┈➤ Closing thoughts
Overall, this leg of the BTC rally may not be over yet.
┈➤ Angle 1: Daily RSI divergence
First, a quick correction: in the 4-hour chart, the last point’s RSI is not diverging—you need to look at the closing price, because RSI is calculated based on closes. Using the wicks alone isn’t accurate.
However, on the daily timeframe, the RSI divergence is real. As shown in Figure 1.
During the May rally where Kezhou reached a high, after the daily RSI14 divergence, there was a pullback—then price surged upward again.
So for the daily timeframe’s divergence, when BTC retraces to around 77,000, we can’t yet conclude that the rally has ended—unlike the May situation, the divergence here still doesn’t confirm the end of the trend.
┈➤ Angle 2: USDT fund flows
As shown in Figure 2, over the past week, the total USDT market value has been generally trending upward. After Waller’s comments, it dipped, but it quickly recovered again.
Also as shown in Figure 3, over the past week USDT has been ranging around $1, with about half the time trading at a positive premium. After Waller’s comments it fell, but it soon returned to around $1—currently it’s at $0.9999.
There are no signs of funds leaving, suggesting that this leg may not be over yet.
But the inflow magnitude isn’t very large—possibly because the market still can’t be sure the bull market has started.
┈➤ Angle 3: Waller’s speech
Waller is still somewhat hawkish, but that doesn’t necessarily mean they will raise rates immediately.
The Fed has to build expectations for rate hikes—no need to overanalyze. In one sentence, it’s to curb the "wage-inflation" spiral.
Although CME rate futures show a 59.7% probability of a rate hike in September, and a 40.3% probability that rates will stay unchanged.
However, PM forecasts a 51% probability that rates will remain unchanged in September, as shown in Figure 4. So a rate hike in September is not certain. “Bee brother’s” analysis is that they won’t hike. If there is a hike, it would be a negative surprise—but not extremely unexpected. On the contrary, not hiking could be a positive.
┈➤ Angle 4: Other events
There are two other events. One is the CLEAR Act. At Trump’s urging, it is tentatively set to begin pre-voting on September 15. Currently, Polymarket’s prediction for the probability that this bill passes this year is only 14%, which means the expectation for it to pass in September is nearly nonexistent.
So from today’s timing, if the bill doesn’t pass, that would be in line with expectations—but if it does pass, that would be a positive catalyst.
The second event is that Circle’s ARC permissioned chain will go live on the mainnet on September 16. That’s the same day as the Fed’s FOMC meeting, so it could also stir up sentiment.
┈➤ Closing thoughts
Overall, this leg of the BTC rally may not be over yet.
Verified
Brothers!! I finally understand why MicroStrategy sold BTC at the bottom!
Damn it, you’re still the boss!
Here’s the deal: Fengge coin is over in the US stock market through Anzhen America—after buying $STRC , it received STRC dividends. Half a month is $5.64.
The holdings are 11.27581758 shares, and the par value per share is $100.
The annualized return is 5.64/(11.27581758*100)*24 = 12%.
This is the STRC dividend yield—somehow there’s no tax on receiving preferred stock dividends
(tax rate 30%). (They keep promoting Bstocks, but Binance’s real stocks are also pretty good. Fengge also benefits from STRC’s rise from $88 to $97, plus a 12% annualized dividend yield.)
Why no tax on preferred stock dividends? After some digging, Fengge found out that the US rule is: if a listed company has no distributable profits, then preferred stock dividends don’t have to be taxed!
When MicroStrategy sells BTC below its cost basis, it creates a realized loss. At that point, preferred stock shareholders don’t have to pay tax.
Now BTC is already above MicroStrategy’s cost, but even if MicroStrategy sells BTC at this time, any profits must first cover the previous losses. Only after that could there be distributable profits. So even if MicroStrategy is in a profitable state, as long as it doesn’t sell too much BTC, STRC shareholders can still avoid paying tax and directly take the 12% annualized return.
Salor was originally fighting for benefits for STRC shareholders—and the source of these benefits isn’t paid for by holders of $MSTR, nor is it borne by BTC holders. It’s simply that the US Treasury collects less tax.
At the same time, this also means that once MicroStrategy is in profit, the amount of BTC it’s willing to sell is very small.
Doesn’t it feel like double happiness at once? 😂
Damn it, you’re still the boss!
Here’s the deal: Fengge coin is over in the US stock market through Anzhen America—after buying $STRC , it received STRC dividends. Half a month is $5.64.
The holdings are 11.27581758 shares, and the par value per share is $100.
The annualized return is 5.64/(11.27581758*100)*24 = 12%.
This is the STRC dividend yield—somehow there’s no tax on receiving preferred stock dividends
(tax rate 30%). (They keep promoting Bstocks, but Binance’s real stocks are also pretty good. Fengge also benefits from STRC’s rise from $88 to $97, plus a 12% annualized dividend yield.)
Why no tax on preferred stock dividends? After some digging, Fengge found out that the US rule is: if a listed company has no distributable profits, then preferred stock dividends don’t have to be taxed!
When MicroStrategy sells BTC below its cost basis, it creates a realized loss. At that point, preferred stock shareholders don’t have to pay tax.
Now BTC is already above MicroStrategy’s cost, but even if MicroStrategy sells BTC at this time, any profits must first cover the previous losses. Only after that could there be distributable profits. So even if MicroStrategy is in a profitable state, as long as it doesn’t sell too much BTC, STRC shareholders can still avoid paying tax and directly take the 12% annualized return.
Salor was originally fighting for benefits for STRC shareholders—and the source of these benefits isn’t paid for by holders of $MSTR, nor is it borne by BTC holders. It’s simply that the US Treasury collects less tax.
At the same time, this also means that once MicroStrategy is in profit, the amount of BTC it’s willing to sell is very small.
Doesn’t it feel like double happiness at once? 😂
Partly True
Are people in the crypto world too optimistic? Too smart? Or just too foolish?
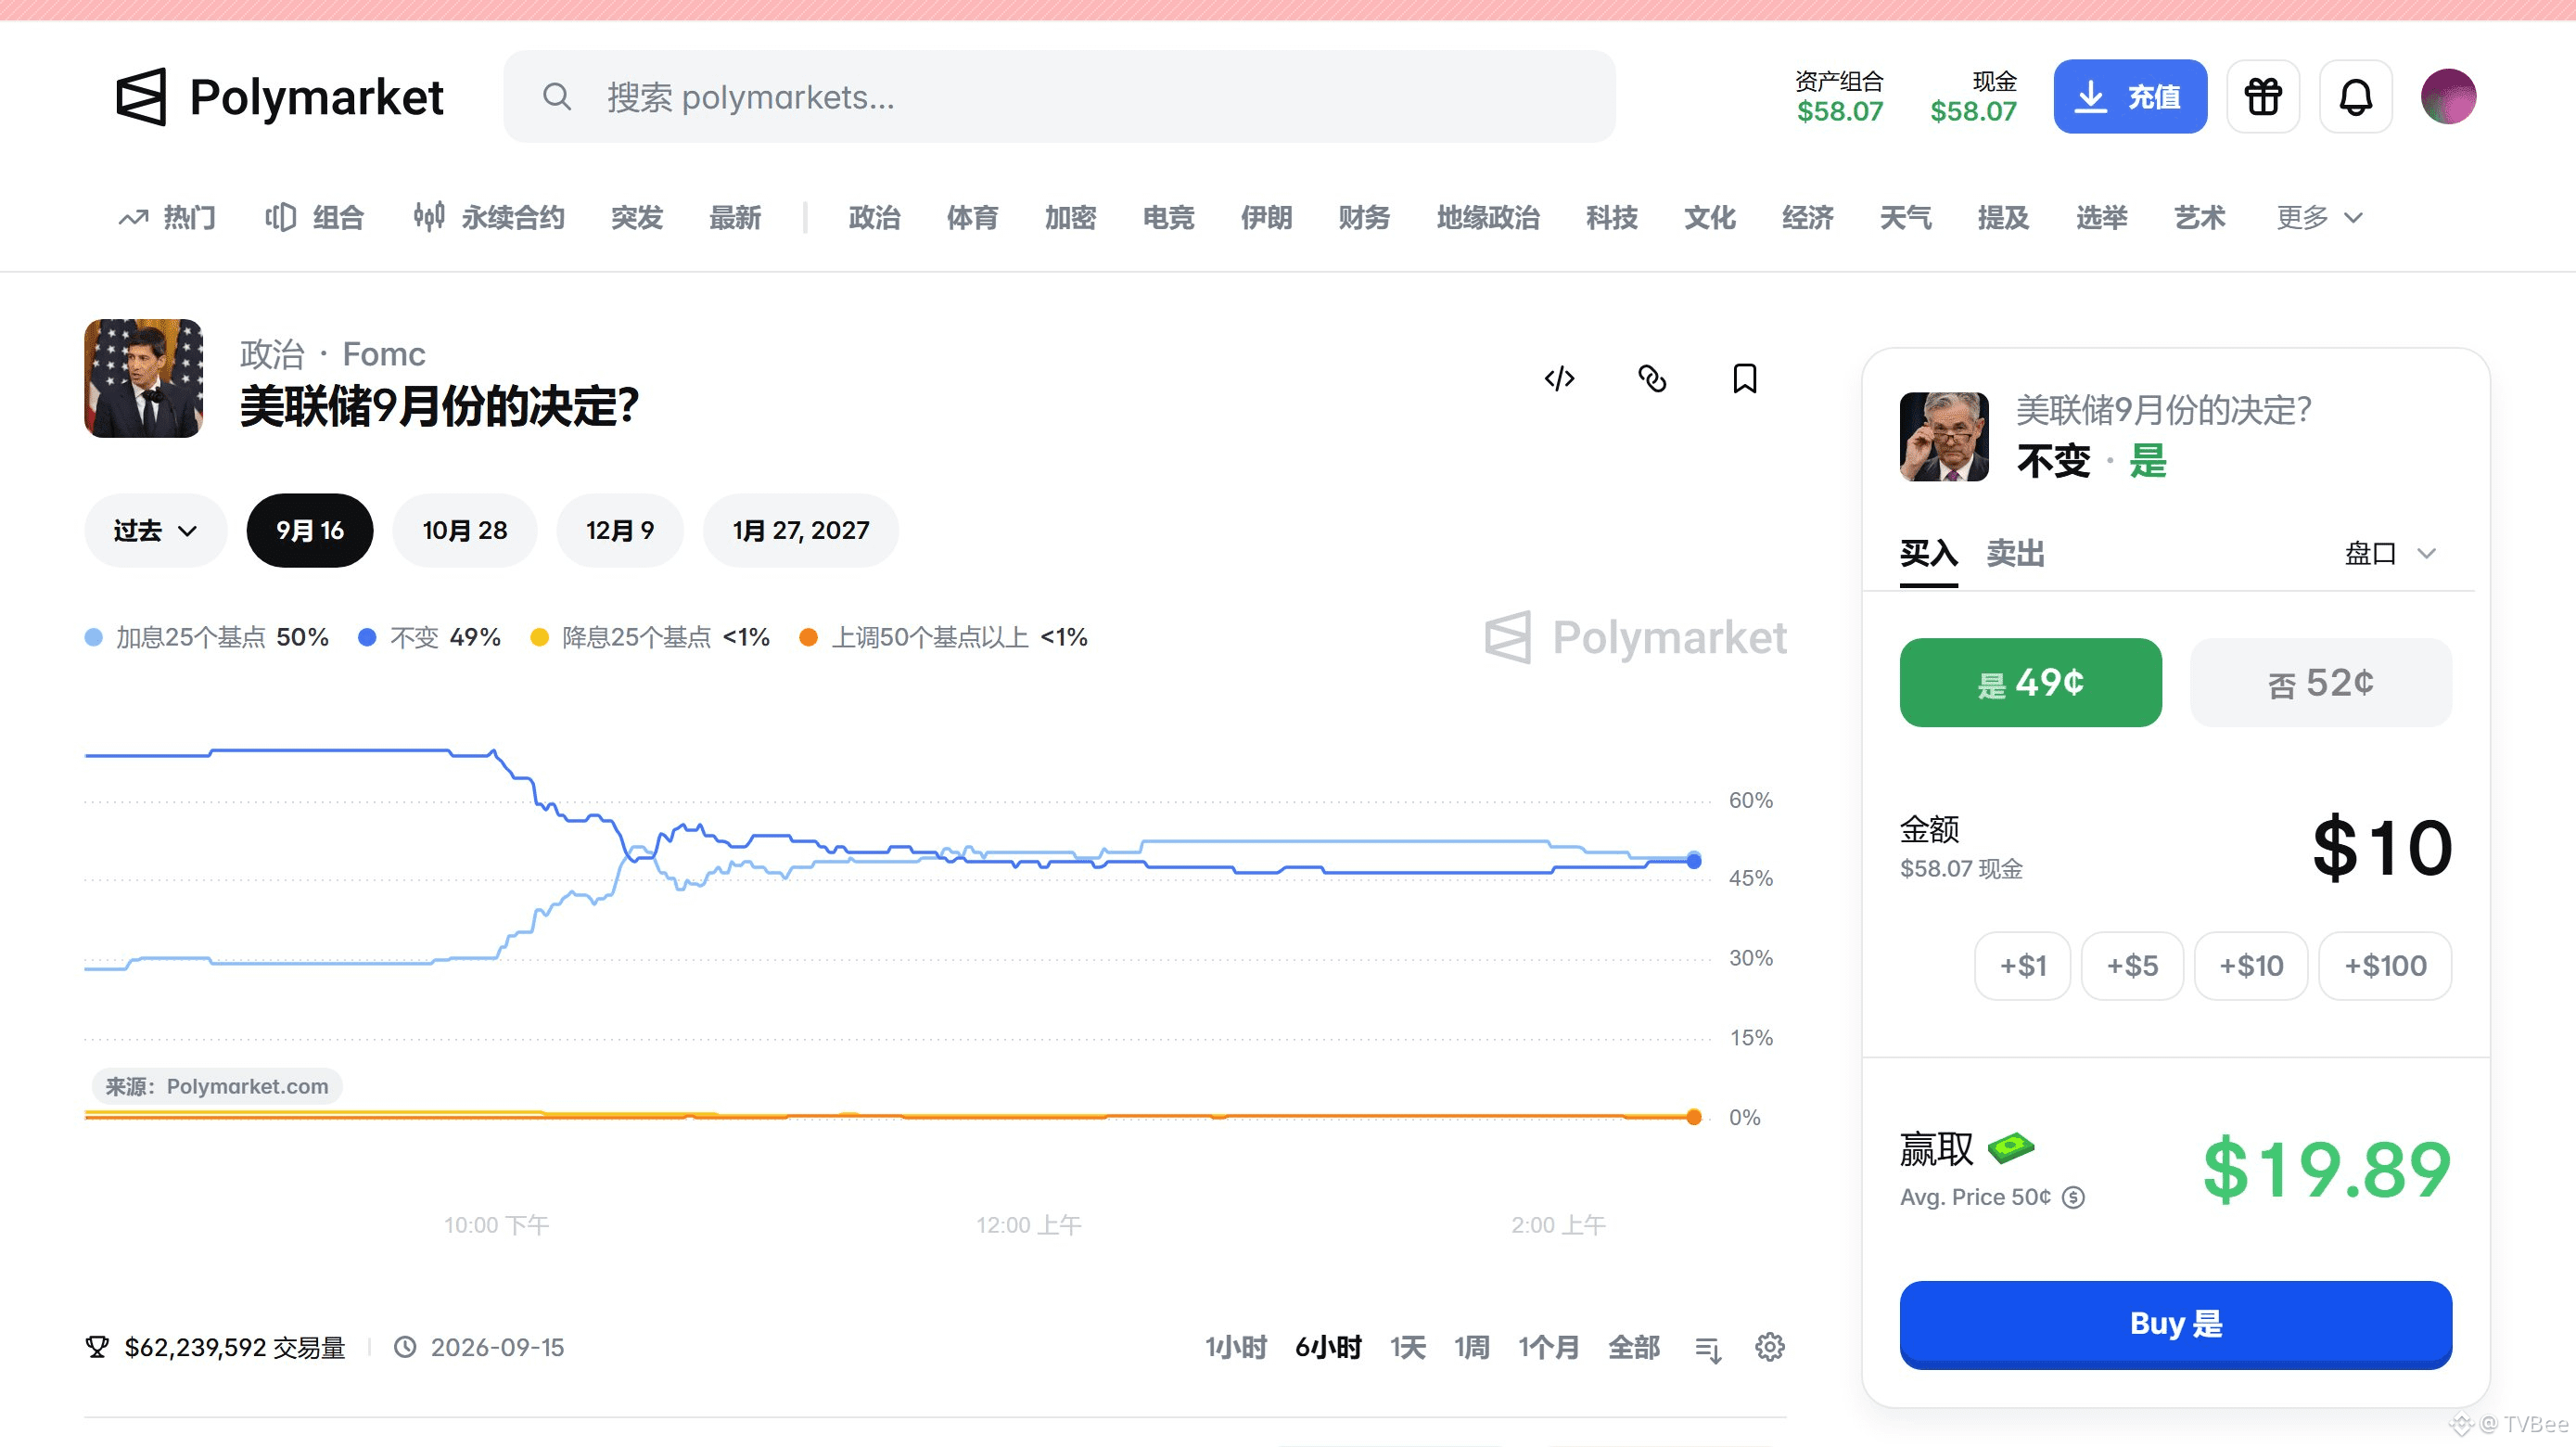
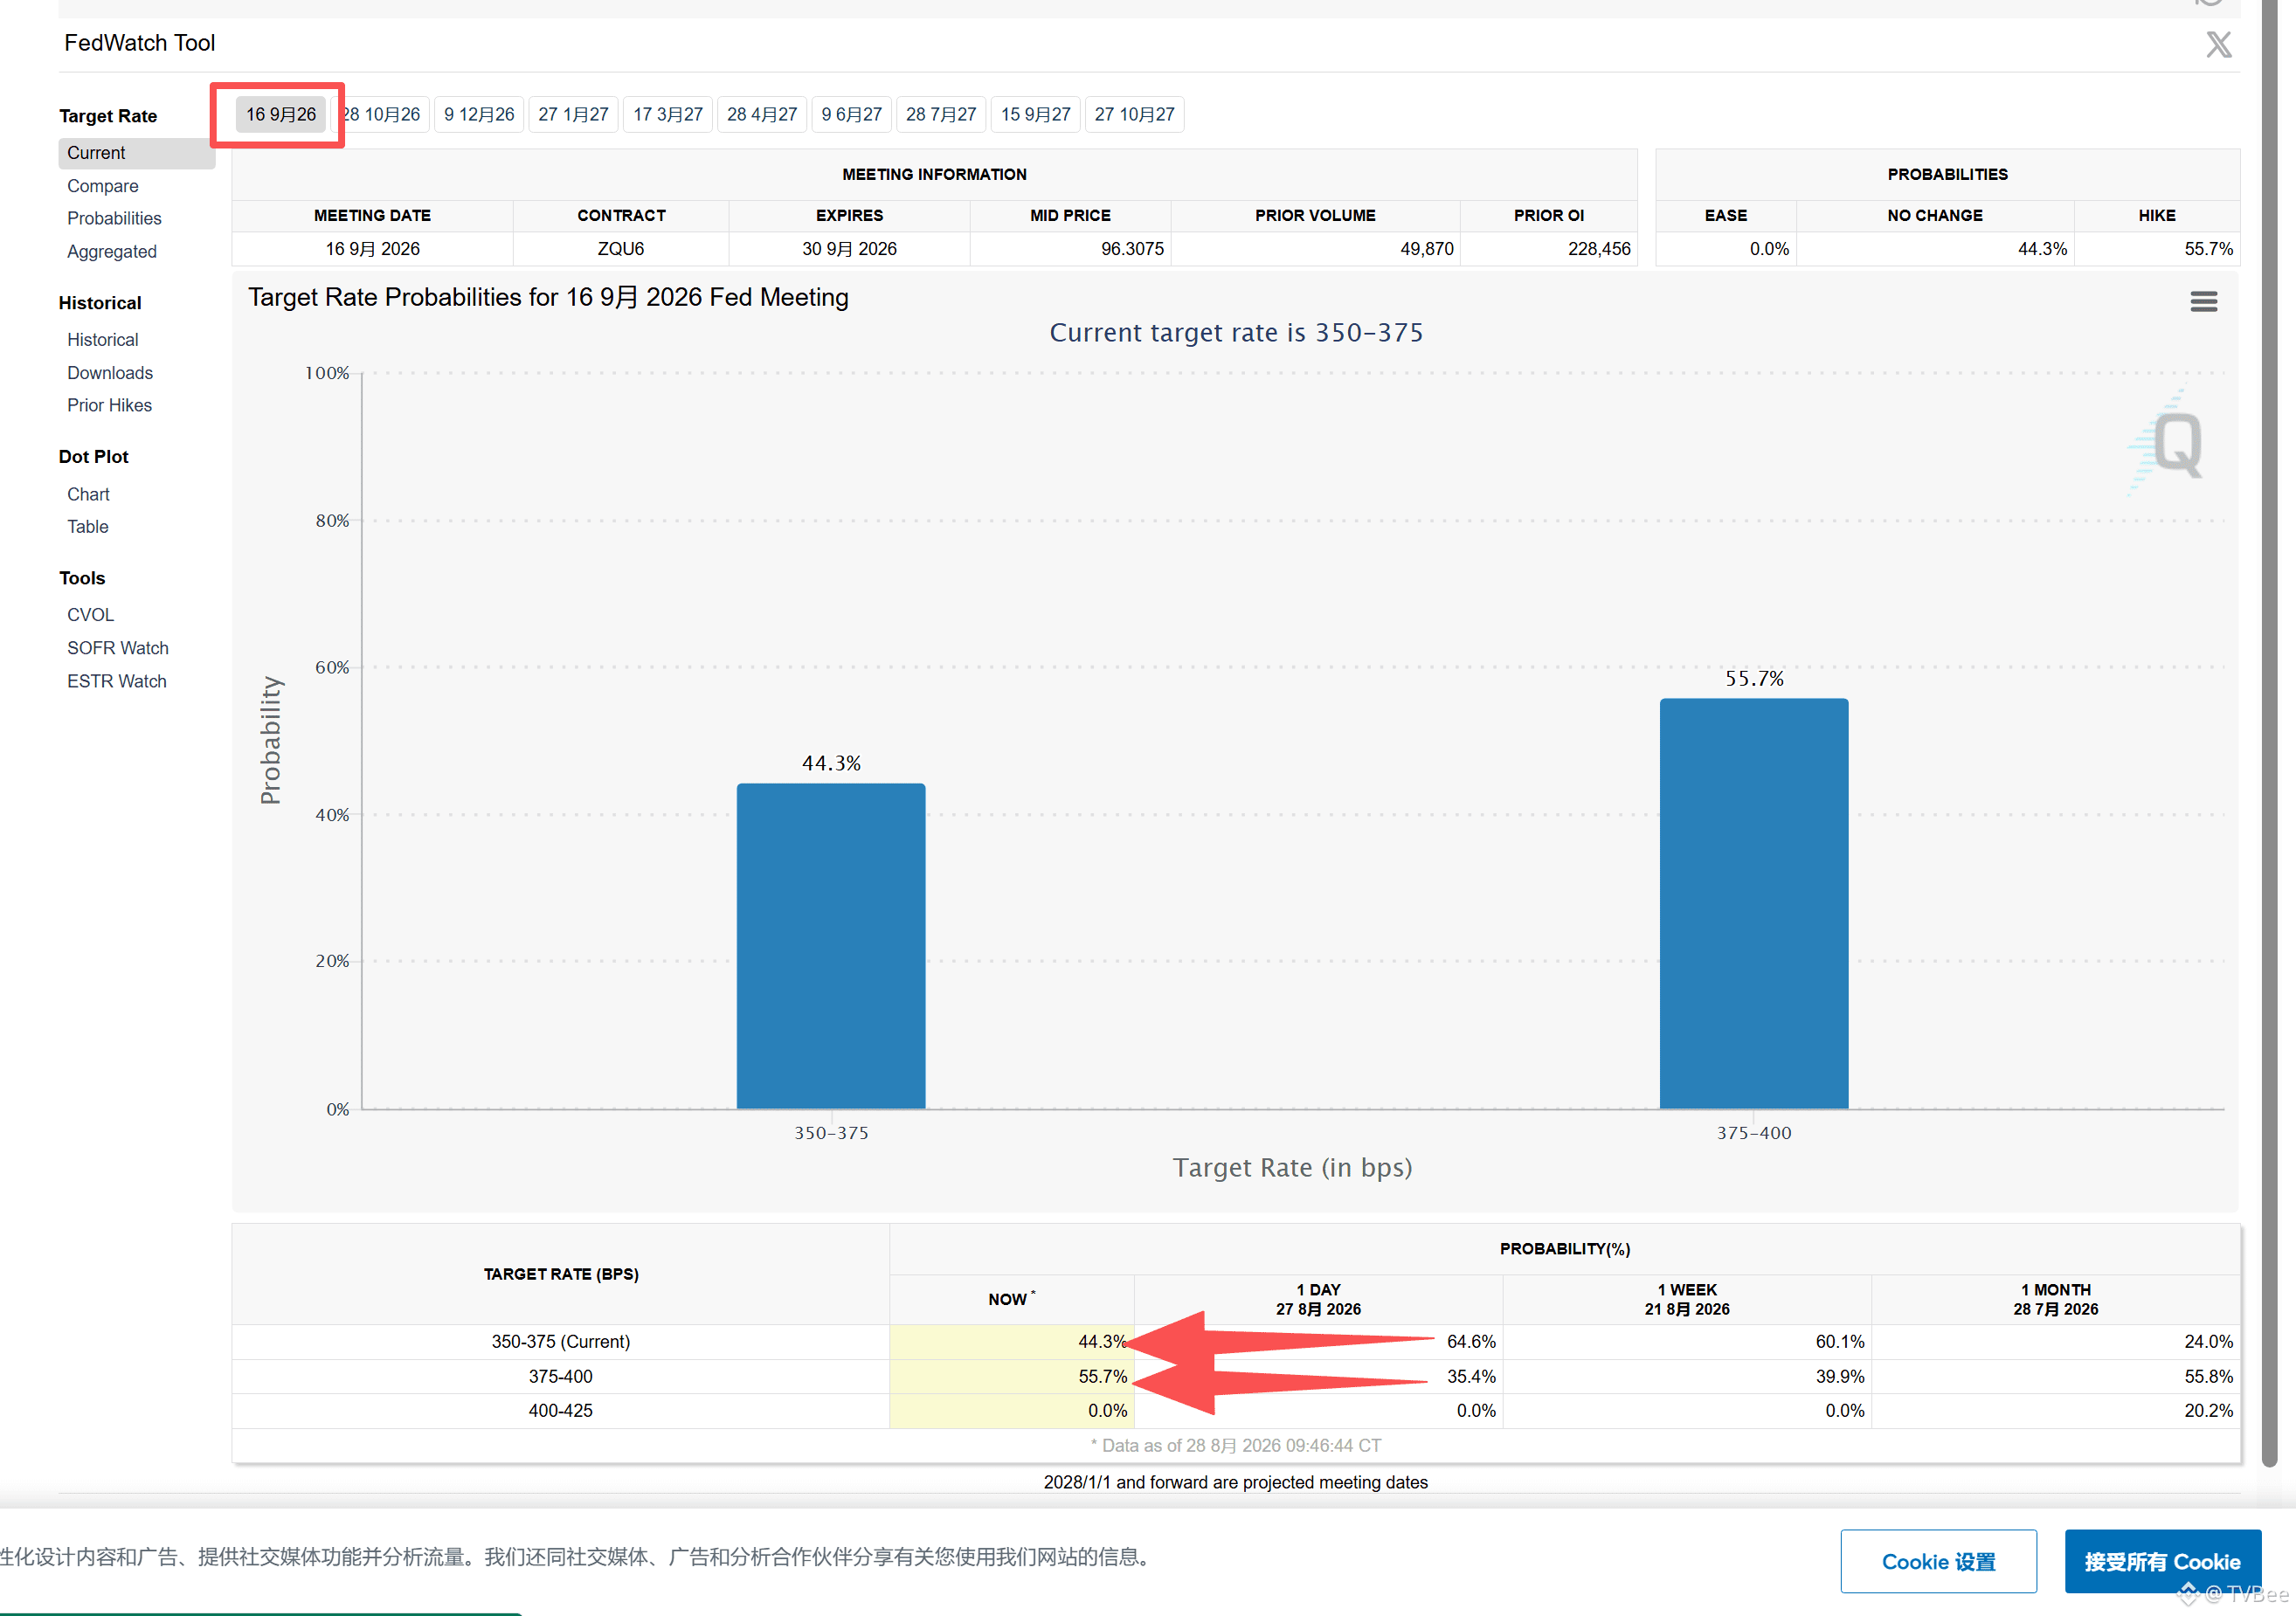
CME interest-rate futures show a 57.5% probability of a rate hike in September, but Polymarket has it at only 51%.
What tools can be used to scrape and compare the data behind these two probabilities? It feels like there’s a trading opportunity here.
Brother Feng, based on his own analysis, bought $10 for the September rate to stay unchanged. He’s lost too much before—so he has a little money left to play around with it.
CME interest-rate futures show a 57.5% probability of a rate hike in September, but Polymarket has it at only 51%.
What tools can be used to scrape and compare the data behind these two probabilities? It feels like there’s a trading opportunity here.
Brother Feng, based on his own analysis, bought $10 for the September rate to stay unchanged. He’s lost too much before—so he has a little money left to play around with it.
Verified
Because Waugh’s remarks are more hawkish, does the Fed need to raise rates in September?
First, the conclusion—consistent with Uncle Mao’s view—it’s unlikely the Fed will raise rates in September.
The only basic reason for a rate hike is inflation. But there may be more reasons to *not* raise rates.
┈➤ Reasons not to raise rates
First, from Uncle Mao’s perspective: high interest rates have a relatively small impact on AI and tech-market performance, but a much larger negative impact on real-economy sectors like real estate and retail that rely on financing.
Second, from Brother Feng’s perspective: Treasury yields are already not low. If rates continue to be raised, it will increase the Treasury’s borrowing costs, pushing Treasuries into a vicious cycle. Although the Federal Reserve is independent, it should still be mindful of the risks in the Treasury market.
Third, what the employment data suggests: after being revised down, nonfarm payrolls show a sustained downward trend, and the most recent data is negative—this is a headwind for a rate hike. The Fed may not be responsible for Treasuries, but balancing prices and employment is its stated responsibility.
Fourth, slower GDP growth. The annualized QoQ GDP growth rate in Q2 is lower than in Q1.
Fifth, slower growth in U.S. stocks. Growth in U.S. equities has slowed, even showing a slight downward trend. You can’t just say that rate hikes will suppress an AI bubble anymore.
Sixth, Brother Feng’s “inner reasoning” theory: earlier, a Federal Reserve governor named Lisa D. Cook shifted from dovish to hawkish, and Trump even tried to fire her. While we can’t be sure these two events are causally related, Trump’s personality is well known. Among Fed officials who vote, surely fewer than half would insist on raising rates before the midterm election.
┈➤ Why Waugh’s stance is so contradictory
On one hand, he says he wants to reduce “forward guidance.” On the other, while delivering hawkish remarks, he gives guidance to the market.
Wanting to reduce “forward guidance” isn’t the first time for Waugh. Previously, he said he wanted to cancel or reform the dot plot—suggesting that the new officials need to “light three fires.”
As for the hawkish commitment, Brother Feng has analyzed more than once that it’s meant to guide market expectations. When markets expect rate hikes, workers are less inclined to demand higher wages, which helps prevent inflation from being aggravated by wage growth—i.e., suppressing the “wage-inflation” spiral.
┈➤ Written at the end
Hawkish speeches don’t necessarily mean an imminent acceleration. Managing expectations also has a certain effect in suppressing inflation.
Even though there aren’t conditions to cut rates right now, there are also not sufficient conditions to raise rates.
First, the conclusion—consistent with Uncle Mao’s view—it’s unlikely the Fed will raise rates in September.
The only basic reason for a rate hike is inflation. But there may be more reasons to *not* raise rates.
┈➤ Reasons not to raise rates
First, from Uncle Mao’s perspective: high interest rates have a relatively small impact on AI and tech-market performance, but a much larger negative impact on real-economy sectors like real estate and retail that rely on financing.
Second, from Brother Feng’s perspective: Treasury yields are already not low. If rates continue to be raised, it will increase the Treasury’s borrowing costs, pushing Treasuries into a vicious cycle. Although the Federal Reserve is independent, it should still be mindful of the risks in the Treasury market.
Third, what the employment data suggests: after being revised down, nonfarm payrolls show a sustained downward trend, and the most recent data is negative—this is a headwind for a rate hike. The Fed may not be responsible for Treasuries, but balancing prices and employment is its stated responsibility.
Fourth, slower GDP growth. The annualized QoQ GDP growth rate in Q2 is lower than in Q1.
Fifth, slower growth in U.S. stocks. Growth in U.S. equities has slowed, even showing a slight downward trend. You can’t just say that rate hikes will suppress an AI bubble anymore.
Sixth, Brother Feng’s “inner reasoning” theory: earlier, a Federal Reserve governor named Lisa D. Cook shifted from dovish to hawkish, and Trump even tried to fire her. While we can’t be sure these two events are causally related, Trump’s personality is well known. Among Fed officials who vote, surely fewer than half would insist on raising rates before the midterm election.
┈➤ Why Waugh’s stance is so contradictory
On one hand, he says he wants to reduce “forward guidance.” On the other, while delivering hawkish remarks, he gives guidance to the market.
Wanting to reduce “forward guidance” isn’t the first time for Waugh. Previously, he said he wanted to cancel or reform the dot plot—suggesting that the new officials need to “light three fires.”
As for the hawkish commitment, Brother Feng has analyzed more than once that it’s meant to guide market expectations. When markets expect rate hikes, workers are less inclined to demand higher wages, which helps prevent inflation from being aggravated by wage growth—i.e., suppressing the “wage-inflation” spiral.
┈➤ Written at the end
Hawkish speeches don’t necessarily mean an imminent acceleration. Managing expectations also has a certain effect in suppressing inflation.
Even though there aren’t conditions to cut rates right now, there are also not sufficient conditions to raise rates.
Verified
Honestly, I’m really at a loss.
Vance’s speech is kind of hawkish—pretty much as expected.
The problem is: while he says he wants to reduce the “forward guidance,” he’s right there doing the very “forward guidance” he’s opposing...
As he spoke, the probability of a rate hike in September rose again above the probability of keeping rates unchanged.
Brother Feng first sold the spot ETH he bought at 2500, but the one he bought at 2450 is still being held.
Vance’s speech is kind of hawkish—pretty much as expected.
The problem is: while he says he wants to reduce the “forward guidance,” he’s right there doing the very “forward guidance” he’s opposing...
As he spoke, the probability of a rate hike in September rose again above the probability of keeping rates unchanged.
Brother Feng first sold the spot ETH he bought at 2500, but the one he bought at 2450 is still being held.

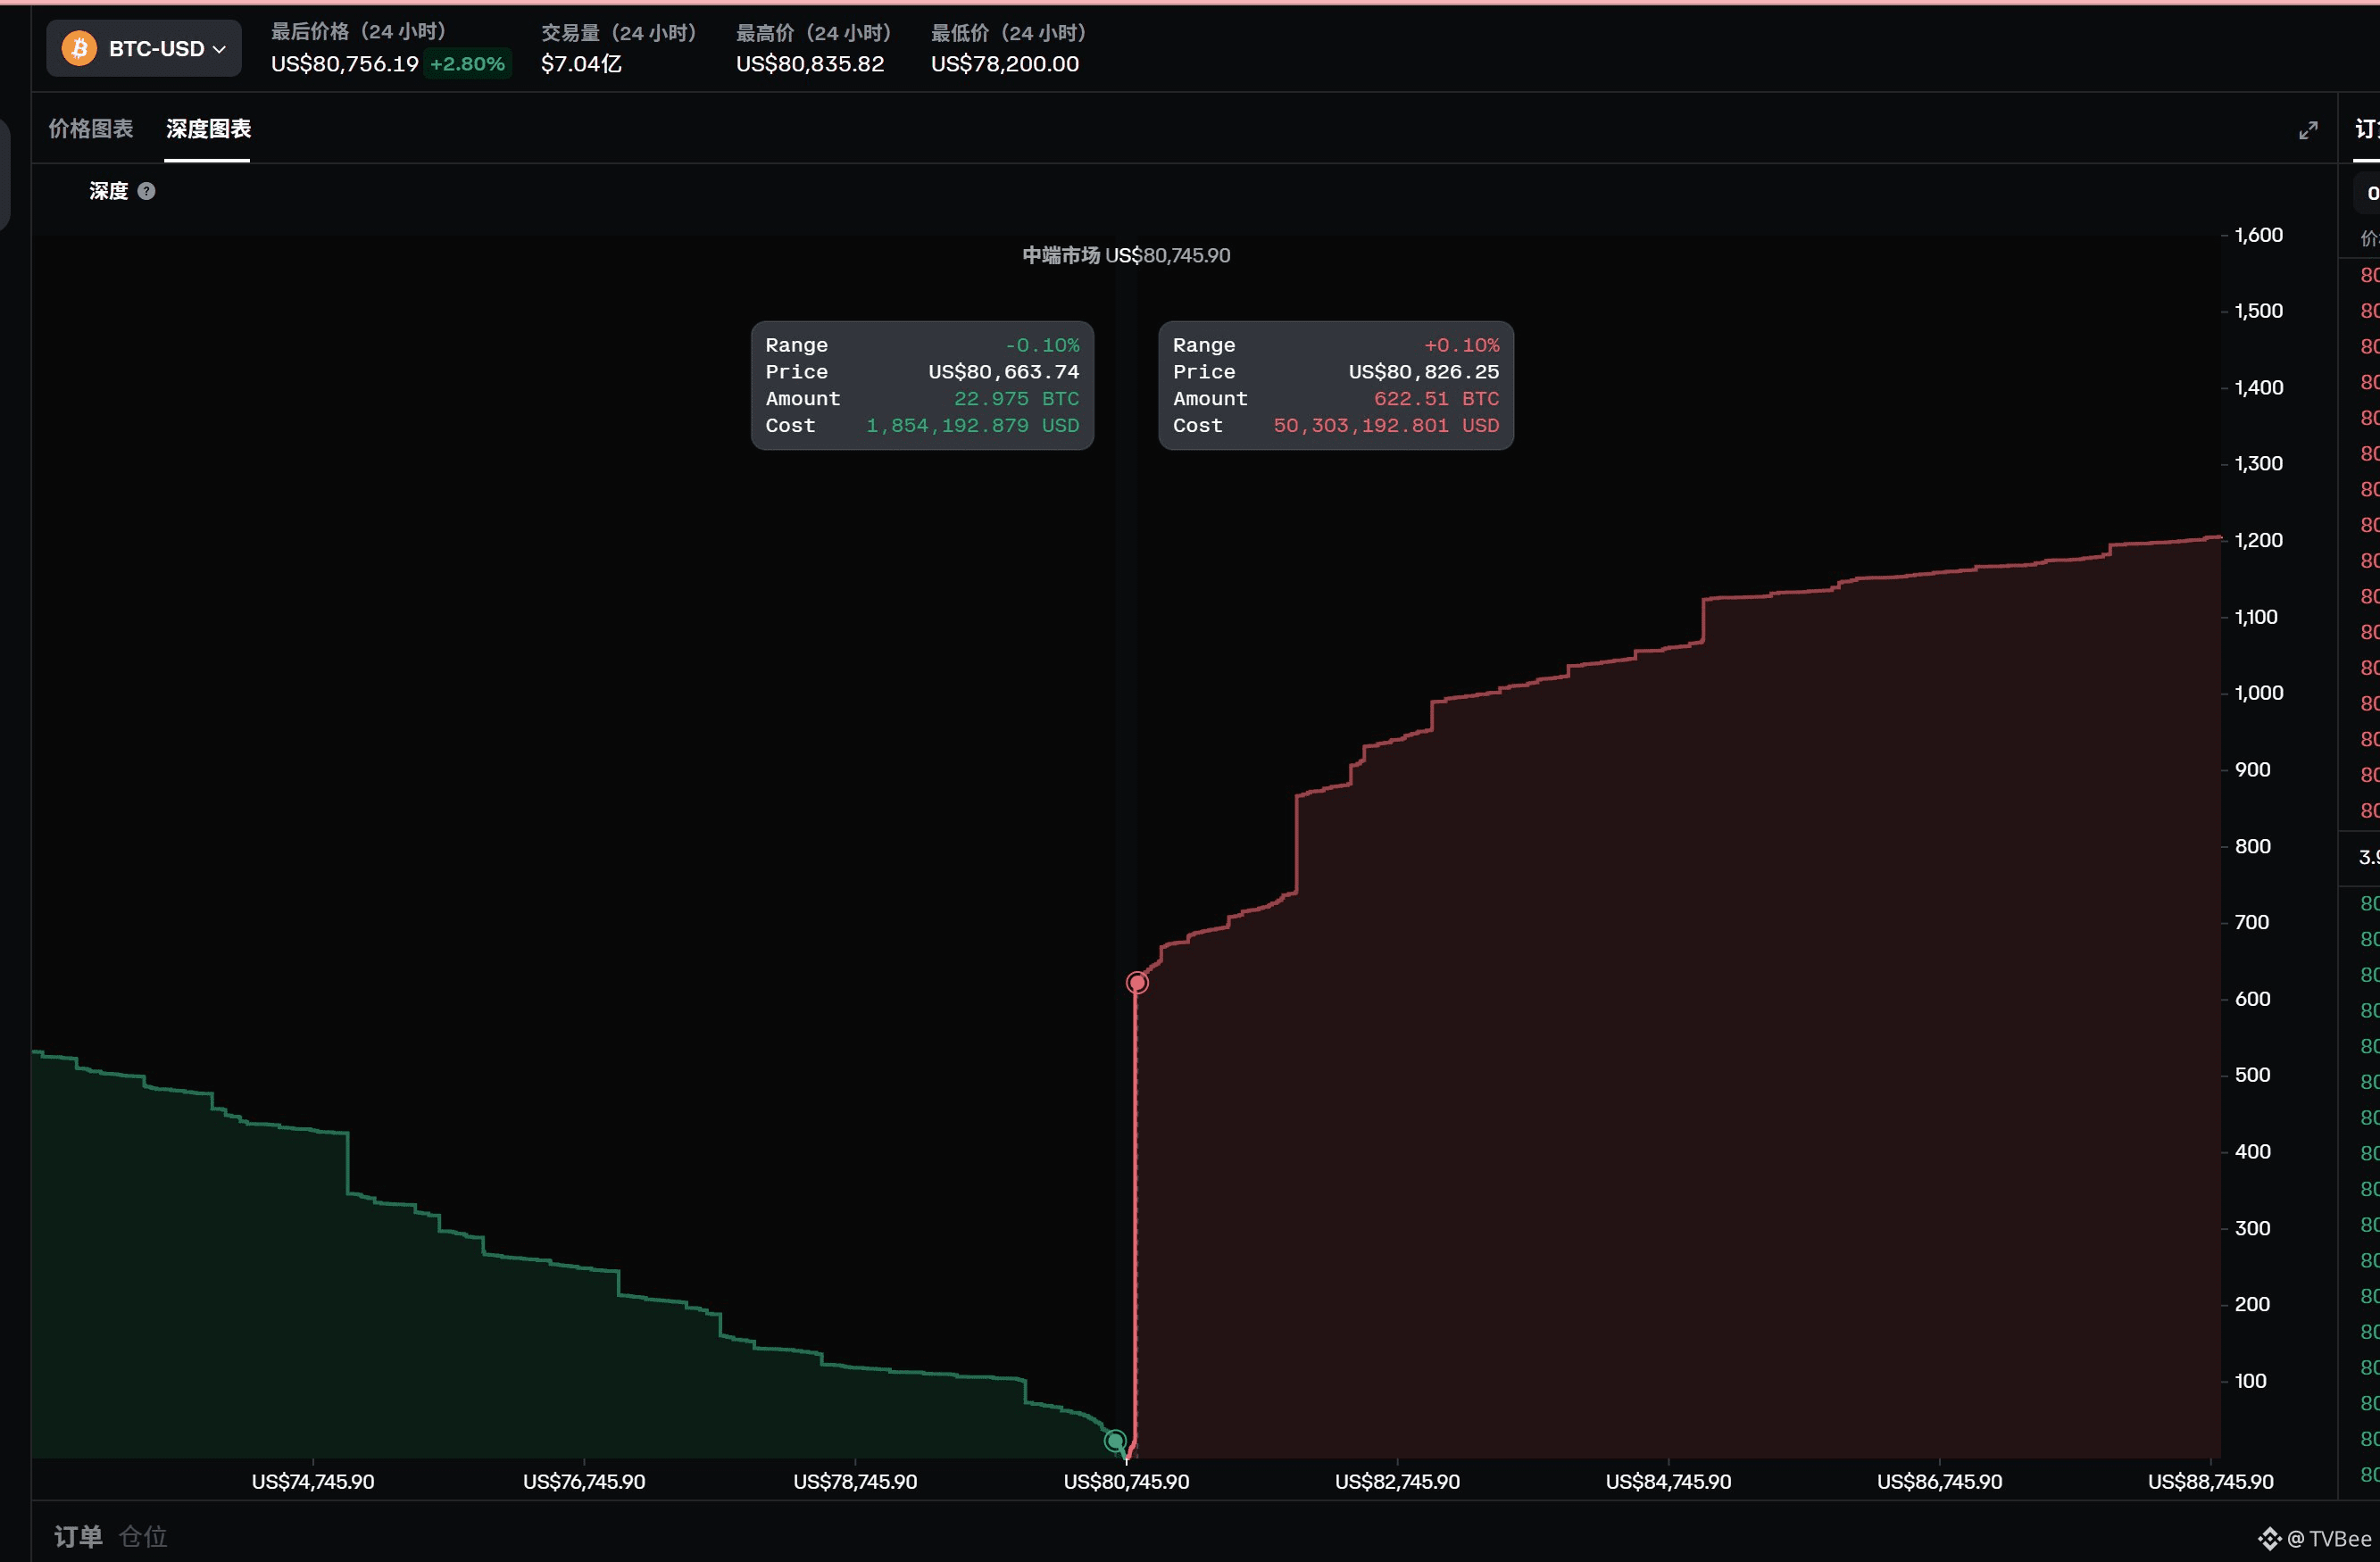
BTC80700+, 80800 area has quite strong selling pressure here. There are quite a lot of concentrated sell orders; on Coinbase, below 808 there are 622 BTC placed as sell orders.
From this level and below, the next resistance level is around 82000. However, right now there aren’t many sell orders; between 80800 and 82000, there are currently roughly 200+ open orders.
After going above 82000, for now, when looking at the depth chart, there’s no longer any concentrated order placement.
From this level and below, the next resistance level is around 82000. However, right now there aren’t many sell orders; between 80800 and 82000, there are currently roughly 200+ open orders.
After going above 82000, for now, when looking at the depth chart, there’s no longer any concentrated order placement.
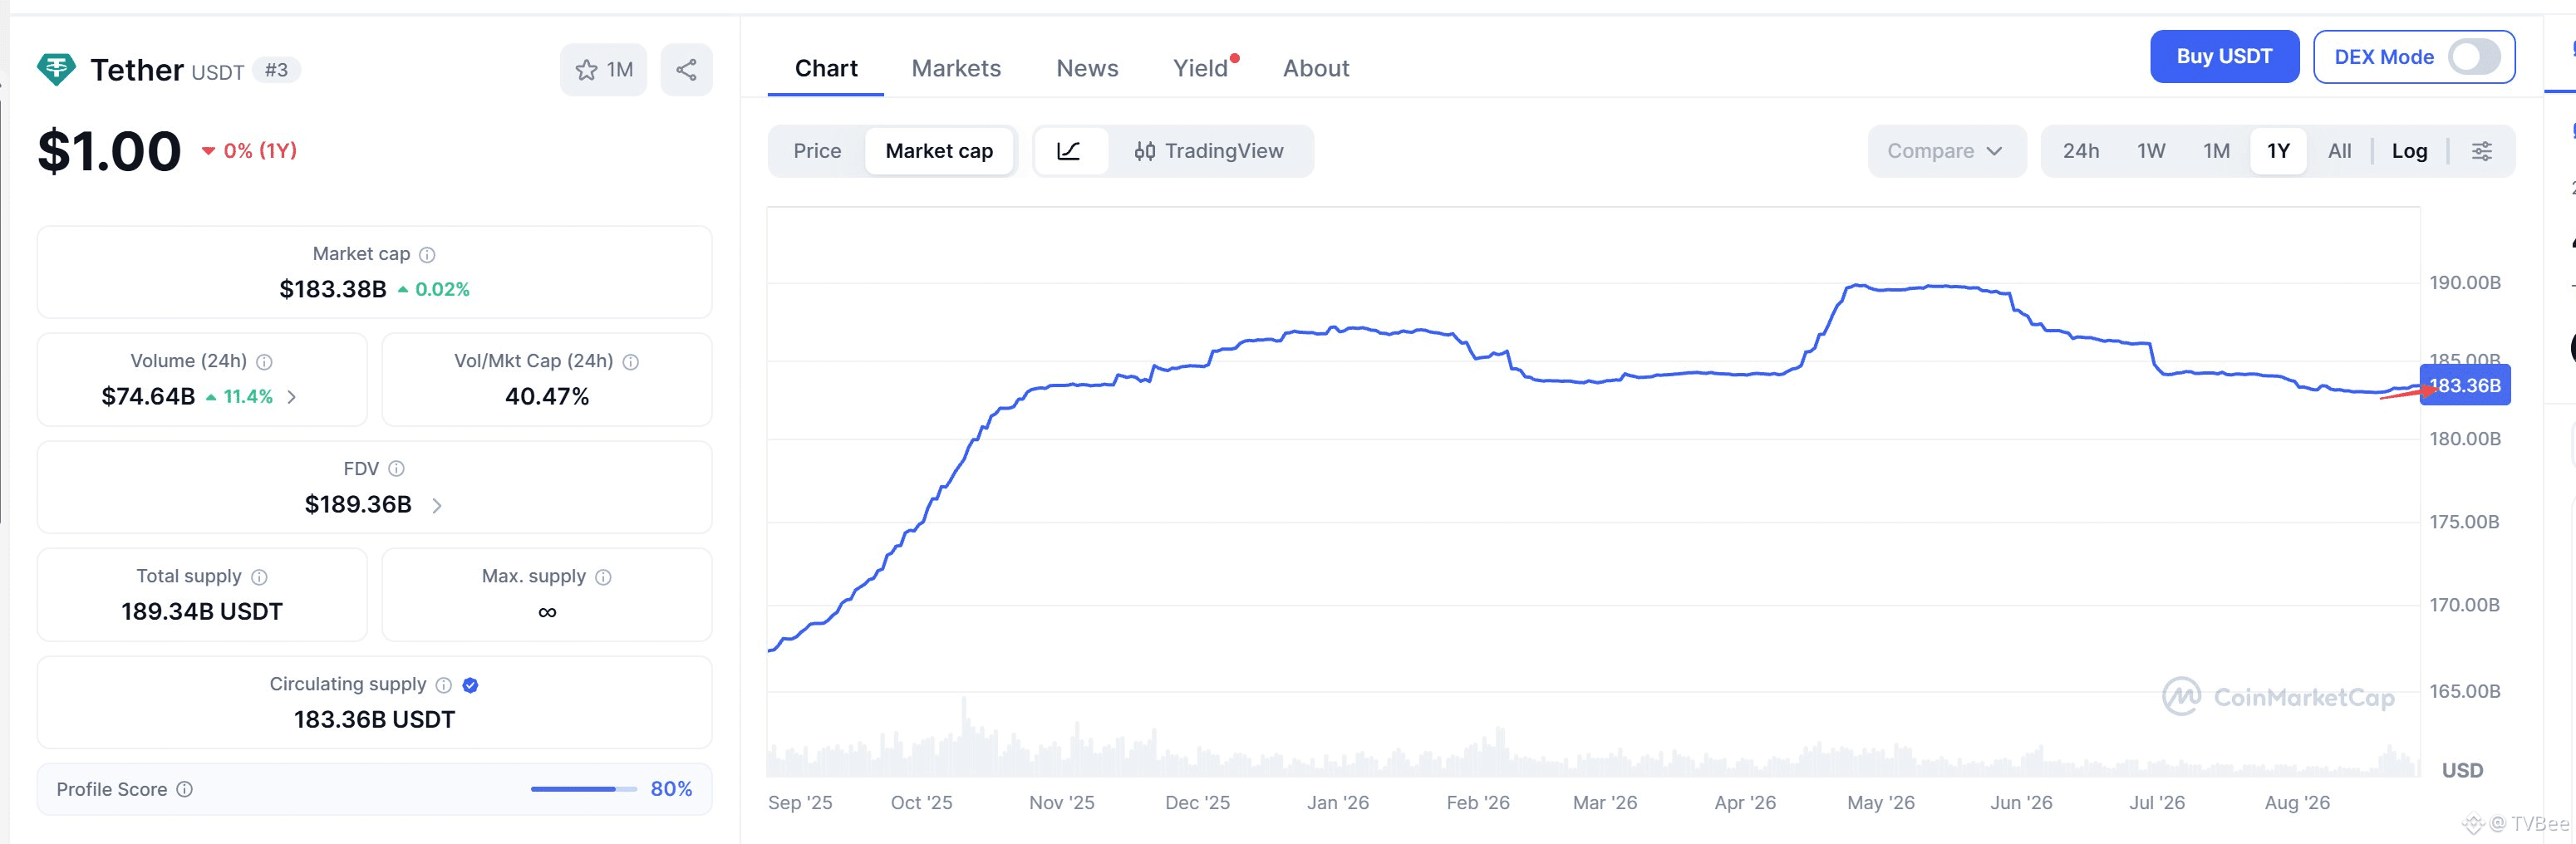
Stop watching the drama! BTC is back to 80k again!!
Last night, I specifically checked the market cap and price of USDT, and at the time I said that the funds were moving in and about to enter.
Today, congratulations—USDT is back to $1! You know what I mean : )
Last night, I specifically checked the market cap and price of USDT, and at the time I said that the funds were moving in and about to enter.
Today, congratulations—USDT is back to $1! You know what I mean : )
TVBee
·
--
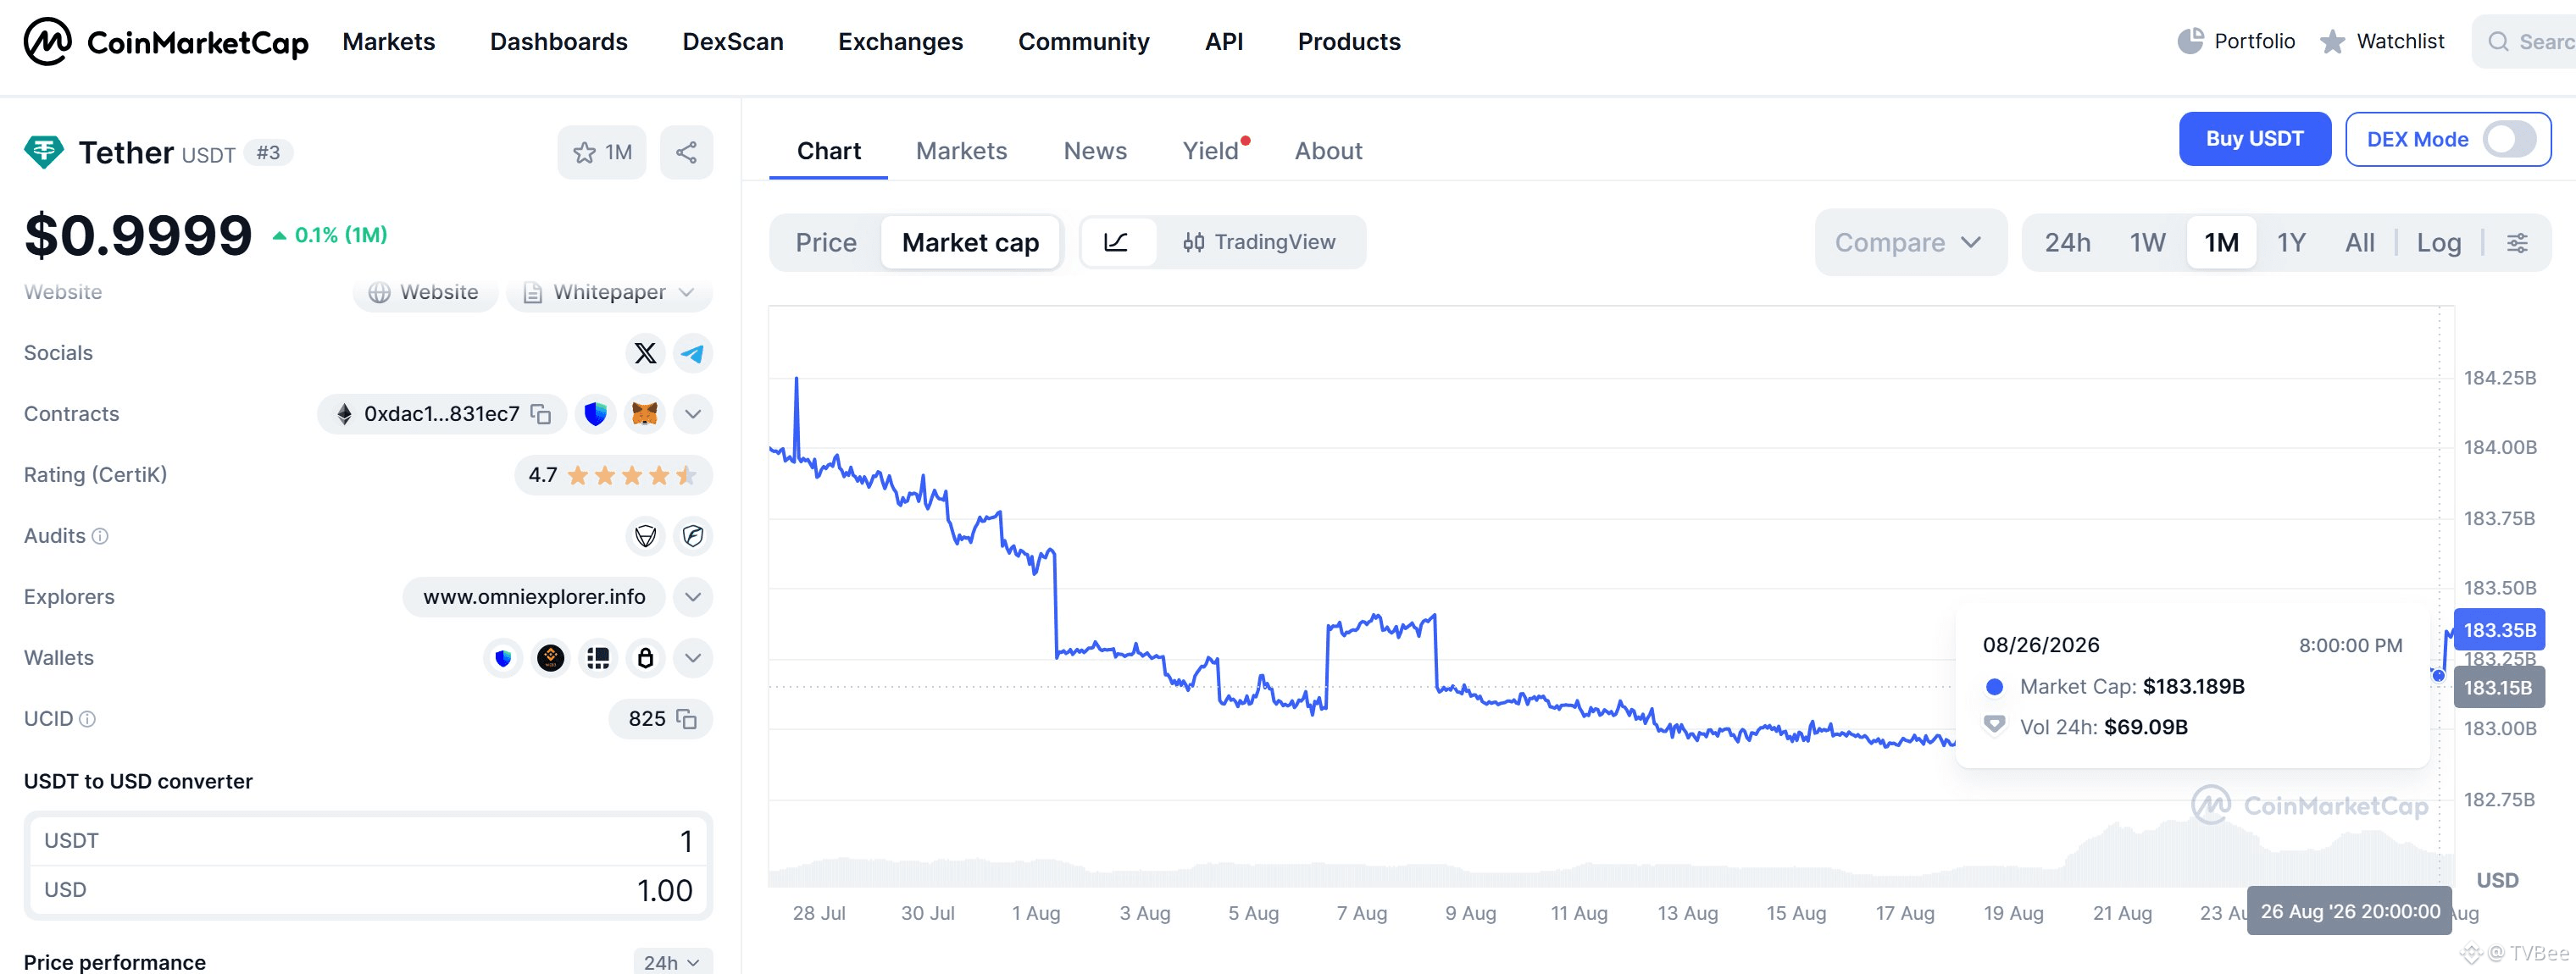
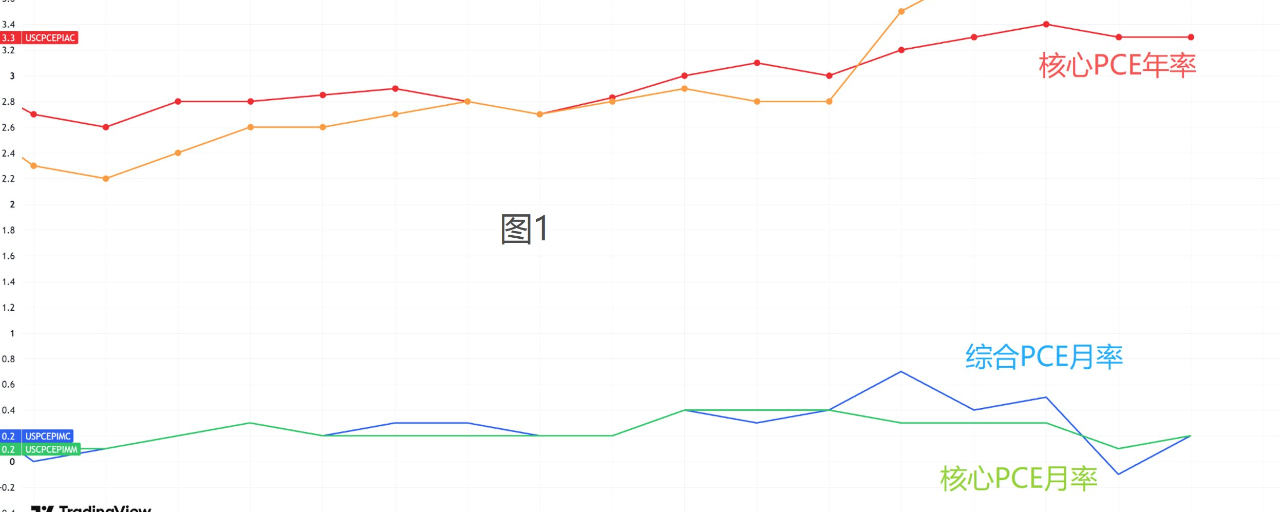
USDT market cap started to rise, and at the same time the price has immediately ended the negative premium.
Last night there was bad news from the PCE, but at 23:10 last night, there was a one-time issuance of 135 million.
Right now this growth rate isn’t that fast yet—it's more like funds are stepping in and entering the market.
Last night there was bad news from the PCE, but at 23:10 last night, there was a one-time issuance of 135 million.
Right now this growth rate isn’t that fast yet—it's more like funds are stepping in and entering the market.
USDT market cap started to rise, and at the same time the price has immediately ended the negative premium.
Last night there was bad news from the PCE, but at 23:10 last night, there was a one-time issuance of 135 million.
Right now this growth rate isn’t that fast yet—it's more like funds are stepping in and entering the market.
Last night there was bad news from the PCE, but at 23:10 last night, there was a one-time issuance of 135 million.
Right now this growth rate isn’t that fast yet—it's more like funds are stepping in and entering the market.
TVBee
·
--
Although the daily candlestick hasn’t closed yet, basically the attempt to push higher has failed, and the daily RSI is showing a divergence.
Next, Bitcoin could take a breather. Key things to watch are the PCE data on Wednesday, the NVDA earnings report on Thursday, and the speech by Waller on Friday—especially the PCE data tomorrow evening.
If you follow the “carving on the boat” approach to the May market, after a pullback there could be another wave. But this time the rally is very strong, so it can’t be treated as a simple repeat of the same pattern.
After that, what may influence the market is likely the progress of the crypto clarity bill. Before the pre-vote on September 15, there could also be expectation-driven volatility. Then comes the FOMC meeting on September 16 (17th Beijing time) and the dot plot.
Personally, Bee Brother thinks that in the macro sense, before the midterm election, there shouldn’t be much in the way of negative news.
Next, Bitcoin could take a breather. Key things to watch are the PCE data on Wednesday, the NVDA earnings report on Thursday, and the speech by Waller on Friday—especially the PCE data tomorrow evening.
If you follow the “carving on the boat” approach to the May market, after a pullback there could be another wave. But this time the rally is very strong, so it can’t be treated as a simple repeat of the same pattern.
After that, what may influence the market is likely the progress of the crypto clarity bill. Before the pre-vote on September 15, there could also be expectation-driven volatility. Then comes the FOMC meeting on September 16 (17th Beijing time) and the dot plot.
Personally, Bee Brother thinks that in the macro sense, before the midterm election, there shouldn’t be much in the way of negative news.
Log in to explore more content