
DeFi狙击手
88 Posts

DeFi狙击手
 Square Verified
DeFi狙击手 | 专注DeFi Alpha捕捉 | 链上机会主义者 | 不信空气,只信TVL与流动性
30 Following
117 Followers
24 Liked
Posts
All
Quotes
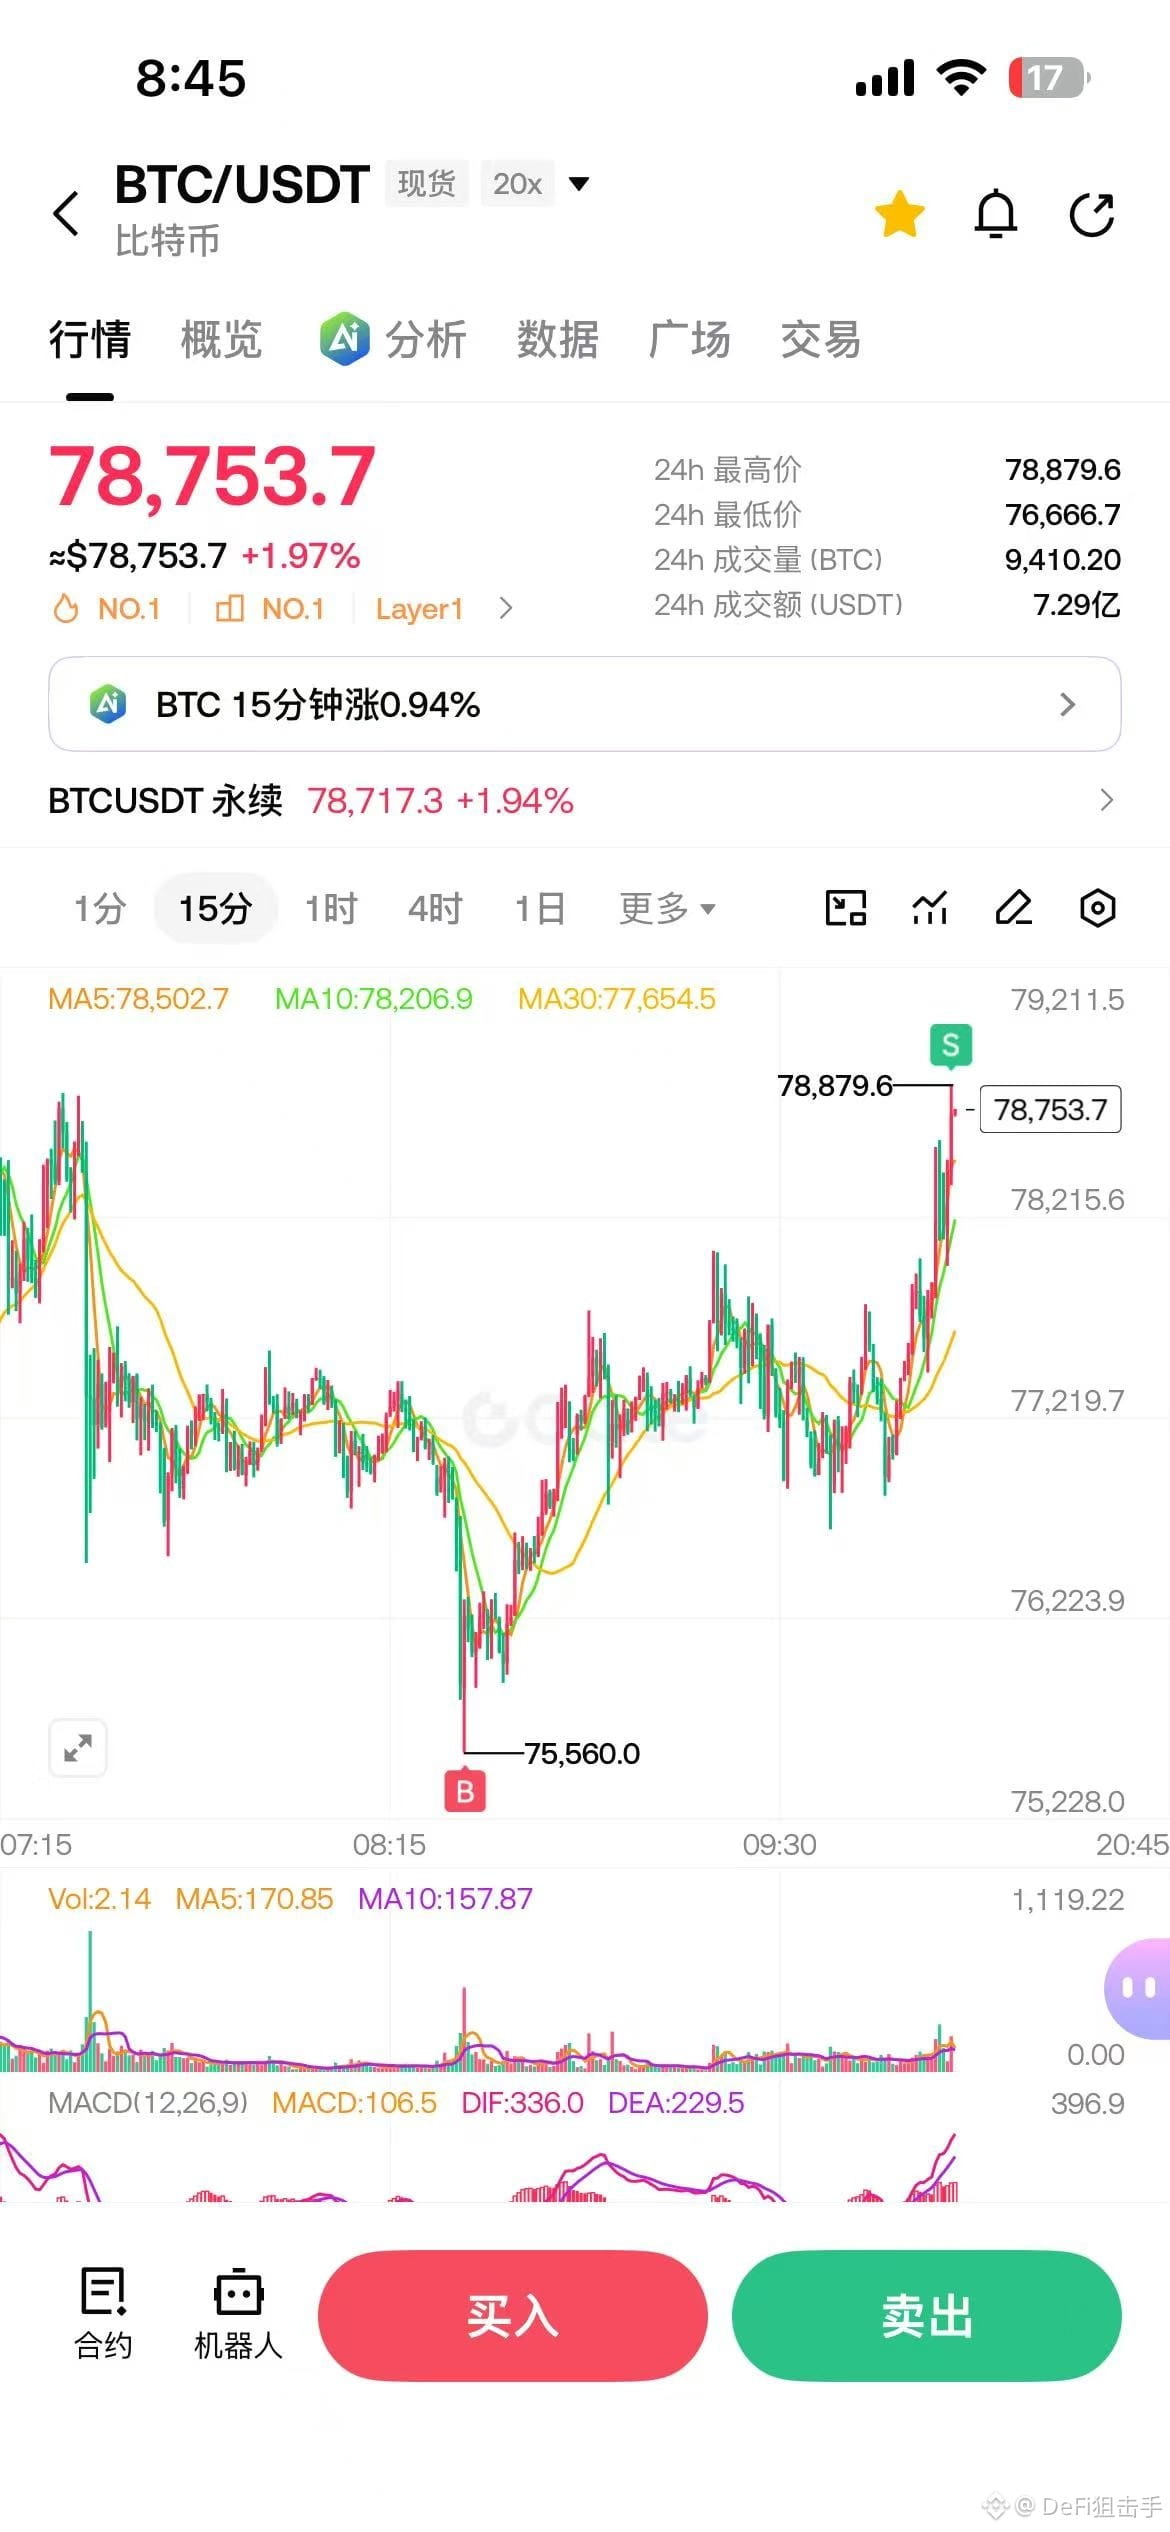
Yesterday when I joined Space with Brother Wang and 77, my judgment was very clear:
After BTC violently rallies upward, it won’t keep going in a straight line forever. $75,000—76,000 is the first pullback area that needs close attention. As long as this range can hold, it’s more like liquidations and leverage being flushed out—not the end of the trend.
Today’s chart happened to play out this scenario.
BTC quickly pierced down from near $79,000 to $75,560, and I also added a small position around $75,500. Afterwards, the price reclaimed above $77,000, and the short-term follow-through is currently still acceptable.
This time, it isn’t a blind bottom-fishing entry.
U.S. spot BTC ETFs have seen net inflows for 5 consecutive trading days, totaling about $1.92 billion for the week. During the pullback, BTC’s open interest also fell by about 3.69%, which is essentially washing out part of the leverage that was chasing the top earlier.
Next, I’m mainly watching a few levels:
- Hold $75,500, and there should be another opportunity to retest $79,000—$80,000;
- Once it effectively holds above $79,500, then look at $82,000—$84,000;
- If the 4-hour timeframe breaks below $75,500, then be cautious about a pullback to $73,500—$74,500.
My current mindset is still spot-focused: don’t chase when there’s a continuous surge. Identify levels in advance, and then act when the market drops.
Getting the buy point right doesn’t mean there won’t be volatility later—the position size and risk still need to be controlled by yourself.
After BTC violently rallies upward, it won’t keep going in a straight line forever. $75,000—76,000 is the first pullback area that needs close attention. As long as this range can hold, it’s more like liquidations and leverage being flushed out—not the end of the trend.
Today’s chart happened to play out this scenario.
BTC quickly pierced down from near $79,000 to $75,560, and I also added a small position around $75,500. Afterwards, the price reclaimed above $77,000, and the short-term follow-through is currently still acceptable.
This time, it isn’t a blind bottom-fishing entry.
U.S. spot BTC ETFs have seen net inflows for 5 consecutive trading days, totaling about $1.92 billion for the week. During the pullback, BTC’s open interest also fell by about 3.69%, which is essentially washing out part of the leverage that was chasing the top earlier.
Next, I’m mainly watching a few levels:
- Hold $75,500, and there should be another opportunity to retest $79,000—$80,000;
- Once it effectively holds above $79,500, then look at $82,000—$84,000;
- If the 4-hour timeframe breaks below $75,500, then be cautious about a pullback to $73,500—$74,500.
My current mindset is still spot-focused: don’t chase when there’s a continuous surge. Identify levels in advance, and then act when the market drops.
Getting the buy point right doesn’t mean there won’t be volatility later—the position size and risk still need to be controlled by yourself.
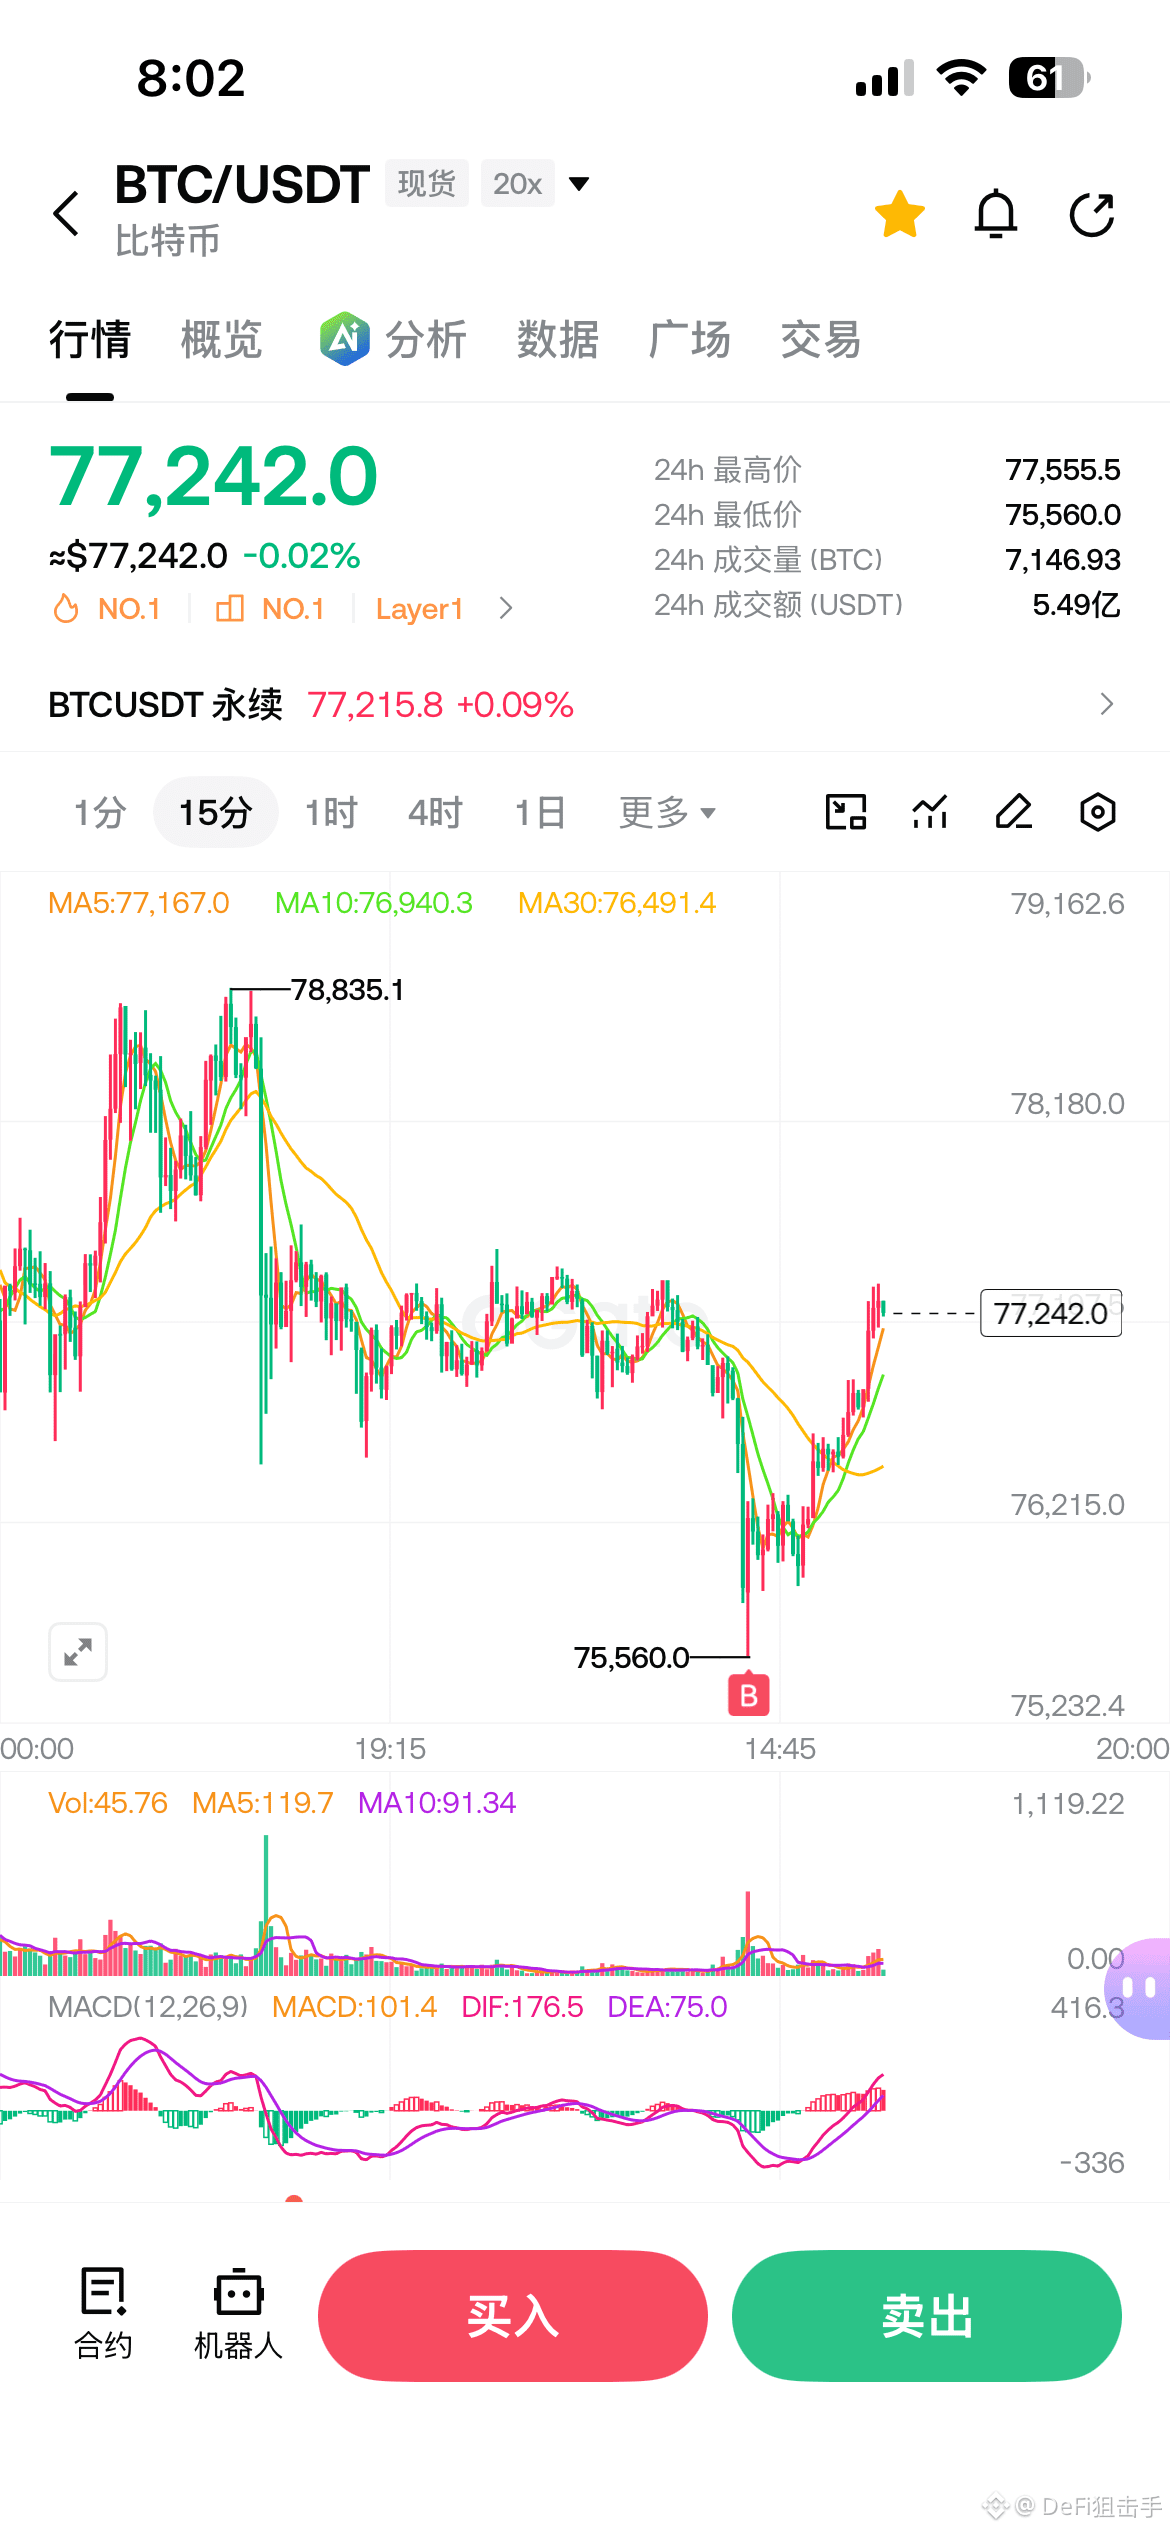
$BTC 71,838, a day of surge of 11.4%, reaching 72,490.
66,956—the previous high—was kicked aside today, with no decent pullback given.
ETH is even crazier: up 18.5% in a day, straight to $2,280, and $2,000 was broken as soon as it was mentioned.
The Fear Index jumped from 46 to 62, officially entering the Greed zone. Retail investors finally woke up.
Every macro-level item has played out—nothing left out.
The U.S. dollar index broke below 100—this is iconic. The weak-dollar cycle is here.
The 10-year U.S. Treasury yield has been trending down all the way from 4.72% to 4.65%, and the market is front-running rate cuts.
Gold at 4,515 is just one step away from the prior high. This time, gold and BTC are charging upward hand in hand.
A weak dollar, looser Treasuries, a liquidity turning point, and money moving around—today’s logic has all been verified.
Now the problem isn’t whether it will rise, but what to do when it rises too fast.
With an 11% day, historically this slope usually comes with a short-term pullback.
Above 72,000 is a vacuum zone—no trapped positions. In theory, it can keep going.
But with the Greed Index at 62, people chasing higher are already getting squeezed.
My take: the trend has already reversed, but don’t chase on the day of an 11% big bullish candle.
A pullback to 69,000–70,000 would be a healthy shakeout—and also a chance to get in.
Bias is bullish. The bull is back, but even the bull will lower its head to drink water.
$BTC
66,956—the previous high—was kicked aside today, with no decent pullback given.
ETH is even crazier: up 18.5% in a day, straight to $2,280, and $2,000 was broken as soon as it was mentioned.
The Fear Index jumped from 46 to 62, officially entering the Greed zone. Retail investors finally woke up.
Every macro-level item has played out—nothing left out.
The U.S. dollar index broke below 100—this is iconic. The weak-dollar cycle is here.
The 10-year U.S. Treasury yield has been trending down all the way from 4.72% to 4.65%, and the market is front-running rate cuts.
Gold at 4,515 is just one step away from the prior high. This time, gold and BTC are charging upward hand in hand.
A weak dollar, looser Treasuries, a liquidity turning point, and money moving around—today’s logic has all been verified.
Now the problem isn’t whether it will rise, but what to do when it rises too fast.
With an 11% day, historically this slope usually comes with a short-term pullback.
Above 72,000 is a vacuum zone—no trapped positions. In theory, it can keep going.
But with the Greed Index at 62, people chasing higher are already getting squeezed.
My take: the trend has already reversed, but don’t chase on the day of an 11% big bullish candle.
A pullback to 69,000–70,000 would be a healthy shakeout—and also a chance to get in.
Bias is bullish. The bull is back, but even the bull will lower its head to drink water.
$BTC
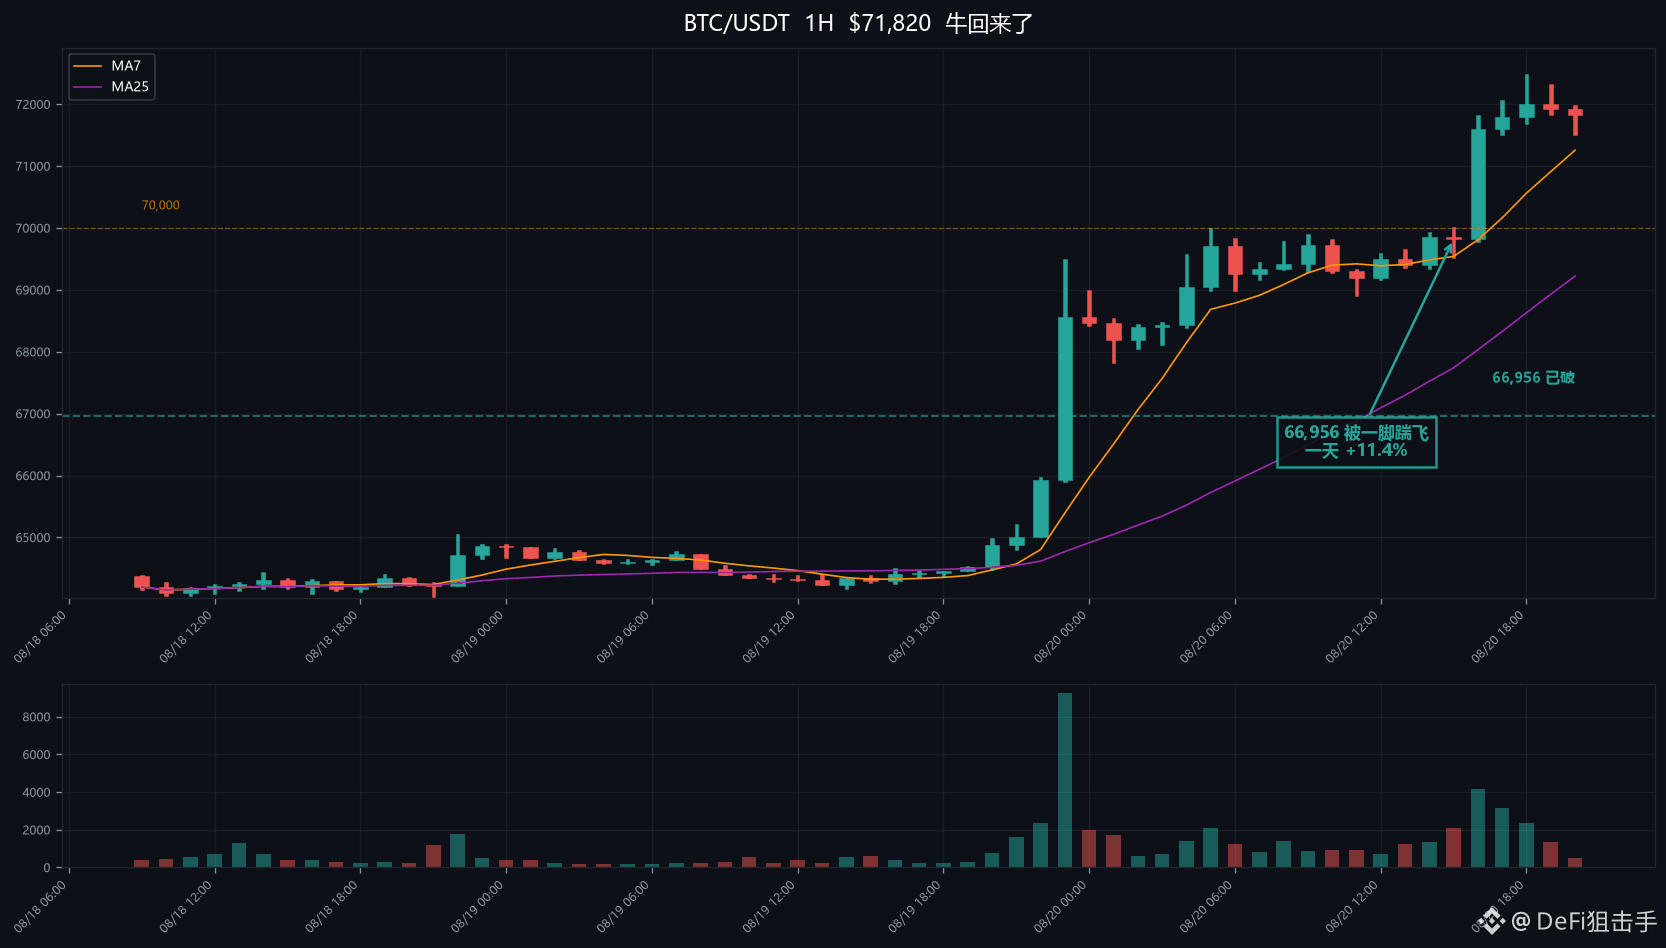
$BTC 64,414,Today this market looks very interesting.
The Nasdaq fell 1.33%, the S&P 500 fell 0.69%, and the VIX—fear index—rose another 4.3%.
Stocks are down, but BTC is actually up 0.47%.
This isn’t random. It’s funds rotating their positions.
Stocks have been rising for a full two years, valuations are already very high, and smart money is starting to lock in profits.
Where did the money come out of the stock market go? Safe-haven assets.
Gold is sitting at 4,411, not moving but not falling. BTC is rising against the trend.
The fear index has climbed from 29 up to 46, and sentiment in the crypto market is rapidly recovering.
Remember, a month ago this number was still stuck in the extreme fear zone around 22.
The US Dollar Index is weak near 100, and the 10-year US Treasury yield has started to ease from its highs.
Three macro signals are showing up at the same time: a pullback in US stocks, a weakening dollar, and easing US Treasury yields.
Put into plain language: the global liquidity turning point is approaching, and safe-haven assets benefit first.
BTC’s current role is very clear: it isn’t a risk asset—it’s digital gold.
The more US stocks drop, the more it highlights BTC’s safe-haven characteristics.
My take: funds are moving from the stock market to the crypto market, and this BTC move will follow its own rhythm.
Leaning bullish. Keep an eye on 66,956—the prior high. Break it and that’s confirmation.
$BTC
The Nasdaq fell 1.33%, the S&P 500 fell 0.69%, and the VIX—fear index—rose another 4.3%.
Stocks are down, but BTC is actually up 0.47%.
This isn’t random. It’s funds rotating their positions.
Stocks have been rising for a full two years, valuations are already very high, and smart money is starting to lock in profits.
Where did the money come out of the stock market go? Safe-haven assets.
Gold is sitting at 4,411, not moving but not falling. BTC is rising against the trend.
The fear index has climbed from 29 up to 46, and sentiment in the crypto market is rapidly recovering.
Remember, a month ago this number was still stuck in the extreme fear zone around 22.
The US Dollar Index is weak near 100, and the 10-year US Treasury yield has started to ease from its highs.
Three macro signals are showing up at the same time: a pullback in US stocks, a weakening dollar, and easing US Treasury yields.
Put into plain language: the global liquidity turning point is approaching, and safe-haven assets benefit first.
BTC’s current role is very clear: it isn’t a risk asset—it’s digital gold.
The more US stocks drop, the more it highlights BTC’s safe-haven characteristics.
My take: funds are moving from the stock market to the crypto market, and this BTC move will follow its own rhythm.
Leaning bullish. Keep an eye on 66,956—the prior high. Break it and that’s confirmation.
$BTC
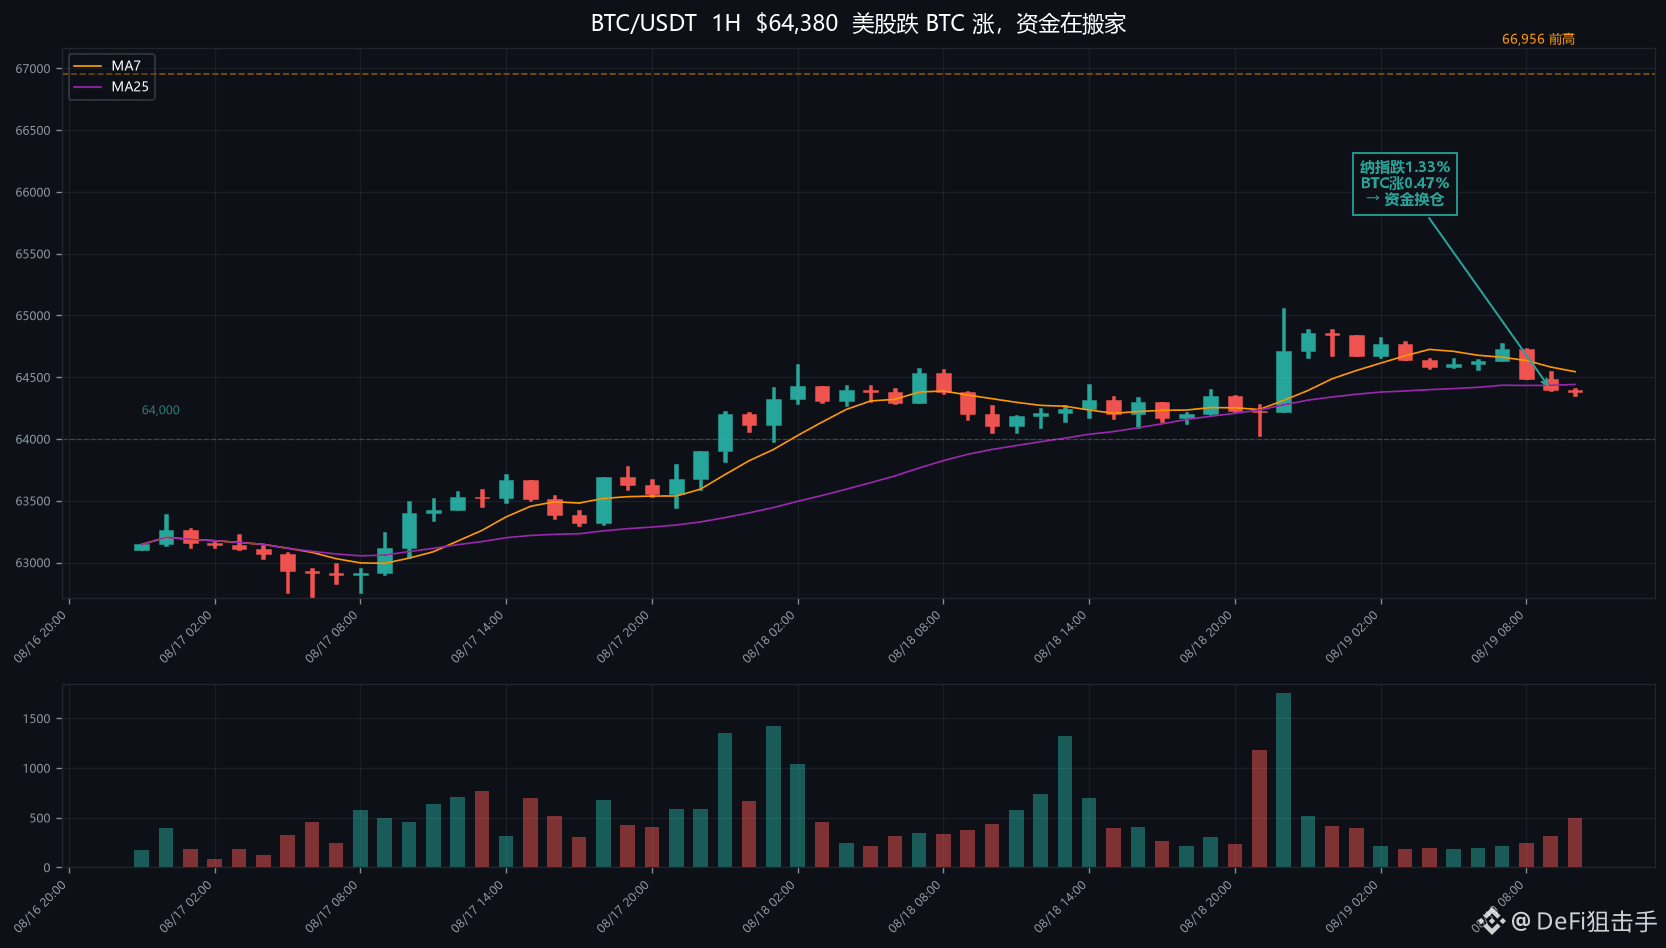
$BTC 64,224,Today, the focus is not on the K-line, but on gold.
Gold is now at 4,452, just 5.8% shy of this year's January all-time high of 4,714.
After topping in January, gold pulled back to 4,023 in June, a drop of 15%. Now it has climbed back to 4,452, rebounding 10.6%.
Gold and BTC are moving to the same rhythm.
BTC has pulled back from 66,956 to 62,600, and is now back at 64,200, also nearing the previous high.
The two most core safe-haven assets are seeing synchronized pullbacks and rebounds, driven by the same variable: global liquidity expectations.
The US Dollar Index is slightly weak around 100, and the 10-year US Treasury yield is stuck near the highs at 4.7%.
The market is waiting for one thing: the Fed to signal openness to cutting rates.
Gold dares to rebound 10% from its low in a high-interest-rate environment—it is betting on this.
The fear index has risen from 29 to 41, and crypto sentiment is also resonating with the macro backdrop.
The real deciding factor is whether gold can break through 4,714.
Once gold sets a new all-time high, safe-haven assets will surge across the board, and BTC will follow.
The corresponding BTC level is 66,956. If it breaks, the next leg of the market will officially begin.
Before that, it’s all rebounds—not a reversal.
The direction is cautiously bullish—keep a close eye on gold’s prior high as your compass.
$BTC
Gold is now at 4,452, just 5.8% shy of this year's January all-time high of 4,714.
After topping in January, gold pulled back to 4,023 in June, a drop of 15%. Now it has climbed back to 4,452, rebounding 10.6%.
Gold and BTC are moving to the same rhythm.
BTC has pulled back from 66,956 to 62,600, and is now back at 64,200, also nearing the previous high.
The two most core safe-haven assets are seeing synchronized pullbacks and rebounds, driven by the same variable: global liquidity expectations.
The US Dollar Index is slightly weak around 100, and the 10-year US Treasury yield is stuck near the highs at 4.7%.
The market is waiting for one thing: the Fed to signal openness to cutting rates.
Gold dares to rebound 10% from its low in a high-interest-rate environment—it is betting on this.
The fear index has risen from 29 to 41, and crypto sentiment is also resonating with the macro backdrop.
The real deciding factor is whether gold can break through 4,714.
Once gold sets a new all-time high, safe-haven assets will surge across the board, and BTC will follow.
The corresponding BTC level is 66,956. If it breaks, the next leg of the market will officially begin.
Before that, it’s all rebounds—not a reversal.
The direction is cautiously bullish—keep a close eye on gold’s prior high as your compass.
$BTC
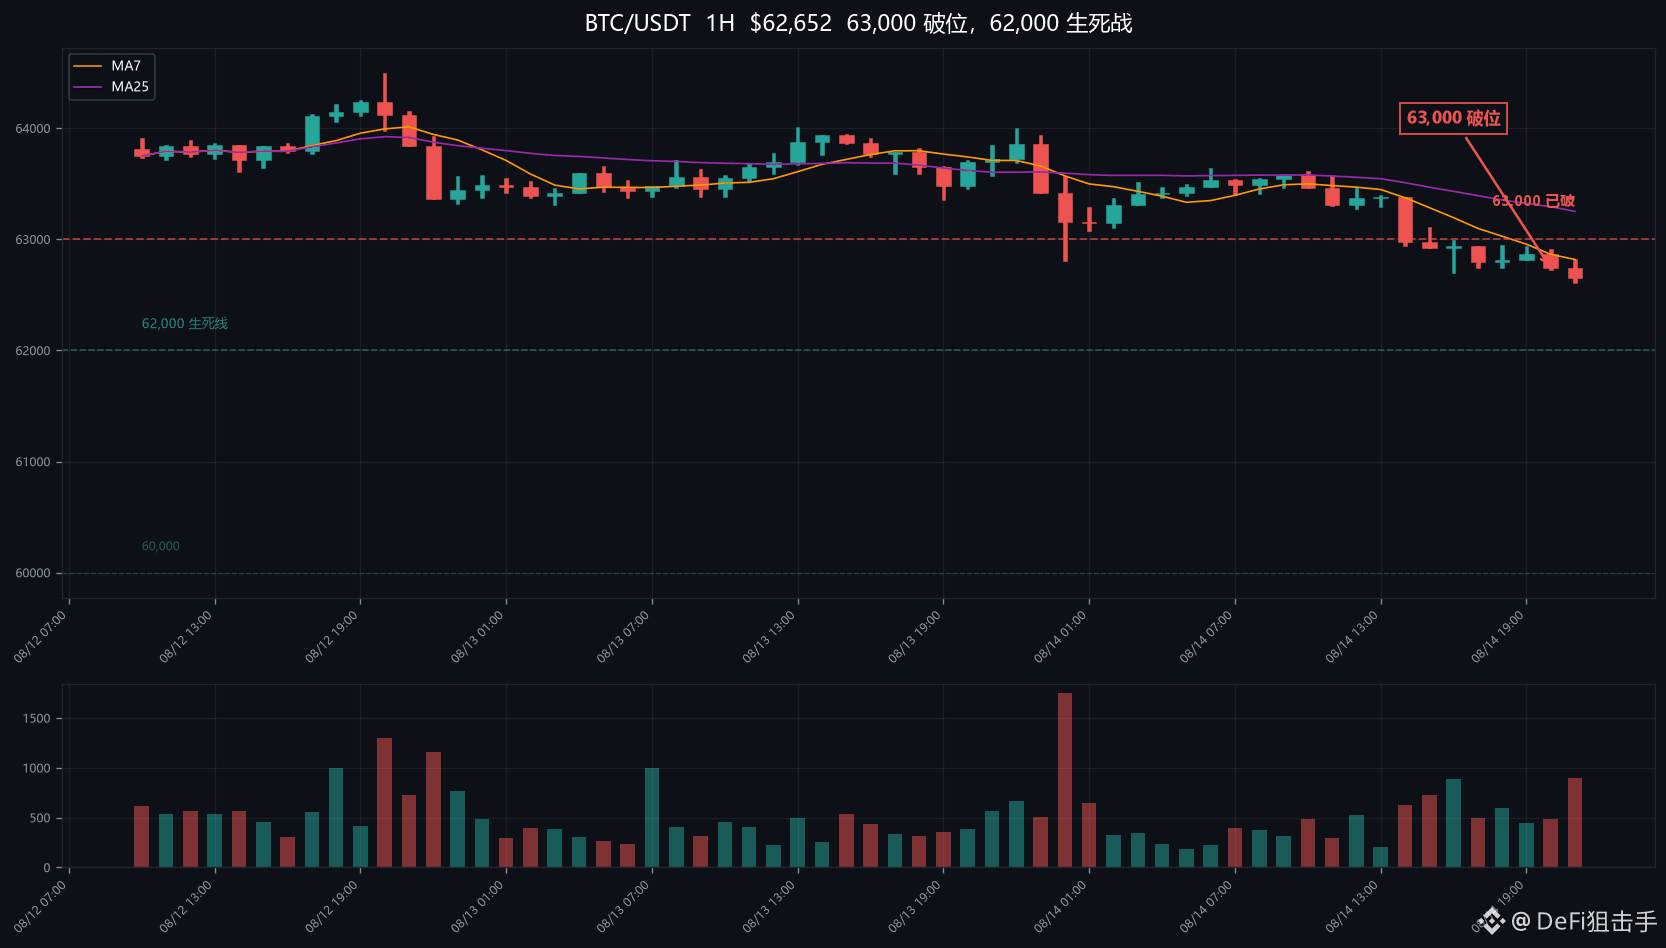
$BTC 62,652, 63,000 has broken.
Last time I said that 63,000 was the long side’s support line—if it can’t hold, we’d see 62,000. Today is where that comes true.
From 64,000, it drifted downward all the way to 62,605. In one day, it fell by 1,700 points.
On the 1-hour chart it kept stepping down the whole way, with no meaningful rebound. The shorts have been pressing it step by step.
On the US market, Nasdaq is +0.07% and the S&P is +0.11%, basically flat.
The US market hasn’t crashed; BTC fell on its own first. That shows it’s not external factors—it’s selling pressure from within the crypto market.
Gold is up another 2%, and it’s been rising every day for two straight weeks. Safe-haven funds are determined to run into gold.
BTC has been continuously bled—this comparison already says a lot.
The fear index is 29 and hasn’t moved at all. This is the most worrying part.
We’ve dropped to 62,600, and the fear index is still 29, which means panic selling hasn’t really come out.
Without panic-driven selling, declines often aren’t at the bottom yet. A true bottom usually requires a high-volume, violent selloff.
Below that, look at 62,000—this is the final dense trading zone, and the hard floor from May.
If 62,000 holds, there’s still a chance. If 62,000 breaks, this rebound is completely over and we’ll be looking at 60,000.
Bias is bearish. This isn’t a time to buy the dip—wait for the life-or-death battle at 62,000.
$BTC
Last time I said that 63,000 was the long side’s support line—if it can’t hold, we’d see 62,000. Today is where that comes true.
From 64,000, it drifted downward all the way to 62,605. In one day, it fell by 1,700 points.
On the 1-hour chart it kept stepping down the whole way, with no meaningful rebound. The shorts have been pressing it step by step.
On the US market, Nasdaq is +0.07% and the S&P is +0.11%, basically flat.
The US market hasn’t crashed; BTC fell on its own first. That shows it’s not external factors—it’s selling pressure from within the crypto market.
Gold is up another 2%, and it’s been rising every day for two straight weeks. Safe-haven funds are determined to run into gold.
BTC has been continuously bled—this comparison already says a lot.
The fear index is 29 and hasn’t moved at all. This is the most worrying part.
We’ve dropped to 62,600, and the fear index is still 29, which means panic selling hasn’t really come out.
Without panic-driven selling, declines often aren’t at the bottom yet. A true bottom usually requires a high-volume, violent selloff.
Below that, look at 62,000—this is the final dense trading zone, and the hard floor from May.
If 62,000 holds, there’s still a chance. If 62,000 breaks, this rebound is completely over and we’ll be looking at 60,000.
Bias is bearish. This isn’t a time to buy the dip—wait for the life-or-death battle at 62,000.
$BTC
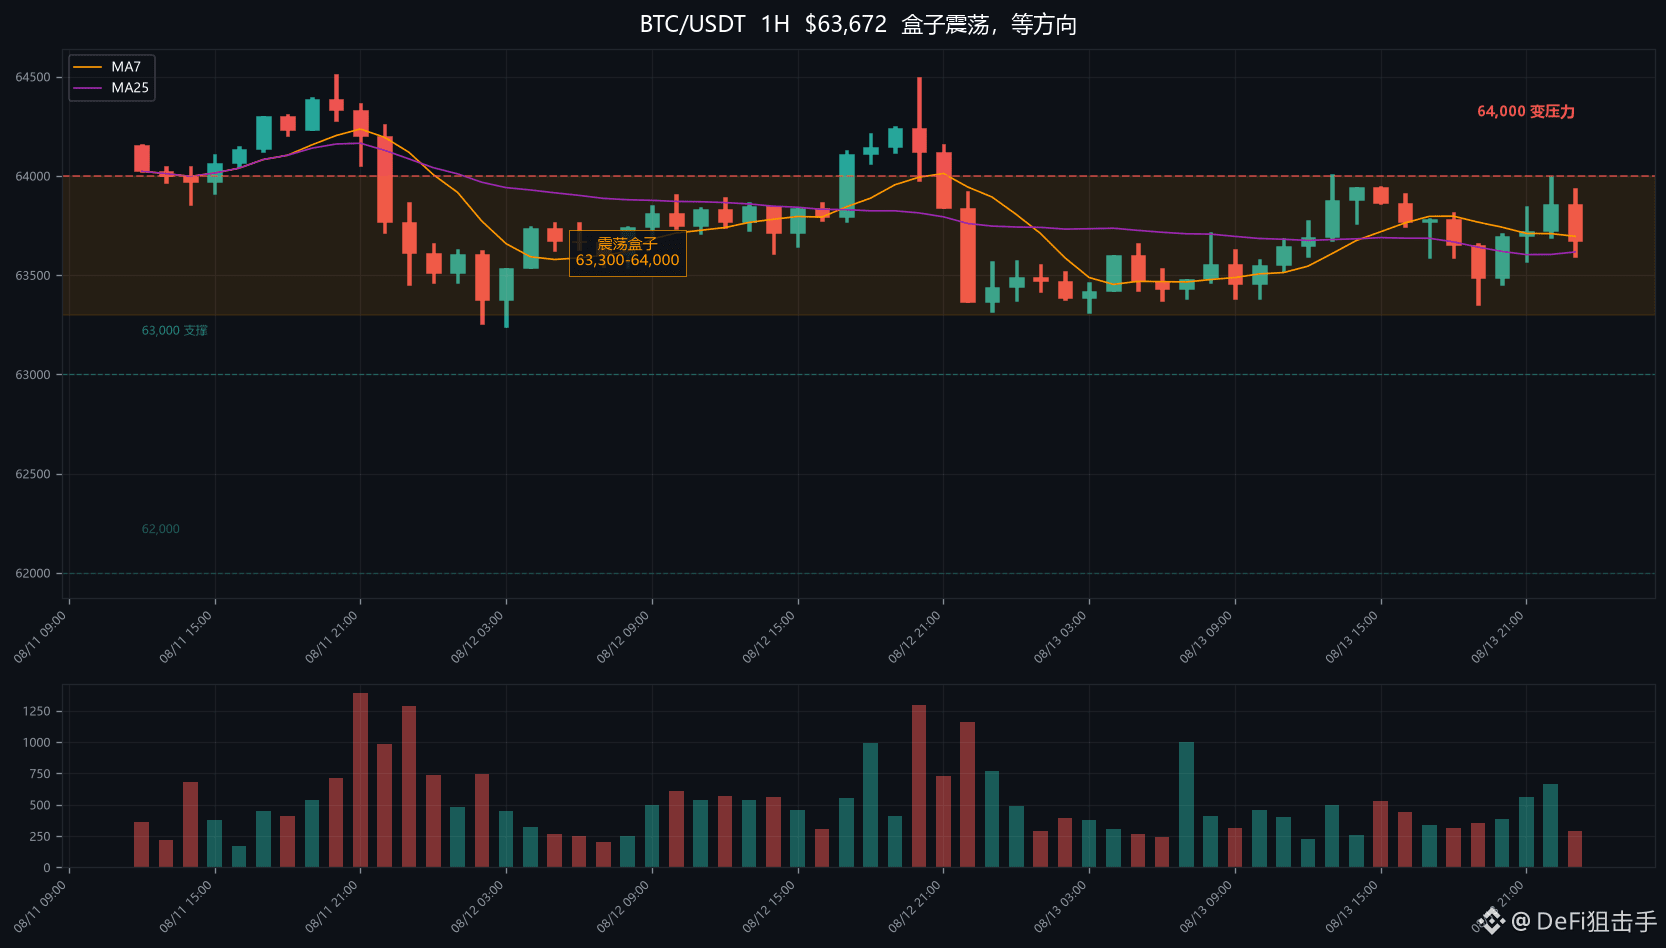
$BTC 63,677,64,000 After losing the level, it bounced back twice but couldn’t get back up.
Yesterday it broke through 64,000 into the close; today it tried to pull back. The high was 64,010, but it was pinned back down again.
On the 1-hour chart it’s very clear: BTC is grinding in this box of 63,300–64,000.
On the U.S. side, the Nasdaq is up +0.6% and the S&P is up +0.44%, with a modest rise. But BTC isn’t following.
Gold’s gain has also narrowed to 0.4%, and risk-off sentiment is cooling.
The fear index is 29 and hasn’t moved much from last week to now. Retail isn’t panicking, and it’s not excited either.
This is the most grinding kind of condition: it doesn’t drop deep, and it can’t push up—just back-and-forth range trading.
64,000 has turned from support into resistance—this is a structural change.
But 63,000 has been holding, and the bulls haven’t given up. Both times it was dumped down to 63,300, it was taken back.
The current setup: this 1,000-dollar box from 63,000 to 64,000—bulls and bears are wrestling inside it.
My take: in the short term it’s still range-bound; don’t expect a breakout right away.
If 63,000 breaks, look to 62,000. Only if 64,000 holds can we start looking long again.
Don’t act in the middle of the box—wait for it to choose a direction on its own.
$BTC
Yesterday it broke through 64,000 into the close; today it tried to pull back. The high was 64,010, but it was pinned back down again.
On the 1-hour chart it’s very clear: BTC is grinding in this box of 63,300–64,000.
On the U.S. side, the Nasdaq is up +0.6% and the S&P is up +0.44%, with a modest rise. But BTC isn’t following.
Gold’s gain has also narrowed to 0.4%, and risk-off sentiment is cooling.
The fear index is 29 and hasn’t moved much from last week to now. Retail isn’t panicking, and it’s not excited either.
This is the most grinding kind of condition: it doesn’t drop deep, and it can’t push up—just back-and-forth range trading.
64,000 has turned from support into resistance—this is a structural change.
But 63,000 has been holding, and the bulls haven’t given up. Both times it was dumped down to 63,300, it was taken back.
The current setup: this 1,000-dollar box from 63,000 to 64,000—bulls and bears are wrestling inside it.
My take: in the short term it’s still range-bound; don’t expect a breakout right away.
If 63,000 breaks, look to 62,000. Only if 64,000 holds can we start looking long again.
Don’t act in the middle of the box—wait for it to choose a direction on its own.
$BTC
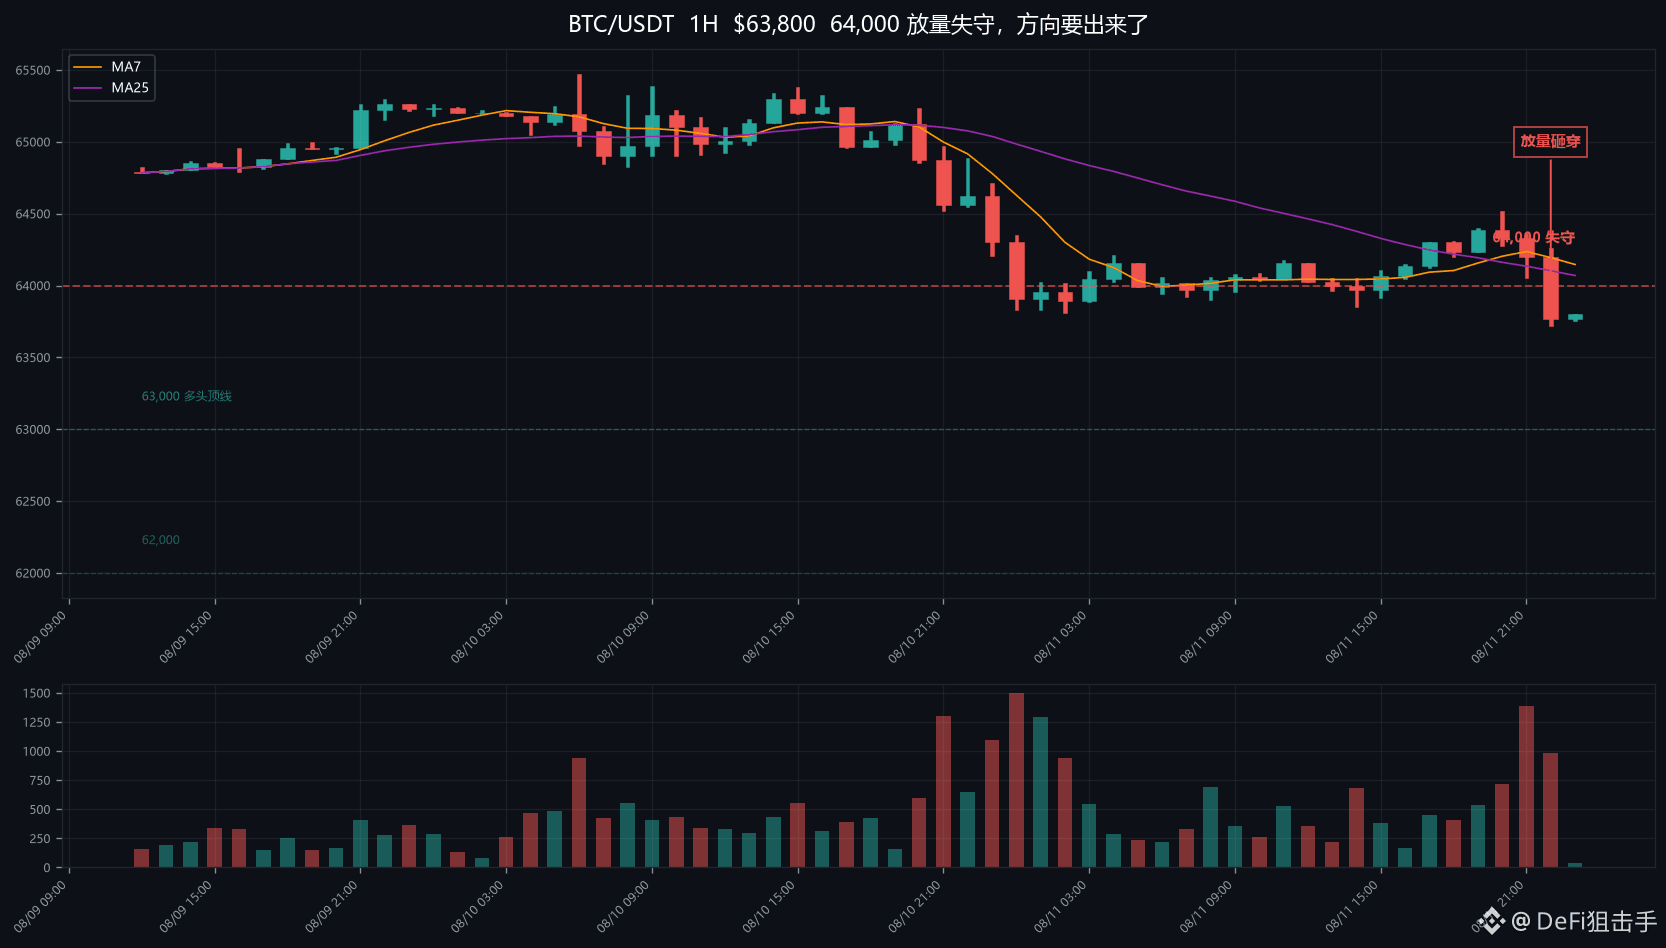
$BTC 63,738, 64,000 and it’s gone again.
In the final hours, three bearish candles got dumped down from 64,390, with volume of 600.
What’s different this time from before: there’s volume.
Before, whenever it broke below 64,000, it was a low-volume, slow bearish drop—meant to scare people. This time it came with volume, meaning they’re actually selling.
Gold is up another 2% today, rising every day for a full week. But BTC didn’t follow this time.
Safe-haven money has all rushed into gold, leaving BTC on the sidelines. This signal can’t be ignored.
The Fear Index is 29—still in the fear zone, but not to the point of panic. It’s not painful or alarming.
TUT doubled 96% a few days ago, and today it’s down 11% straight. That’s the standard script for distributing at the highs.
SOL is also down 1.3%, and the major altcoins are weakening along with BTC.
At the 64,000 level, bulls and bears have been fighting for two weeks—back and forth, crossing the level five or six times.
Repeatedly testing the same spot eventually forces a decision. A heavy-volume drop is the bears signaling their stance.
Look to 63,000 below. 63,000 is the starting point of this rally, and also the bulls’ line in the sand.
If it holds, expect continued consolidation. If it doesn’t, then 62,000.
In the short term the bias is bearish, but there’s no need to panic. Keep position sizes controlled and wait for 63,000 to confirm.
$BTC
In the final hours, three bearish candles got dumped down from 64,390, with volume of 600.
What’s different this time from before: there’s volume.
Before, whenever it broke below 64,000, it was a low-volume, slow bearish drop—meant to scare people. This time it came with volume, meaning they’re actually selling.
Gold is up another 2% today, rising every day for a full week. But BTC didn’t follow this time.
Safe-haven money has all rushed into gold, leaving BTC on the sidelines. This signal can’t be ignored.
The Fear Index is 29—still in the fear zone, but not to the point of panic. It’s not painful or alarming.
TUT doubled 96% a few days ago, and today it’s down 11% straight. That’s the standard script for distributing at the highs.
SOL is also down 1.3%, and the major altcoins are weakening along with BTC.
At the 64,000 level, bulls and bears have been fighting for two weeks—back and forth, crossing the level five or six times.
Repeatedly testing the same spot eventually forces a decision. A heavy-volume drop is the bears signaling their stance.
Look to 63,000 below. 63,000 is the starting point of this rally, and also the bulls’ line in the sand.
If it holds, expect continued consolidation. If it doesn’t, then 62,000.
In the short term the bias is bearish, but there’s no need to panic. Keep position sizes controlled and wait for 63,000 to confirm.
$BTC
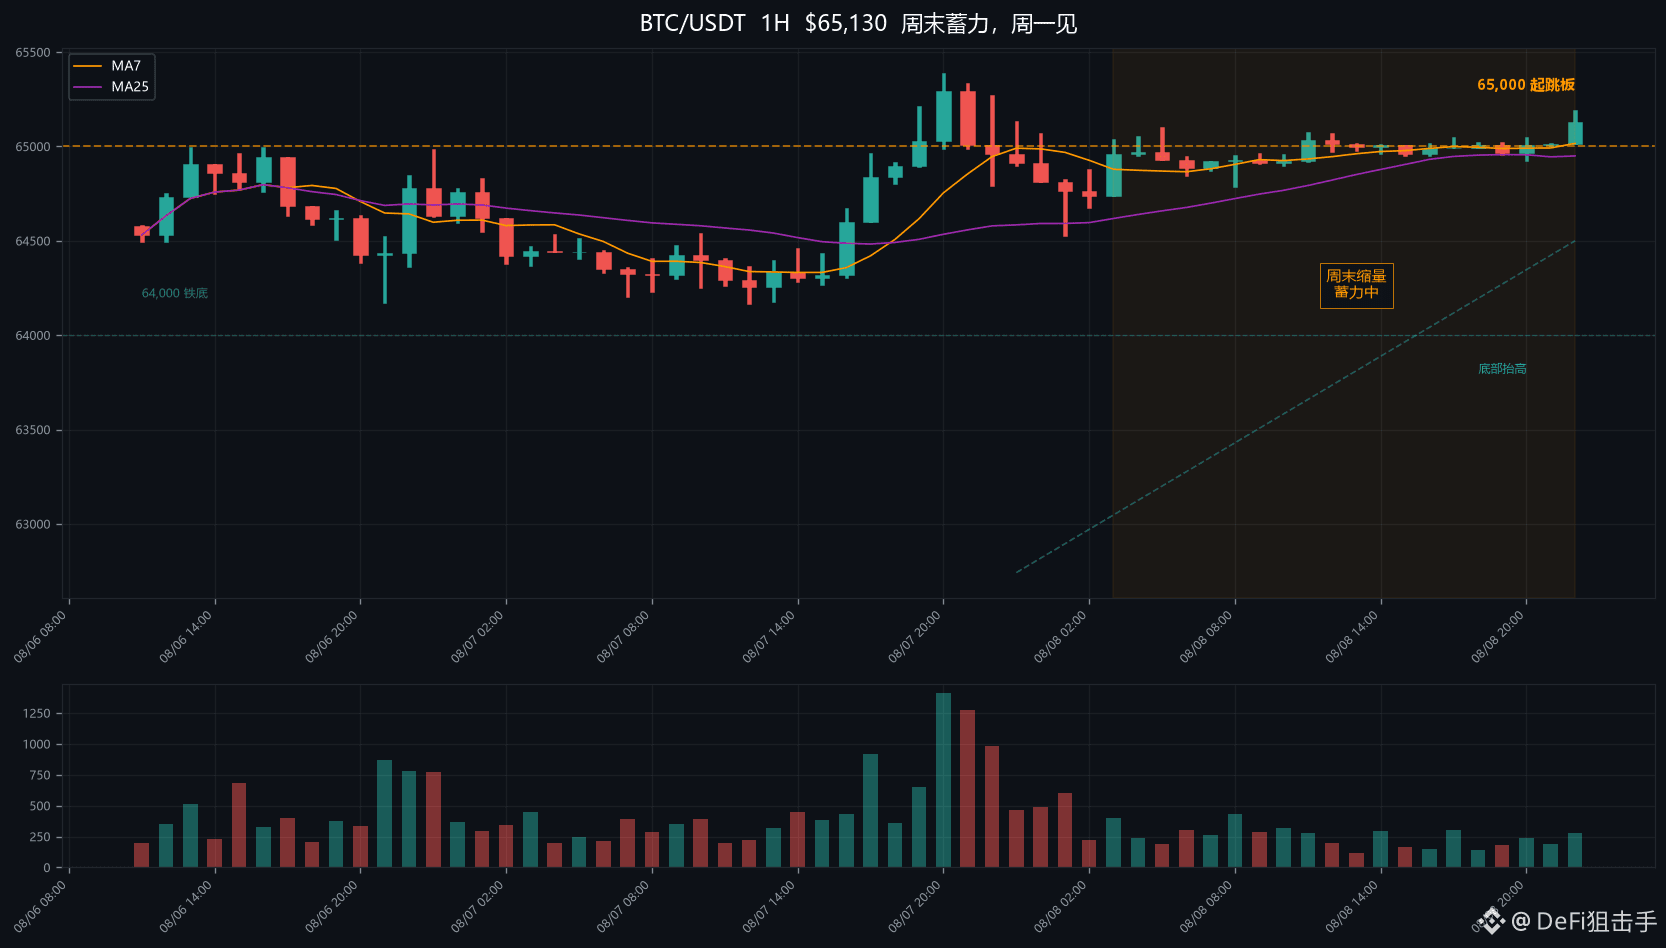
$BTC 65,111,The weekend is here, trading volume 4.6 billion—dull and quiet.
But look where it’s lying? Above 65,000. Two weeks ago, this was still the ceiling.
Last Saturday BTC wavered around 63,000; this Saturday it’s wavering around 65,000.
The bottom was lifted from 62,000 all the way to 64,000—that’s the trend.
The Fear Index is 30—fear. Retail traders don’t watch the charts on weekends, and big funds are resting too.
But the order distribution won’t lie: short positions below 64,000 have been mostly eaten up within the past two weeks.
The altcoins aren’t taking a break either over the weekend—TUT surged 96% in a day, SOL +2.3%.
The casino is open as usual; the hot money is still bubbling inside.
Gold is rising too, and the trend of capital moving into safe-haven assets hasn’t changed.
My take: the sideways weekend is building momentum, waiting for Monday when U.S. stocks open.
On Friday, the Nasdaq closed up 1.3%. This good news will most likely be digested by BTC on Monday.
64,000 is the iron bottom, and 65,000 is the launch pad. Bias is bullish.
Don’t watch the market this weekend—come back on Monday to collect the coins.
$BTC
But look where it’s lying? Above 65,000. Two weeks ago, this was still the ceiling.
Last Saturday BTC wavered around 63,000; this Saturday it’s wavering around 65,000.
The bottom was lifted from 62,000 all the way to 64,000—that’s the trend.
The Fear Index is 30—fear. Retail traders don’t watch the charts on weekends, and big funds are resting too.
But the order distribution won’t lie: short positions below 64,000 have been mostly eaten up within the past two weeks.
The altcoins aren’t taking a break either over the weekend—TUT surged 96% in a day, SOL +2.3%.
The casino is open as usual; the hot money is still bubbling inside.
Gold is rising too, and the trend of capital moving into safe-haven assets hasn’t changed.
My take: the sideways weekend is building momentum, waiting for Monday when U.S. stocks open.
On Friday, the Nasdaq closed up 1.3%. This good news will most likely be digested by BTC on Monday.
64,000 is the iron bottom, and 65,000 is the launch pad. Bias is bullish.
Don’t watch the market this weekend—come back on Monday to collect the coins.
$BTC
Bitcoin has decoupled from the US stock market.
Today, the Nasdaq is down 0.83% and the S&P 500 is down 0.17%, but BTC is up 0.7%.
$BTC 64,961—it has held steady above 64,000 for two days.
Over the past month, BTC has been moving in lockstep with US stocks: stocks up, BTC up; stocks down, BTC down. Today it finally found its own rhythm.
Look at gold too—up 1.7% in a day. Money is clearly running into safe-haven assets.
But this time, BTC didn’t fall with US stocks. Instead, it rose alongside gold. The shift in between is subtle.
Fear index at 25, extremely fearful. Retail may not smell it, but big funds are already rebalancing.
HEI doubled in a day—up 119%. Altcoins are never short on stories.
ETH at $1,916, steady and building momentum, getting closer and closer to $2,000.
My take: BTC is starting to move independently, which could be an early sign of a trend reversal.
If the Nasdaq is down but BTC doesn’t follow, then when the Nasdaq rebounds, BTC could surge hard.
In the short term, expect range-bound action between 64,000 and 65,000. Holding above 65,000 is the add-to-position signal.
Overall bias is bullish—don’t let a drop in the US stock market throw you off.
$BTC
Today, the Nasdaq is down 0.83% and the S&P 500 is down 0.17%, but BTC is up 0.7%.
$BTC 64,961—it has held steady above 64,000 for two days.
Over the past month, BTC has been moving in lockstep with US stocks: stocks up, BTC up; stocks down, BTC down. Today it finally found its own rhythm.
Look at gold too—up 1.7% in a day. Money is clearly running into safe-haven assets.
But this time, BTC didn’t fall with US stocks. Instead, it rose alongside gold. The shift in between is subtle.
Fear index at 25, extremely fearful. Retail may not smell it, but big funds are already rebalancing.
HEI doubled in a day—up 119%. Altcoins are never short on stories.
ETH at $1,916, steady and building momentum, getting closer and closer to $2,000.
My take: BTC is starting to move independently, which could be an early sign of a trend reversal.
If the Nasdaq is down but BTC doesn’t follow, then when the Nasdaq rebounds, BTC could surge hard.
In the short term, expect range-bound action between 64,000 and 65,000. Holding above 65,000 is the add-to-position signal.
Overall bias is bullish—don’t let a drop in the US stock market throw you off.
$BTC
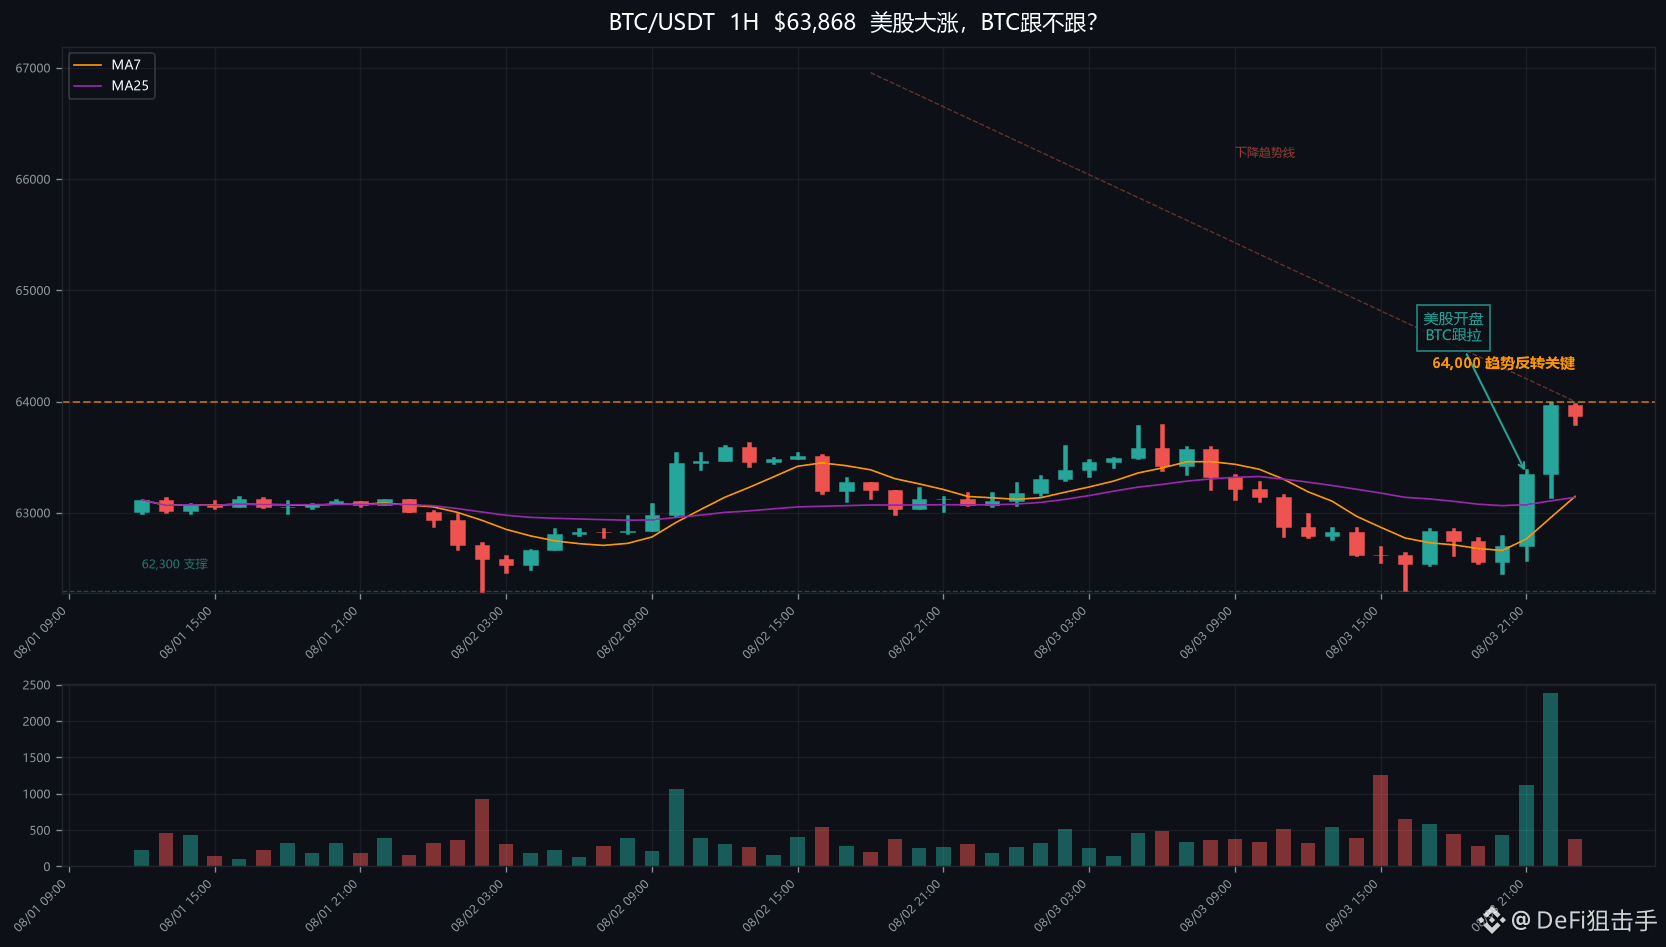
U.S. stocks rose across the board tonight, with the Nasdaq up +1.77%, the S&P up +1.14%, and the Dow up +1%.
The VIX, the fear index, is only 16—market sentiment is through the roof.
BTC also moved along: it jumped from 62,300 to 63,993 in one go, up by 1,700 points.
U.S. stocks open at 21:30, but BTC started rallying at 21:00—just think about that timing.
This correlation isn’t a coincidence. BTC has been tracking U.S. stocks.
$BTC 63,835, it’s up, but honestly, the momentum isn’t enough.
Nasdaq’s +1.77% is from today, while BTC dropping from 66,956 to 62,300 is what happened over the past ten days.
The U.S. market is all red-hot, while BTC is still clawing its way out of the pit slowly.
The fear index is 28, which is totally different sentiment from the U.S. market’s VIX of 16.
U.S. stock investors are celebrating, but the crypto market is still in fear. The gap itself is an opportunity.
BICO is actually going crazy—up 52% in a day. Altcoins are never short of gamblers.
But on the mainstream coin side, ETH is only up 0.6%, and SOL hasn’t moved. Money hasn’t fully flowed back yet.
My take: in the short term, stay slightly bullish following the U.S. market, but don’t get too optimistic.
BTC needs to reclaim 64,000 with volume to call it a trend reversal.
Until then, just treat it as an oversold rebound. A pullback to 62,800 that doesn’t break can be a short-term entry.
If U.S. stocks close tonight at high levels, the crypto market may see a second wave tomorrow.
$BTC
The VIX, the fear index, is only 16—market sentiment is through the roof.
BTC also moved along: it jumped from 62,300 to 63,993 in one go, up by 1,700 points.
U.S. stocks open at 21:30, but BTC started rallying at 21:00—just think about that timing.
This correlation isn’t a coincidence. BTC has been tracking U.S. stocks.
$BTC 63,835, it’s up, but honestly, the momentum isn’t enough.
Nasdaq’s +1.77% is from today, while BTC dropping from 66,956 to 62,300 is what happened over the past ten days.
The U.S. market is all red-hot, while BTC is still clawing its way out of the pit slowly.
The fear index is 28, which is totally different sentiment from the U.S. market’s VIX of 16.
U.S. stock investors are celebrating, but the crypto market is still in fear. The gap itself is an opportunity.
BICO is actually going crazy—up 52% in a day. Altcoins are never short of gamblers.
But on the mainstream coin side, ETH is only up 0.6%, and SOL hasn’t moved. Money hasn’t fully flowed back yet.
My take: in the short term, stay slightly bullish following the U.S. market, but don’t get too optimistic.
BTC needs to reclaim 64,000 with volume to call it a trend reversal.
Until then, just treat it as an oversold rebound. A pullback to 62,800 that doesn’t break can be a short-term entry.
If U.S. stocks close tonight at high levels, the crypto market may see a second wave tomorrow.
$BTC
Korean concept coins have gone collectively crazy. KORUB surged 48% in a day, SOXLB +37%, and SNDKB +35%.
This isn’t just one coin going up—an entire sector is flying.
Now look at BANK: it jumped 18% the day before yesterday, fell 56% yesterday, and dropped another 57% today. Three days from heaven to hell.
Some people are making a fortune, others are taking massive losses—the brutality of altcoins is exactly like this.
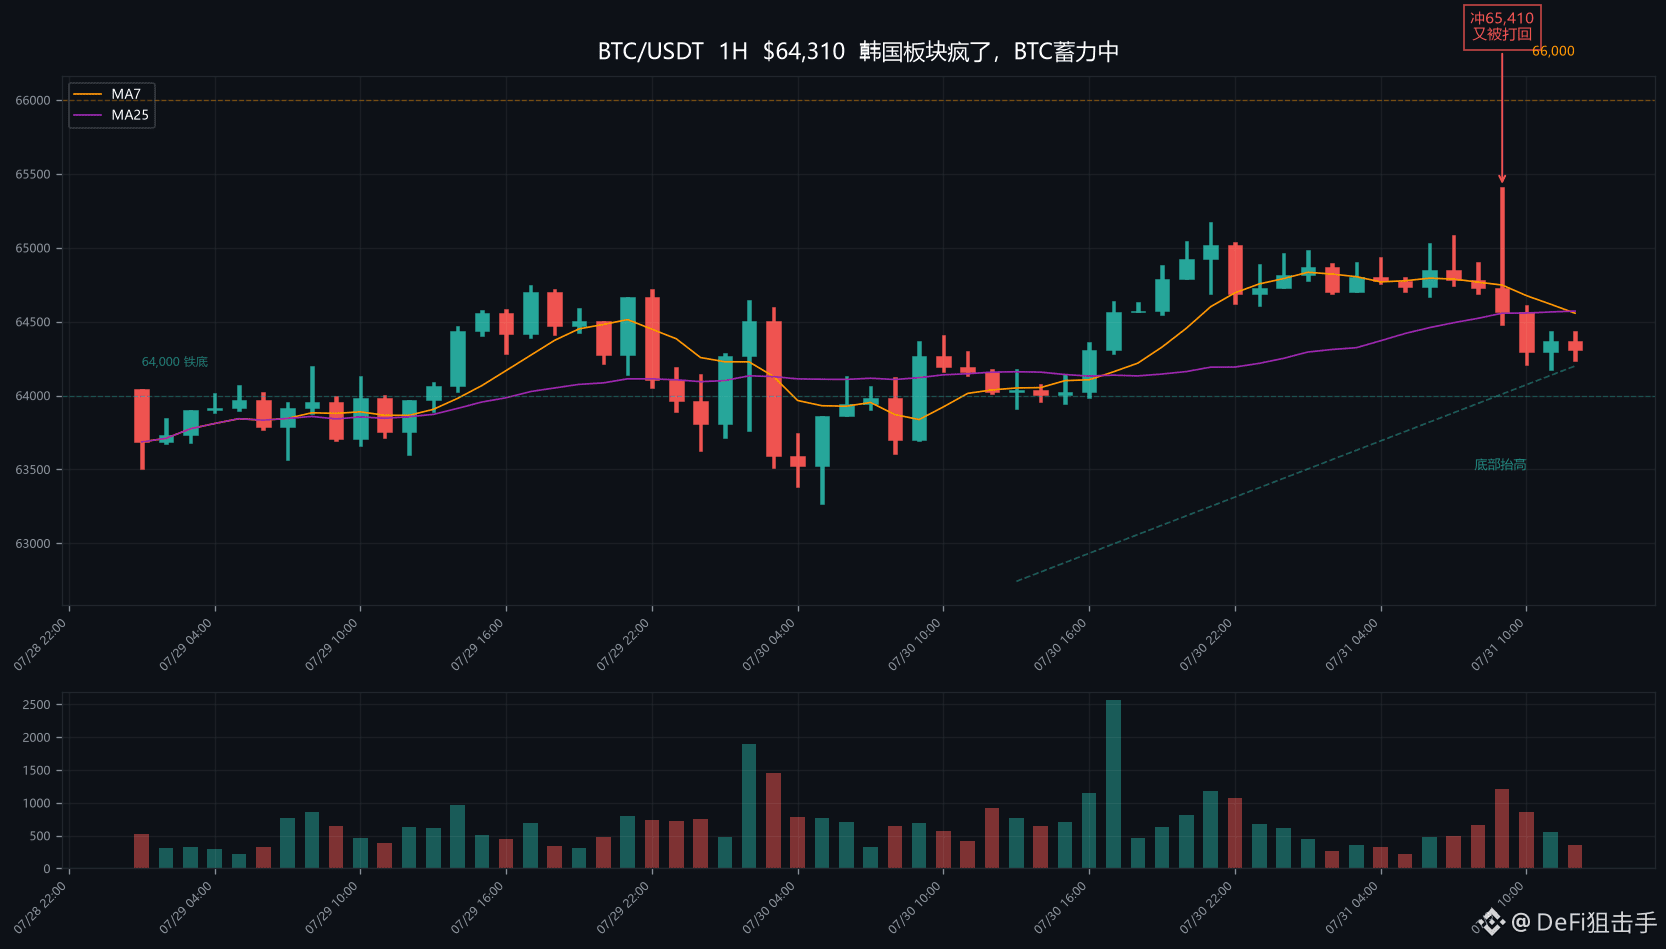
But look at $BTC —what is it doing? 64,318, steady as an old dog.
It charged again today at 65,410, only to get pushed back. This is the third time.
It popped up from around 64,200, surged to 65,400 and then fell back. It tested again near 64,200 and bounced once more.
The 1-hour chart looks like waves, but the bottom has been steadily rising.
Fear index at 25—extreme fear. BTC climbed from 62,742, and the fear index dropped from 29 to 25.
The more it rises, the more retail investors are afraid—this is exactly the healthiest way for a move to play out.
The frenzy in Korea’s concept stocks isn’t random; it shows that Asian capital is pouring in aggressively.
This capital first moves into altcoins, and later it will definitely flow back into BTC.
My take: BTC is building up momentum in the 64,000–65,400 range, and a breakout is only a matter of time.
Slightly bullish. Hold onto your positions and don’t get shaken off the train.
$BTC
This isn’t just one coin going up—an entire sector is flying.
Now look at BANK: it jumped 18% the day before yesterday, fell 56% yesterday, and dropped another 57% today. Three days from heaven to hell.
Some people are making a fortune, others are taking massive losses—the brutality of altcoins is exactly like this.
But look at $BTC —what is it doing? 64,318, steady as an old dog.
It charged again today at 65,410, only to get pushed back. This is the third time.
It popped up from around 64,200, surged to 65,400 and then fell back. It tested again near 64,200 and bounced once more.
The 1-hour chart looks like waves, but the bottom has been steadily rising.
Fear index at 25—extreme fear. BTC climbed from 62,742, and the fear index dropped from 29 to 25.
The more it rises, the more retail investors are afraid—this is exactly the healthiest way for a move to play out.
The frenzy in Korea’s concept stocks isn’t random; it shows that Asian capital is pouring in aggressively.
This capital first moves into altcoins, and later it will definitely flow back into BTC.
My take: BTC is building up momentum in the 64,000–65,400 range, and a breakout is only a matter of time.
Slightly bullish. Hold onto your positions and don’t get shaken off the train.
$BTC
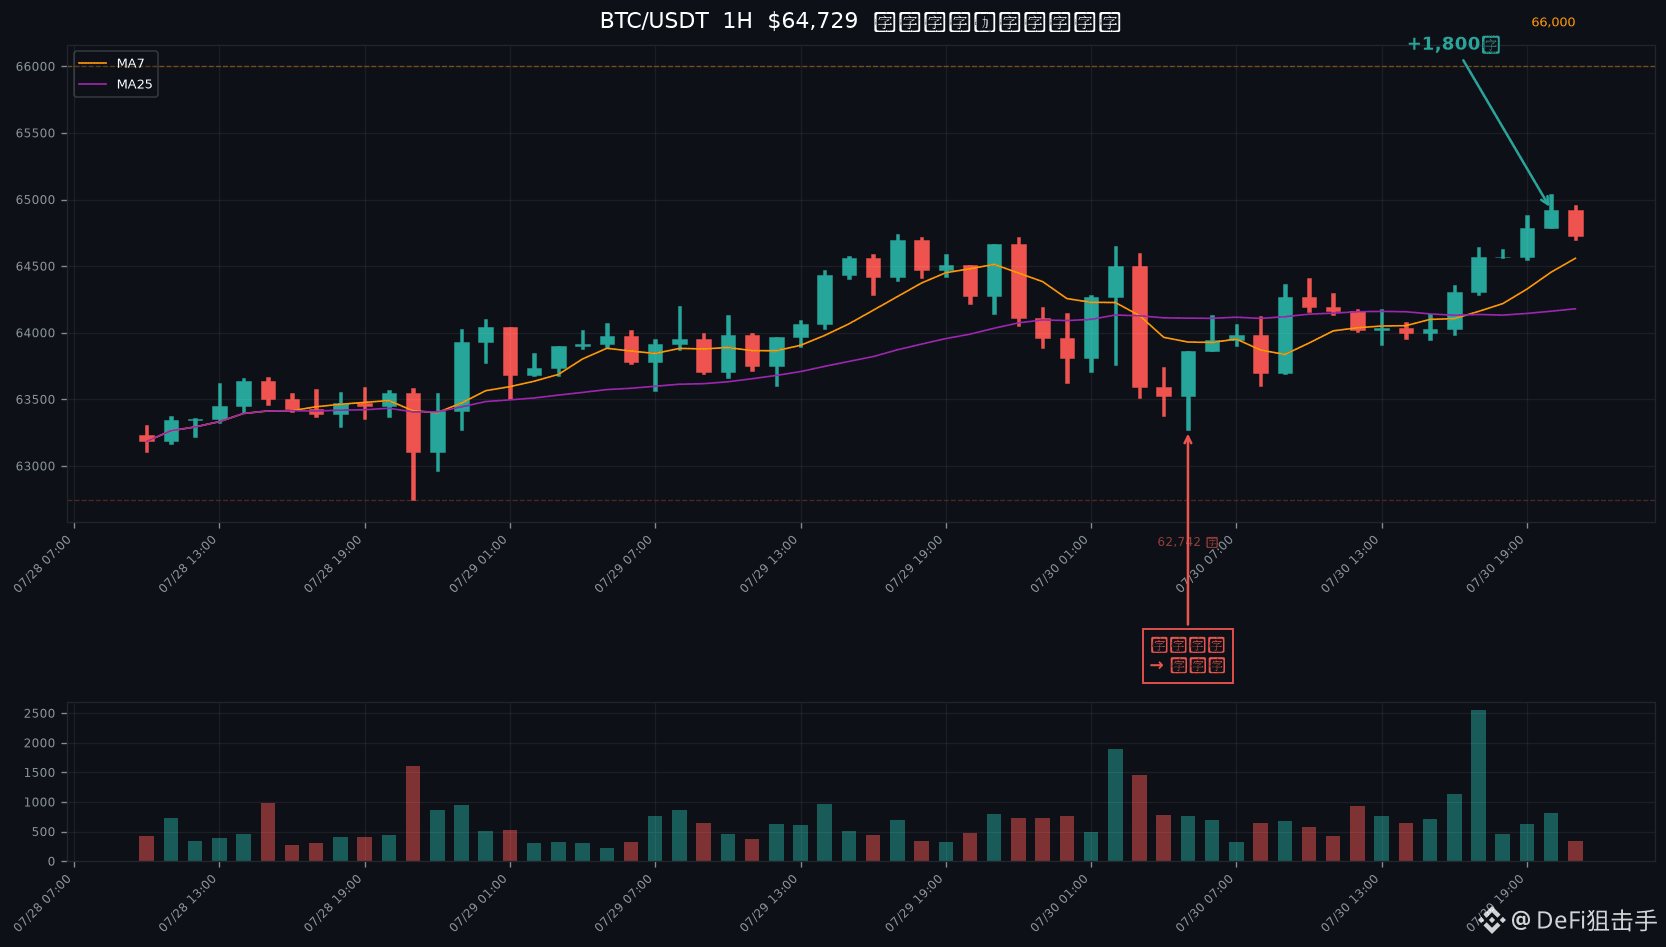
The day of the needle insertion, I said don’t get fooled—it’s a washout. Today BTC was pushed from 63,267 to 65,044.
In less than two days it’s up 1,800 points. Those people who stopped out after the needle insertion are now slapping their thighs in regret.
$BTC 64,756, the 1-hour chart has six straight bullish candles, rising from 4 p.m. to 9 p.m.
Volume is 1.3 billion—not small-fry activity. It’s real money pushing it up.
ETH is at $1,922, and it’s about to break through $2,000 again. In this round, ETH has consistently led BTC by a margin.
The fear index is 28—still fear. Before the needle insertion it was 29; after the needle insertion it’s still 29. Even when it pumps to 64,700, it’s still 28.
Retail traders have been beaten into submission. They don’t dare move whether it’s up or down.
Here’s another tragedy to look at: BANK was up 18% yesterday, and today it’s been slashed in half—down 56% straight away.
The champion gainer from yesterday is the champion decliner today. That’s how alts are.
Do you still dare to chase alts?
As for BTC, it’s steady and methodical: climbing from 62,742 to 65,044. Needle insertion is the bottom.
My take: the needle insertion washout is over, and now we’re in the early stage of the rally.
Near-term resistance is 66,000. Once it breaks, look at 68,000. Bias is bullish.
If you didn’t get on board, wait for the pullback to 64,300—that’s your chance. If you’re already on board, hold tight.
$BTC
In less than two days it’s up 1,800 points. Those people who stopped out after the needle insertion are now slapping their thighs in regret.
$BTC 64,756, the 1-hour chart has six straight bullish candles, rising from 4 p.m. to 9 p.m.
Volume is 1.3 billion—not small-fry activity. It’s real money pushing it up.
ETH is at $1,922, and it’s about to break through $2,000 again. In this round, ETH has consistently led BTC by a margin.
The fear index is 28—still fear. Before the needle insertion it was 29; after the needle insertion it’s still 29. Even when it pumps to 64,700, it’s still 28.
Retail traders have been beaten into submission. They don’t dare move whether it’s up or down.
Here’s another tragedy to look at: BANK was up 18% yesterday, and today it’s been slashed in half—down 56% straight away.
The champion gainer from yesterday is the champion decliner today. That’s how alts are.
Do you still dare to chase alts?
As for BTC, it’s steady and methodical: climbing from 62,742 to 65,044. Needle insertion is the bottom.
My take: the needle insertion washout is over, and now we’re in the early stage of the rally.
Near-term resistance is 66,000. Once it breaks, look at 68,000. Bias is bullish.
If you didn’t get on board, wait for the pullback to 64,300—that’s your chance. If you’re already on board, hold tight.
$BTC
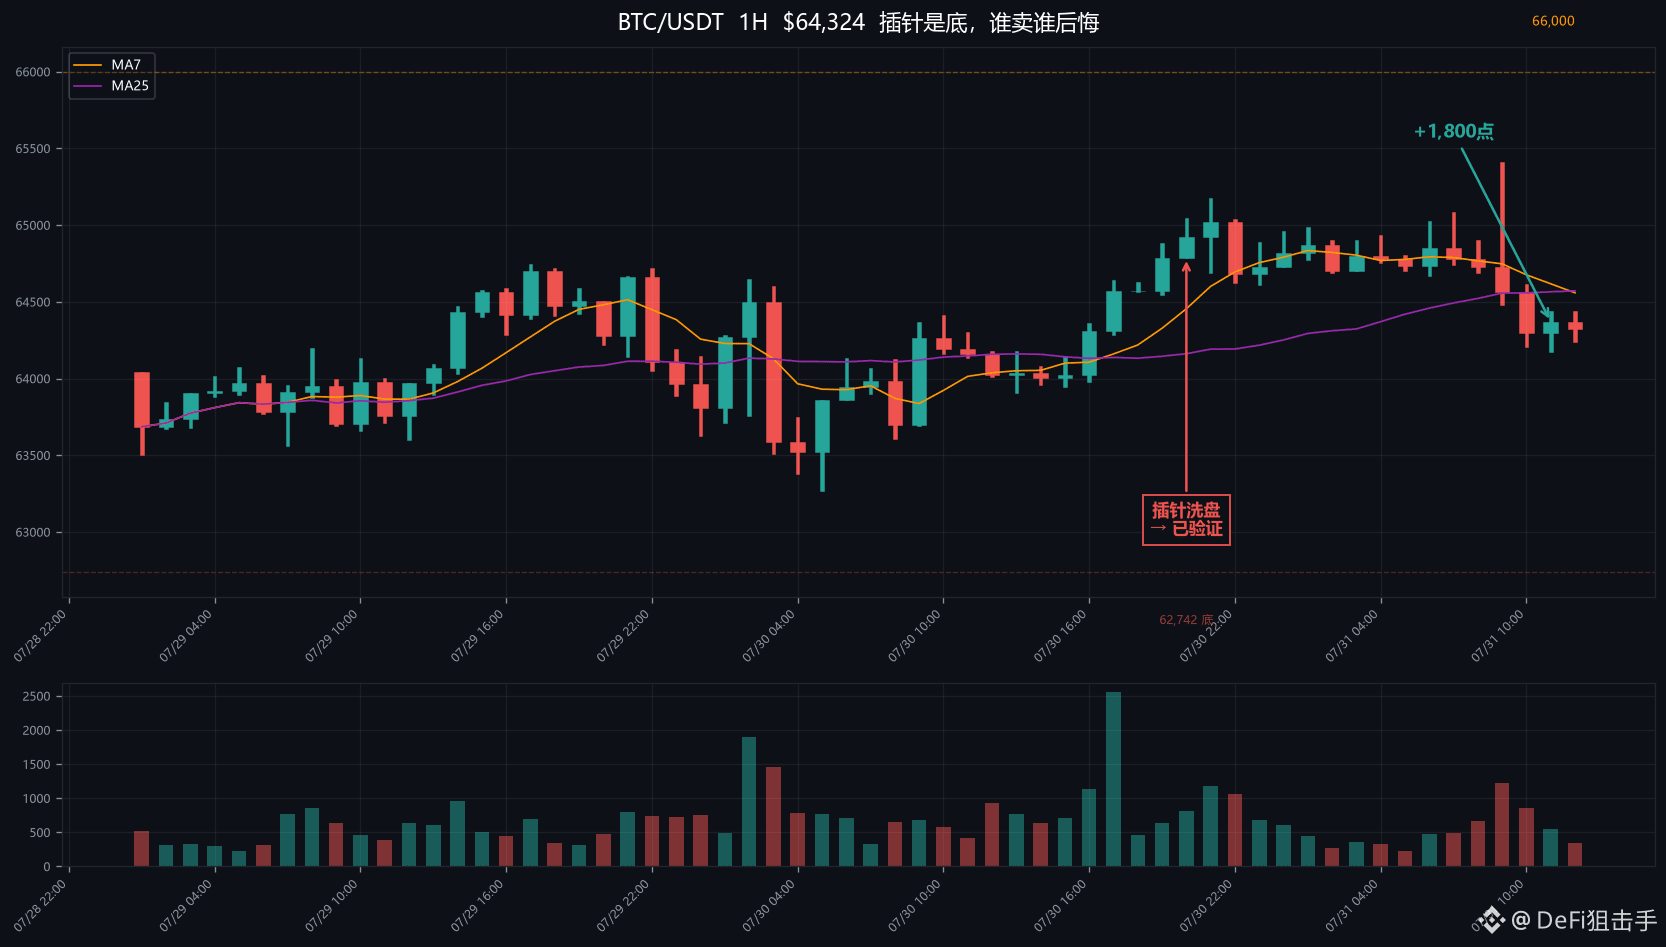
The day the needle pins went in, I said don’t get fooled—it’s a wash. Today BTC was pushed from 63,267 up to 65,044.
In less than two days it surged by 1,800 points. The people who got stopped out by the needle pins are now slapping their thighs in regret.
$BTC 64,756: the 1-hour chart has six consecutive bullish candles, pulled from 4 p.m. to 9 p.m.
Trading volume hit 1.3 billion—this isn’t small change; it’s real money pushing it up.
ETH is at $1,922 and it’s about to test $2,000 again. This round of ETH has consistently outperformed BTC.
The fear index is 28—still in fear. Before the needle pins it was 29; after the needle pins it’s still 29. Even after climbing to 64,700, it remains 28.
Retail investors have already been beaten into submission—they don’t dare move, no matter whether it’s up or down.
One more tragedy to look at: BANK was up 18% yesterday, and today it got cut straight in half—down 56%.
The biggest gainer yesterday is the biggest loser today. That’s how altcoins are.
Do you still dare chase altcoins?
On the BTC side, things are steady and methodical—from 62,742 up to 65,044. The needle pins were the bottom.
My take: the needle-pin washout is over, and now we’re in the early stage of a new rally.
Near-term resistance is 66,000. Break it and then we look at 68,000. Bias is bullish.
If you missed the ride, wait for the pullback to 64,300—that’s your chance. If you’re already on board, hold tight.
$BTC
In less than two days it surged by 1,800 points. The people who got stopped out by the needle pins are now slapping their thighs in regret.
$BTC 64,756: the 1-hour chart has six consecutive bullish candles, pulled from 4 p.m. to 9 p.m.
Trading volume hit 1.3 billion—this isn’t small change; it’s real money pushing it up.
ETH is at $1,922 and it’s about to test $2,000 again. This round of ETH has consistently outperformed BTC.
The fear index is 28—still in fear. Before the needle pins it was 29; after the needle pins it’s still 29. Even after climbing to 64,700, it remains 28.
Retail investors have already been beaten into submission—they don’t dare move, no matter whether it’s up or down.
One more tragedy to look at: BANK was up 18% yesterday, and today it got cut straight in half—down 56%.
The biggest gainer yesterday is the biggest loser today. That’s how altcoins are.
Do you still dare chase altcoins?
On the BTC side, things are steady and methodical—from 62,742 up to 65,044. The needle pins were the bottom.
My take: the needle-pin washout is over, and now we’re in the early stage of a new rally.
Near-term resistance is 66,000. Break it and then we look at 68,000. Bias is bullish.
If you missed the ride, wait for the pullback to 64,300—that’s your chance. If you’re already on board, hold tight.
$BTC
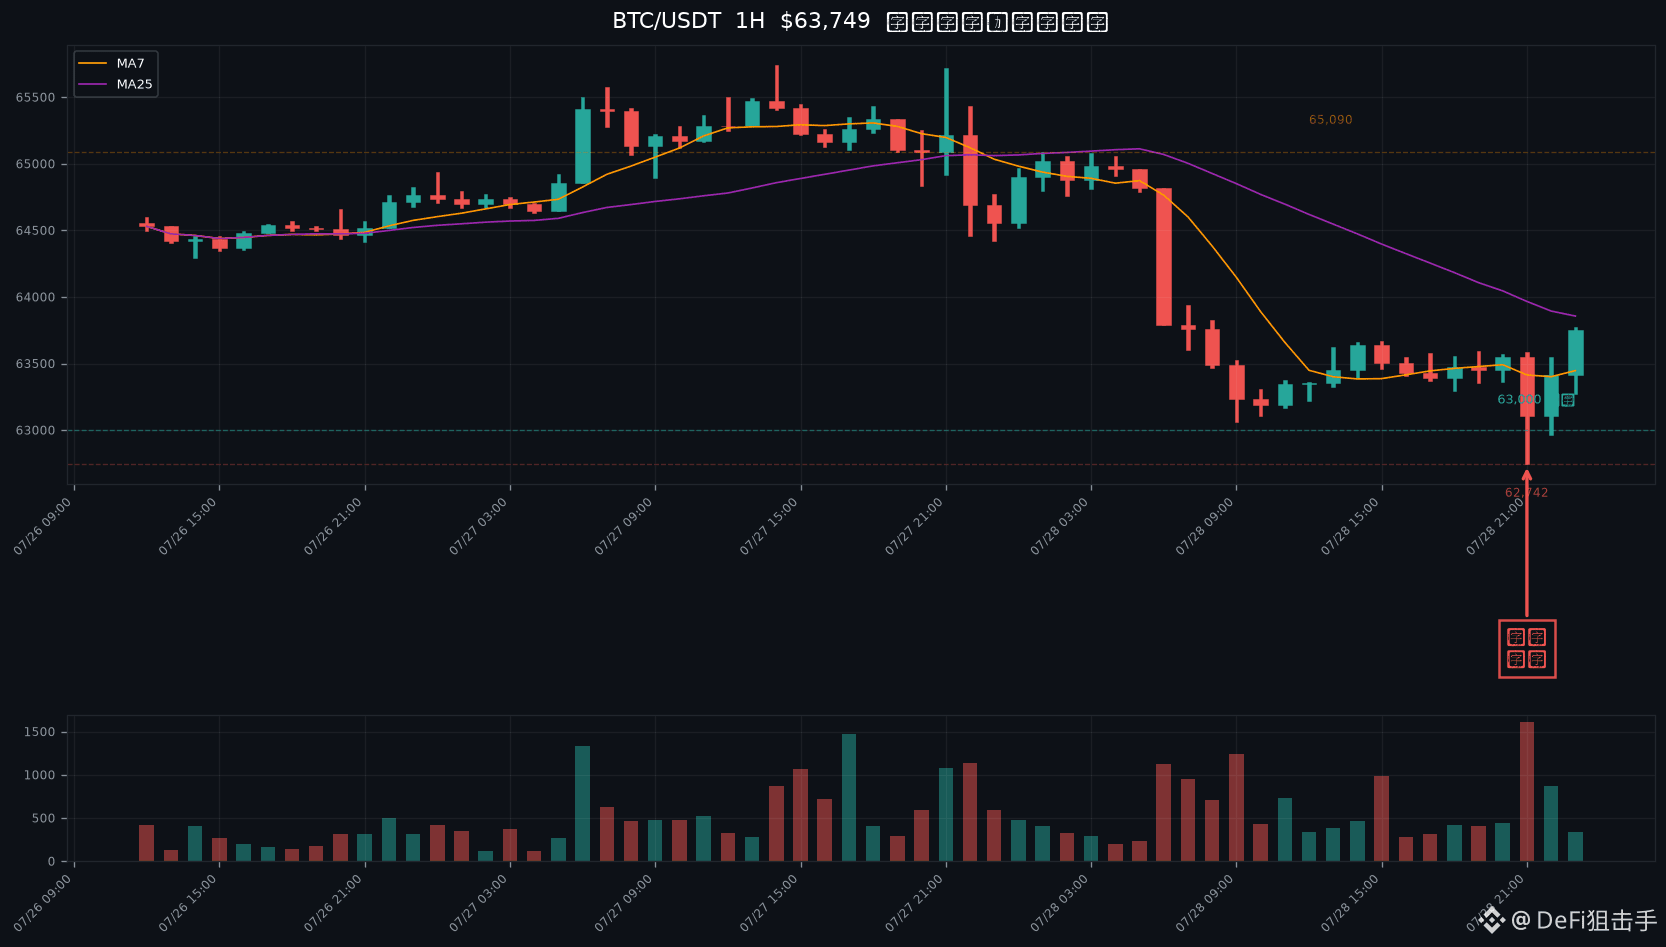
$BTC 63,404,Just now at 21:00 a needle went in to 62,742, and all the long positions across the entire internet started crying and begging.
So what happened next? At 22:00 it directly pulled back in a V-shape to 63,412—one needle went in and it was pulled back cleanly, tidy and spotless.
What is this called? It’s called a needle-style washout.
First they smash you by 800 bucks to make you think it’s broken. You cut losses, you sell off. The moment you sell, it rallies back.
A familiar recipe, a familiar taste.
From 65,090 down to 62,742—looks scary. But at 22:00 that bullish candle swallowed up all the losses.
A sell-off with increased volume, then a rally with increased volume back—classic bear trap.
Fear index is 29, and retail investors get scared again.
But take a look at the altcoins: COTI surged 56% in a day, and DEXE climbed back from having been cut in half and rose another 17%.
When BTC is being smashed, the smart money secretly scoops up the altcoins. Once the handover of positions is done, they pull it up.
After every needle, there’s a big jump. Think back to that time at the end of June.
My take: this is the last washout before the ramp-up.
Around 63,000 is the solid bottom—no more room for the needle to push through.
Bias is upward. Don’t run just because of a single needle.
$BTC
So what happened next? At 22:00 it directly pulled back in a V-shape to 63,412—one needle went in and it was pulled back cleanly, tidy and spotless.
What is this called? It’s called a needle-style washout.
First they smash you by 800 bucks to make you think it’s broken. You cut losses, you sell off. The moment you sell, it rallies back.
A familiar recipe, a familiar taste.
From 65,090 down to 62,742—looks scary. But at 22:00 that bullish candle swallowed up all the losses.
A sell-off with increased volume, then a rally with increased volume back—classic bear trap.
Fear index is 29, and retail investors get scared again.
But take a look at the altcoins: COTI surged 56% in a day, and DEXE climbed back from having been cut in half and rose another 17%.
When BTC is being smashed, the smart money secretly scoops up the altcoins. Once the handover of positions is done, they pull it up.
After every needle, there’s a big jump. Think back to that time at the end of June.
My take: this is the last washout before the ramp-up.
Around 63,000 is the solid bottom—no more room for the needle to push through.
Bias is upward. Don’t run just because of a single needle.
$BTC
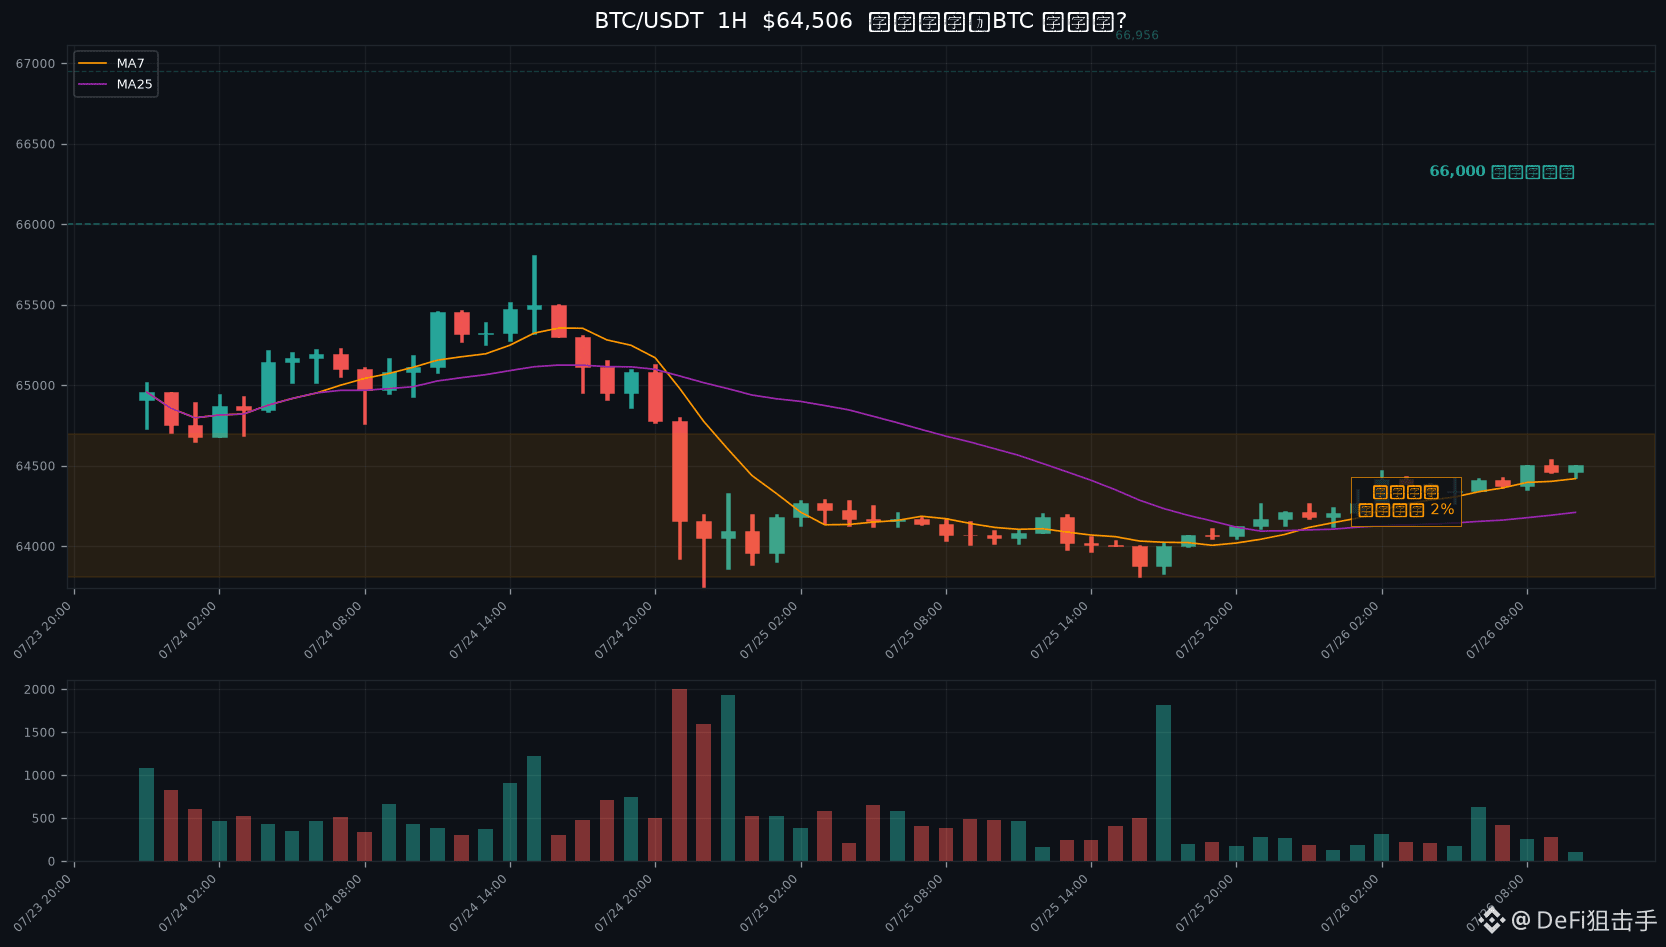
BTC is forming a straight line. The copycats are already going crazy.
$BTC 64,473. The intraday range has been less than $500 all day.
Trading volume is 530 million—so cold it could freeze.
You’ve been staring at BTC until you fall asleep, haven’t you? Go check the copycats.
EUL surged 87% in a day—not 8%, but 87%.
SHIB +26%, BANK +18%, AVAX +9%, DOGE +4%.
When BTC is ranging, the hot money all runs to the copycats. Doesn’t this look familiar?
Every time BTC ranges to the extreme, the copycats go wild first—then BTC takes over and blasts.
Early 2024 was like this, and so was March 2025.
Fear index is 26, and retail investors are still fearful.
BTC has been grinding around 64,000 for almost ten days, with volume shrinking to the extreme.
When everyone feels utterly bored, that’s often the last stretch before a breakout.
My take: BTC is in the night before a major move.
The copycats going crazy is a leading signal—it means the money hasn’t left; it’s just waiting for BTC to make a statement.
Once BTC breaks above 66,000 with volume, what the copycats already pumped will likely surge even harder.
Don’t go to cash now, and don’t get shaken out before dawn.
$BTC
$BTC 64,473. The intraday range has been less than $500 all day.
Trading volume is 530 million—so cold it could freeze.
You’ve been staring at BTC until you fall asleep, haven’t you? Go check the copycats.
EUL surged 87% in a day—not 8%, but 87%.
SHIB +26%, BANK +18%, AVAX +9%, DOGE +4%.
When BTC is ranging, the hot money all runs to the copycats. Doesn’t this look familiar?
Every time BTC ranges to the extreme, the copycats go wild first—then BTC takes over and blasts.
Early 2024 was like this, and so was March 2025.
Fear index is 26, and retail investors are still fearful.
BTC has been grinding around 64,000 for almost ten days, with volume shrinking to the extreme.
When everyone feels utterly bored, that’s often the last stretch before a breakout.
My take: BTC is in the night before a major move.
The copycats going crazy is a leading signal—it means the money hasn’t left; it’s just waiting for BTC to make a statement.
Once BTC breaks above 66,000 with volume, what the copycats already pumped will likely surge even harder.
Don’t go to cash now, and don’t get shaken out before dawn.
$BTC
DEXE gets slashed in half in a single day—down 52%. The day before, it was still #1 on the gainers list.
Two days ago it was up 75%, and everyone was screaming about a “copycat” season. Today? It’s straight-up a knee-cut.
The truth about “clone” coins: when they’re pumping, they look the best; when they’re dumping, they die first.
Look at BTC—$65,142, only down 0.9%.
ETH is down 2.6%, DOGE down 4.6%—both are still less brutal than DEXE.
But compared to DEXE’s -52%, that’s still just peanuts.
That’s why I keep saying: don’t chase it just because clone coins are surging.
When you buy high, you’re thinking “doubling.” In reality, a single bearish candle is enough for a 50% wipeout.
Fear index is 28, and retail investors are still hesitating over whether to buy the dip on clone coins.
You buy the dip on DEXE, and the whales—well, they raid you.
In a situation like this, where will the money run? It runs into BTC.
The worse clone coins fall, the safer BTC is—this is a hard rule.
BTC is currently ranging around 65,000. The bias is still slightly bullish, but it’s in the digestion phase.
My advice: don’t touch clone coins—hold BTC.
Wait until the fear index drops back below 20 before considering adding. No rush right now.
When the market is boring, don’t mess around—that’s the best play.
$BTC
Two days ago it was up 75%, and everyone was screaming about a “copycat” season. Today? It’s straight-up a knee-cut.
The truth about “clone” coins: when they’re pumping, they look the best; when they’re dumping, they die first.
Look at BTC—$65,142, only down 0.9%.
ETH is down 2.6%, DOGE down 4.6%—both are still less brutal than DEXE.
But compared to DEXE’s -52%, that’s still just peanuts.
That’s why I keep saying: don’t chase it just because clone coins are surging.
When you buy high, you’re thinking “doubling.” In reality, a single bearish candle is enough for a 50% wipeout.
Fear index is 28, and retail investors are still hesitating over whether to buy the dip on clone coins.
You buy the dip on DEXE, and the whales—well, they raid you.
In a situation like this, where will the money run? It runs into BTC.
The worse clone coins fall, the safer BTC is—this is a hard rule.
BTC is currently ranging around 65,000. The bias is still slightly bullish, but it’s in the digestion phase.
My advice: don’t touch clone coins—hold BTC.
Wait until the fear index drops back below 20 before considering adding. No rush right now.
When the market is boring, don’t mess around—that’s the best play.
$BTC
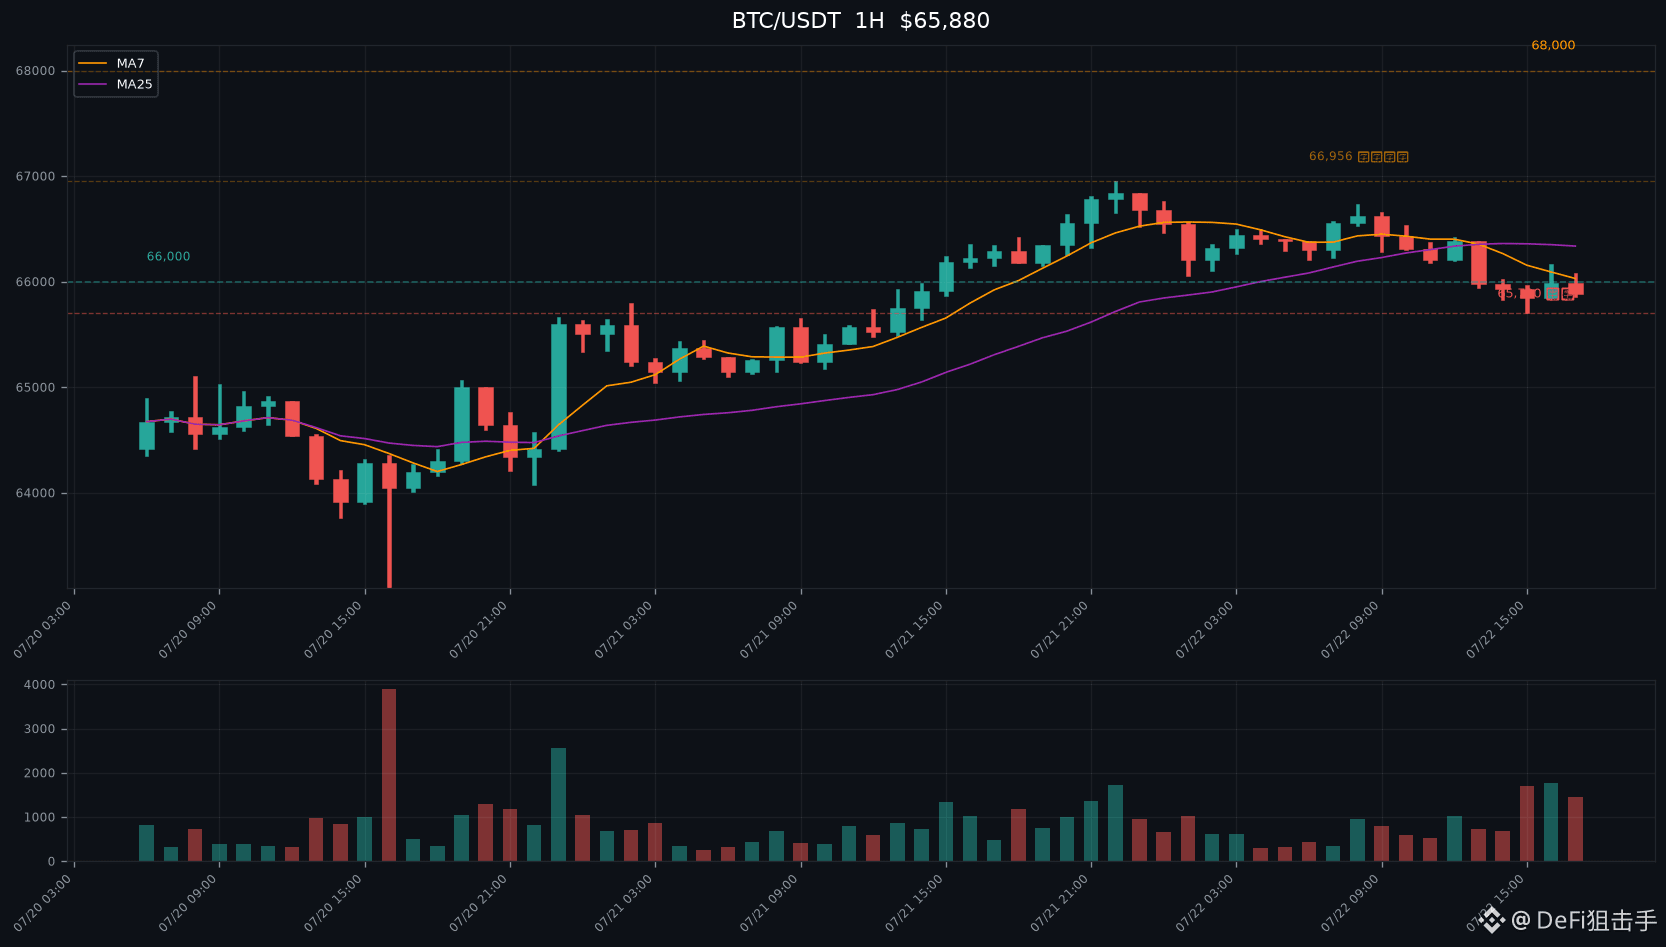
$BTC 65,896,Yesterday spiked up to 66,956, and it was just 1,000 dollars short of touching 68,000.
On the way up it started to pull back; today’s low is 65,701, and it’s been hovering around 65,900.
After breaking through 66,000, a pullback and confirmation is normal price action—no need to panic.
On the 1-hour chart, coming down from 66,956 it’s been a continuous run of small bearish candles, not a crash—more like a slow release of pressure.
Trading volume is 1.43 billion, about the same as yesterday. This shows that some people are taking profits, and others are buying in.
Good turnover means the shakeout has happened; once the chips get washed through, it can go further.
For ETH, it’s at $1,921—still not far from $2,000. The pullback magnitude is about the same as BTC.
The Fear Index is 33; it finally moved. Going from 22 to 33 means retail traders are starting to chase.
But 33 is still a fear zone, nowhere near greed. The real FOMO hasn’t arrived yet.
Current setup: 65,700 is short-term support, and 66,400 is minor resistance.
Hold 65,700, digest the profit-taking over the next two days through consolidation, and it should move higher again.
If 65,700 breaks, at most it may pull back to 65,000–65,600—don’t be afraid.
The bias is still bullish; the trend hasn’t changed. Pullbacks are an opportunity—don’t panic just because it dips a bit.
$BTC
On the way up it started to pull back; today’s low is 65,701, and it’s been hovering around 65,900.
After breaking through 66,000, a pullback and confirmation is normal price action—no need to panic.
On the 1-hour chart, coming down from 66,956 it’s been a continuous run of small bearish candles, not a crash—more like a slow release of pressure.
Trading volume is 1.43 billion, about the same as yesterday. This shows that some people are taking profits, and others are buying in.
Good turnover means the shakeout has happened; once the chips get washed through, it can go further.
For ETH, it’s at $1,921—still not far from $2,000. The pullback magnitude is about the same as BTC.
The Fear Index is 33; it finally moved. Going from 22 to 33 means retail traders are starting to chase.
But 33 is still a fear zone, nowhere near greed. The real FOMO hasn’t arrived yet.
Current setup: 65,700 is short-term support, and 66,400 is minor resistance.
Hold 65,700, digest the profit-taking over the next two days through consolidation, and it should move higher again.
If 65,700 breaks, at most it may pull back to 65,000–65,600—don’t be afraid.
The bias is still bullish; the trend hasn’t changed. Pullbacks are an opportunity—don’t panic just because it dips a bit.
$BTC
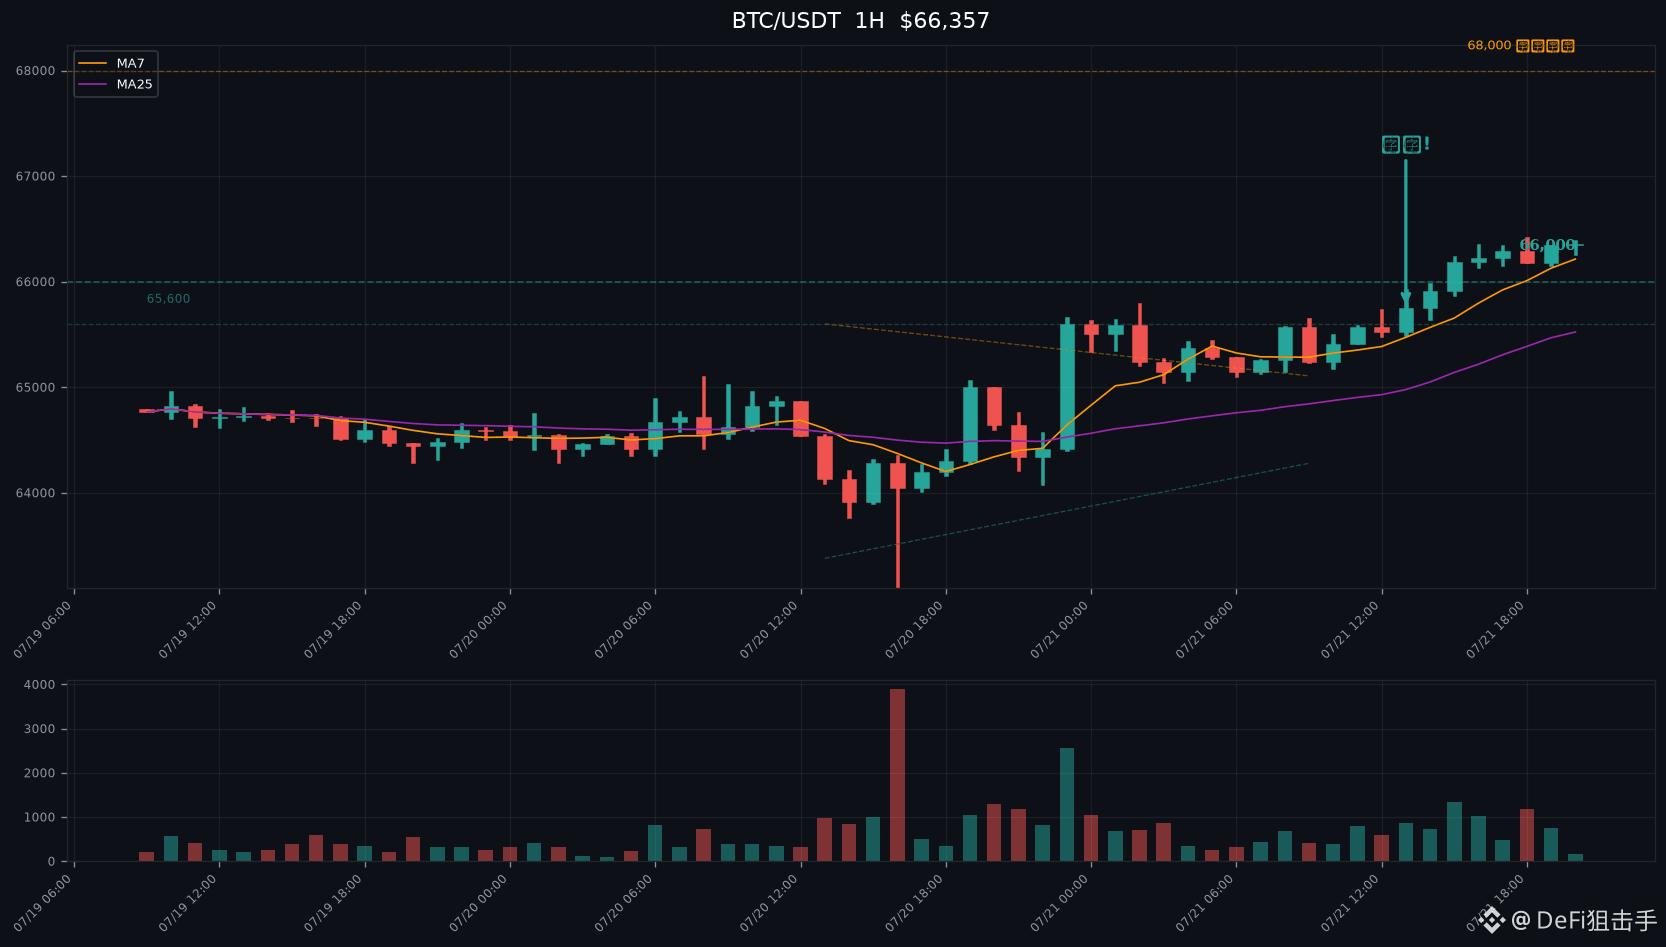
$BTC 66,364, In my previous post, I said that the probability of a converging triangle breaking upward is high. Today, the answer came.
At 13:00, momentum kicked in. A big bullish candle broke through 65,600 first, then surged to 66,000—one go, and it was fully broken.
On the 1-hour chart, there are six consecutive bullish candles. The bulls completely overwhelm the market. This isn’t from small positioning—it’s the main force doing it.
Trading volume is 1.29 billion, more than double that of the recent low-volume sideways consolidation. Real money is coming in.
ETH followed through as well—$1,935, just 3% away from $2,000. This ETH move has been leading the rally the whole time; it’s steady.
The fear index is 25—extreme fear. Even with BTC at 66,000, the fear index doesn’t budge.
From 61,825 to now 66,364: it’s up 4,500 points, and the fear index has risen from 22 to 25.
Retail investors missed it the whole way—when it goes up, they get more and more afraid to chase. That’s exactly the healthiest way for an advance to happen.
The chart is very clear: a converging triangle breakout, trend confirmation, and a bullish bias.
Next target: 68,000. 68,000 is the starting point of May’s decline, and also the real litmus test for this rebound.
There may be a pullback in the middle to 65,600 to confirm support—that’s your chance to get on board.
If you’re already on the train, sit tight—don’t get shaken out by a minor pullback. Those who missed it should wait for the pullback to chase—don’t chase at the top.
$BTC $ETH
At 13:00, momentum kicked in. A big bullish candle broke through 65,600 first, then surged to 66,000—one go, and it was fully broken.
On the 1-hour chart, there are six consecutive bullish candles. The bulls completely overwhelm the market. This isn’t from small positioning—it’s the main force doing it.
Trading volume is 1.29 billion, more than double that of the recent low-volume sideways consolidation. Real money is coming in.
ETH followed through as well—$1,935, just 3% away from $2,000. This ETH move has been leading the rally the whole time; it’s steady.
The fear index is 25—extreme fear. Even with BTC at 66,000, the fear index doesn’t budge.
From 61,825 to now 66,364: it’s up 4,500 points, and the fear index has risen from 22 to 25.
Retail investors missed it the whole way—when it goes up, they get more and more afraid to chase. That’s exactly the healthiest way for an advance to happen.
The chart is very clear: a converging triangle breakout, trend confirmation, and a bullish bias.
Next target: 68,000. 68,000 is the starting point of May’s decline, and also the real litmus test for this rebound.
There may be a pullback in the middle to 65,600 to confirm support—that’s your chance to get on board.
If you’re already on the train, sit tight—don’t get shaken out by a minor pullback. Those who missed it should wait for the pullback to chase—don’t chase at the top.
$BTC $ETH
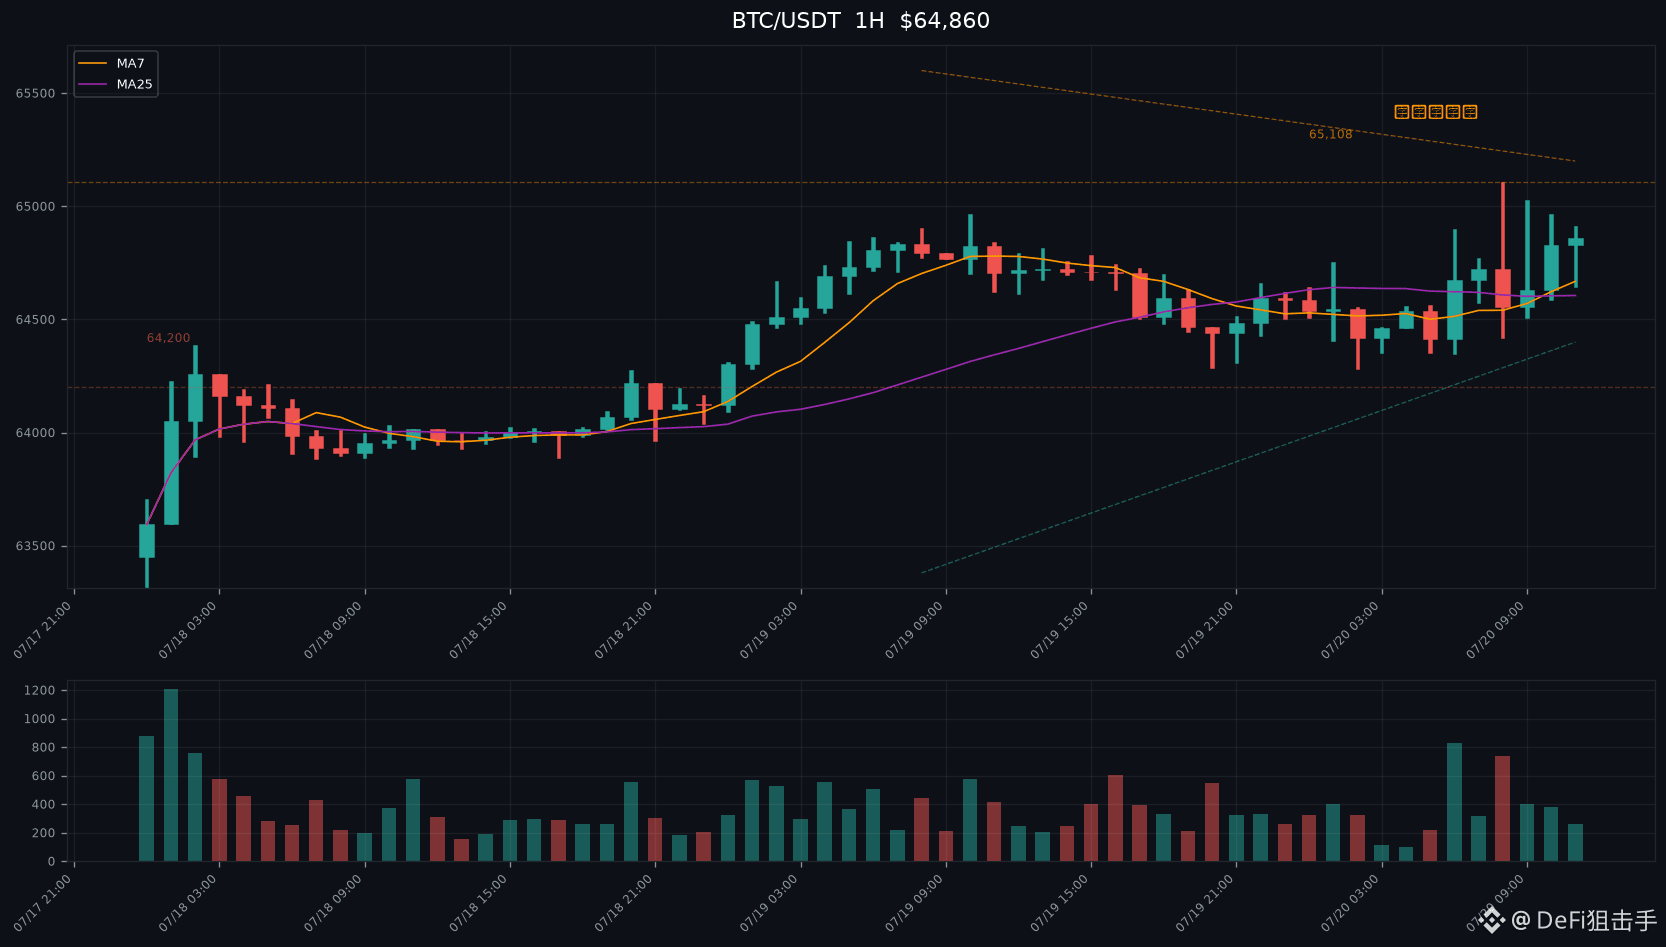
$BTC 64,879 has been moving sideways for a full three days near 64,700.
Today I tried again at 65,108, and it was pushed back again. Third time already.
I pulled up the 1-hour chart: a typical converging triangle.
Rebound peak: 65,277 → 65,108 → 65,108. The upper edge is flattening out.
Pullback low: 63,380 → 64,280 → 64,350. The bottom is clearly rising.
The volume is even more dramatic—today it’s only 550 million, absolutely ice-cold.
When volume shrinks to the extreme, it’s a sign of an impending breakout. It can’t keep going sideways forever at this level.
The fear index is 29, and it’s been grinding in the fear zone for almost two weeks.
Retail investors have gone from panic to numbness—they don’t react to up or down anymore.
This is exactly the kind of “comfort zone” environment for the main players to push the market.
My take: the probability of an upside breakout near the end of the contraction is higher.
Three reasons: the bottom is rising, the shorts have failed to break through after three attempts, and retail is numb.
Upside breakout target: 65,600. If it clears that, then look at 66,000.
If it breaks down and comes through 64,200 with increased volume, then this view is wrong—I’ll cut losses and leave.
But for now, the signals from the order book are mostly bullish.
$BTC
Today I tried again at 65,108, and it was pushed back again. Third time already.
I pulled up the 1-hour chart: a typical converging triangle.
Rebound peak: 65,277 → 65,108 → 65,108. The upper edge is flattening out.
Pullback low: 63,380 → 64,280 → 64,350. The bottom is clearly rising.
The volume is even more dramatic—today it’s only 550 million, absolutely ice-cold.
When volume shrinks to the extreme, it’s a sign of an impending breakout. It can’t keep going sideways forever at this level.
The fear index is 29, and it’s been grinding in the fear zone for almost two weeks.
Retail investors have gone from panic to numbness—they don’t react to up or down anymore.
This is exactly the kind of “comfort zone” environment for the main players to push the market.
My take: the probability of an upside breakout near the end of the contraction is higher.
Three reasons: the bottom is rising, the shorts have failed to break through after three attempts, and retail is numb.
Upside breakout target: 65,600. If it clears that, then look at 66,000.
If it breaks down and comes through 64,200 with increased volume, then this view is wrong—I’ll cut losses and leave.
But for now, the signals from the order book are mostly bullish.
$BTC
Log in to explore more content