

CryptoPRO 1
382 Posts

CryptoPRO 1
Report
Block User
Crypto coach📊 || Developer🖥 || MOD🤖
0 Following
0 Followers
7 Liked
Posts
·
--
BREAKING: MICHAEL SAYLOR JUST CONFIRMED THE BITCOIN $BTC BULL MARKET HAS STARTED. "We rallied $20,000 off the 200 week moving average. We are at the beginning of the next bull run."
BREAKING: MICHAEL SAYLOR JUST CONFIRMED THE BITCOIN $BTC BULL MARKET HAS STARTED. "We rallied $20,000 off the 200 week moving average. We are at the beginning of the next bull run."


73
·
--
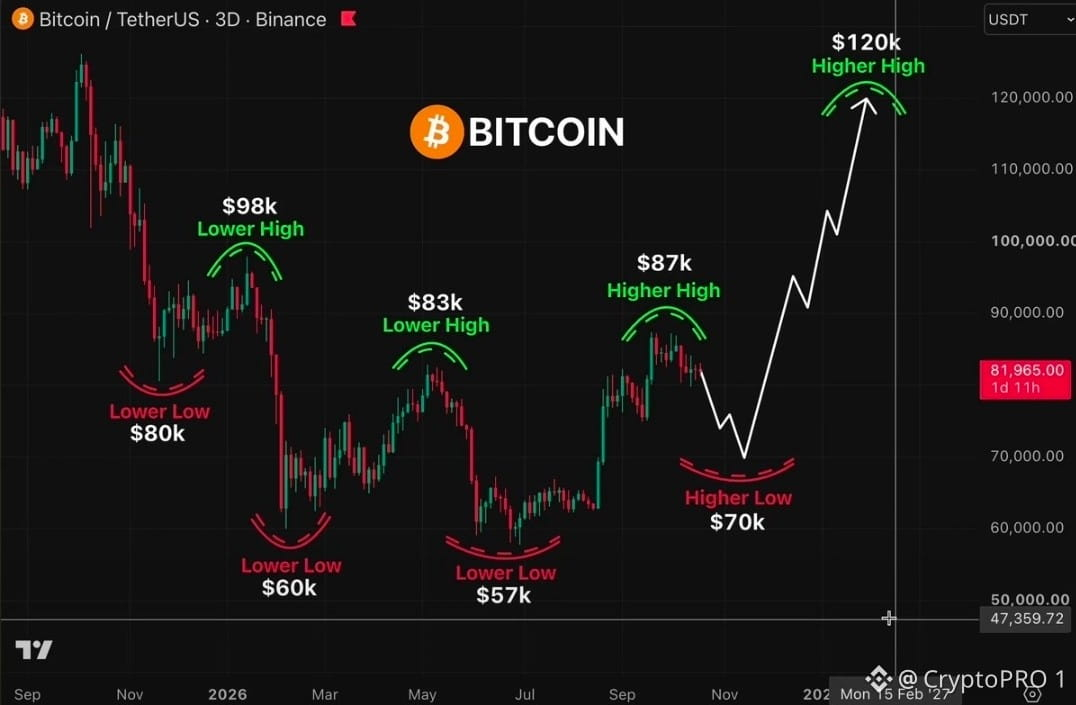
$BTC has been moving in a perfect downtrend for over a year... The same pattern played out the whole time: Sharp 30%+ dump -> price slows down -> 20-25% bounce -> massive dump But a month ago everything changed... The downtrend structure is completely destroyed, and those expecting a new low will GET REKT Expecting a flush to $70k first and a Higher Low to form That's where I plan to load up heavy on $BTC Don't rush to buy $BTC at current levels, the best opportunity is still ahead... Turn notifications on so you don't miss the next market call
$BTC has been moving in a perfect downtrend for over a year... The same pattern played out the whole time: Sharp 30%+ dump -> price slows down -> 20-25% bounce -> massive dump But a month ago everything changed... The downtrend structure is completely destroyed, and those expecting a new low will GET REKT Expecting a flush to $70k first and a Higher Low to form That's where I plan to load up heavy on $BTC Don't rush to buy $BTC at current levels, the best opportunity is still ahead... Turn notifications on so you don't miss the next market call
84
·
--
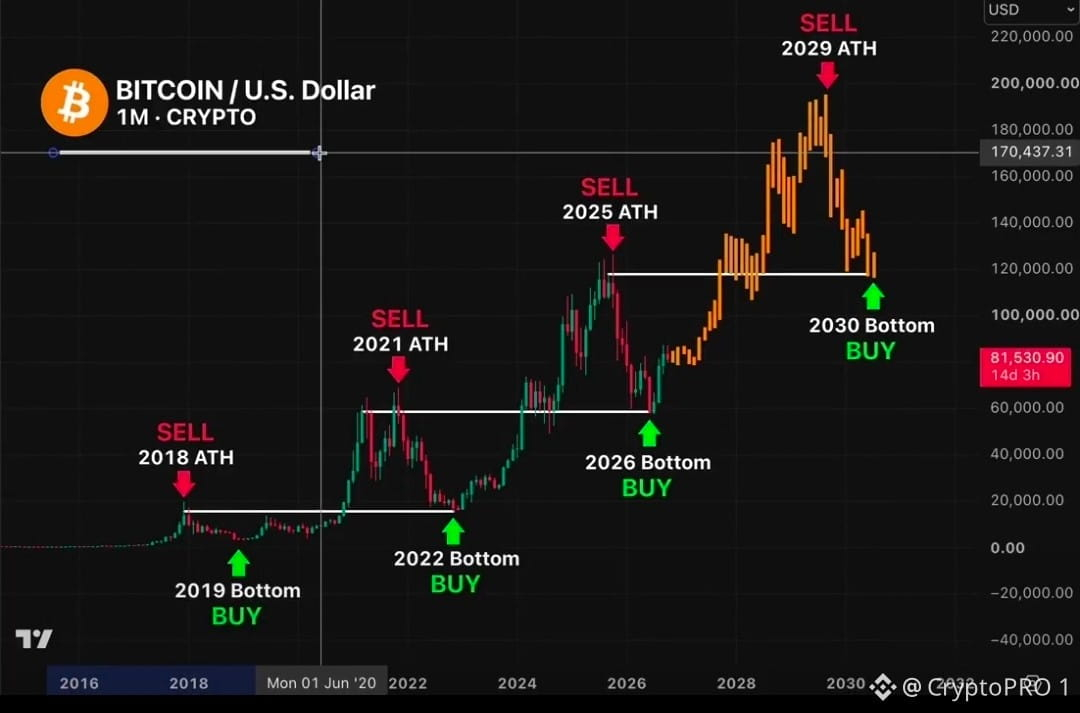
🚨 $BTC HAS BEEN RUNNING SAME SCRIPT SINCE 2013 Look at the chart. Really look Top → brutal drawdown → bottom → multi-year climb → new top - 2013 top. 2015 bottom - 2017 top. 2018 bottom - 2021 top. 2022 bottom - 2025 top at $126K. 2026 bottom near $60K Four cycles. Same rhythm. Same emotions And here's what almost nobody notices: Every bear market bottom lands on previous cycle's breakout zone ~$20K top in 2017 → $16K bottom in 2022 ~$60K highs in early 2021 → $60K bottom in 2026 Support doesn't care about your feelings If it rhymes again: → 2027-2029: the final expansion toward ~$190K → then a bottom near $117K around 2030, right at the 2025 top zone Everyone will scream "this time is different" It never is Most people will hesitate when they should buy and FOMO when they should sell Right now is the part of the cycle where nobody believes in the next leg up That's exactly why it works You're not following the price. You're following the pattern and the emotions behind it Patterns rhyme, they don't repeat perfectly. Manage your risk Turn on notifications. I'll keep posting the map
🚨 $BTC HAS BEEN RUNNING SAME SCRIPT SINCE 2013 Look at the chart. Really look Top → brutal drawdown → bottom → multi-year climb → new top - 2013 top. 2015 bottom - 2017 top. 2018 bottom - 2021 top. 2022 bottom - 2025 top at $126K. 2026 bottom near $60K Four cycles. Same rhythm. Same emotions And here's what almost nobody notices: Every bear market bottom lands on previous cycle's breakout zone ~$20K top in 2017 → $16K bottom in 2022 ~$60K highs in early 2021 → $60K bottom in 2026 Support doesn't care about your feelings If it rhymes again: → 2027-2029: the final expansion toward ~$190K → then a bottom near $117K around 2030, right at the 2025 top zone Everyone will scream "this time is different" It never is Most people will hesitate when they should buy and FOMO when they should sell Right now is the part of the cycle where nobody believes in the next leg up That's exactly why it works You're not following the price. You're following the pattern and the emotions behind it Patterns rhyme, they don't repeat perfectly. Manage your risk Turn on notifications. I'll keep posting the map
48
·
--
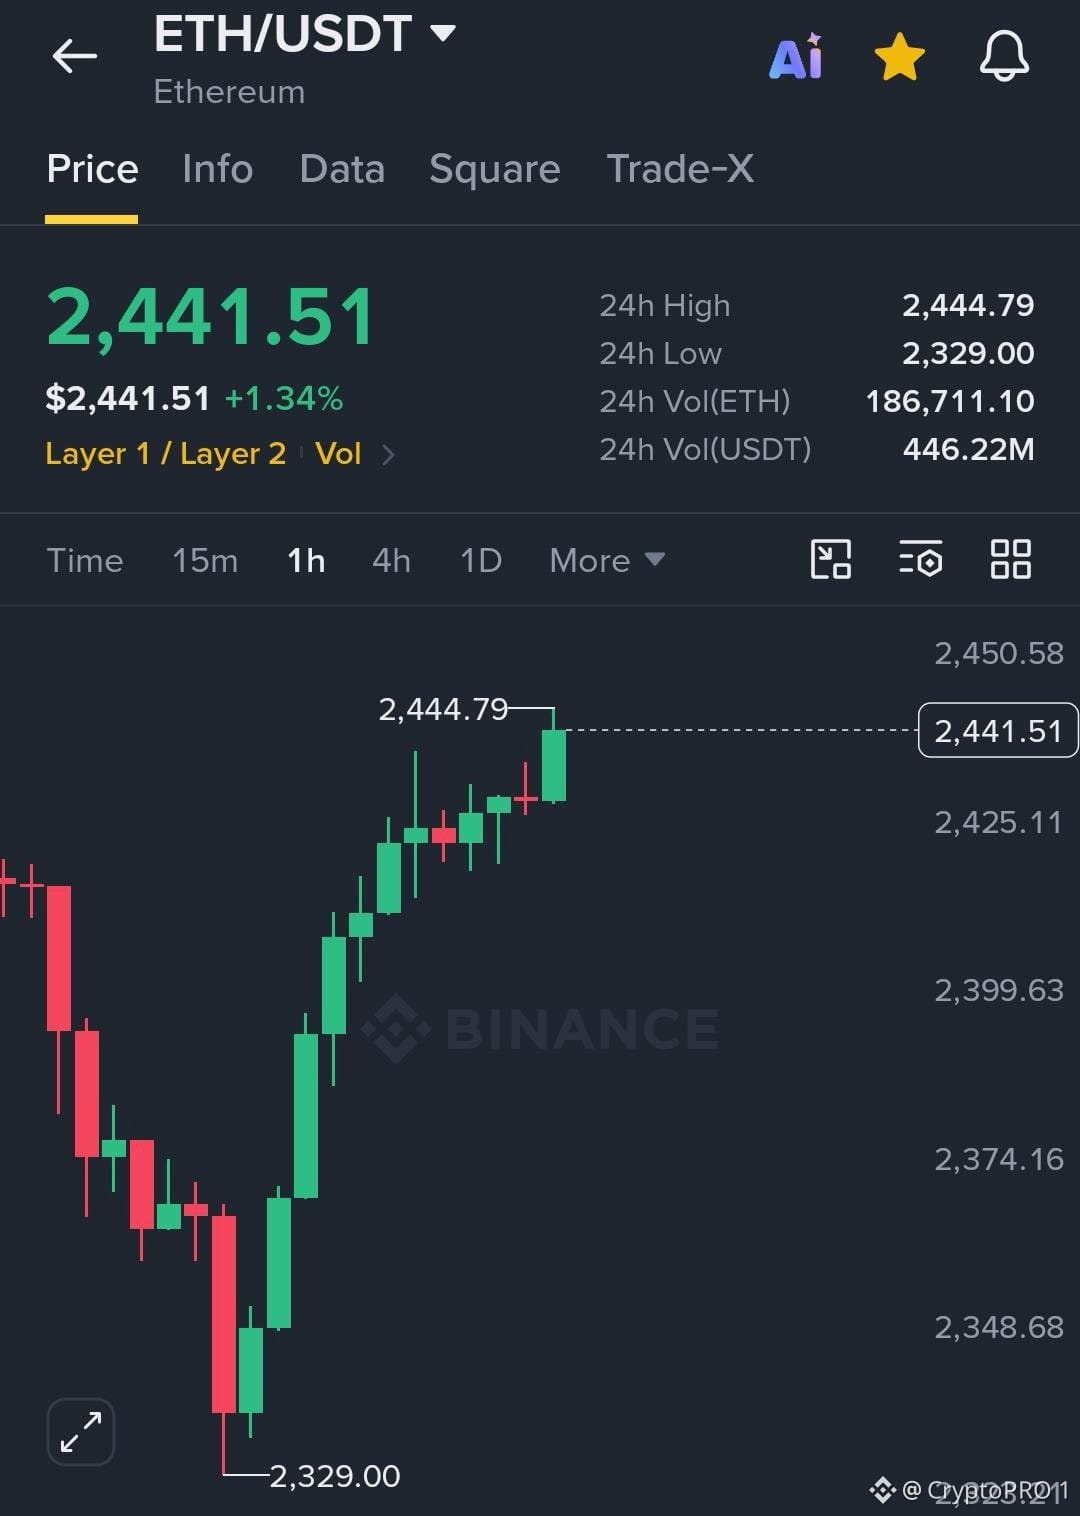
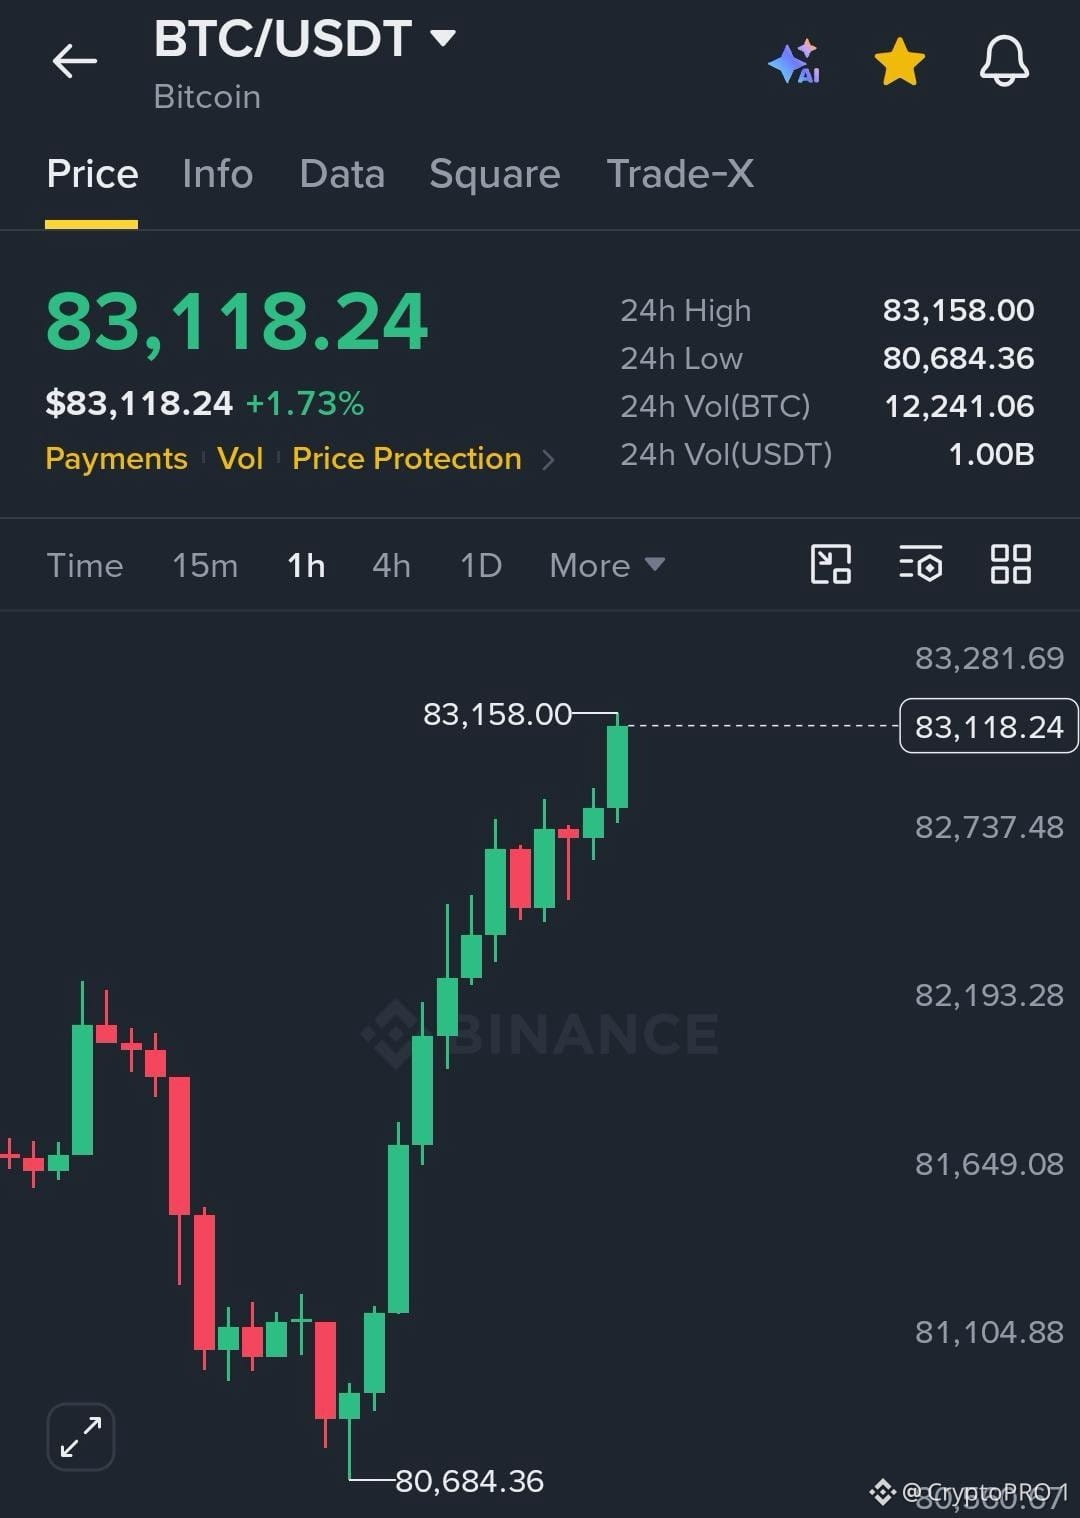
BREAKING: #Bitcoin just confirmed its 5th consecutive weekly close above the 50W MA. $BTC reclaimed $83,000 while $ETH is trading near $2,450 after liquidating $130M in shorts over the last 12 hours. Bears were spreading "Black Monday" crash fears from the last 2 weeks all over X. Send everything higher.
BREAKING: #Bitcoin just confirmed its 5th consecutive weekly close above the 50W MA. $BTC reclaimed $83,000 while $ETH is trading near $2,450 after liquidating $130M in shorts over the last 12 hours. Bears were spreading "Black Monday" crash fears from the last 2 weeks all over X. Send everything higher.
81
·
--
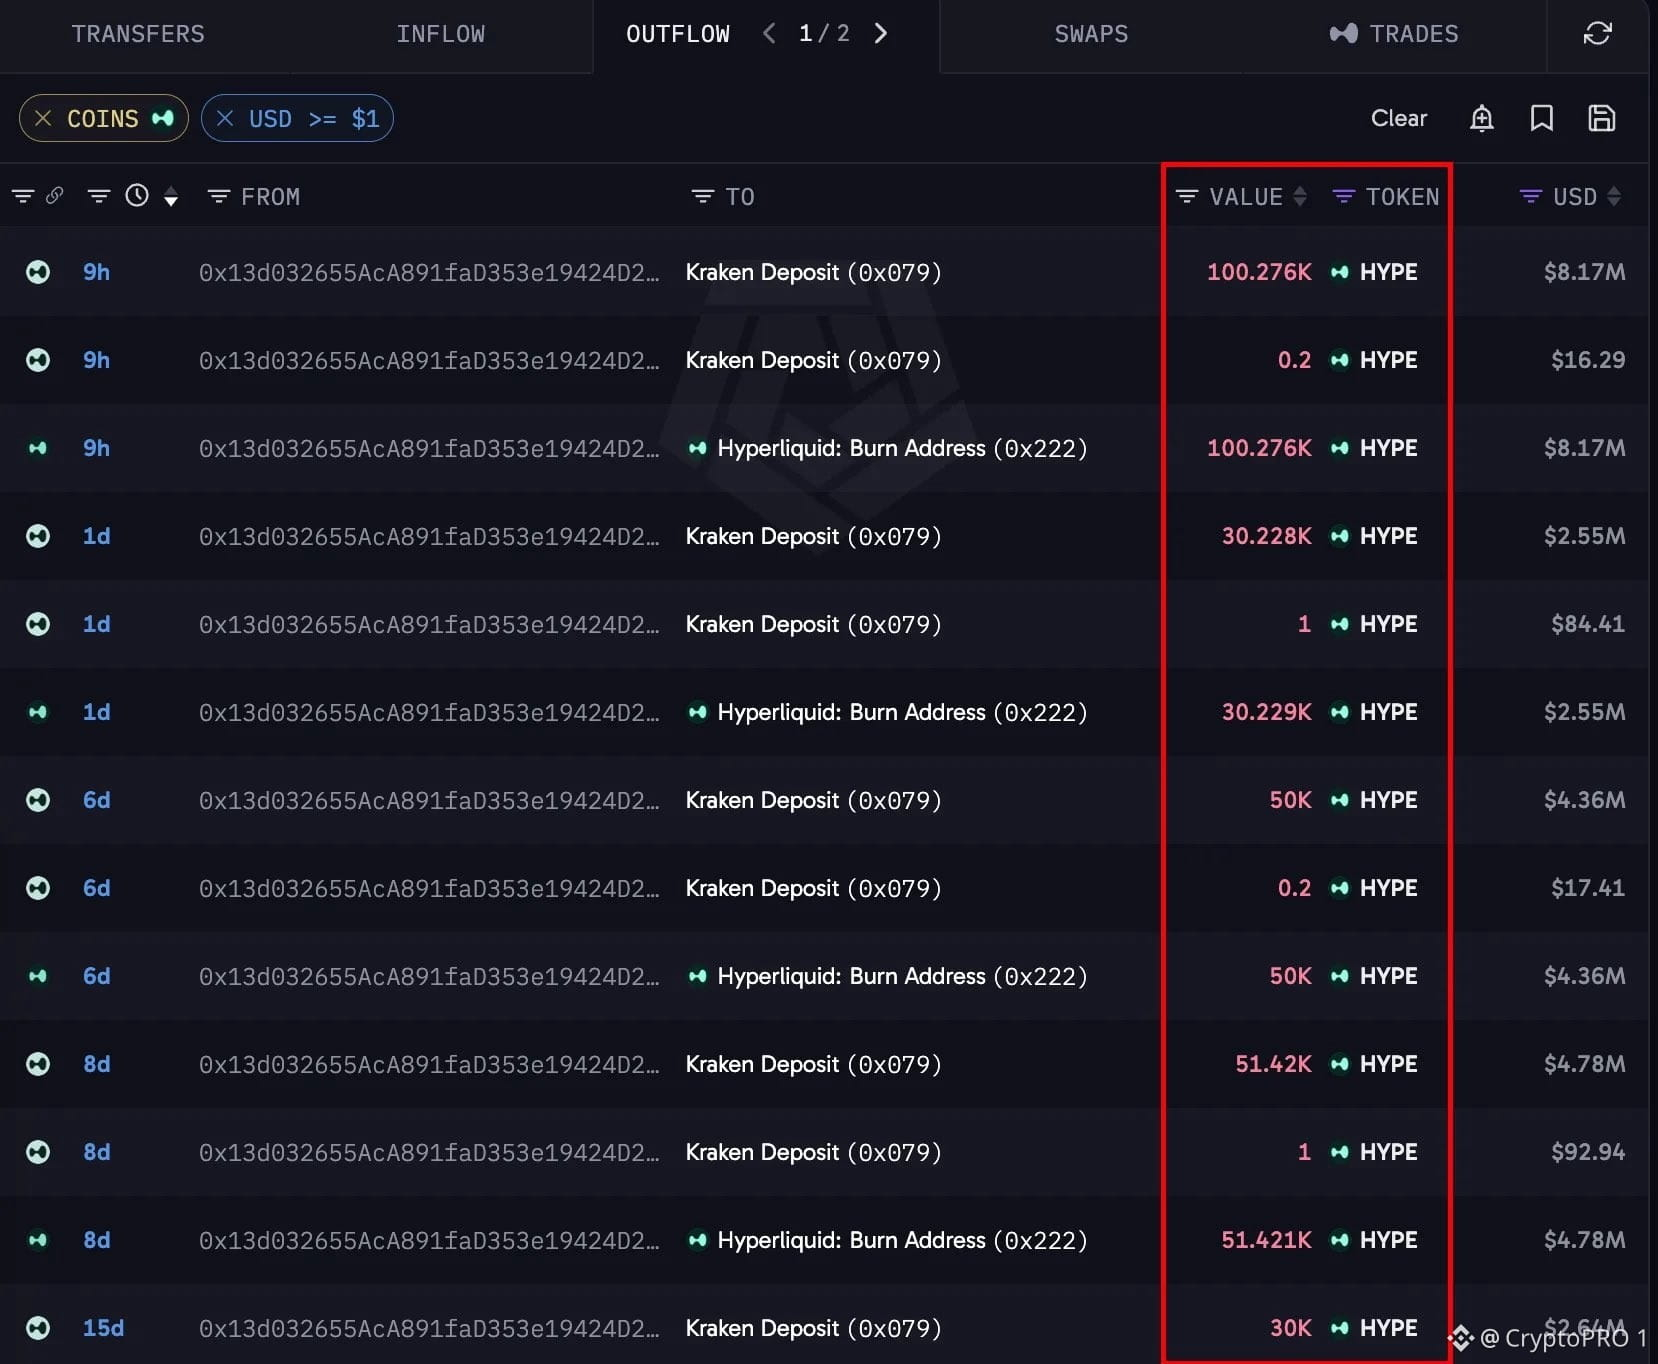
This is what conviction looks like. A whale bought 257,928 $HYPE at $3.5, held for two years and walked away with massive $21 million in profits. Patience pays big.
This is what conviction looks like. A whale bought 257,928 $HYPE at $3.5, held for two years and walked away with massive $21 million in profits. Patience pays big.
48
·
--
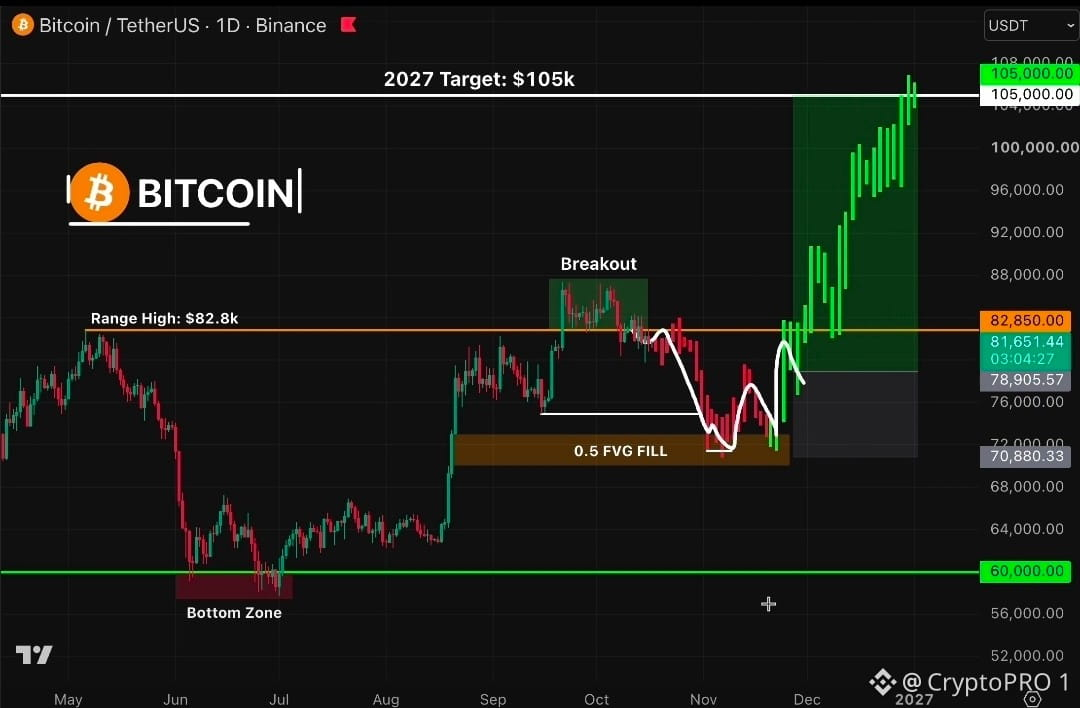
🚨 FINAL $BTC TRAP WILL BE BRUTAL The relief rally is finally over - the downside phase has just begun I already called a pump above $83k earlier Today I can say just one thing: "A mass $BTC dump below $75k is inevitable" Based on that, my market plan looks like this: $82K → $75K → $70K → 2-3W accumulation → $105K by Q2-Q3 2027 Save my chart and come back in a few months Most traders see my market calls way too late Turn notifications on so you don't miss the next key market call...
🚨 FINAL $BTC TRAP WILL BE BRUTAL The relief rally is finally over - the downside phase has just begun I already called a pump above $83k earlier Today I can say just one thing: "A mass $BTC dump below $75k is inevitable" Based on that, my market plan looks like this: $82K → $75K → $70K → 2-3W accumulation → $105K by Q2-Q3 2027 Save my chart and come back in a few months Most traders see my market calls way too late Turn notifications on so you don't miss the next key market call...
71
·
--
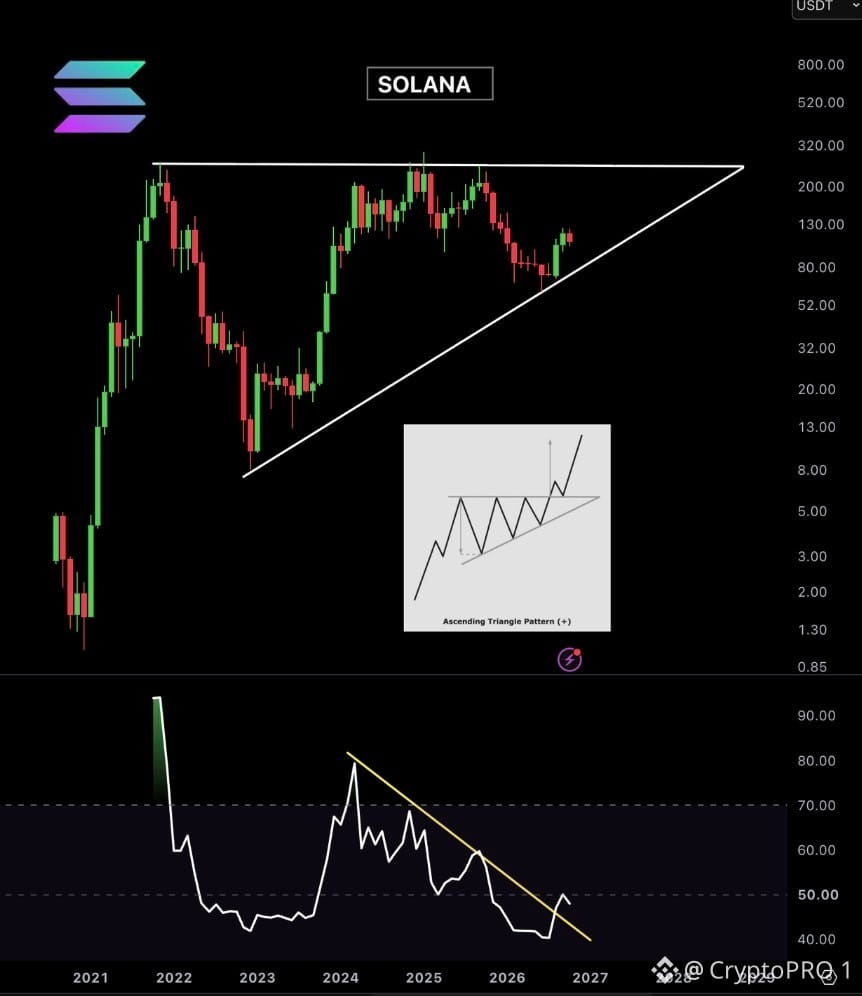
Solana $SOL is forming a bullish triangle pattern on the monthly timeframe. If this breakout happens, we could see the next leg up
Solana $SOL is forming a bullish triangle pattern on the monthly timeframe. If this breakout happens, we could see the next leg up
47
·
--
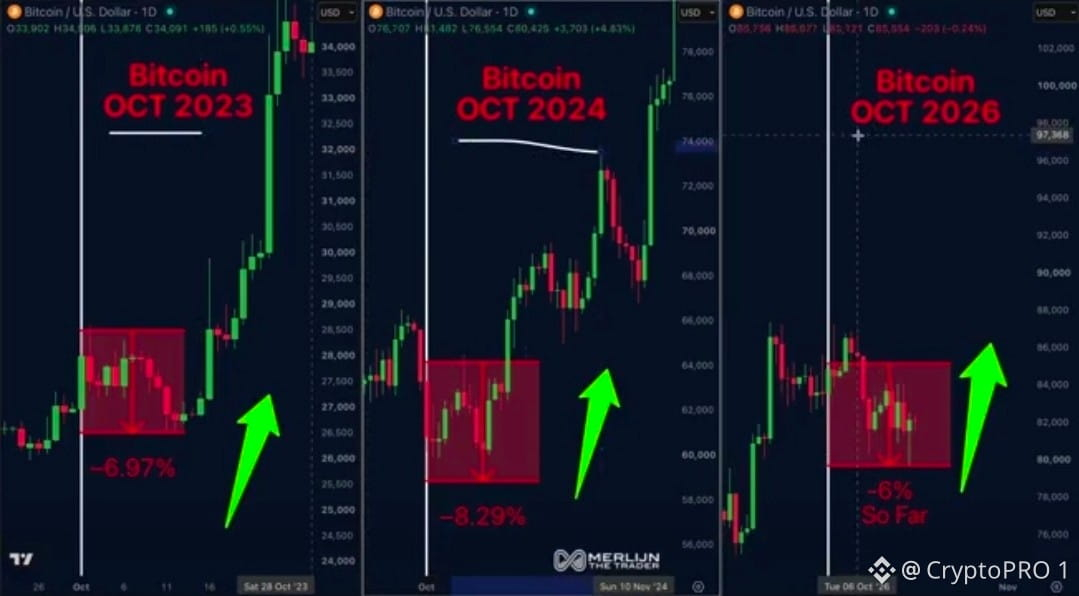
Everyone thinks UPtober is dead. 2023 and 2024 both started October with a $BTC dip. Both times, a 50%+ rally followed within 2 months. I’m accumulating this dip before #Bitcoin goes to VALHALLA!
Everyone thinks UPtober is dead. 2023 and 2024 both started October with a $BTC dip. Both times, a 50%+ rally followed within 2 months. I’m accumulating this dip before #Bitcoin goes to VALHALLA!
55
·
--
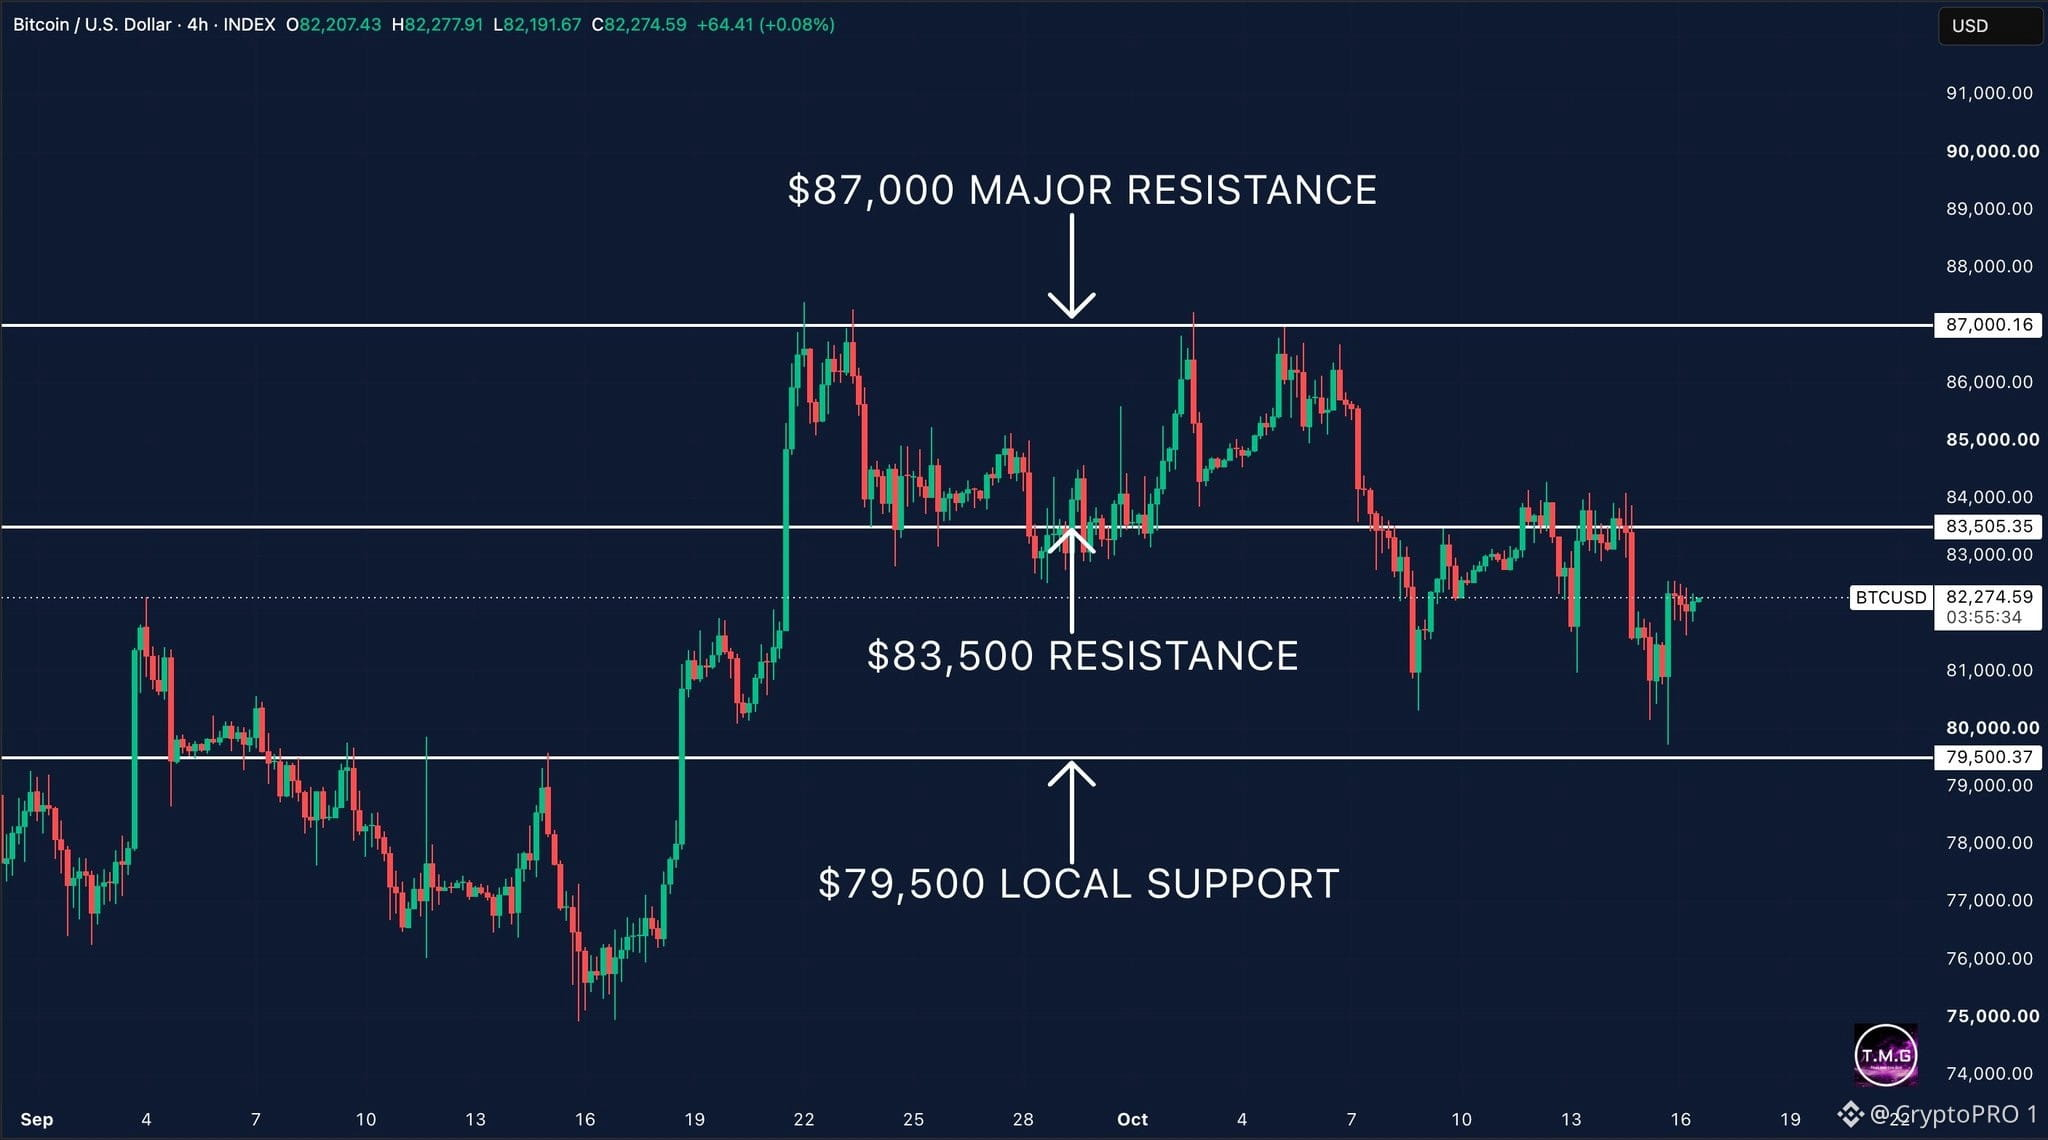
#Bitcoin is trading around $82,000 as buyers struggle to reclaim a key resistance level. $BTC has fallen back below $83,500, which is now the level to watch for a potential recovery. A move back above $83,500 could open the door towards $85,000, with major resistance sitting at $87,000. If Bitcoin fails to recover this level, selling pressure could push the price towards $80,000, followed by key support at $79,500. For now, $83,500 is the level that could determine Bitcoin's next move. Reclaiming it would improve the short-term outlook, while further rejection leaves the door open to another test of lower support.
#Bitcoin is trading around $82,000 as buyers struggle to reclaim a key resistance level. $BTC has fallen back below $83,500, which is now the level to watch for a potential recovery. A move back above $83,500 could open the door towards $85,000, with major resistance sitting at $87,000. If Bitcoin fails to recover this level, selling pressure could push the price towards $80,000, followed by key support at $79,500. For now, $83,500 is the level that could determine Bitcoin's next move. Reclaiming it would improve the short-term outlook, while further rejection leaves the door open to another test of lower support.
72
·
--
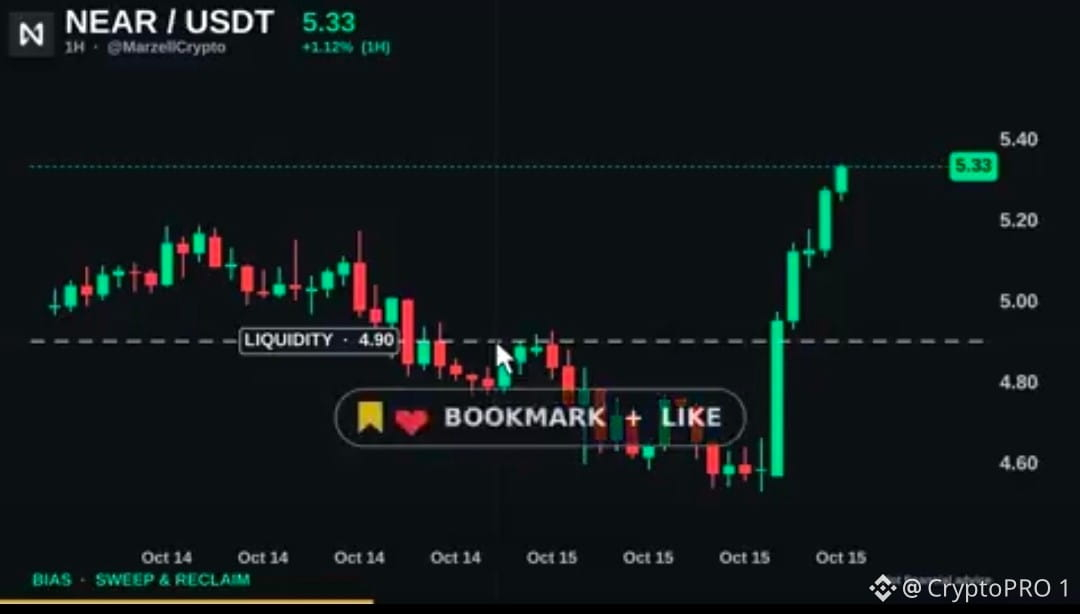
Since the New York open $NEAR has run 17% on about 6x normal volume, and it's now pressing $5.36, Tuesday's lower high. On Tuesday I said $4.90 had to hold. It didn't. It flushed to $4.53 this afternoon, then reversed almost the whole drop in five hours. As long as $5.17 holds I think $5.36 gives way and $5.60 is back in play. Lose it and $4.90 is the retest. Not financial advice
Since the New York open $NEAR has run 17% on about 6x normal volume, and it's now pressing $5.36, Tuesday's lower high. On Tuesday I said $4.90 had to hold. It didn't. It flushed to $4.53 this afternoon, then reversed almost the whole drop in five hours. As long as $5.17 holds I think $5.36 gives way and $5.60 is back in play. Lose it and $4.90 is the retest. Not financial advice
62
·
--
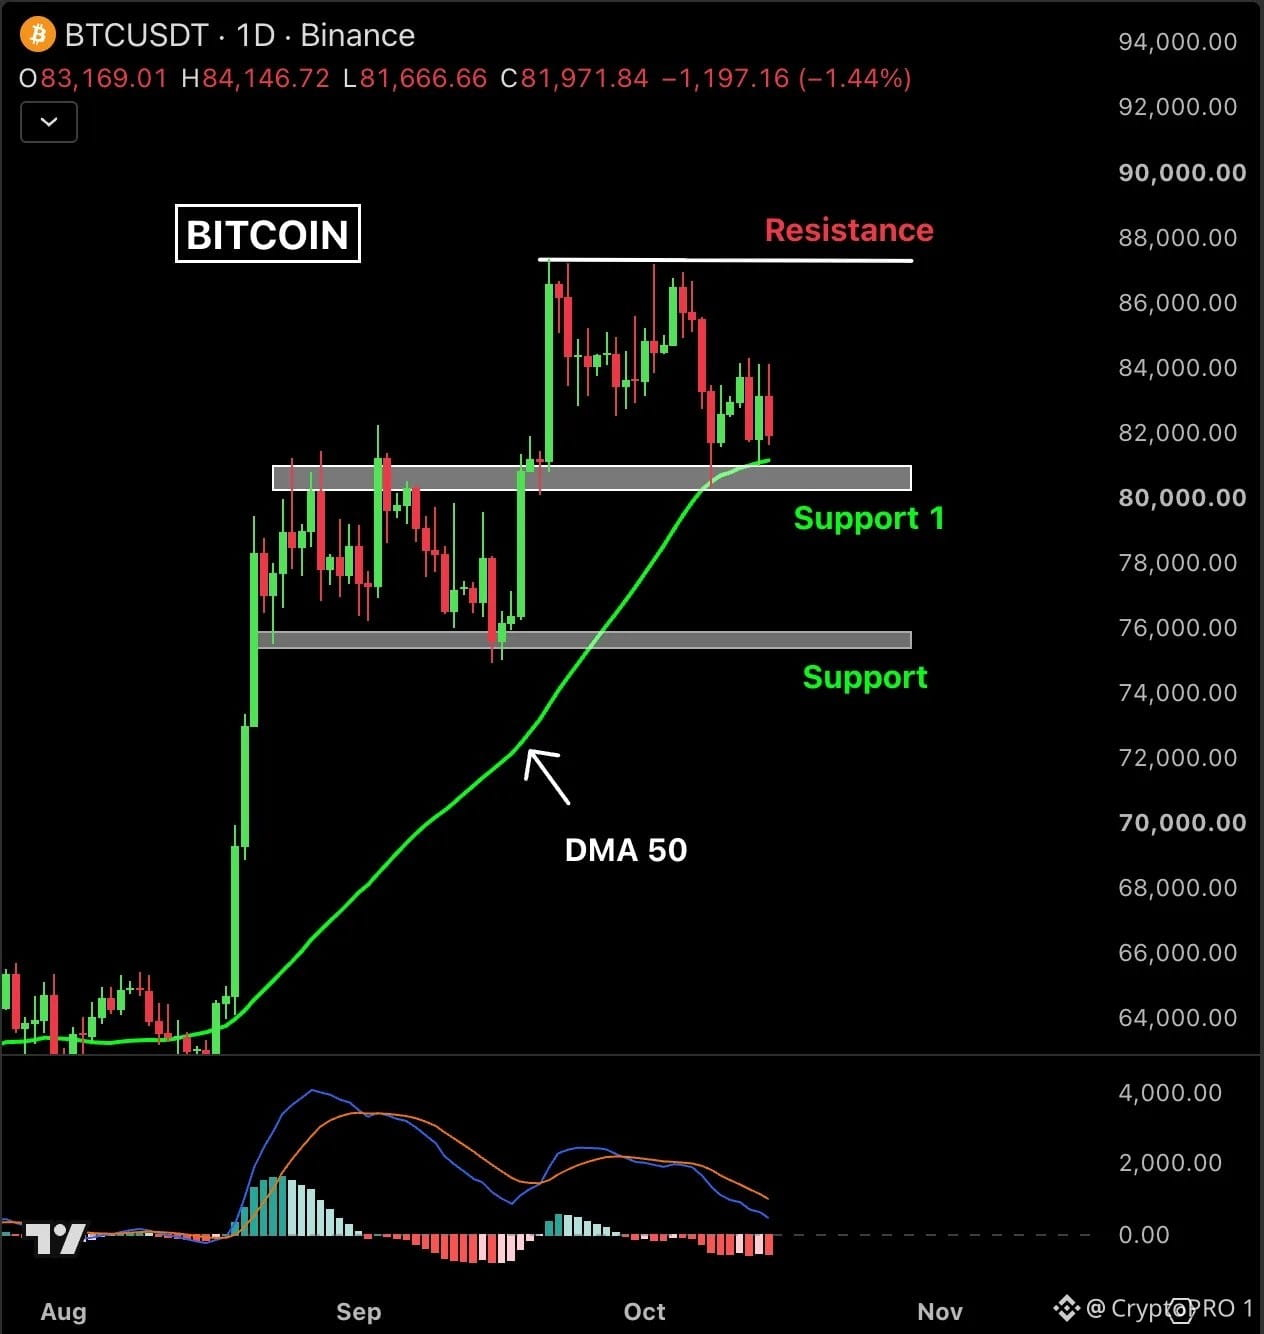
Bitcoin $BTC is now approaching its 50D MA support level. Hold above it, and BTC could rally towards $87K. Lose this and BTC could drop to $76K.
Bitcoin $BTC is now approaching its 50D MA support level. Hold above it, and BTC could rally towards $87K. Lose this and BTC could drop to $76K.
76
·
--
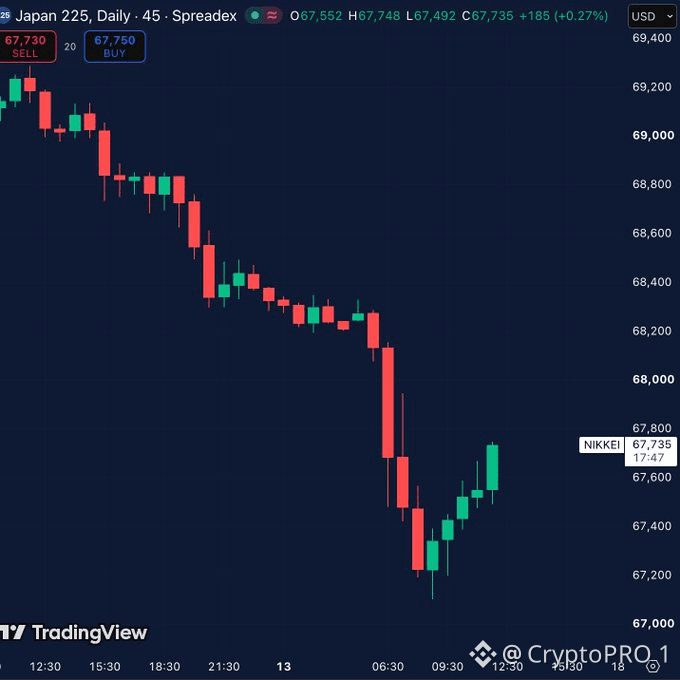
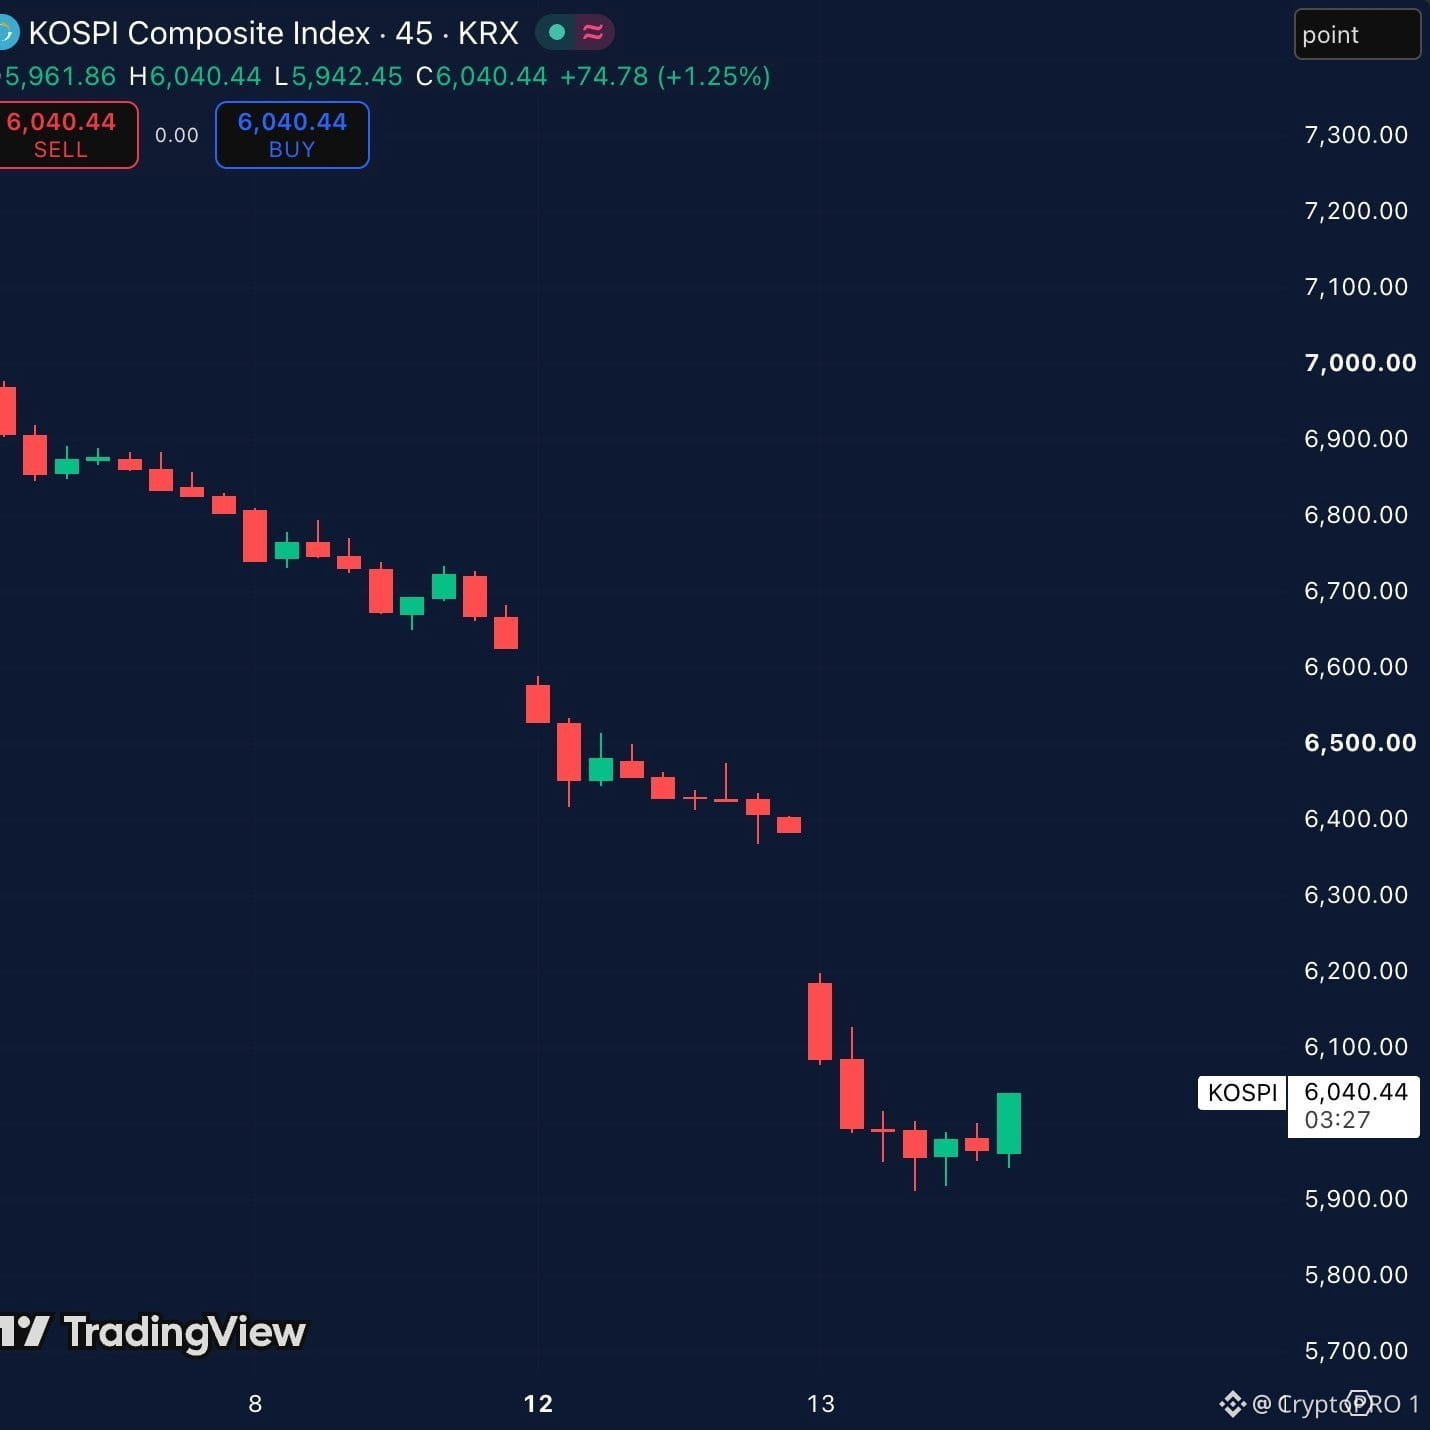
Asian markets are getting hit hard today, with around $518 billion wiped from Japan and South Korea’s stock markets. The sell-off is being driven by weakness in tech and semiconductor stocks, rising bond yields and growing concerns about the amount of money being poured into AI. There’s also growing debate over whether the huge investment in AI will actually generate enough profits to justify the valuations. This is something I’ll be watching closely because if the weakness spreads into US tech stocks, it could put further pressure on Bitcoin $BTC and other risk assets.
Asian markets are getting hit hard today, with around $518 billion wiped from Japan and South Korea’s stock markets. The sell-off is being driven by weakness in tech and semiconductor stocks, rising bond yields and growing concerns about the amount of money being poured into AI. There’s also growing debate over whether the huge investment in AI will actually generate enough profits to justify the valuations. This is something I’ll be watching closely because if the weakness spreads into US tech stocks, it could put further pressure on Bitcoin $BTC and other risk assets.
74
·
--
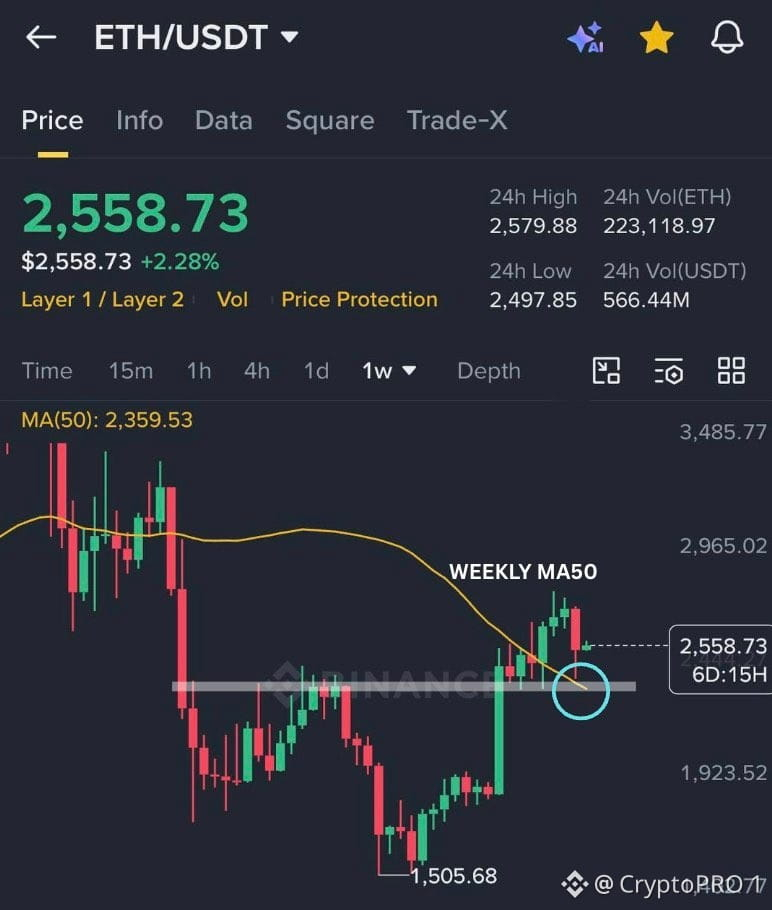
$ETH just closed its 4th straight week above the Weekly MA 50 after bouncing from multi-month support at $2,405. The bulls are in control🚀
$ETH just closed its 4th straight week above the Weekly MA 50 after bouncing from multi-month support at $2,405. The bulls are in control🚀
49
·
--
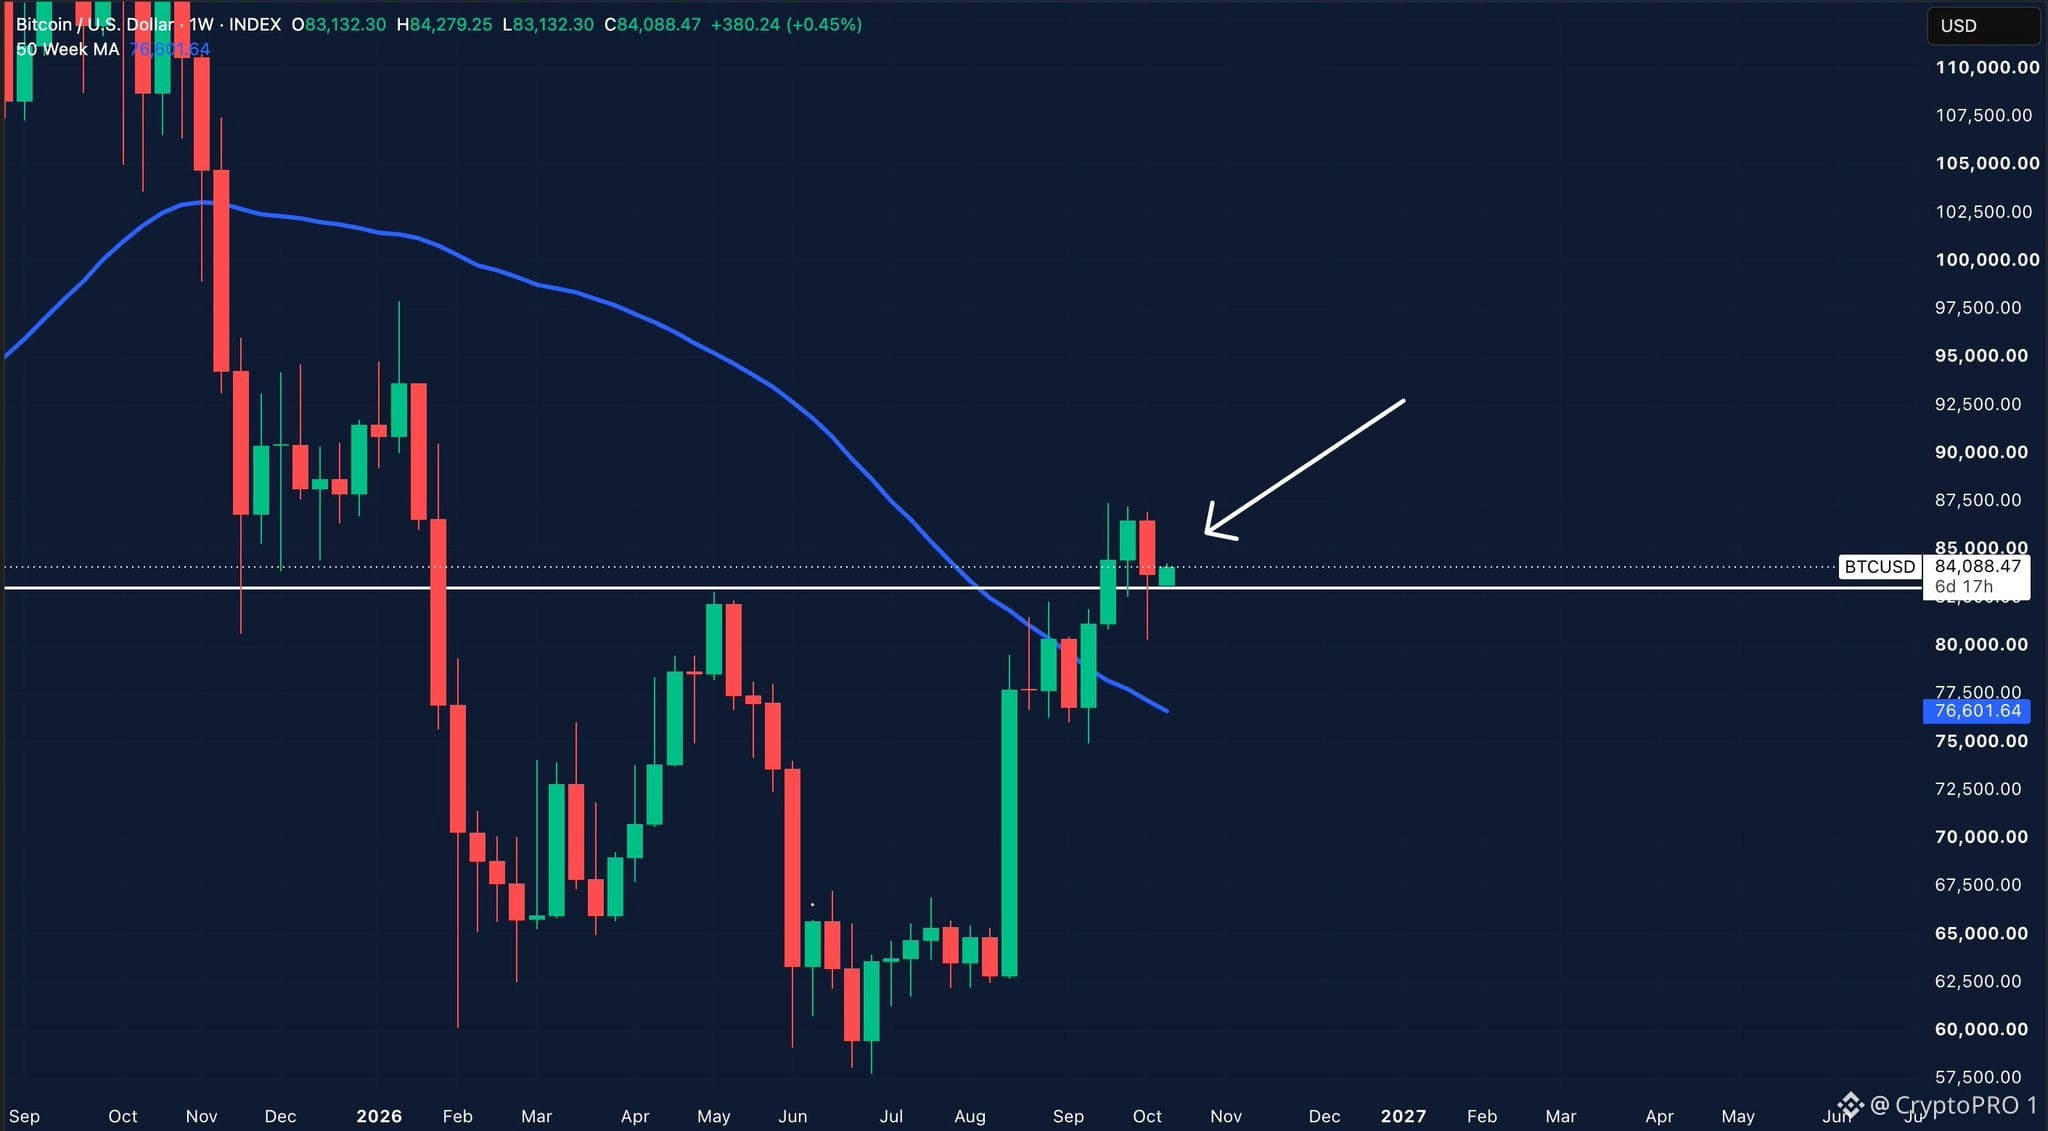
Bitcoin $BTC has now closed its 4th consecutive weekly candle above the 50-week moving average. That’s an important signal for the longer-term structure. The 50W MA has historically been a useful trend indicator, and continuing to hold above it suggests the broader market structure remains constructive. I wouldn’t call a bull market “100% confirmed” from one indicator alone. But when you combine this with BTC holding above $83K and attempting to reclaim $85K, the picture is certainly becoming more bullish. The next big test for me remains $87K.
Bitcoin $BTC has now closed its 4th consecutive weekly candle above the 50-week moving average. That’s an important signal for the longer-term structure. The 50W MA has historically been a useful trend indicator, and continuing to hold above it suggests the broader market structure remains constructive. I wouldn’t call a bull market “100% confirmed” from one indicator alone. But when you combine this with BTC holding above $83K and attempting to reclaim $85K, the picture is certainly becoming more bullish. The next big test for me remains $87K.
61
·
--
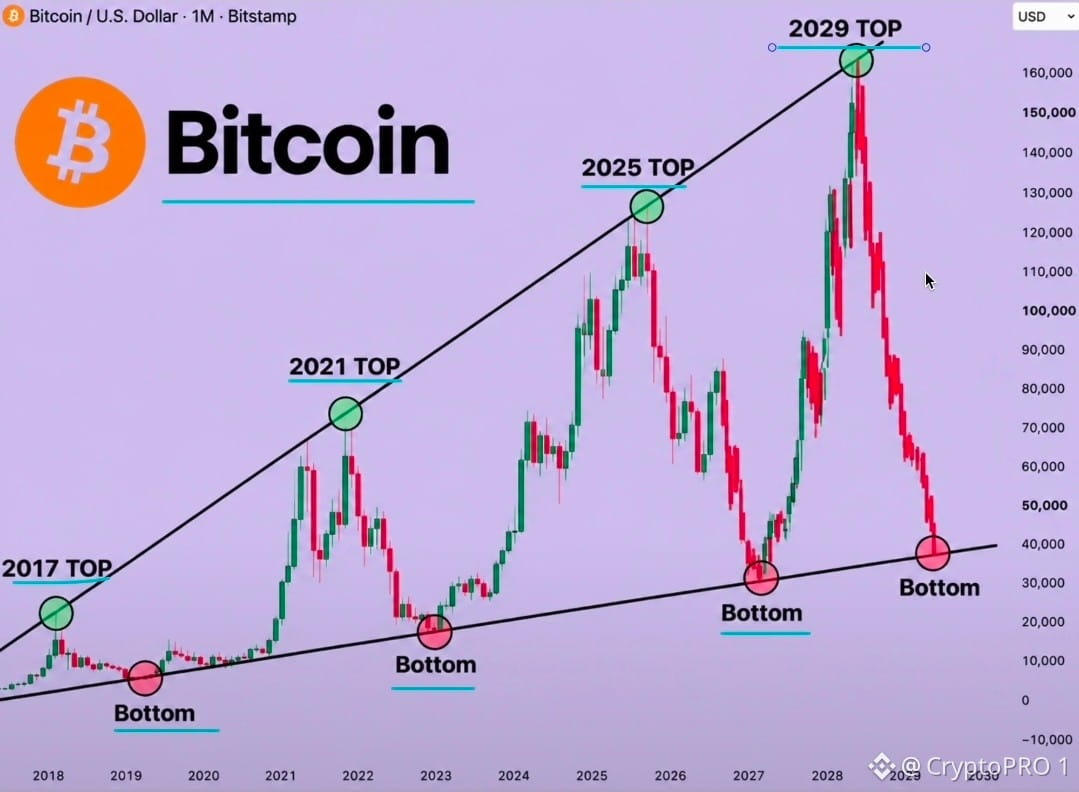
🚨 EVERYONE HAS FORGOTTEN BITCOIN $BTC 4-YEAR CYCLE. BIG MISTAKE. The same pattern has been shaping major tops and bottoms for over ten years. And I think it's about to offer us another massive opportunity. Look at the chart. 2018 → Cycle Bottom 2022 → Cycle Bottom 2026 → NEXT Cycle Bottom? Every cycle follows the same ruthless sequence: Euphoria → Peak → Crash → Capitulation → New Bull Run The problem is, when the real bottom arrives, no one wants to buy. They want confirmation. They want good news. They want everyone to start buying first. By then, the best entry opportunity may have already slipped away. I called Bitcoin's $17K bottom in 2022 and its $126K peak in 2025 for everyone to hear. Now I'm watching for the next big cycle bottom. Save this chart and come back in a few months. Follow + turn on notifications. If I spot the next major bottom formation, I'll share my call HERE FIRST.
🚨 EVERYONE HAS FORGOTTEN BITCOIN $BTC 4-YEAR CYCLE. BIG MISTAKE. The same pattern has been shaping major tops and bottoms for over ten years. And I think it's about to offer us another massive opportunity. Look at the chart. 2018 → Cycle Bottom 2022 → Cycle Bottom 2026 → NEXT Cycle Bottom? Every cycle follows the same ruthless sequence: Euphoria → Peak → Crash → Capitulation → New Bull Run The problem is, when the real bottom arrives, no one wants to buy. They want confirmation. They want good news. They want everyone to start buying first. By then, the best entry opportunity may have already slipped away. I called Bitcoin's $17K bottom in 2022 and its $126K peak in 2025 for everyone to hear. Now I'm watching for the next big cycle bottom. Save this chart and come back in a few months. Follow + turn on notifications. If I spot the next major bottom formation, I'll share my call HERE FIRST.
55
·
--
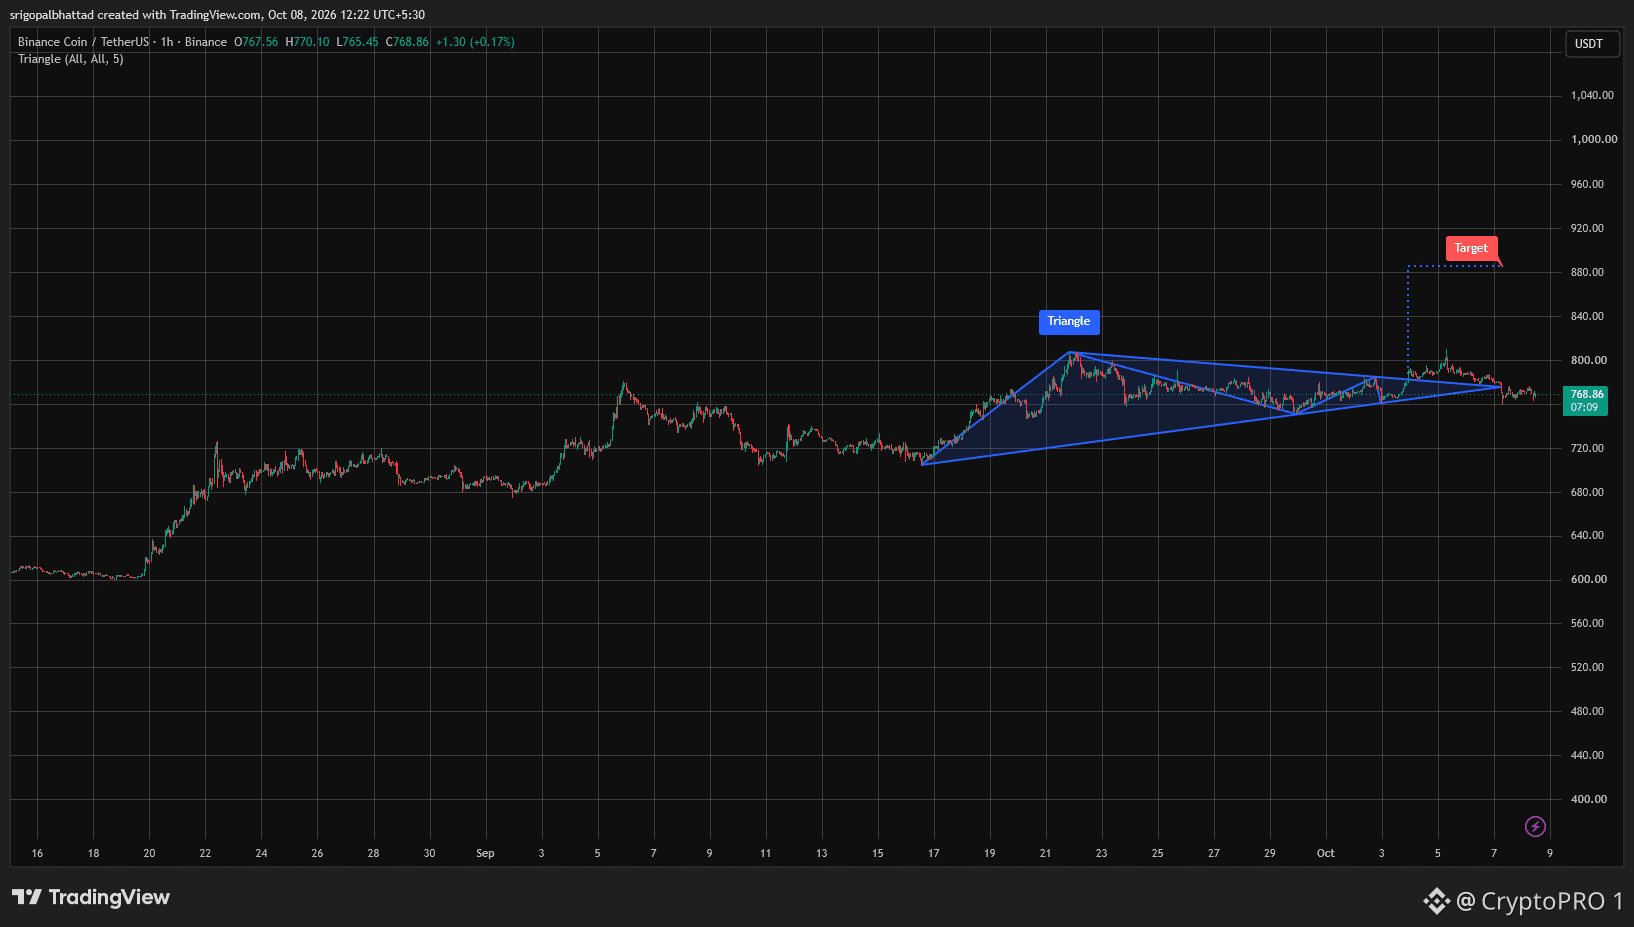
BNB/USDT — 1H 📊 $BNB is consolidating inside a triangle pattern after a strong uptrend. 🔹 Current: $768.86 🔹 Resistance: $800–$805 🔹 Support: $750–$760 🟢 Breakout above $805 → 🎯 $885 🔴 Breakdown below $750 → bearish continuation risk The triangle is nearing its apex. A confirmed breakout above $805 could trigger the next major move toward $885. #BNB #BNBUSDT #BinanceCoin
BNB/USDT — 1H 📊 $BNB is consolidating inside a triangle pattern after a strong uptrend. 🔹 Current: $768.86 🔹 Resistance: $800–$805 🔹 Support: $750–$760 🟢 Breakout above $805 → 🎯 $885 🔴 Breakdown below $750 → bearish continuation risk The triangle is nearing its apex. A confirmed breakout above $805 could trigger the next major move toward $885. #BNB #BNBUSDT #BinanceCoin
39
·
--
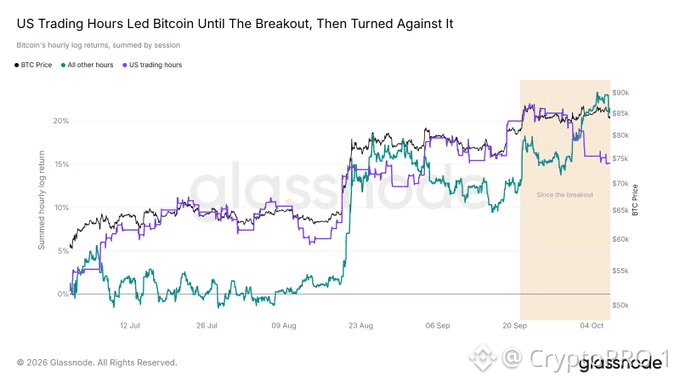
Bitcoin $BTC is showing a shift that I wouldn't ignore. 👀 From July to September, US buyers were the main force behind $BTC's rally. But since the breakout, US trading hours have turned into net selling. That's a big change from what was driving Bitcoin higher just weeks ago. I'm not calling this bearish yet, but if #BTC wants another strong leg up, we need to see buyers stepping back in. The next move could be very interesting.
Bitcoin $BTC is showing a shift that I wouldn't ignore. 👀 From July to September, US buyers were the main force behind $BTC's rally. But since the breakout, US trading hours have turned into net selling. That's a big change from what was driving Bitcoin higher just weeks ago. I'm not calling this bearish yet, but if #BTC wants another strong leg up, we need to see buyers stepping back in. The next move could be very interesting.
49
·
--
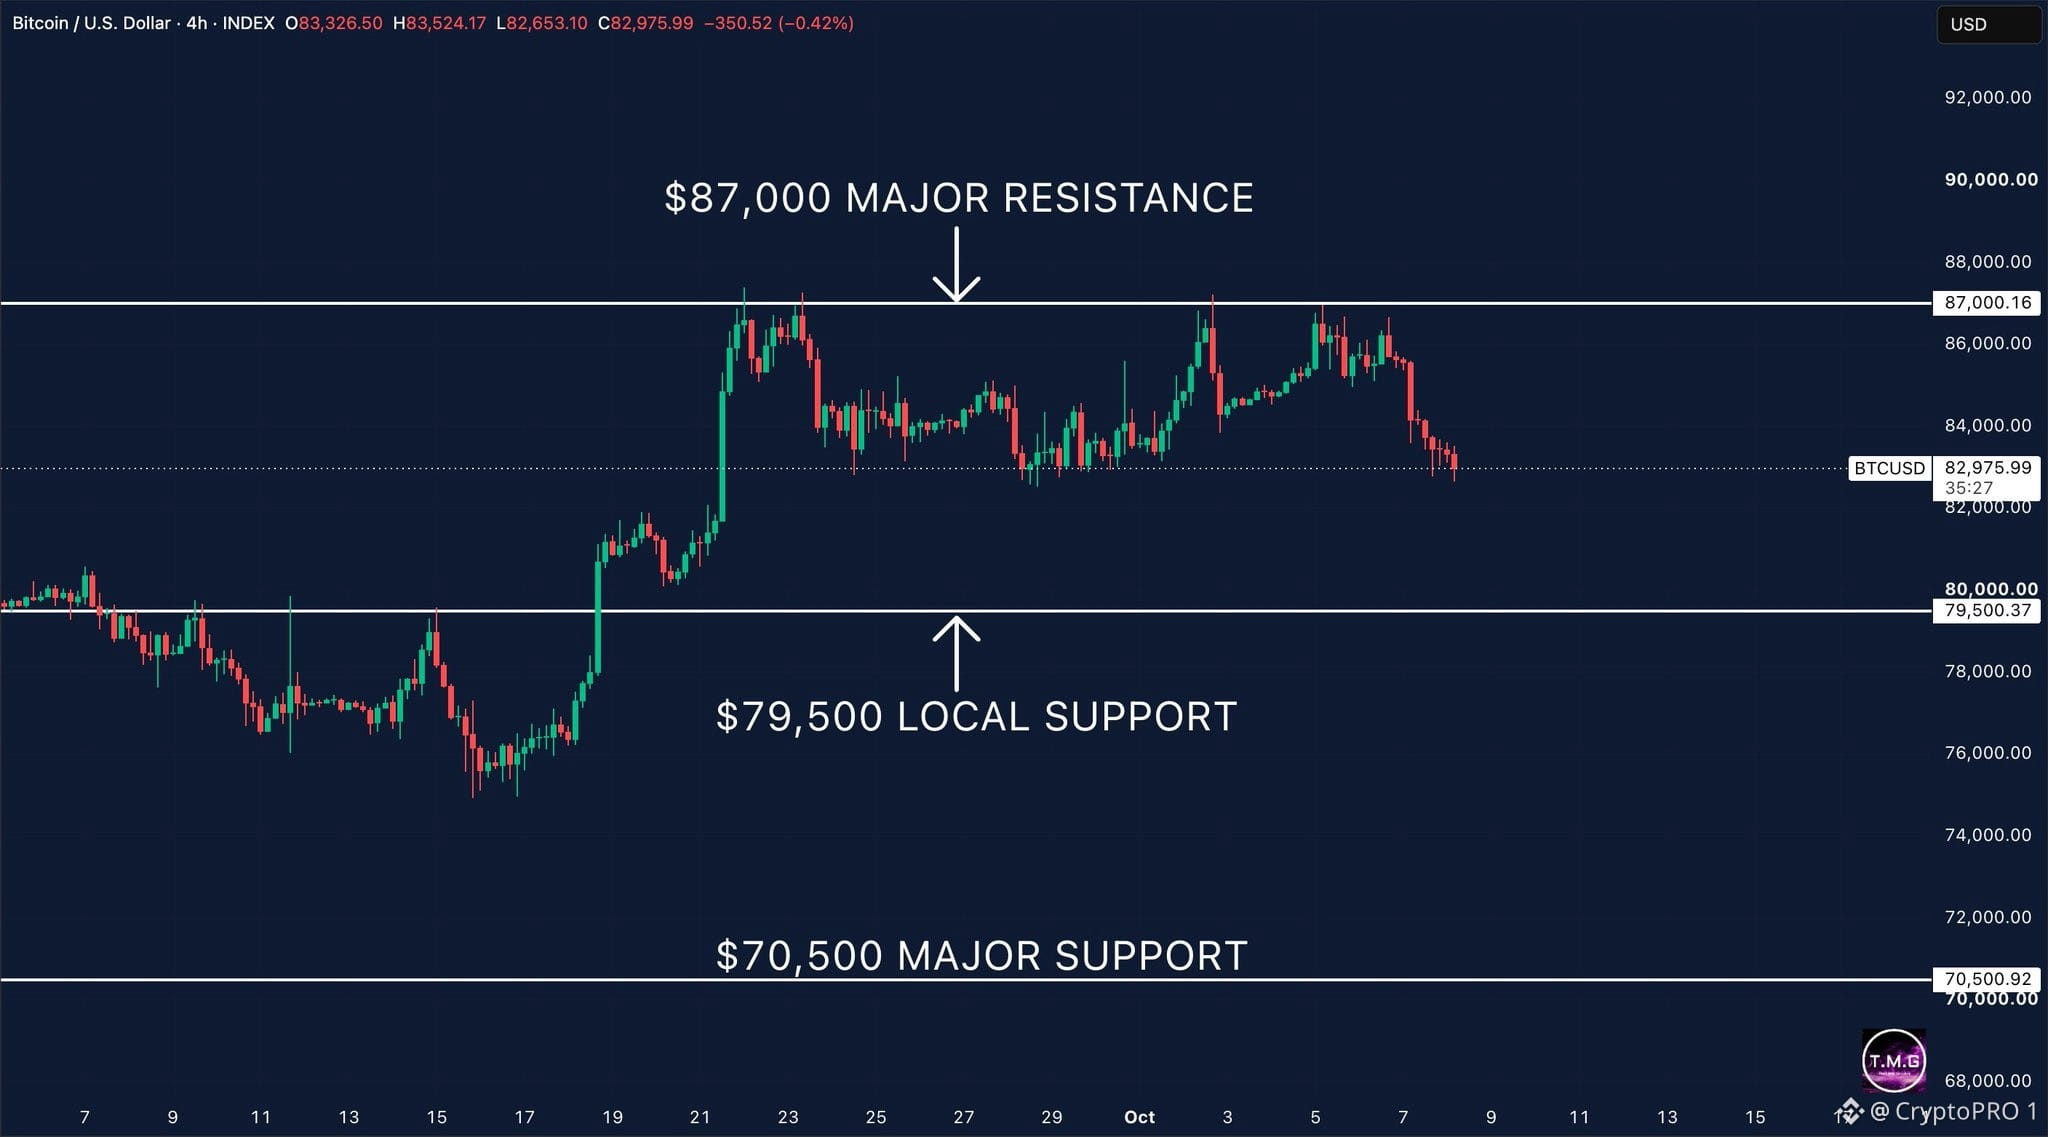
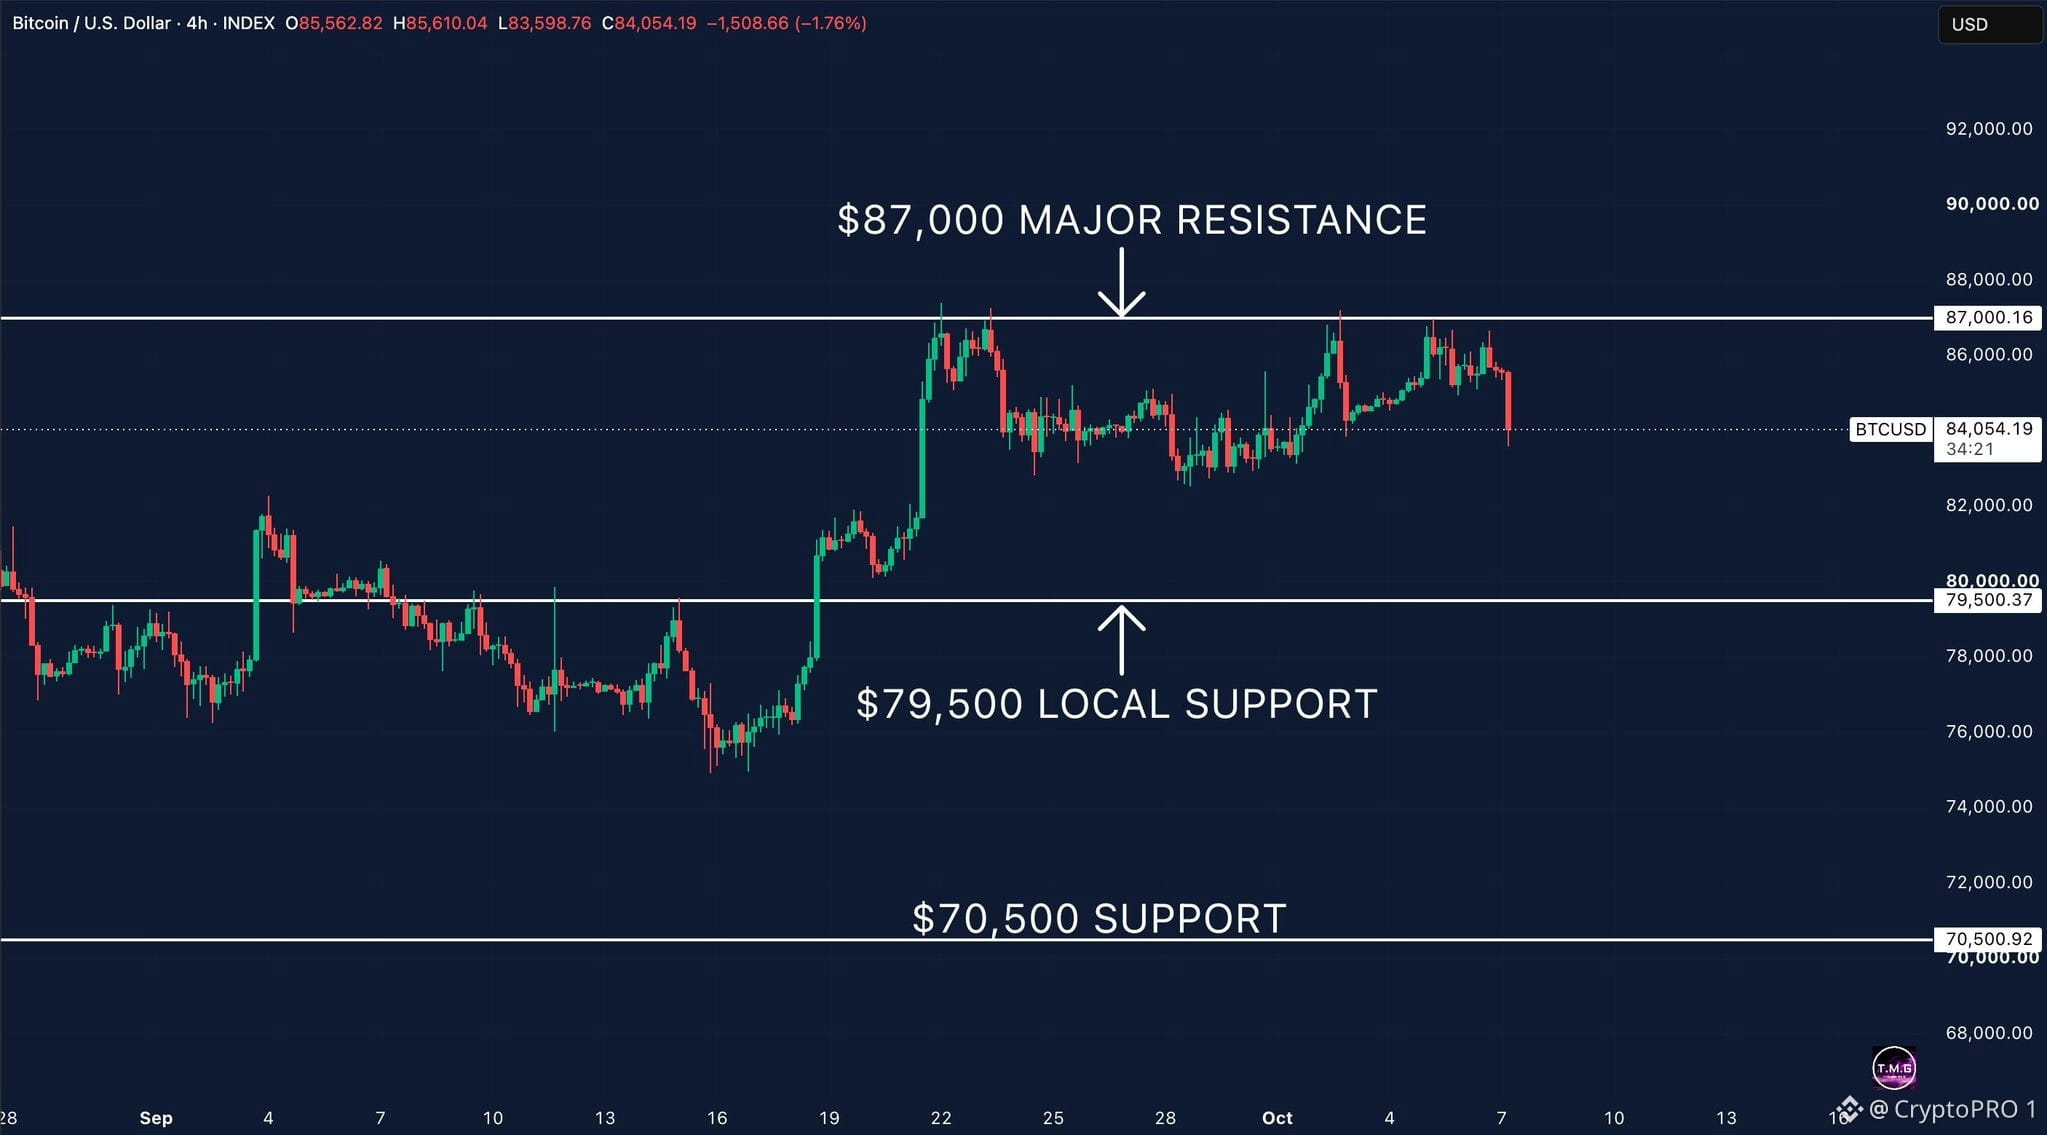
Bitcoin $BTC is back below $83K after failing to break $87K for the third time. The 4H structure is starting to look weaker here. $79.5K is the major support I’m watching. If that level holds, this can still be viewed as a deeper pullback within the broader range. But if $79.5K breaks, the picture changes quickly and $70.5K becomes the next major support. For now, bulls need to reclaim $85K and eventually $87K to regain control.
Bitcoin $BTC is back below $83K after failing to break $87K for the third time. The 4H structure is starting to look weaker here. $79.5K is the major support I’m watching. If that level holds, this can still be viewed as a deeper pullback within the broader range. But if $79.5K breaks, the picture changes quickly and $70.5K becomes the next major support. For now, bulls need to reclaim $85K and eventually $87K to regain control.
64
·
--
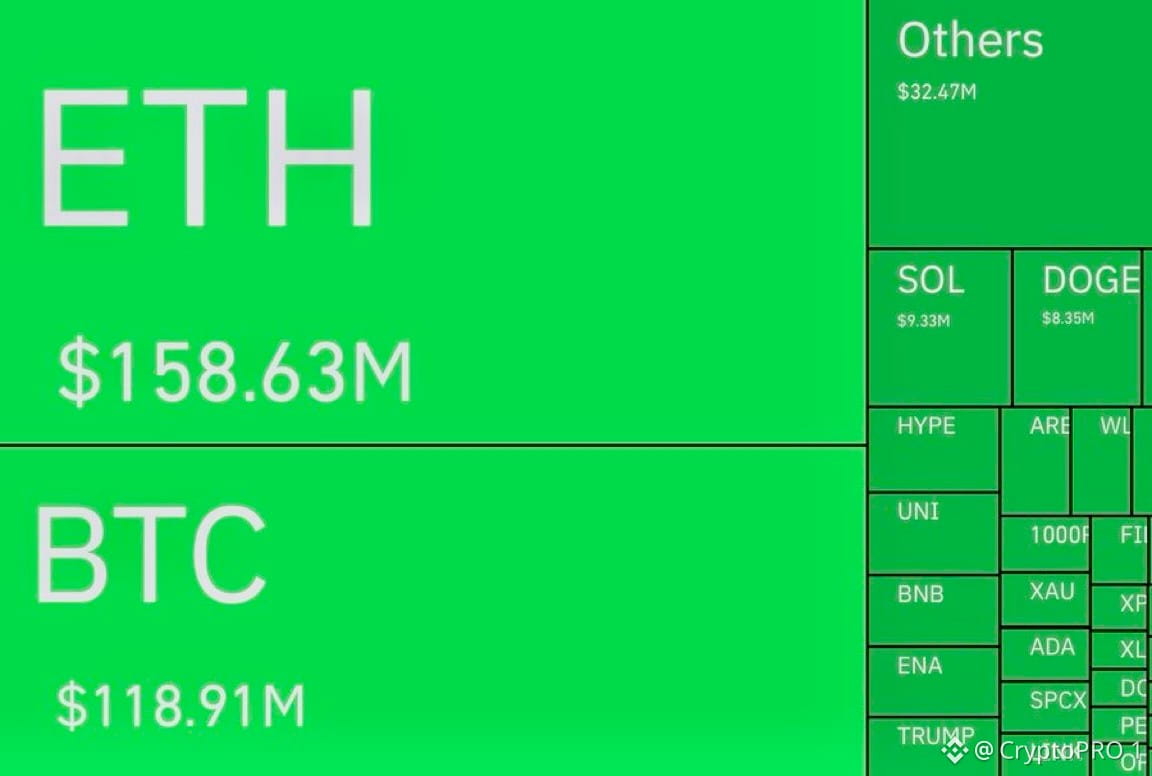
Over $400M in crypto longs wiped out in the past hour. $11.79M in shorts were also liquidated, taking total liquidations to $412.62M. Longs made up more than 97% of the wipeout. Leverage just got punished hard. $BTC $ETH
Over $400M in crypto longs wiped out in the past hour. $11.79M in shorts were also liquidated, taking total liquidations to $412.62M. Longs made up more than 97% of the wipeout. Leverage just got punished hard. $BTC $ETH
51
·
--
Bitcoin $BTC just got rejected from $87K again. We’ve now seen multiple attempts at that level over the past few weeks, and every time sellers have stepped in. BTC is now back around $84K, so I’m watching the $83.5K area pretty closely. That’s the level I’d want to see hold if this is just another pullback within the current range. The bigger level for me is still $79.5K. As long as Bitcoin stays above that breakout area, I don’t think the broader structure has been seriously damaged. If we finally get a clean break and hold above $87K, I think the picture changes pretty quickly.
Bitcoin $BTC just got rejected from $87K again. We’ve now seen multiple attempts at that level over the past few weeks, and every time sellers have stepped in. BTC is now back around $84K, so I’m watching the $83.5K area pretty closely. That’s the level I’d want to see hold if this is just another pullback within the current range. The bigger level for me is still $79.5K. As long as Bitcoin stays above that breakout area, I don’t think the broader structure has been seriously damaged. If we finally get a clean break and hold above $87K, I think the picture changes pretty quickly.
70
Log in to explore more content
Join global crypto users on Binance Square
⚡️ Get latest and useful information about crypto.
💬 Trusted by the world’s largest crypto exchange.
👍 Discover real insights from verified creators.
Email / Phone number