

Arxionlabs
3 Posts

Arxionlabs
Report
Block User
Volume anomaly data. Over 261,000 spikes across 484 coins since late May, and what price did next, losses included. Find us on X: Arxionlabs
4 Following
1 Followers
1 Liked
Posts
·
--
#ChainlinkLaunchesCCIP2WithEnterpriseVerification
Most of this topic is about what CCIP 2.0 does. We looked at what the $LINK tape did with it.
The announcement hour on Sep 28 (12:00 UTC) traded $20.5M of $LINK on Binance spot, about 14x a normal hour over the previous two days. LINK closed the day at $15.45, up 10.2%, while BTC closed down 1.2%. The whole day traded $126M, against a median of ~$31M over the previous 20 days.
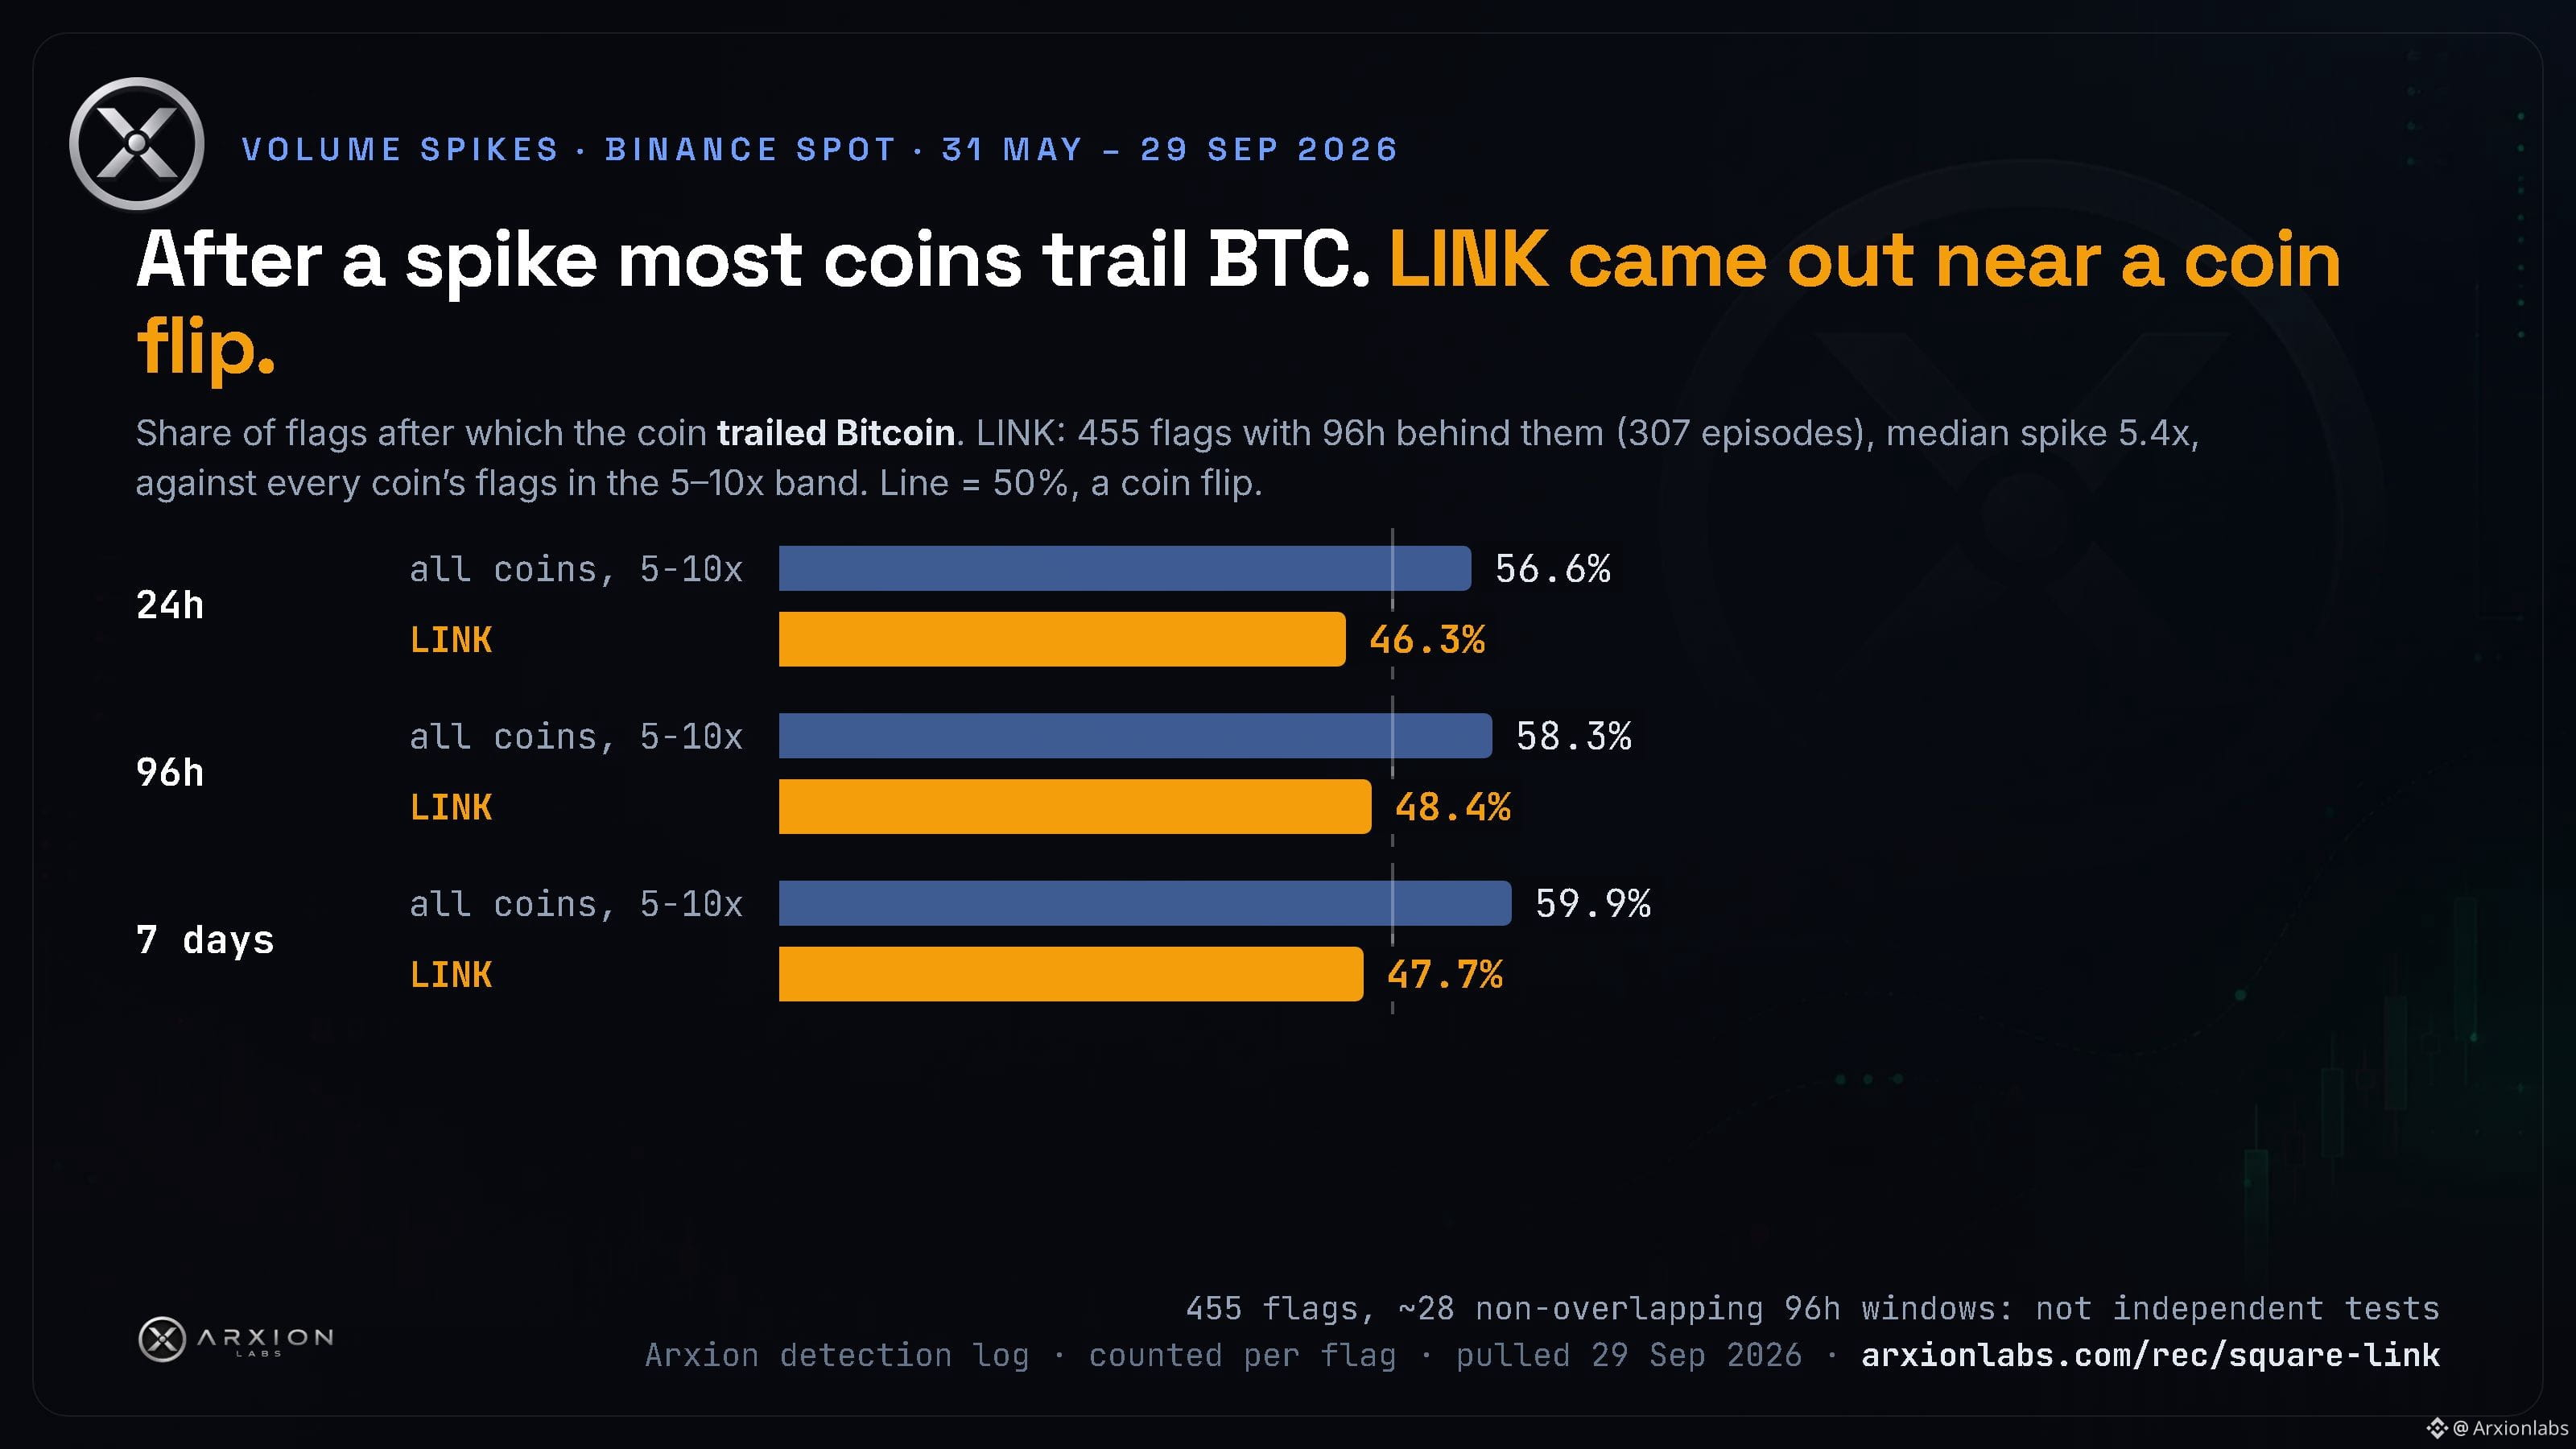
The part we find more interesting sits in our volume-spike record. Across all coins, in the 5-10x band where most spikes land, the coin trailed BTC over the next 96 hours after 58.3% of flags. $LINK has been flagged 466 times since late May (median spike 5.4x). Of the 455 with 96 hours behind them, it trailed BTC after 48.4%. Same picture at 24 hours and 7 days.
So on LINK, a volume spike hasn't come with the usual lag behind BTC. It hasn't come with much of a lead either: 48.4% is close to a coin flip. Two things this can't tell you: LINK went from $7.01 in late June to $15.45 on Sep 28, and those flags add up to about 28 non-overlapping 96-hour windows rather than 455 independent tests. And none of it says what the next 96 hours of this move will do.
Our guess is it's mostly the trend. Is there something about LINK itself, or is this just what any coin that doubled would look like? We'd like to hear which you think it is.
#ChainlinkLaunchesCCIP2WithEnterpriseVerification
Most of this topic is about what CCIP 2.0 does. We looked at what the $LINK tape did with it.
The announcement hour on Sep 28 (12:00 UTC) traded $20.5M of $LINK on Binance spot, about 14x a normal hour over the previous two days. LINK closed the day at $15.45, up 10.2%, while BTC closed down 1.2%. The whole day traded $126M, against a median of ~$31M over the previous 20 days.
The part we find more interesting sits in our volume-spike record. Across all coins, in the 5-10x band where most spikes land, the coin trailed BTC over the next 96 hours after 58.3% of flags. $LINK has been flagged 466 times since late May (median spike 5.4x). Of the 455 with 96 hours behind them, it trailed BTC after 48.4%. Same picture at 24 hours and 7 days.
So on LINK, a volume spike hasn't come with the usual lag behind BTC. It hasn't come with much of a lead either: 48.4% is close to a coin flip. Two things this can't tell you: LINK went from $7.01 in late June to $15.45 on Sep 28, and those flags add up to about 28 non-overlapping 96-hour windows rather than 455 independent tests. And none of it says what the next 96 hours of this move will do.
Our guess is it's mostly the trend. Is there something about LINK itself, or is this just what any coin that doubled would look like? We'd like to hear which you think it is.
Most of this topic is about what CCIP 2.0 does. We looked at what the $LINK tape did with it.
The announcement hour on Sep 28 (12:00 UTC) traded $20.5M of $LINK on Binance spot, about 14x a normal hour over the previous two days. LINK closed the day at $15.45, up 10.2%, while BTC closed down 1.2%. The whole day traded $126M, against a median of ~$31M over the previous 20 days.
The part we find more interesting sits in our volume-spike record. Across all coins, in the 5-10x band where most spikes land, the coin trailed BTC over the next 96 hours after 58.3% of flags. $LINK has been flagged 466 times since late May (median spike 5.4x). Of the 455 with 96 hours behind them, it trailed BTC after 48.4%. Same picture at 24 hours and 7 days.
So on LINK, a volume spike hasn't come with the usual lag behind BTC. It hasn't come with much of a lead either: 48.4% is close to a coin flip. Two things this can't tell you: LINK went from $7.01 in late June to $15.45 on Sep 28, and those flags add up to about 28 non-overlapping 96-hour windows rather than 455 independent tests. And none of it says what the next 96 hours of this move will do.
Our guess is it's mostly the trend. Is there something about LINK itself, or is this just what any coin that doubled would look like? We'd like to hear which you think it is.
1
331
·
--
#QNTFallsOver40%FromMorningHigh
Most of this topic is arguing about why $QNT fell. We checked who was actually selling, and the tape doesn't show a panic.
Binance spot: $QNT traded about $0.7M a day in mid-September (Sep 10-20). Then $210.8M on Sep 27 and $240.4M on Sep 28. Price went from $90 on Sep 25 to $373 late on Sep 27 (UTC), then $195 at the low on Sep 28. That's -47% top to bottom.
In every one of the 11 hours from the top to the low, buyer-initiated volume was between 44% and 58%. The hour that printed $373 was 50/50 too. Sellers didn't rush the door, and price still nearly halved. Our read is that the bids underneath were thin. Tell us if the tape says otherwise to you.
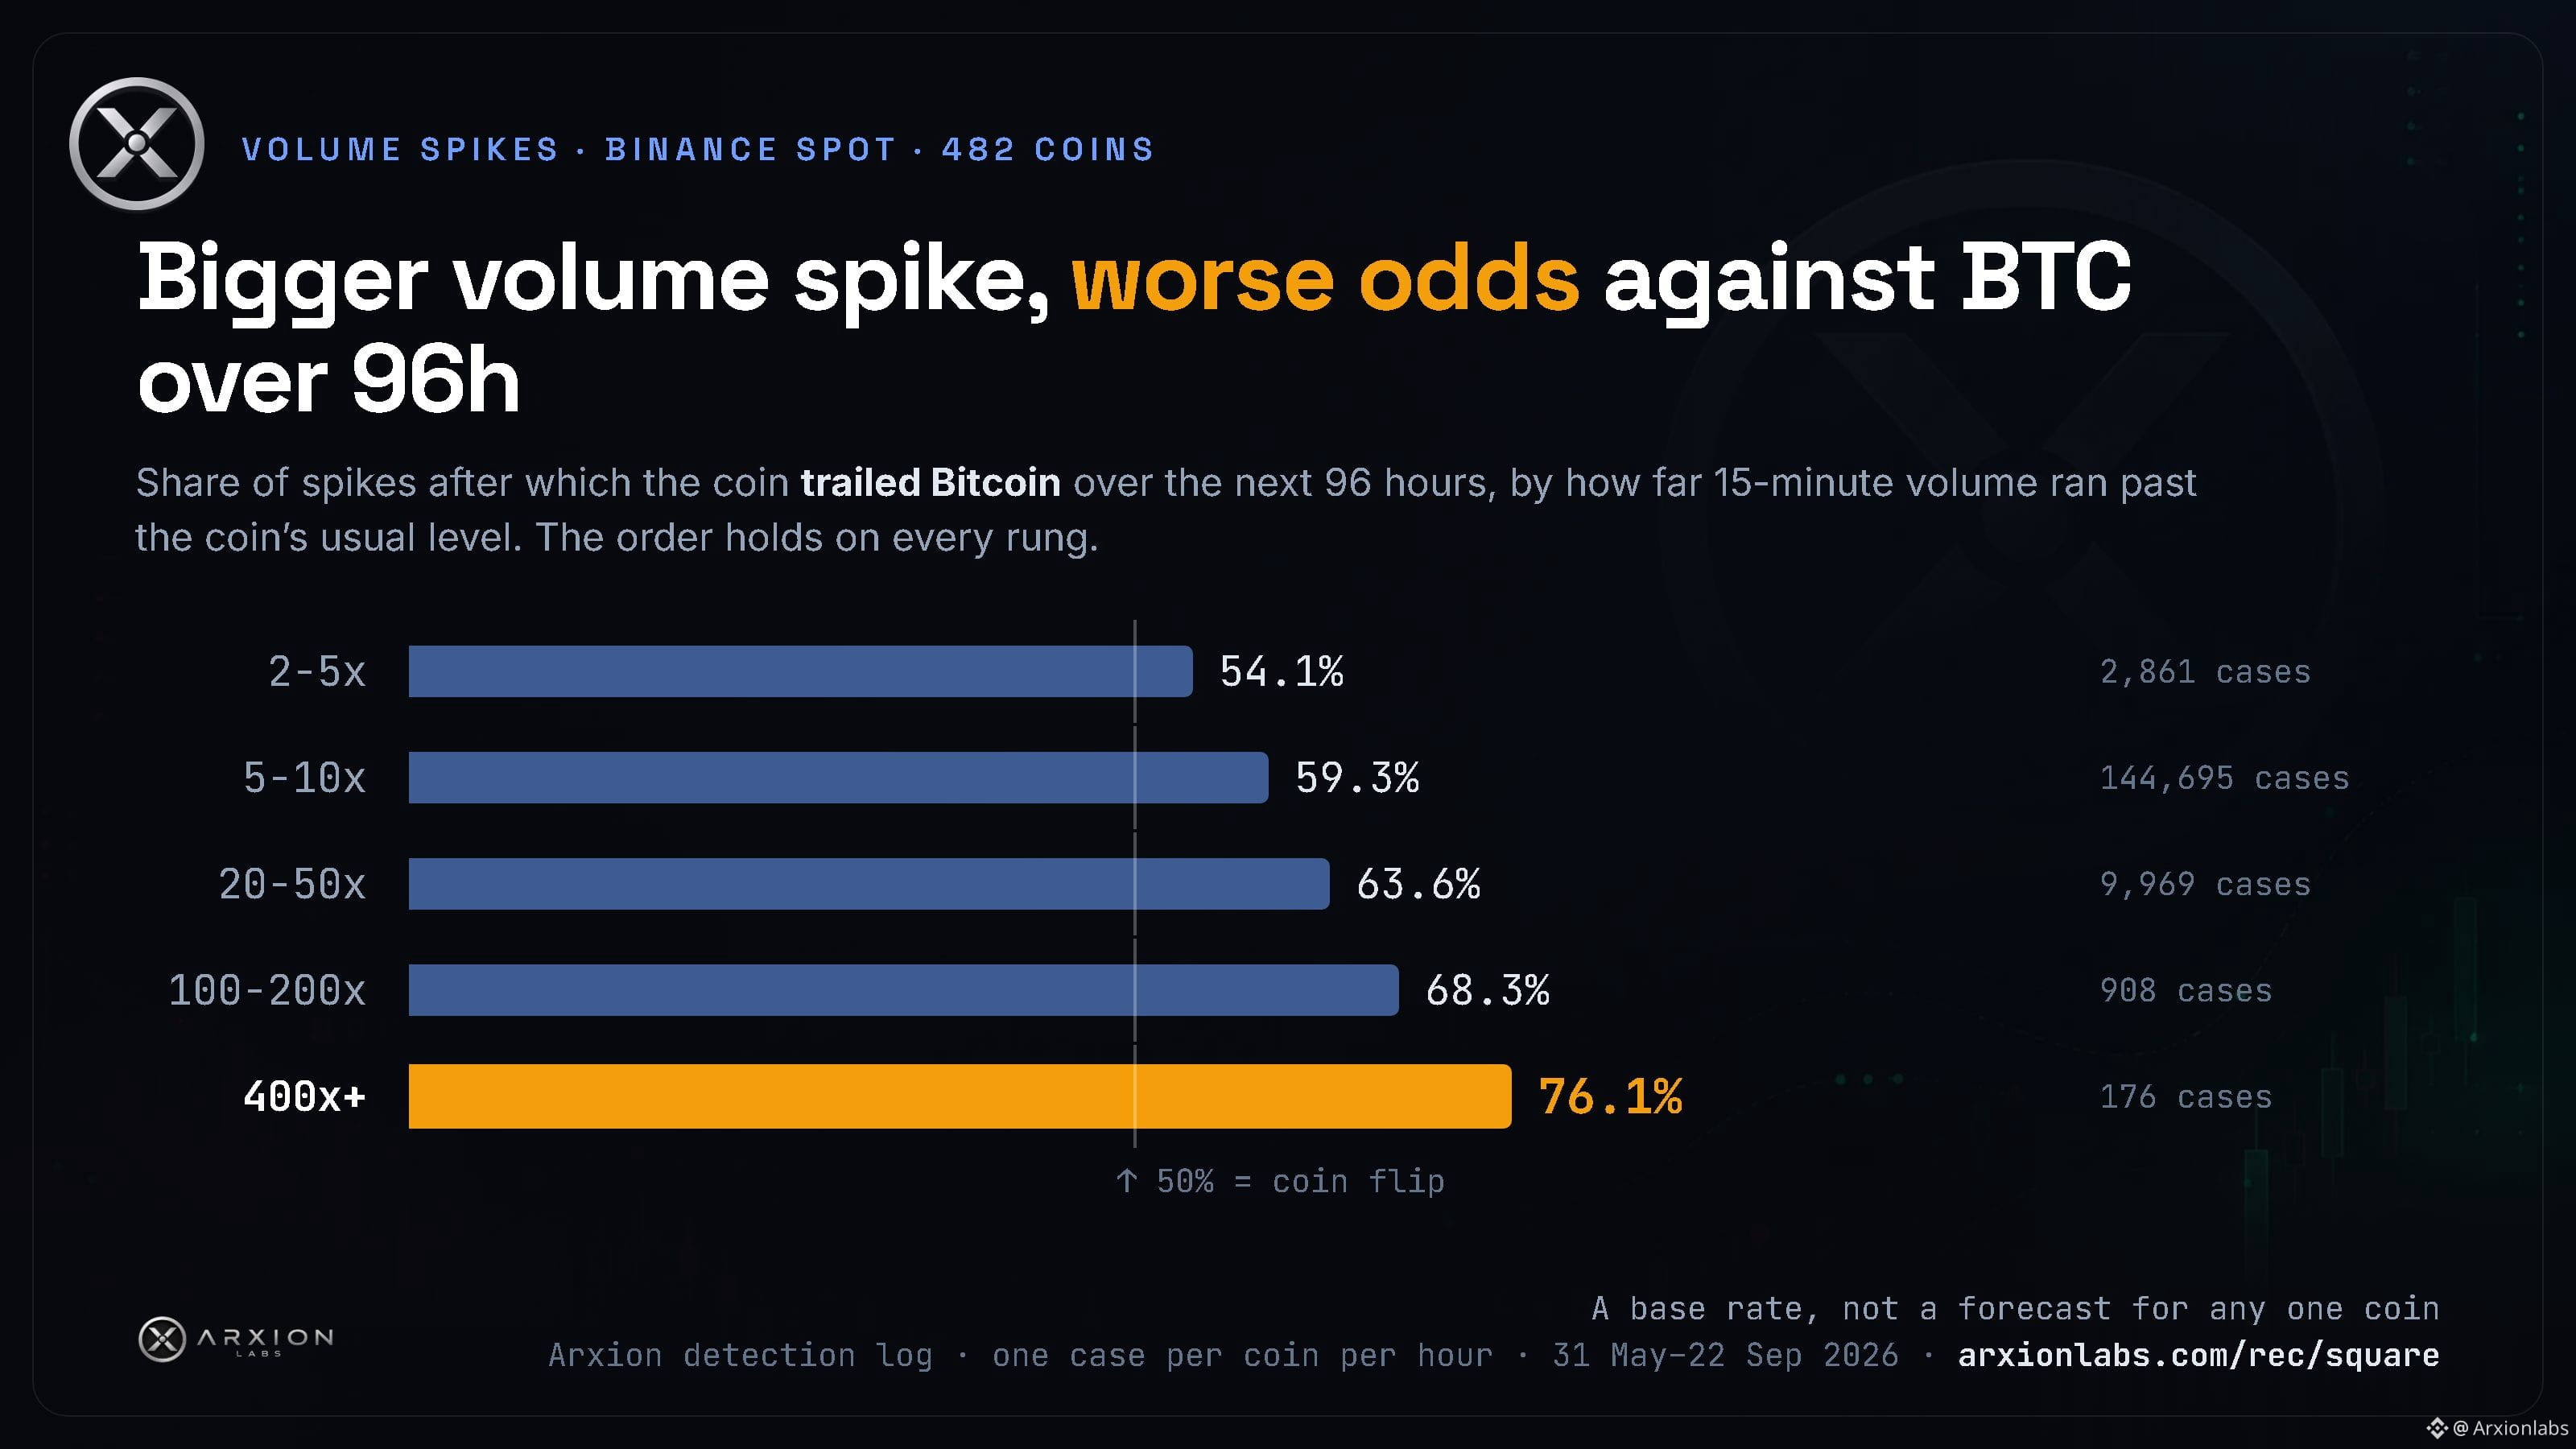
For the bigger picture: we've logged 188,000 volume spikes across 482 coins since late May (one per coin per hour), each measured on a 15-minute bar against that coin's usual level. Share that lagged BTC over the next 96 hours, by spike size:
2-5x: 54.1%
5-10x: 59.3%
20-50x: 63.6%
100-200x: 68.3%
400x+: 76.1% (176 cases)
All eight size bands (five shown here), each worse than the one below it.
What this can't tell you: $QNT's move had real news behind it (The Clearing House deal). Our record doesn't separate news-driven spikes from the rest. If you think news spikes play by different rules, that's the argument worth having.
#QNTFallsOver40%FromMorningHigh
Most of this topic is arguing about why $QNT fell. We checked who was actually selling, and the tape doesn't show a panic.
Binance spot: $QNT traded about $0.7M a day in mid-September (Sep 10-20). Then $210.8M on Sep 27 and $240.4M on Sep 28. Price went from $90 on Sep 25 to $373 late on Sep 27 (UTC), then $195 at the low on Sep 28. That's -47% top to bottom.
In every one of the 11 hours from the top to the low, buyer-initiated volume was between 44% and 58%. The hour that printed $373 was 50/50 too. Sellers didn't rush the door, and price still nearly halved. Our read is that the bids underneath were thin. Tell us if the tape says otherwise to you.
For the bigger picture: we've logged 188,000 volume spikes across 482 coins since late May (one per coin per hour), each measured on a 15-minute bar against that coin's usual level. Share that lagged BTC over the next 96 hours, by spike size:
2-5x: 54.1%
5-10x: 59.3%
20-50x: 63.6%
100-200x: 68.3%
400x+: 76.1% (176 cases)
All eight size bands (five shown here), each worse than the one below it.
What this can't tell you: $QNT 's move had real news behind it (The Clearing House deal). Our record doesn't separate news-driven spikes from the rest. If you think news spikes play by different rules, that's the argument worth having.
Most of this topic is arguing about why $QNT fell. We checked who was actually selling, and the tape doesn't show a panic.
Binance spot: $QNT traded about $0.7M a day in mid-September (Sep 10-20). Then $210.8M on Sep 27 and $240.4M on Sep 28. Price went from $90 on Sep 25 to $373 late on Sep 27 (UTC), then $195 at the low on Sep 28. That's -47% top to bottom.
In every one of the 11 hours from the top to the low, buyer-initiated volume was between 44% and 58%. The hour that printed $373 was 50/50 too. Sellers didn't rush the door, and price still nearly halved. Our read is that the bids underneath were thin. Tell us if the tape says otherwise to you.
For the bigger picture: we've logged 188,000 volume spikes across 482 coins since late May (one per coin per hour), each measured on a 15-minute bar against that coin's usual level. Share that lagged BTC over the next 96 hours, by spike size:
2-5x: 54.1%
5-10x: 59.3%
20-50x: 63.6%
100-200x: 68.3%
400x+: 76.1% (176 cases)
All eight size bands (five shown here), each worse than the one below it.
What this can't tell you: $QNT 's move had real news behind it (The Clearing House deal). Our record doesn't separate news-driven spikes from the rest. If you think news spikes play by different rules, that's the argument worth having.
387
Log in to explore more content
Join global crypto users on Binance Square
⚡️ Get latest and useful information about crypto.
💬 Trusted by the world’s largest crypto exchange.
👍 Discover real insights from verified creators.
Email / Phone number
Trending Topics
BitcoinClears$85200
1,066 views
77 Discussing
We got the move, and $BTC is standing exactly where we were before the data. That’s what actual patience for a trade looks like.
The data came in mixed but with some important numbers. ADP Non-Farm Employment Change came at 90K vs 73K forecast, while Core PCE came in at 0.2% vs 0.3% expected. Final GDP was also stronger at 2.2% vs 1.5% forecast, while Personal Spending came in at 0.9% vs 0.8% expected. At the same time, Personal Income missed at 0.2% vs 0.5% forecast.
BTC initially surged to $85,600 and is now back where it needs to be. I’m still looking toward the lower ranges at $82,759 and the $80,000 liquidity, because the overhead liquidity is done and dusted.
We had a live session during the data, and during that session we saw the market at $83,800, then $85,600, and then back toward $83,000 and we still didn’t enter a trade.
That’s what patience is.
We can’t force an entry when the market has no clear direction. The same range is still in focus, and we’ll wait for the market to give us the setup.
Let me know, guys, how was the session? And should we have more regular sessions with our respected members so we can have proper discussions regarding the market?
#BitcoinClears$85200 #AltcoinSeasonIndexHoldsAbove60For5Days #USADPAdds90000JobsInSeptember #BitcoinSlipsBelow$84000 #SECToClarifyOnChainFundraisingRules
Crypto_LUX
·16 Likes
·4.2k views
AltcoinSeasonIndexHoldsAbove60For5Days
9,616 views
497 Discussing
USADPAdds90000JobsInSeptember
2,717 views
234 Discussing