

Anwar156
927 Posts

Anwar156
Report
Block User
High-Frequency Trader
2.3 Years
3 Following
265 Followers
1.7K+ Liked
Posts
All
Quotes
PINNED
·
--
🚨 guys the $EDEN token unlock schedule just dropped and this is the most important warning I can give you about this coin right now
I shorted EDEN at RSI 95 and closed +472% profit — then it pumped again and I warned you about the second pump — now this unlock data explains exactly why I will never hold EDEN long
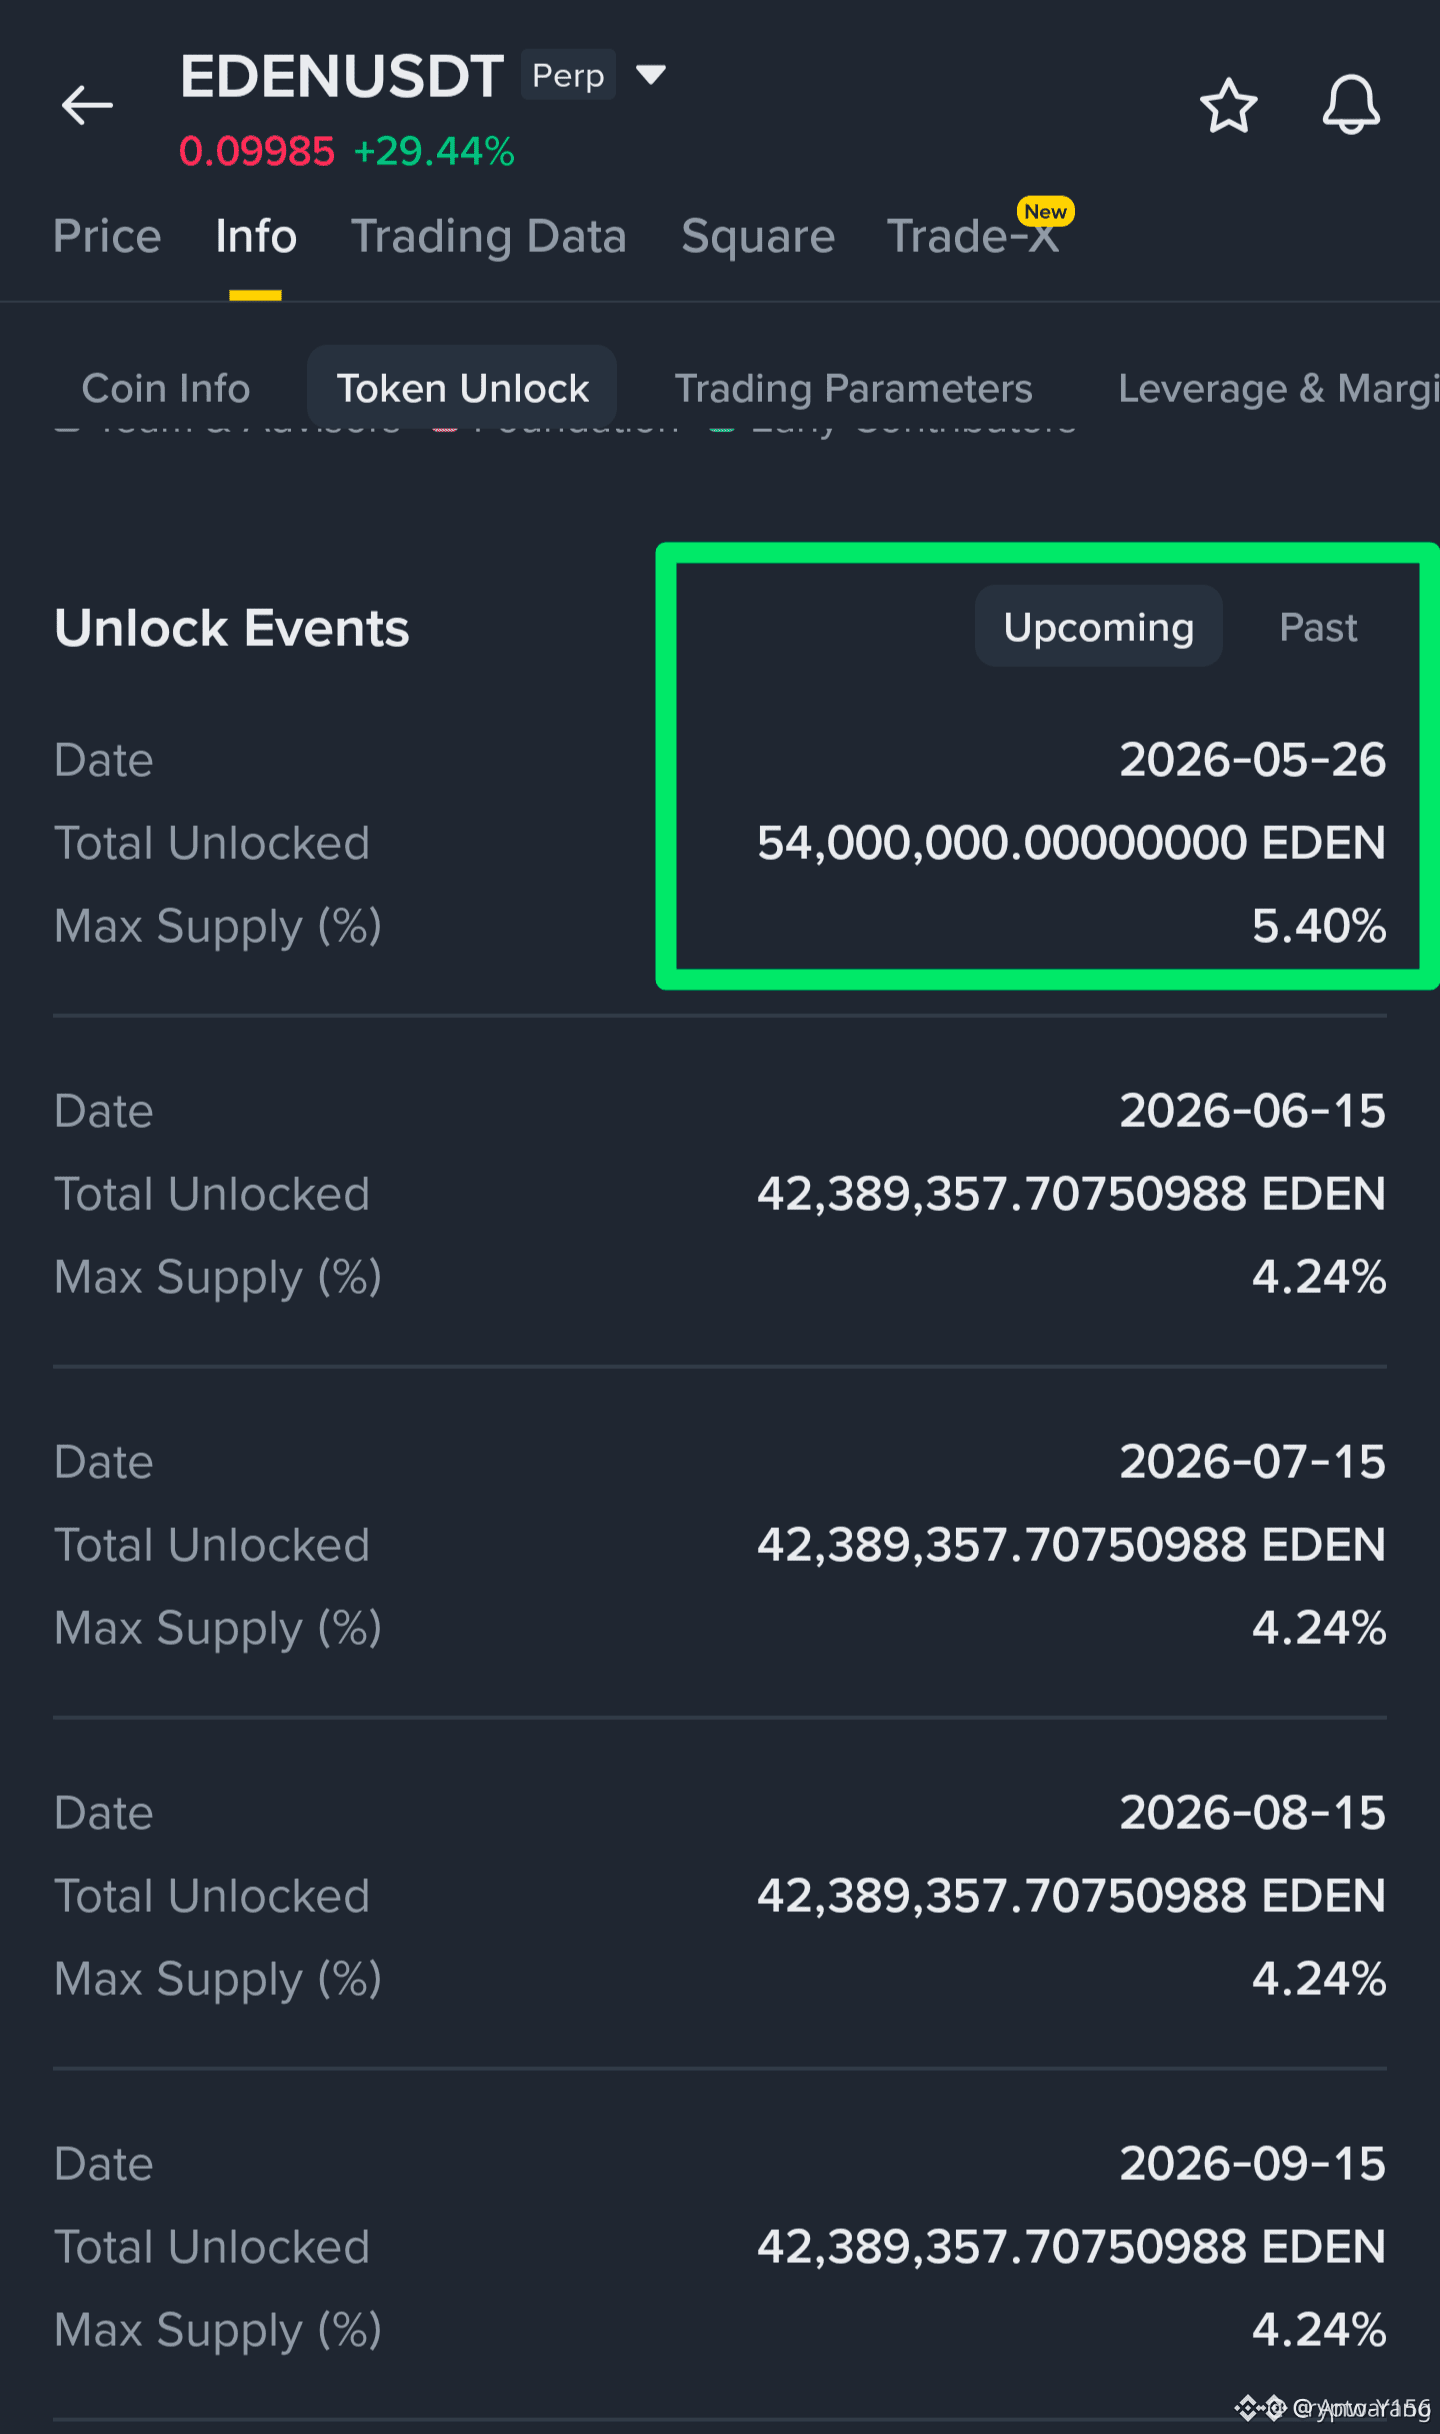
54 million EDEN tokens unlock on 2026-05-26 — that is in 5 days — representing 5.40% of the entire max supply hitting the market at once
I have seen this exact thing before and every single time it ended the same way — a coin pumps before an unlock event to maximize the value of the tokens about to be released then the moment those tokens hit circulation the team advisors and early contributors dump immediately into every buyer who chased the pump
and it does not stop there — after the May 26 unlock $EDEN has another 42.3 million unlocking on June 15 — then another 42.3 million on July 15 — then August 15 — then September 15 — 4.24% of supply hitting the market every single month for the rest of the year
this is a continuous sell pressure machine — every month new supply — every month the same early wallets offloading into retail buyers who think they are buying a recovery
current price is 0.09985 up +29% today — that pump is the team maximizing exit value before May 26 — I have seen this playbook on every unlock event I have ever tracked
so guys knowing 54 million tokens unlock in 5 days does this look like a buying opportunity to you or does the unlock schedule tell you exactly what happens next 😡
$TAG
🚨 guys the $EDEN token unlock schedule just dropped and this is the most important warning I can give you about this coin right now
I shorted EDEN at RSI 95 and closed +472% profit — then it pumped again and I warned you about the second pump — now this unlock data explains exactly why I will never hold EDEN long
54 million EDEN tokens unlock on 2026-05-26 — that is in 5 days — representing 5.40% of the entire max supply hitting the market at once
I have seen this exact thing before and every single time it ended the same way — a coin pumps before an unlock event to maximize the value of the tokens about to be released then the moment those tokens hit circulation the team advisors and early contributors dump immediately into every buyer who chased the pump
and it does not stop there — after the May 26 unlock $EDEN has another 42.3 million unlocking on June 15 — then another 42.3 million on July 15 — then August 15 — then September 15 — 4.24% of supply hitting the market every single month for the rest of the year
this is a continuous sell pressure machine — every month new supply — every month the same early wallets offloading into retail buyers who think they are buying a recovery
current price is 0.09985 up +29% today — that pump is the team maximizing exit value before May 26 — I have seen this playbook on every unlock event I have ever tracked
so guys knowing 54 million tokens unlock in 5 days does this look like a buying opportunity to you or does the unlock schedule tell you exactly what happens next 😡
$TAG
I shorted EDEN at RSI 95 and closed +472% profit — then it pumped again and I warned you about the second pump — now this unlock data explains exactly why I will never hold EDEN long
54 million EDEN tokens unlock on 2026-05-26 — that is in 5 days — representing 5.40% of the entire max supply hitting the market at once
I have seen this exact thing before and every single time it ended the same way — a coin pumps before an unlock event to maximize the value of the tokens about to be released then the moment those tokens hit circulation the team advisors and early contributors dump immediately into every buyer who chased the pump
and it does not stop there — after the May 26 unlock $EDEN has another 42.3 million unlocking on June 15 — then another 42.3 million on July 15 — then August 15 — then September 15 — 4.24% of supply hitting the market every single month for the rest of the year
this is a continuous sell pressure machine — every month new supply — every month the same early wallets offloading into retail buyers who think they are buying a recovery
current price is 0.09985 up +29% today — that pump is the team maximizing exit value before May 26 — I have seen this playbook on every unlock event I have ever tracked
so guys knowing 54 million tokens unlock in 5 days does this look like a buying opportunity to you or does the unlock schedule tell you exactly what happens next 😡
$TAG
63
6
129
281.6k
PINNED
·
--
⚠️ guys the $EDEN trading data just showed me something that completely explains this +31% pump today and I need you to understand what is actually happening
I closed my EDEN short at +472% profit two days ago — and now the same coin is pumping again with data that tells me exactly why
I have seen this exact thing before and every single time it ended the same way — a coin gets shorted heavily after a pump the shorts take profit the short ratio flips to majority long and then the same wallets that pumped it the first time pump it again to squeeze whoever reshorted
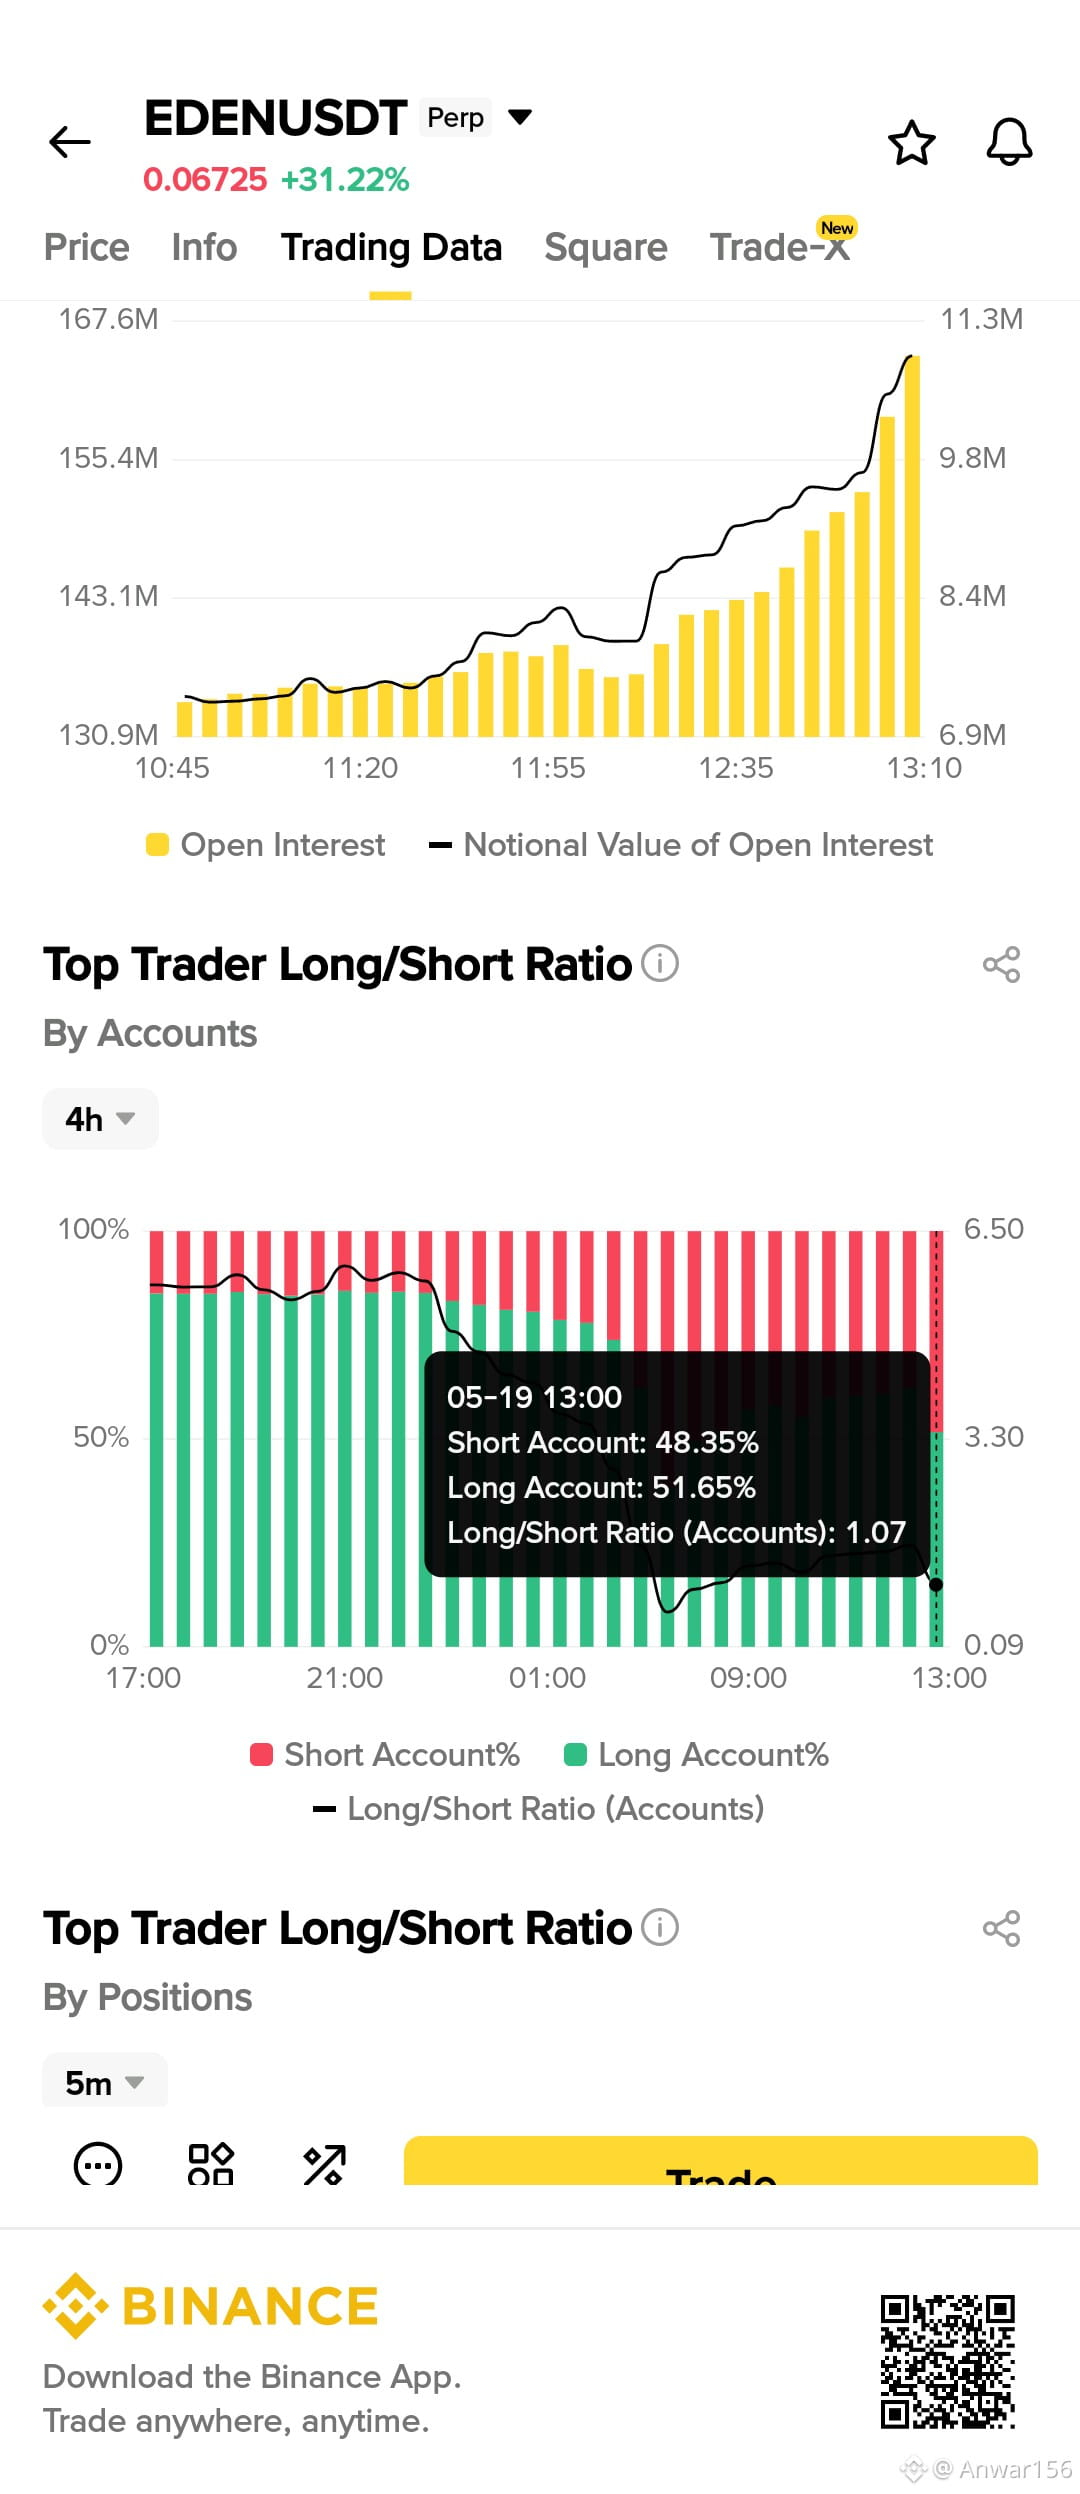
look at this data — long accounts now at 51.65% short accounts at 48.35% — long/short ratio flipped to 1.07 — the shorts are no longer in control of #EDEN
but here is the number that matters most — open interest exploded from 130.9M all the way to 167.6M in less than 3 hours — notional value jumping from 6.9M to 11.3M in the same window — that is massive new money entering this coin right now
when open interest rises this fast while price pumps +31% and the ratio flips to more longs than shorts it means one thing — a short squeeze is actively happening and it is not done yet
I took my profit at +472% and stepped away — the data now is telling me a second pump loaded while I was watching the B trade
so guys — do you think EDEN has another leg up with open interest at 167M and longs taking control or is this the second trap before another dump 👀
⚠️ guys the $EDEN trading data just showed me something that completely explains this +31% pump today and I need you to understand what is actually happening
I closed my EDEN short at +472% profit two days ago — and now the same coin is pumping again with data that tells me exactly why
I have seen this exact thing before and every single time it ended the same way — a coin gets shorted heavily after a pump the shorts take profit the short ratio flips to majority long and then the same wallets that pumped it the first time pump it again to squeeze whoever reshorted
look at this data — long accounts now at 51.65% short accounts at 48.35% — long/short ratio flipped to 1.07 — the shorts are no longer in control of #EDEN
but here is the number that matters most — open interest exploded from 130.9M all the way to 167.6M in less than 3 hours — notional value jumping from 6.9M to 11.3M in the same window — that is massive new money entering this coin right now
when open interest rises this fast while price pumps +31% and the ratio flips to more longs than shorts it means one thing — a short squeeze is actively happening and it is not done yet
I took my profit at +472% and stepped away — the data now is telling me a second pump loaded while I was watching the B trade
so guys — do you think EDEN has another leg up with open interest at 167M and longs taking control or is this the second trap before another dump 👀
I closed my EDEN short at +472% profit two days ago — and now the same coin is pumping again with data that tells me exactly why
I have seen this exact thing before and every single time it ended the same way — a coin gets shorted heavily after a pump the shorts take profit the short ratio flips to majority long and then the same wallets that pumped it the first time pump it again to squeeze whoever reshorted
look at this data — long accounts now at 51.65% short accounts at 48.35% — long/short ratio flipped to 1.07 — the shorts are no longer in control of #EDEN
but here is the number that matters most — open interest exploded from 130.9M all the way to 167.6M in less than 3 hours — notional value jumping from 6.9M to 11.3M in the same window — that is massive new money entering this coin right now
when open interest rises this fast while price pumps +31% and the ratio flips to more longs than shorts it means one thing — a short squeeze is actively happening and it is not done yet
I took my profit at +472% and stepped away — the data now is telling me a second pump loaded while I was watching the B trade
so guys — do you think EDEN has another leg up with open interest at 167M and longs taking control or is this the second trap before another dump 👀
17
1
11
5.9k
·
--
Good night everyone 😴
Something interesting is happening with $BR spot supply. 👀
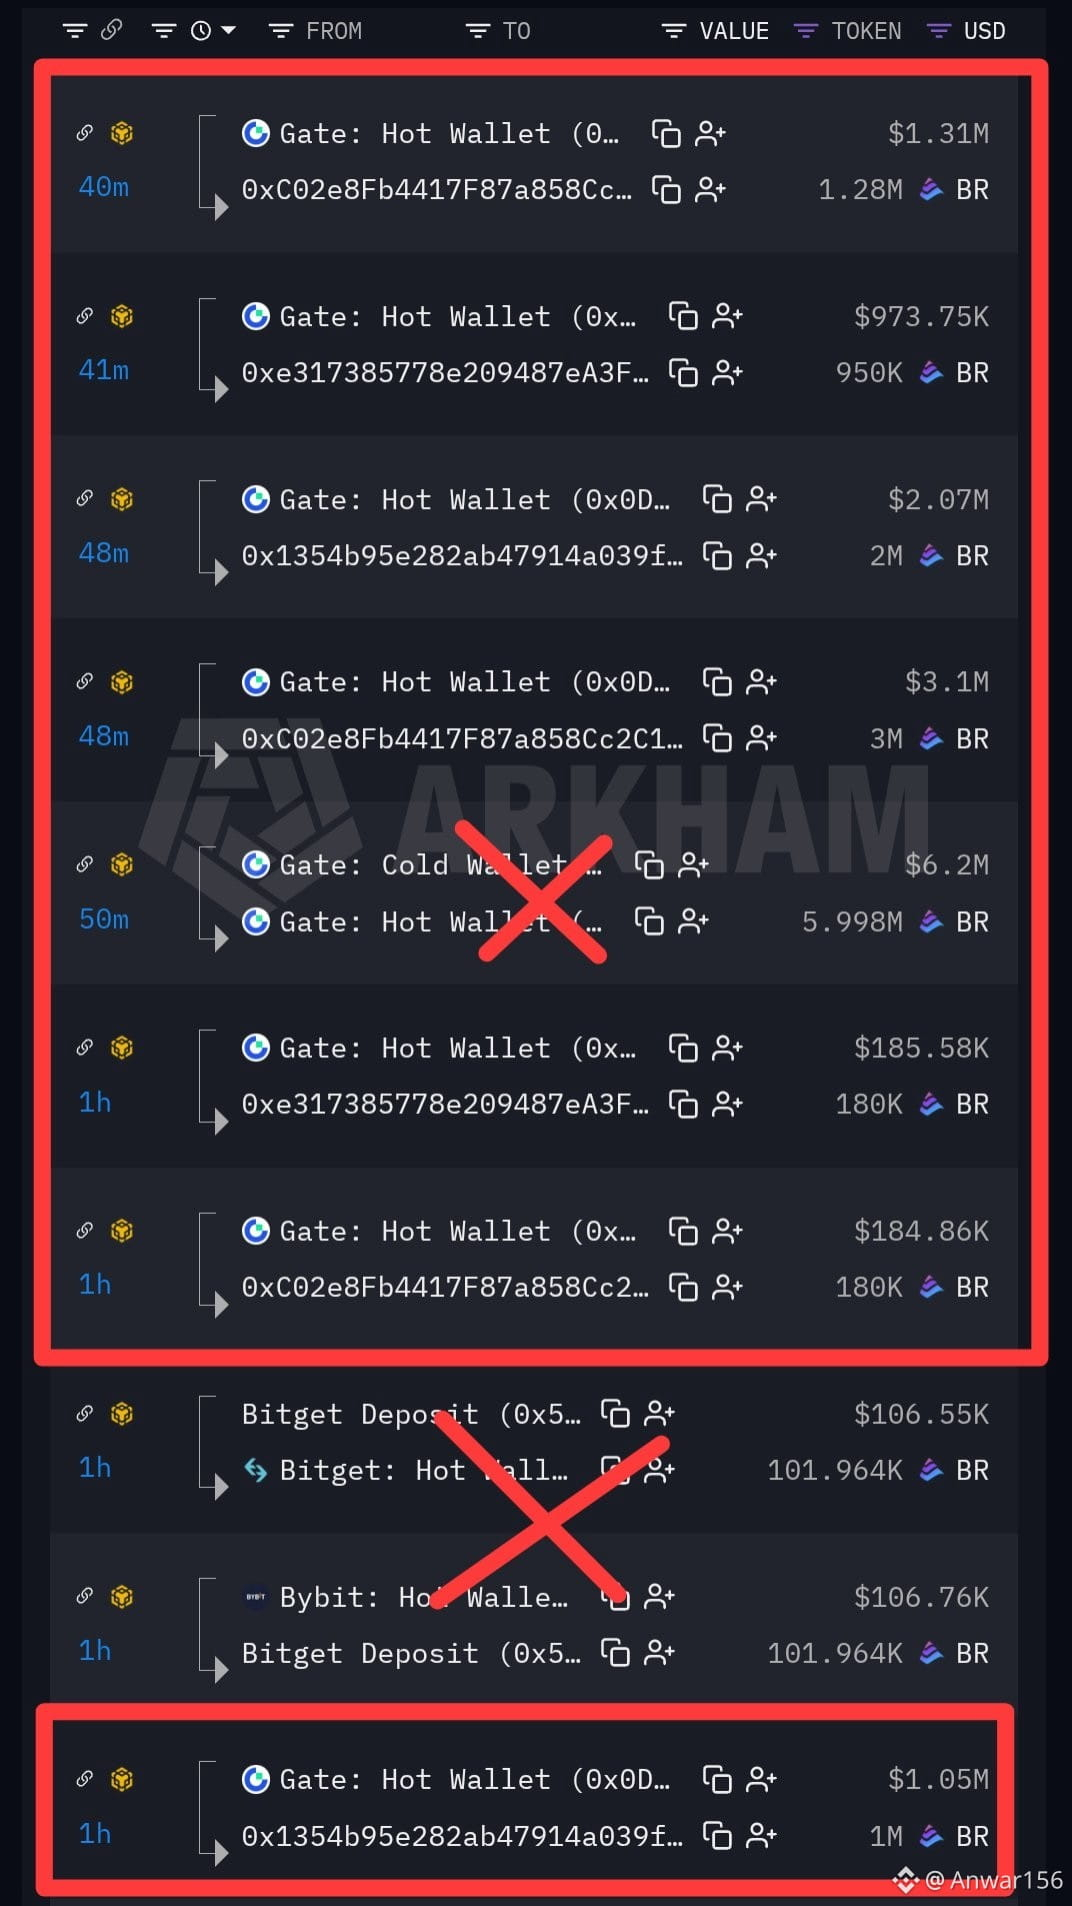
Another 8.59M BR (~$8.9M) has just been withdrawn from Gate in under an hour.
That brings the total withdrawals to 9.8M+ BR — over $10M — within roughly two hours.
But there’s another detail worth watching:
At nearly the same time, Gate was moving BR from cold storage back into its hot wallet.
So while a large amount of BR is leaving the exchange, Gate is also replenishing its active wallet.
Why is this important?
If these withdrawn tokens remain outside exchanges, the amount of readily available $BR supply on exchanges continues to shrink.
At the same time, retail positioning remains heavily short.
My key level now is 0.9. 👀
If $BR can hold 0.9 while exchange balances continue falling, I’ll be watching the upside much more closely.
The withdrawals themselves aren't enough to confirm anything.
The real confirmation will come from how price reacts. 📊
{future}(BRUSDT)
Good night everyone 😴
Something interesting is happening with $BR spot supply. 👀
Another 8.59M BR (~$8.9M) has just been withdrawn from Gate in under an hour.
That brings the total withdrawals to 9.8M+ BR — over $10M — within roughly two hours.
But there’s another detail worth watching:
At nearly the same time, Gate was moving BR from cold storage back into its hot wallet.
So while a large amount of BR is leaving the exchange, Gate is also replenishing its active wallet.
Why is this important?
If these withdrawn tokens remain outside exchanges, the amount of readily available $BR supply on exchanges continues to shrink.
At the same time, retail positioning remains heavily short.
My key level now is 0.9. 👀
If $BR can hold 0.9 while exchange balances continue falling, I’ll be watching the upside much more closely.
The withdrawals themselves aren't enough to confirm anything.
The real confirmation will come from how price reacts. 📊
Something interesting is happening with $BR spot supply. 👀
Another 8.59M BR (~$8.9M) has just been withdrawn from Gate in under an hour.
That brings the total withdrawals to 9.8M+ BR — over $10M — within roughly two hours.
But there’s another detail worth watching:
At nearly the same time, Gate was moving BR from cold storage back into its hot wallet.
So while a large amount of BR is leaving the exchange, Gate is also replenishing its active wallet.
Why is this important?
If these withdrawn tokens remain outside exchanges, the amount of readily available $BR supply on exchanges continues to shrink.
At the same time, retail positioning remains heavily short.
My key level now is 0.9. 👀
If $BR can hold 0.9 while exchange balances continue falling, I’ll be watching the upside much more closely.
The withdrawals themselves aren't enough to confirm anything.
The real confirmation will come from how price reacts. 📊
3
528
·
--
Bearish
Partly True
An automated MEV bot just churned over 9.4 Million $MARSCOIN ($1.15M) across PancakeSwap V2 and V3 in a single block.
4 hours ago, a fresh 1.733M $MARSCOIN ($213K) was routed through deposit addresses into Binance’s active Hot Wallet.
That exchange injection instantly knocked spot prices out of sync with decentralized liquidity pools.
Arb contract 0x77fFC... struck immediately 3 hours ago, rotating back-to-back 2.2M to 2.5M token clips between PancakeSwap V2 and V3 to equalize the pool depth.
When MEV bots rotate over $1.15M in $MARSCOIN across PancakeSwap pools, local liquidity is getting stretched thin.
An automated MEV bot just churned over 9.4 Million $MARSCOIN ($1.15M) across PancakeSwap V2 and V3 in a single block.
4 hours ago, a fresh 1.733M $MARSCOIN ($213K) was routed through deposit addresses into Binance’s active Hot Wallet.
That exchange injection instantly knocked spot prices out of sync with decentralized liquidity pools.
Arb contract 0x77fFC... struck immediately 3 hours ago, rotating back-to-back 2.2M to 2.5M token clips between PancakeSwap V2 and V3 to equalize the pool depth.
When MEV bots rotate over $1.15M in $MARSCOIN across PancakeSwap pools, local liquidity is getting stretched thin.
4 hours ago, a fresh 1.733M $MARSCOIN ($213K) was routed through deposit addresses into Binance’s active Hot Wallet.
That exchange injection instantly knocked spot prices out of sync with decentralized liquidity pools.
Arb contract 0x77fFC... struck immediately 3 hours ago, rotating back-to-back 2.2M to 2.5M token clips between PancakeSwap V2 and V3 to equalize the pool depth.
When MEV bots rotate over $1.15M in $MARSCOIN across PancakeSwap pools, local liquidity is getting stretched thin.
3
683
·
--
🚨 A $3.14 Million $LSK Supply Wall Just Hit OKX
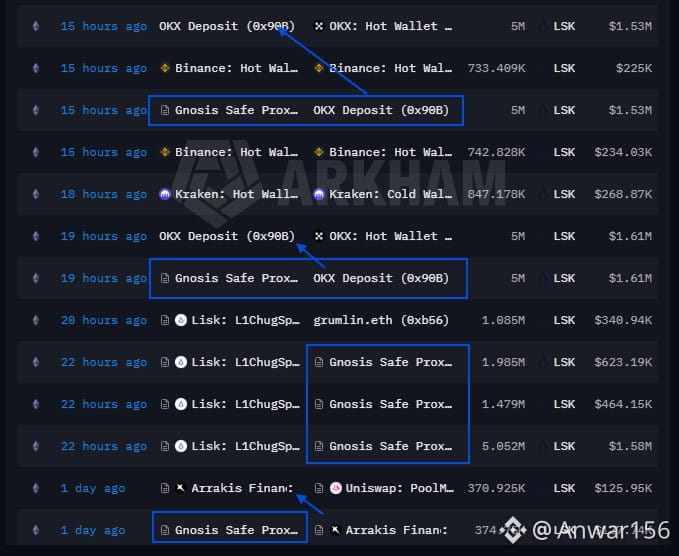
An insider-linked Gnosis Safe Proxy appears to be moving millions of LSK across CEX and DeFi liquidity venues.
1 day ago, 374K LSK was routed to Arrakis Finance for Uniswap liquidity management.
Then, 22 hours ago, 8.51 Million LSK ($2.66M) moved through the Lisk L1ChugSplashProxy contract in three major tranches.
The biggest warning came next:
Two consecutive 5 Million LSK transfers were sent directly to OKX.
That’s 10 Million $LSK ($3.14M) moved into active hot wallets within just 4 hours.
When price pushes higher while a multi-million-dollar CEX deposit is waiting above, the liquidation risk can build quickly.
Keep an eye on the OKX wall and how $LSK reacts around these levels. 📉
NFA. DYOR.
{future}(LSKUSDT)
🚨 A $3.14 Million $LSK Supply Wall Just Hit OKX
An insider-linked Gnosis Safe Proxy appears to be moving millions of LSK across CEX and DeFi liquidity venues.
1 day ago, 374K LSK was routed to Arrakis Finance for Uniswap liquidity management.
Then, 22 hours ago, 8.51 Million LSK ($2.66M) moved through the Lisk L1ChugSplashProxy contract in three major tranches.
The biggest warning came next:
Two consecutive 5 Million LSK transfers were sent directly to OKX.
That’s 10 Million $LSK ($3.14M) moved into active hot wallets within just 4 hours.
When price pushes higher while a multi-million-dollar CEX deposit is waiting above, the liquidation risk can build quickly.
Keep an eye on the OKX wall and how $LSK reacts around these levels. 📉
NFA. DYOR.
An insider-linked Gnosis Safe Proxy appears to be moving millions of LSK across CEX and DeFi liquidity venues.
1 day ago, 374K LSK was routed to Arrakis Finance for Uniswap liquidity management.
Then, 22 hours ago, 8.51 Million LSK ($2.66M) moved through the Lisk L1ChugSplashProxy contract in three major tranches.
The biggest warning came next:
Two consecutive 5 Million LSK transfers were sent directly to OKX.
That’s 10 Million $LSK ($3.14M) moved into active hot wallets within just 4 hours.
When price pushes higher while a multi-million-dollar CEX deposit is waiting above, the liquidation risk can build quickly.
Keep an eye on the OKX wall and how $LSK reacts around these levels. 📉
NFA. DYOR.
1
4
975
·
--
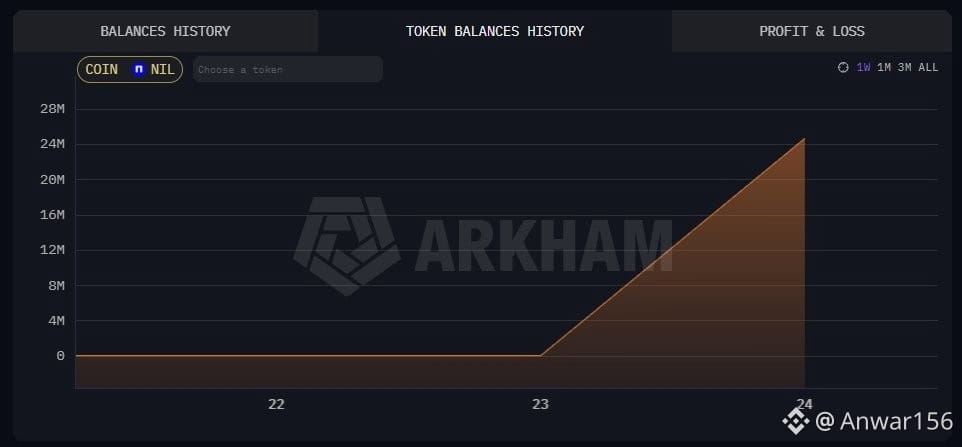
🚨 A Wallet Just Accumulated 24.63M $NIL Ahead of the Unlock
One wallet quietly accumulated $2.89M worth of NIL within just six hours, all sourced from the same exchange.
The wallet received 7 transfers from MEXC’s hot wallet: • 6 transfers of exactly 4M NIL • 1 transfer of 632.656K NIL • Total: 24.63M NIL • Average cost: $0.117
The uniform transfer sizes stand out, and so far, none of the tokens have moved back out.
The wallet now holds 24.63M NIL, currently worth around $3.57M.
Meanwhile, $NIL is trading around $0.14166, up 261% over the past 7 days.
Derivatives positioning is also notable: • Crowd L/S: 0.81 • Big accounts L/S: 1.26 • Taker buying: 1.33
And the timing matters.
NIL’s unlock on September 24 released 19.48M tokens.
This wallet accumulated 24.63M $NIL — roughly 1.26× the unlock amount.
The wallet address is in the quoted post for anyone who wants to keep tracking the flow.
Not financial advice. DYOR.
{future}(NILUSDT)
🚨 A Wallet Just Accumulated 24.63M $NIL Ahead of the Unlock
One wallet quietly accumulated $2.89M worth of NIL within just six hours, all sourced from the same exchange.
The wallet received 7 transfers from MEXC’s hot wallet: • 6 transfers of exactly 4M NIL • 1 transfer of 632.656K NIL • Total: 24.63M NIL • Average cost: $0.117
The uniform transfer sizes stand out, and so far, none of the tokens have moved back out.
The wallet now holds 24.63M NIL, currently worth around $3.57M.
Meanwhile, $NIL is trading around $0.14166, up 261% over the past 7 days.
Derivatives positioning is also notable: • Crowd L/S: 0.81 • Big accounts L/S: 1.26 • Taker buying: 1.33
And the timing matters.
NIL’s unlock on September 24 released 19.48M tokens.
This wallet accumulated 24.63M $NIL — roughly 1.26× the unlock amount.
The wallet address is in the quoted post for anyone who wants to keep tracking the flow.
Not financial advice. DYOR.
One wallet quietly accumulated $2.89M worth of NIL within just six hours, all sourced from the same exchange.
The wallet received 7 transfers from MEXC’s hot wallet: • 6 transfers of exactly 4M NIL • 1 transfer of 632.656K NIL • Total: 24.63M NIL • Average cost: $0.117
The uniform transfer sizes stand out, and so far, none of the tokens have moved back out.
The wallet now holds 24.63M NIL, currently worth around $3.57M.
Meanwhile, $NIL is trading around $0.14166, up 261% over the past 7 days.
Derivatives positioning is also notable: • Crowd L/S: 0.81 • Big accounts L/S: 1.26 • Taker buying: 1.33
And the timing matters.
NIL’s unlock on September 24 released 19.48M tokens.
This wallet accumulated 24.63M $NIL — roughly 1.26× the unlock amount.
The wallet address is in the quoted post for anyone who wants to keep tracking the flow.
Not financial advice. DYOR.
2
920
·
--
Bearish
🚨 $AKE On-Chain Selling Pressure Is Still Building
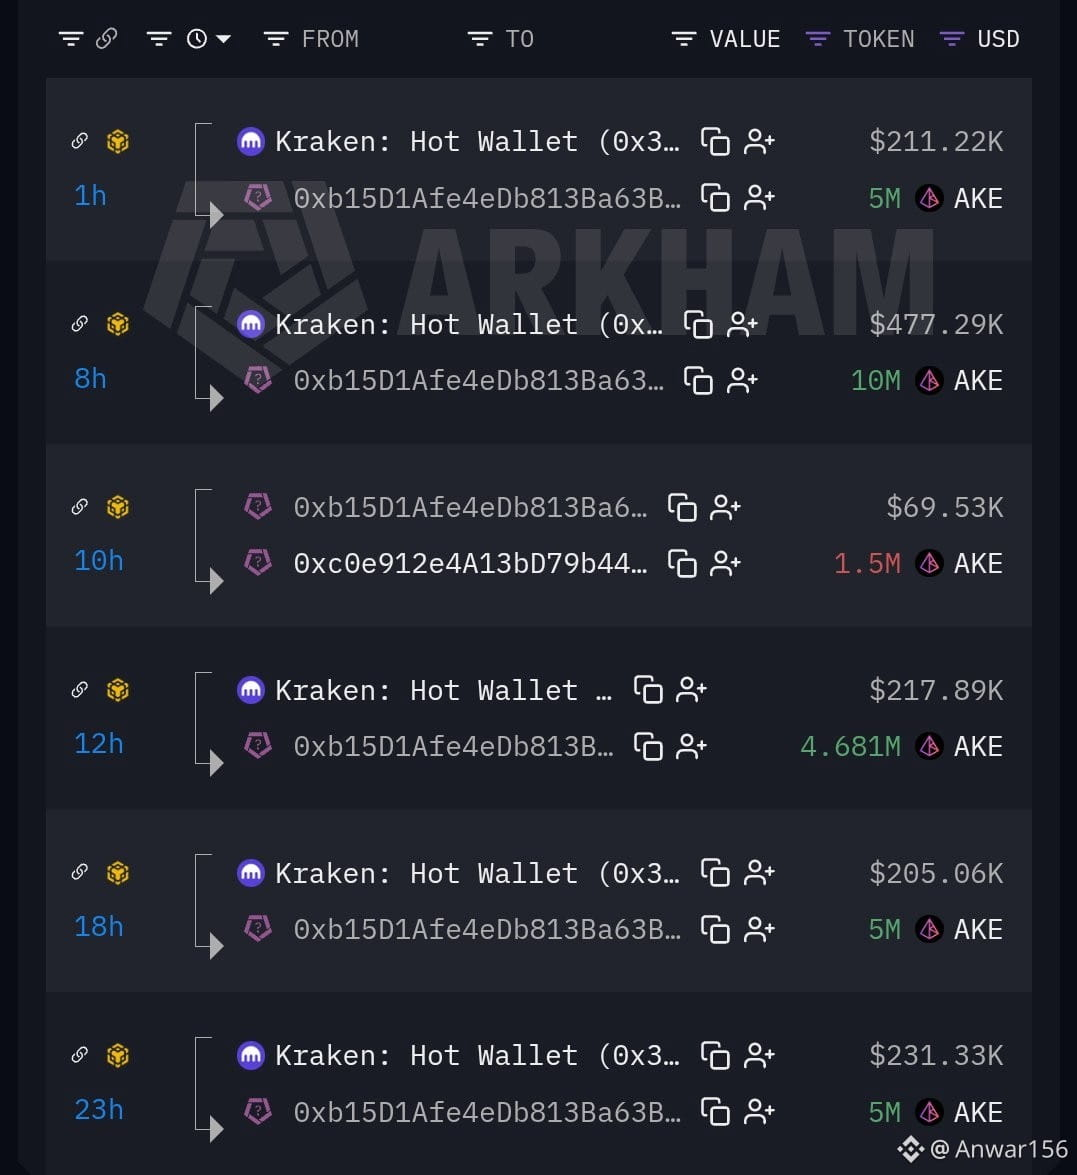
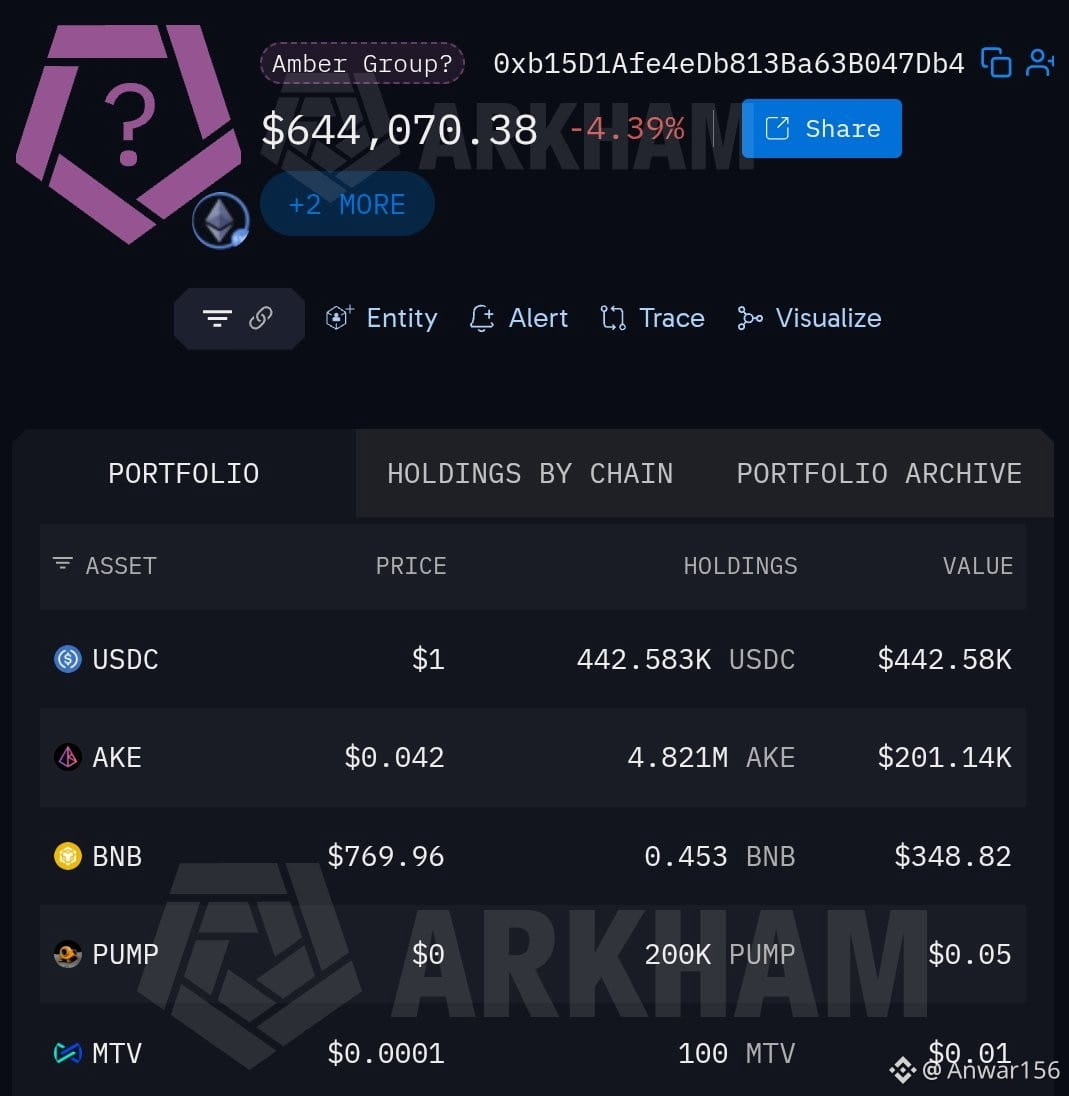
Guys, fresh wallet activity around $AKE is showing continued distribution from the Amber Group-linked wallet 0xb15D as price breaks down toward $0.041.
Over the last 24 hours, this entity moved more than 29.6M AKE ($1.34M+) from Kraken hot wallets through multiple 5M–10M token batches.
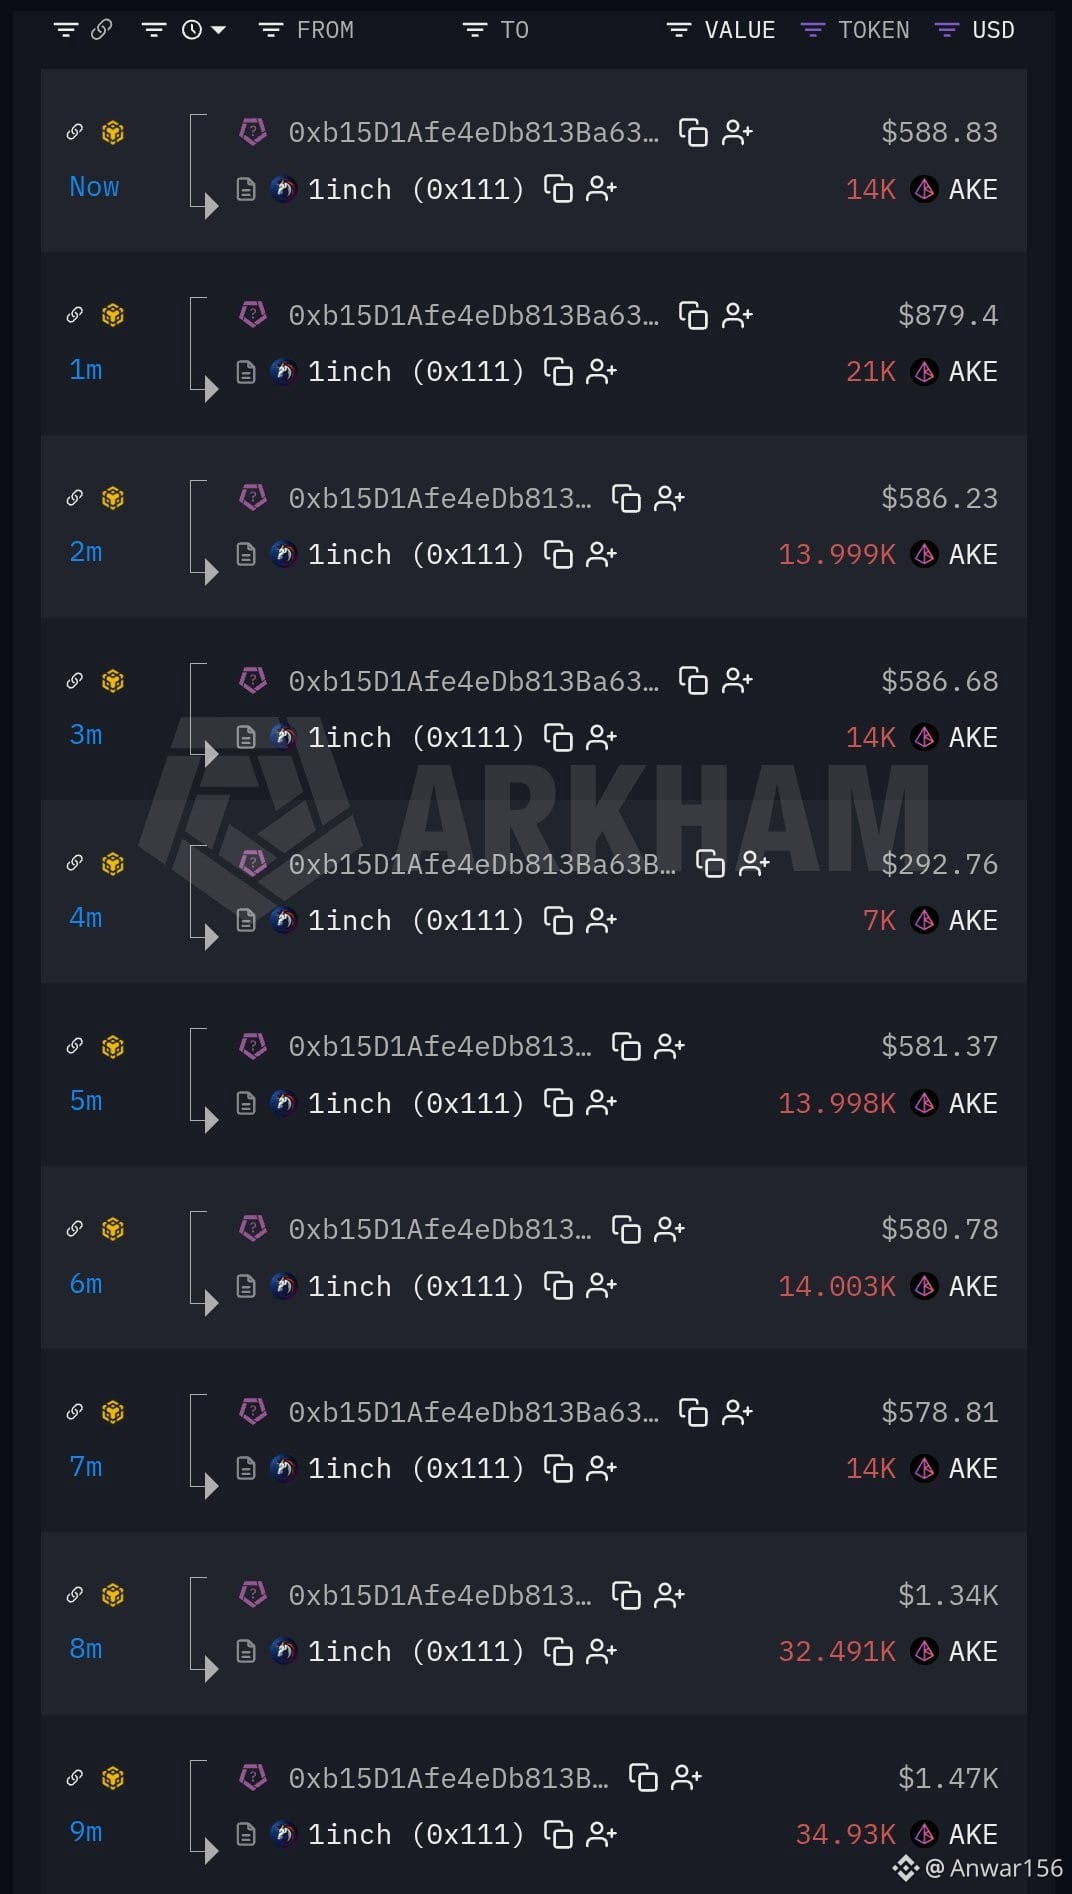
The tokens are then being routed through 1inch, with repeated transactions occurring every few minutes — suggesting systematic selling into DEX liquidity rather than simple accumulation.
The wallet now holds only 4.82M AKE ($201K), meaning a large portion of its position has already been moved out.
If this selling activity continues, it could keep adding overhead pressure and make it harder for $AKE to establish a strong base.
📉 Key level to watch: $0.03
DYOR. Not financial advice.
🚨 $AKE On-Chain Selling Pressure Is Still Building
Guys, fresh wallet activity around $AKE is showing continued distribution from the Amber Group-linked wallet 0xb15D as price breaks down toward $0.041.
Over the last 24 hours, this entity moved more than 29.6M AKE ($1.34M+) from Kraken hot wallets through multiple 5M–10M token batches.
The tokens are then being routed through 1inch, with repeated transactions occurring every few minutes — suggesting systematic selling into DEX liquidity rather than simple accumulation.
The wallet now holds only 4.82M AKE ($201K), meaning a large portion of its position has already been moved out.
If this selling activity continues, it could keep adding overhead pressure and make it harder for $AKE to establish a strong base.
📉 Key level to watch: $0.03
DYOR. Not financial advice.
Guys, fresh wallet activity around $AKE is showing continued distribution from the Amber Group-linked wallet 0xb15D as price breaks down toward $0.041.
Over the last 24 hours, this entity moved more than 29.6M AKE ($1.34M+) from Kraken hot wallets through multiple 5M–10M token batches.
The tokens are then being routed through 1inch, with repeated transactions occurring every few minutes — suggesting systematic selling into DEX liquidity rather than simple accumulation.
The wallet now holds only 4.82M AKE ($201K), meaning a large portion of its position has already been moved out.
If this selling activity continues, it could keep adding overhead pressure and make it harder for $AKE to establish a strong base.
📉 Key level to watch: $0.03
DYOR. Not financial advice.
3
1.2k
·
--
Bullish
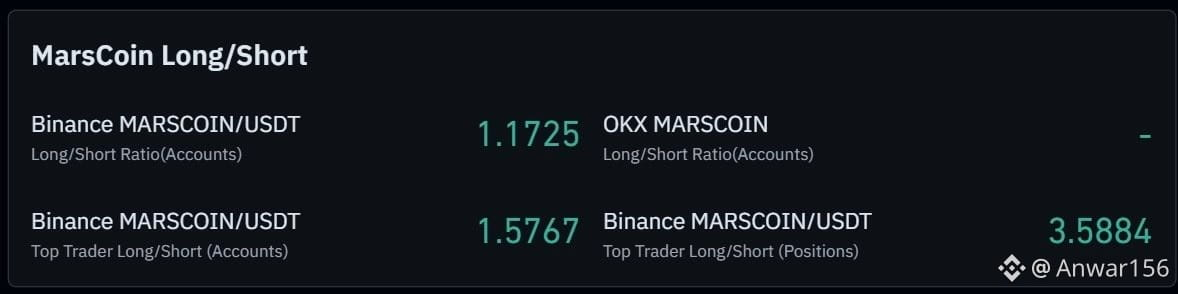
🚨 Something unusual is developing around $MARSCOIN .
A huge number of long positions have opened recently, and based on the current market movement, price could still push a little higher first. But after that, a 20–30% correction remains possible.
While investigating the move, I also noticed heavy exchange activity around the sharp decline from the $0.26 peak.
Several large transfers moved toward exchange wallets:
• 139.9M MARSCOIN worth ~$26.9M
• 42.6M MARSCOIN worth ~$10.6M
• 35M MARSCOIN worth ~$8.5M
• Several additional transfers to Binance and Gate
The timing is what makes this interesting. Some of these large transfers appeared around the period when $MARSCOIN was falling from the $0.26 area.
This does NOT confirm that the tokens were sold, but the size, timing, and concentration of exchange movements are definitely worth watching.
I’m tracking these wallets closely to see where the tokens ultimately move and whether this activity is positioning ahead of the next major move.
For now, the setup looks like potential upside first, followed by correction risk.
🚨 Something unusual is developing around $MARSCOIN .
A huge number of long positions have opened recently, and based on the current market movement, price could still push a little higher first. But after that, a 20–30% correction remains possible.
While investigating the move, I also noticed heavy exchange activity around the sharp decline from the $0.26 peak.
Several large transfers moved toward exchange wallets:
• 139.9M MARSCOIN worth ~$26.9M
• 42.6M MARSCOIN worth ~$10.6M
• 35M MARSCOIN worth ~$8.5M
• Several additional transfers to Binance and Gate
The timing is what makes this interesting. Some of these large transfers appeared around the period when $MARSCOIN was falling from the $0.26 area.
This does NOT confirm that the tokens were sold, but the size, timing, and concentration of exchange movements are definitely worth watching.
I’m tracking these wallets closely to see where the tokens ultimately move and whether this activity is positioning ahead of the next major move.
For now, the setup looks like potential upside first, followed by correction risk.
A huge number of long positions have opened recently, and based on the current market movement, price could still push a little higher first. But after that, a 20–30% correction remains possible.
While investigating the move, I also noticed heavy exchange activity around the sharp decline from the $0.26 peak.
Several large transfers moved toward exchange wallets:
• 139.9M MARSCOIN worth ~$26.9M
• 42.6M MARSCOIN worth ~$10.6M
• 35M MARSCOIN worth ~$8.5M
• Several additional transfers to Binance and Gate
The timing is what makes this interesting. Some of these large transfers appeared around the period when $MARSCOIN was falling from the $0.26 area.
This does NOT confirm that the tokens were sold, but the size, timing, and concentration of exchange movements are definitely worth watching.
I’m tracking these wallets closely to see where the tokens ultimately move and whether this activity is positioning ahead of the next major move.
For now, the setup looks like potential upside first, followed by correction risk.
2
699
·
--
🚨 $龙虾 LIQUIDATION DATA IS SCREAMING — SHORTS GOT CAUGHT
The latest liquidation breakdown on $龙虾 is getting very interesting. 📉🔥
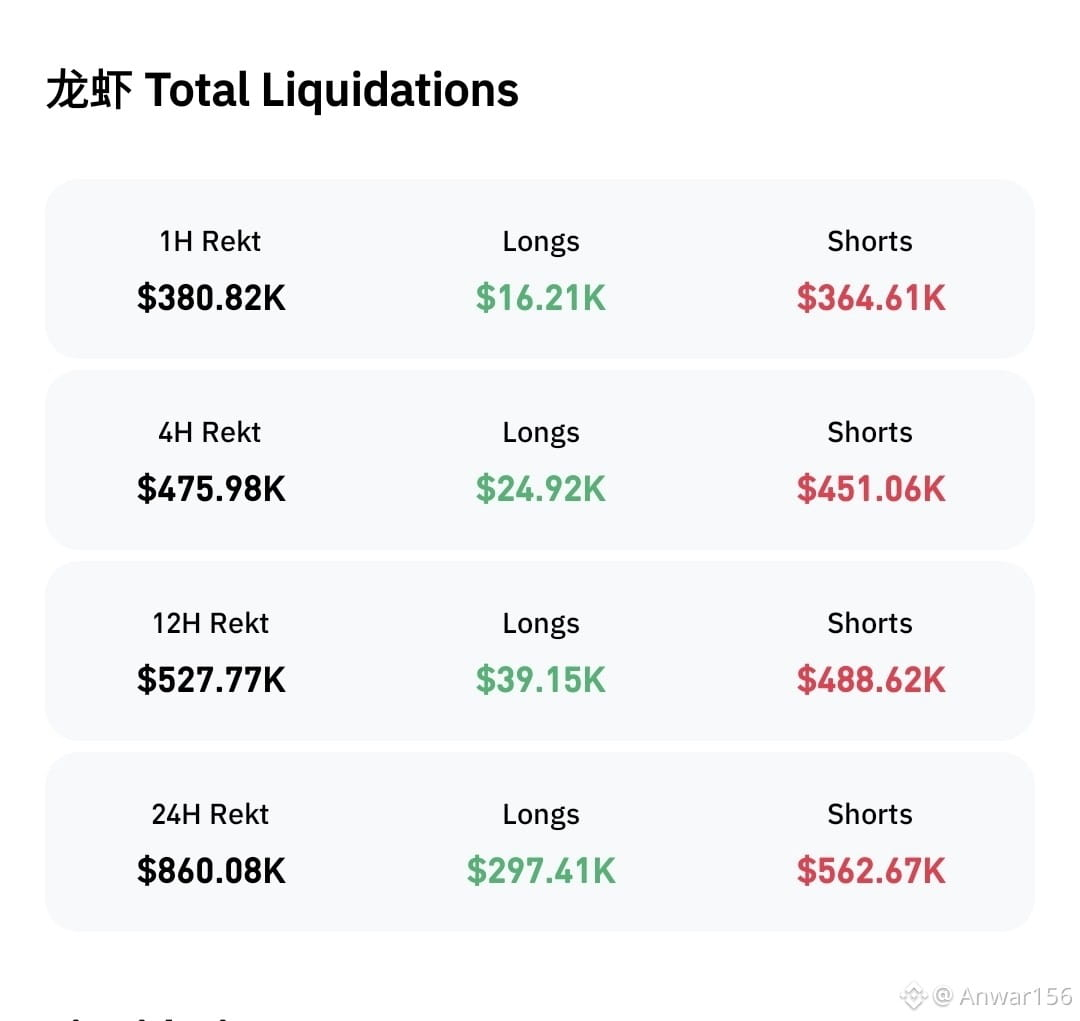
Over the last 24H:
💥 Total Liquidations: $860.08K
🔴 Shorts Liquidated: $562.67K
🟢 Longs Liquidated: $297.41K
That means shorts accounted for the larger share of the liquidation pressure.
And it wasn’t just a one-hour event:
• 1H: $380.82K liquidated
→ Shorts: $364.61K
→ Longs: $16.21K
• 4H: $475.98K
→ Shorts: $451.06K
→ Longs: $24.92K
• 12H: $527.77K
→ Shorts: $488.62K
→ Longs: $39.15K
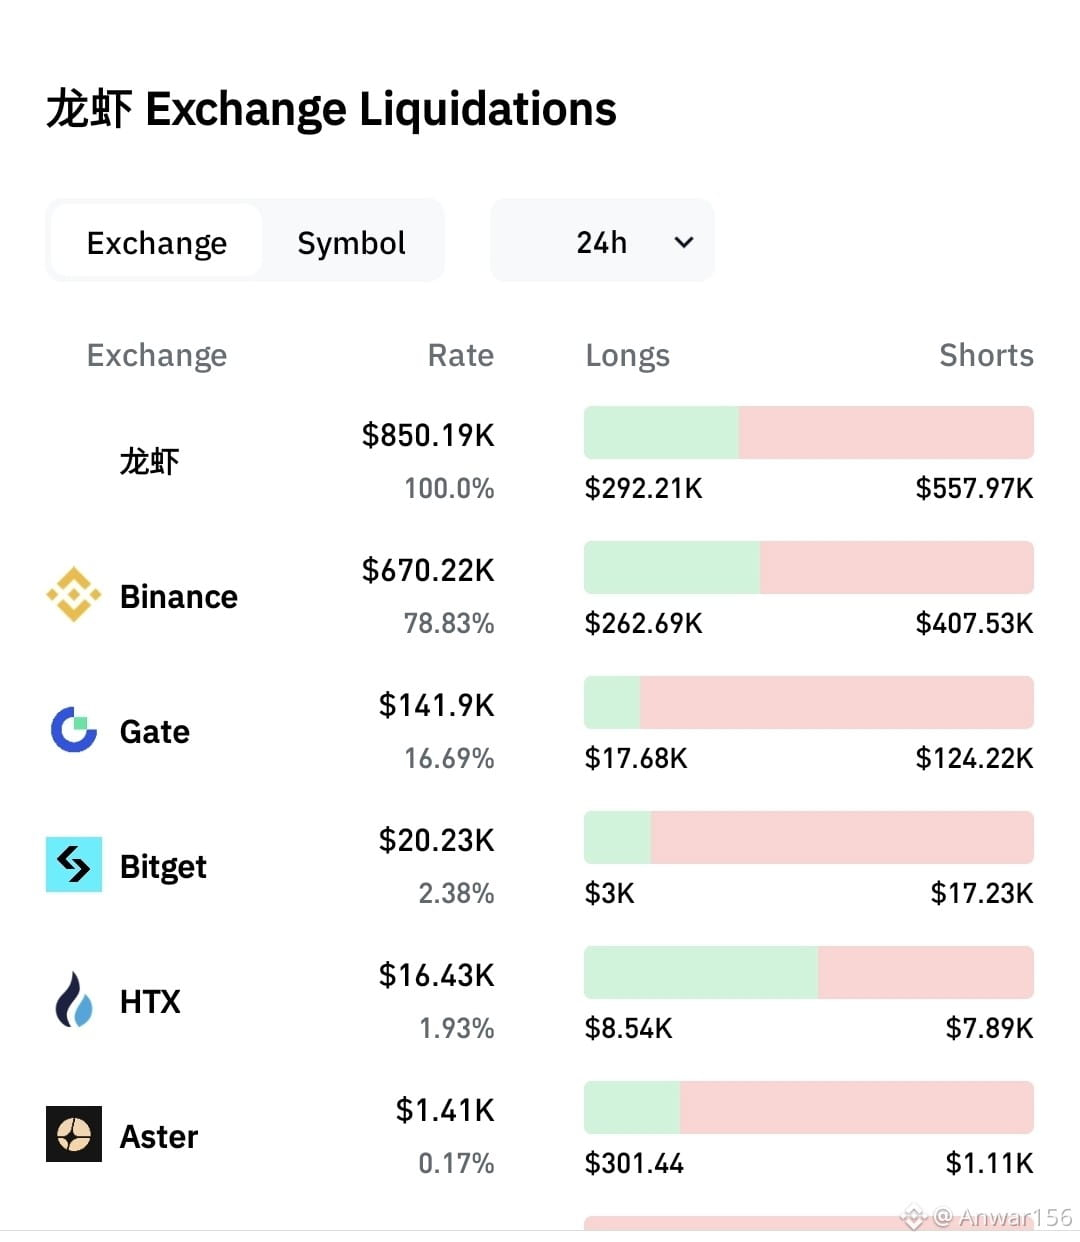
The exchange breakdown makes it even more interesting:
🏦 Binance: $670.22K
→ $407.53K shorts
→ $262.69K longs
🏦 Gate: $141.90K
→ $124.22K shorts
→ $17.68K longs
🏦 Bitget: $20.23K
→ $17.23K shorts
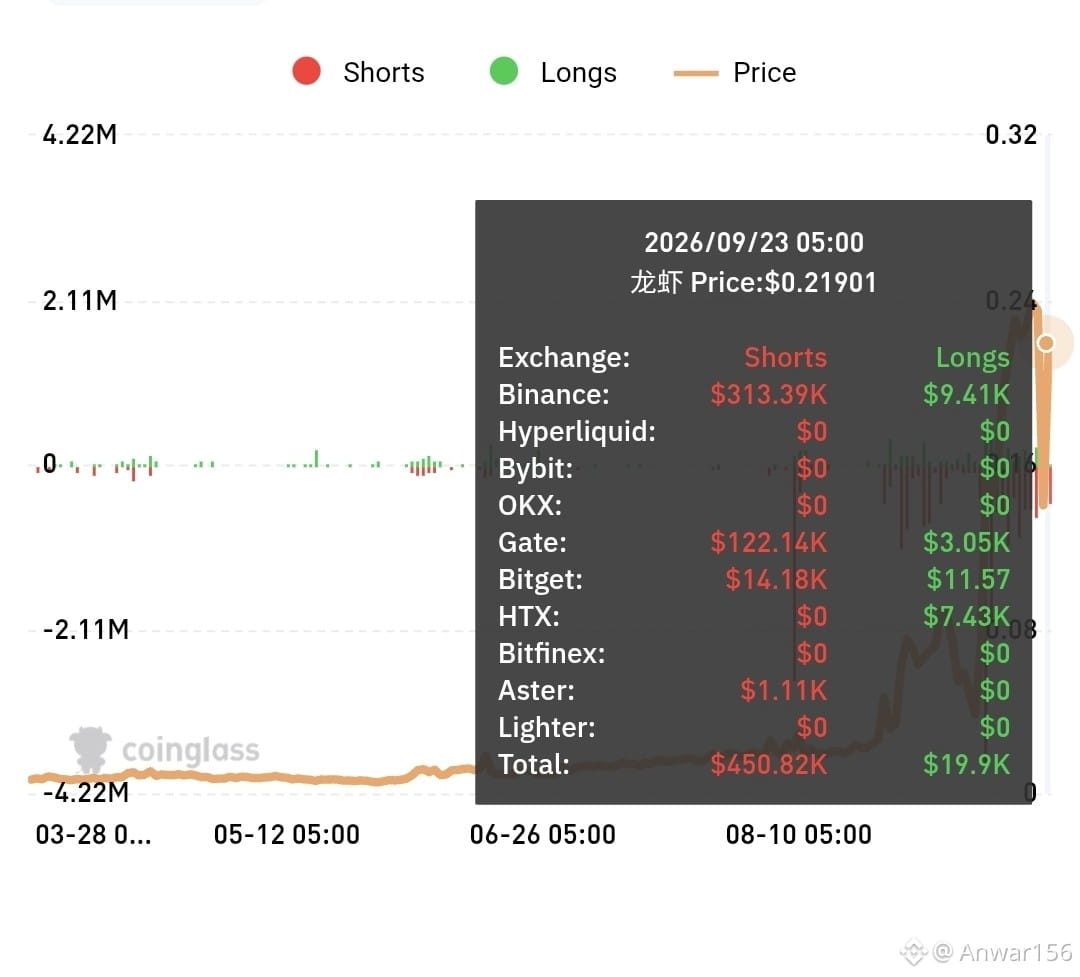
So where did this liquidation wave meet price?
Right around the explosive move toward $0.21901. 🚀
After sitting relatively quiet for months, 龙虾 suddenly woke up and delivered a sharp vertical expansion while short positions were being forced out.
The most notable snapshot shows:
🔴 Binance shorts: $313.39K
🟢 Binance longs: $9.41K
That is a huge imbalance.
And when you combine the liquidation data with the exchange activity I flagged earlier, the sequence becomes worth watching closely:
Quiet chart → unusual exchange activity → sudden price expansion → heavy short liquidations.
The move may have caught a lot of traders positioned on the wrong side.
Now the key question is:
Was that the beginning of a bigger expansion, or was the short squeeze already the main event? 👀
{future}(龙虾USDT)
$龙虾 #龙虾 #Crypto #Liquidations #Binance
🚨 $龙虾 LIQUIDATION DATA IS SCREAMING — SHORTS GOT CAUGHT
The latest liquidation breakdown on $龙虾 is getting very interesting. 📉🔥
Over the last 24H:
💥 Total Liquidations: $860.08K
🔴 Shorts Liquidated: $562.67K
🟢 Longs Liquidated: $297.41K
That means shorts accounted for the larger share of the liquidation pressure.
And it wasn’t just a one-hour event:
• 1H: $380.82K liquidated
→ Shorts: $364.61K
→ Longs: $16.21K
• 4H: $475.98K
→ Shorts: $451.06K
→ Longs: $24.92K
• 12H: $527.77K
→ Shorts: $488.62K
→ Longs: $39.15K
The exchange breakdown makes it even more interesting:
🏦 Binance: $670.22K
→ $407.53K shorts
→ $262.69K longs
🏦 Gate: $141.90K
→ $124.22K shorts
→ $17.68K longs
🏦 Bitget: $20.23K
→ $17.23K shorts
So where did this liquidation wave meet price?
Right around the explosive move toward $0.21901. 🚀
After sitting relatively quiet for months, 龙虾 suddenly woke up and delivered a sharp vertical expansion while short positions were being forced out.
The most notable snapshot shows:
🔴 Binance shorts: $313.39K
🟢 Binance longs: $9.41K
That is a huge imbalance.
And when you combine the liquidation data with the exchange activity I flagged earlier, the sequence becomes worth watching closely:
Quiet chart → unusual exchange activity → sudden price expansion → heavy short liquidations.
The move may have caught a lot of traders positioned on the wrong side.
Now the key question is:
Was that the beginning of a bigger expansion, or was the short squeeze already the main event? 👀
$龙虾 #龙虾 #Crypto #Liquidations #Binance
The latest liquidation breakdown on $龙虾 is getting very interesting. 📉🔥
Over the last 24H:
💥 Total Liquidations: $860.08K
🔴 Shorts Liquidated: $562.67K
🟢 Longs Liquidated: $297.41K
That means shorts accounted for the larger share of the liquidation pressure.
And it wasn’t just a one-hour event:
• 1H: $380.82K liquidated
→ Shorts: $364.61K
→ Longs: $16.21K
• 4H: $475.98K
→ Shorts: $451.06K
→ Longs: $24.92K
• 12H: $527.77K
→ Shorts: $488.62K
→ Longs: $39.15K
The exchange breakdown makes it even more interesting:
🏦 Binance: $670.22K
→ $407.53K shorts
→ $262.69K longs
🏦 Gate: $141.90K
→ $124.22K shorts
→ $17.68K longs
🏦 Bitget: $20.23K
→ $17.23K shorts
So where did this liquidation wave meet price?
Right around the explosive move toward $0.21901. 🚀
After sitting relatively quiet for months, 龙虾 suddenly woke up and delivered a sharp vertical expansion while short positions were being forced out.
The most notable snapshot shows:
🔴 Binance shorts: $313.39K
🟢 Binance longs: $9.41K
That is a huge imbalance.
And when you combine the liquidation data with the exchange activity I flagged earlier, the sequence becomes worth watching closely:
Quiet chart → unusual exchange activity → sudden price expansion → heavy short liquidations.
The move may have caught a lot of traders positioned on the wrong side.
Now the key question is:
Was that the beginning of a bigger expansion, or was the short squeeze already the main event? 👀
$龙虾 #龙虾 #Crypto #Liquidations #Binance
2
518
·
--
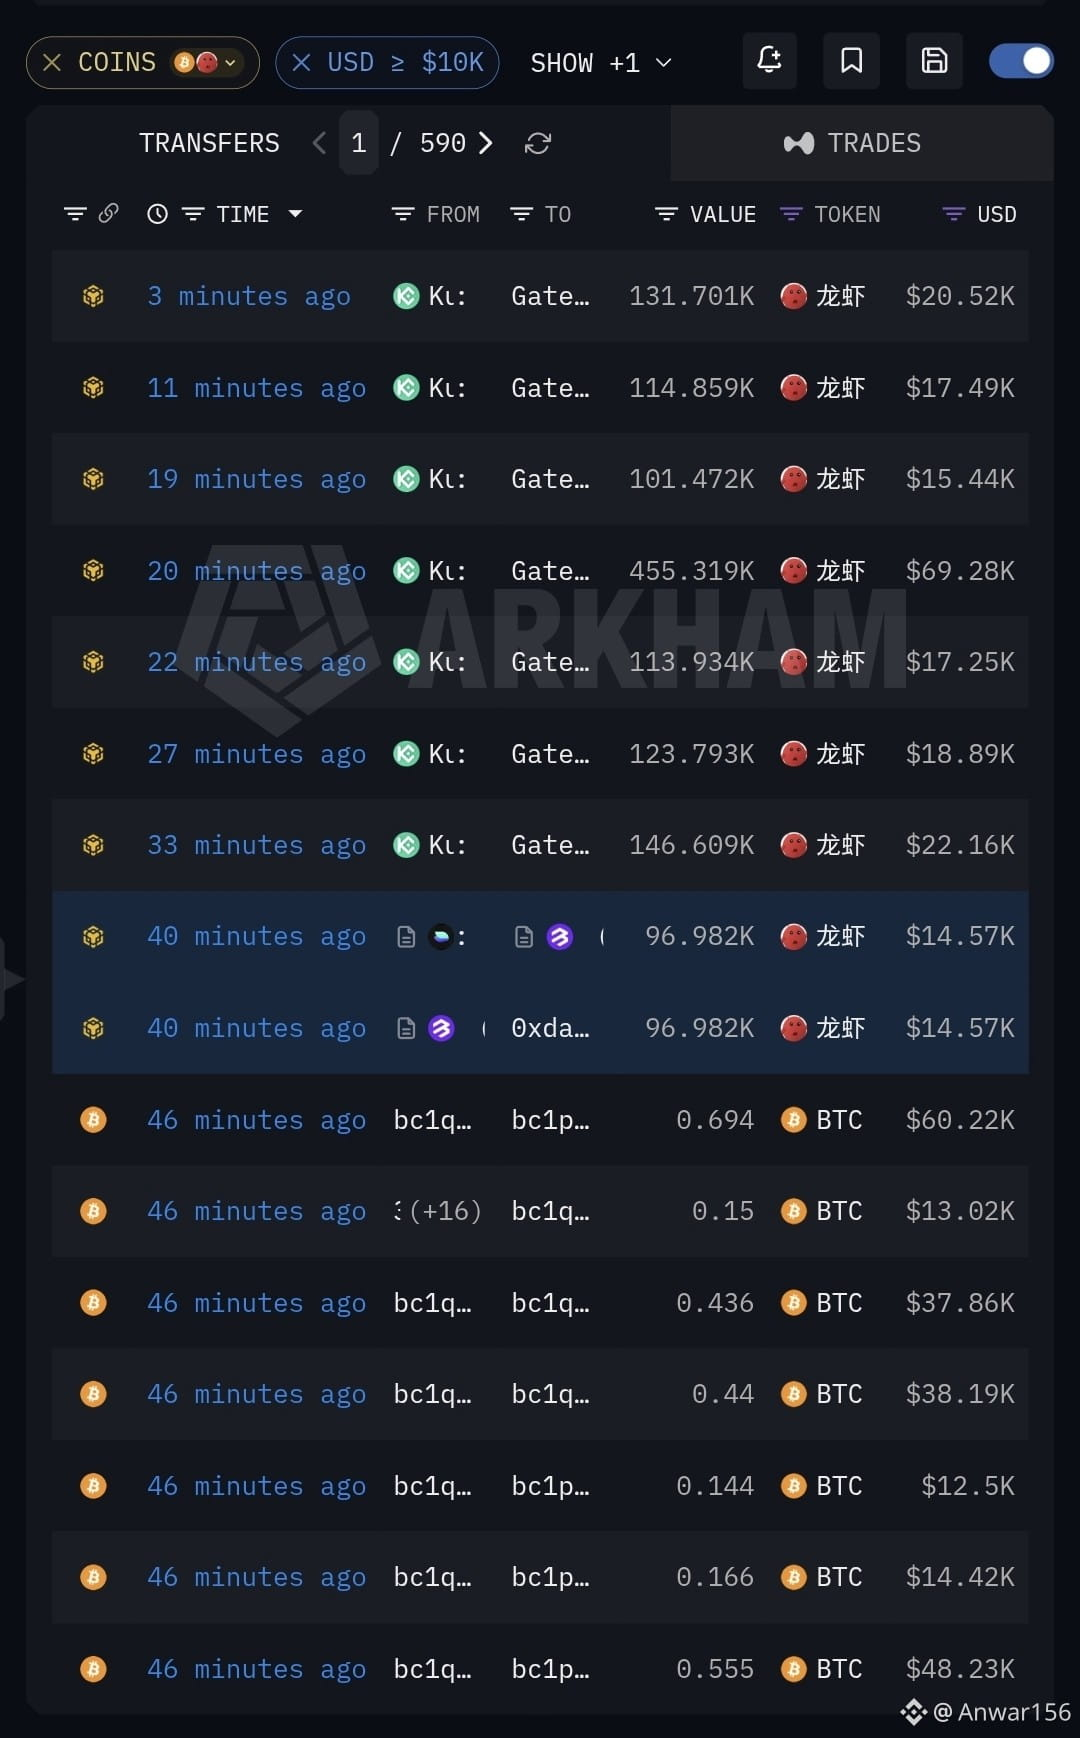
guys full breakdown on $龙虾 this pattern is worth a closer look 👀
started tracking this about 40 minutes ago and the flow has not stopped since
every single transfer is going the same direction KuCoin to Gate seven times in a row no reversals no wallet sending it back
here is the size breakdown
1️⃣ 20 minutes ago the biggest single move 455k tokens worth 69k dollars
2️⃣ 33 minutes ago 146k tokens worth 22k
3️⃣ 27 minutes ago 123k tokens worth close to 19k
4️⃣ multiple smaller transfers in between all landing between 15k and 20k each
add it up and that is well over 180k dollars moved from one exchange to another in under 40 minutes on a token most people have probably never even looked at
what this usually means is one of two things either a market maker is actively balancing liquidity between KuCoin and Gate because volume or spreads shifted or someone is quietly repositioning size before doing something with it on Gate specifically
I lean toward market maker behavior because the transfers are staggered not dumped all at once but I am not ruling out the second option either
either way when a low profile token like #龙虾 suddenly gets this much repeated cross exchange traffic it is worth putting on your radar for the next few hours
is anyone actually holding 龙虾 right now or is this completely off everyone's radar 👀
{future}(龙虾USDT)
guys full breakdown on $龙虾 this pattern is worth a closer look 👀
started tracking this about 40 minutes ago and the flow has not stopped since
every single transfer is going the same direction KuCoin to Gate seven times in a row no reversals no wallet sending it back
here is the size breakdown
1️⃣ 20 minutes ago the biggest single move 455k tokens worth 69k dollars
2️⃣ 33 minutes ago 146k tokens worth 22k
3️⃣ 27 minutes ago 123k tokens worth close to 19k
4️⃣ multiple smaller transfers in between all landing between 15k and 20k each
add it up and that is well over 180k dollars moved from one exchange to another in under 40 minutes on a token most people have probably never even looked at
what this usually means is one of two things either a market maker is actively balancing liquidity between KuCoin and Gate because volume or spreads shifted or someone is quietly repositioning size before doing something with it on Gate specifically
I lean toward market maker behavior because the transfers are staggered not dumped all at once but I am not ruling out the second option either
either way when a low profile token like #龙虾 suddenly gets this much repeated cross exchange traffic it is worth putting on your radar for the next few hours
is anyone actually holding 龙虾 right now or is this completely off everyone's radar 👀
started tracking this about 40 minutes ago and the flow has not stopped since
every single transfer is going the same direction KuCoin to Gate seven times in a row no reversals no wallet sending it back
here is the size breakdown
1️⃣ 20 minutes ago the biggest single move 455k tokens worth 69k dollars
2️⃣ 33 minutes ago 146k tokens worth 22k
3️⃣ 27 minutes ago 123k tokens worth close to 19k
4️⃣ multiple smaller transfers in between all landing between 15k and 20k each
add it up and that is well over 180k dollars moved from one exchange to another in under 40 minutes on a token most people have probably never even looked at
what this usually means is one of two things either a market maker is actively balancing liquidity between KuCoin and Gate because volume or spreads shifted or someone is quietly repositioning size before doing something with it on Gate specifically
I lean toward market maker behavior because the transfers are staggered not dumped all at once but I am not ruling out the second option either
either way when a low profile token like #龙虾 suddenly gets this much repeated cross exchange traffic it is worth putting on your radar for the next few hours
is anyone actually holding 龙虾 right now or is this completely off everyone's radar 👀
5
1
4
4k
·
--
🚨 $MUBARAK Could Be Setting Up for Another Surprise Move
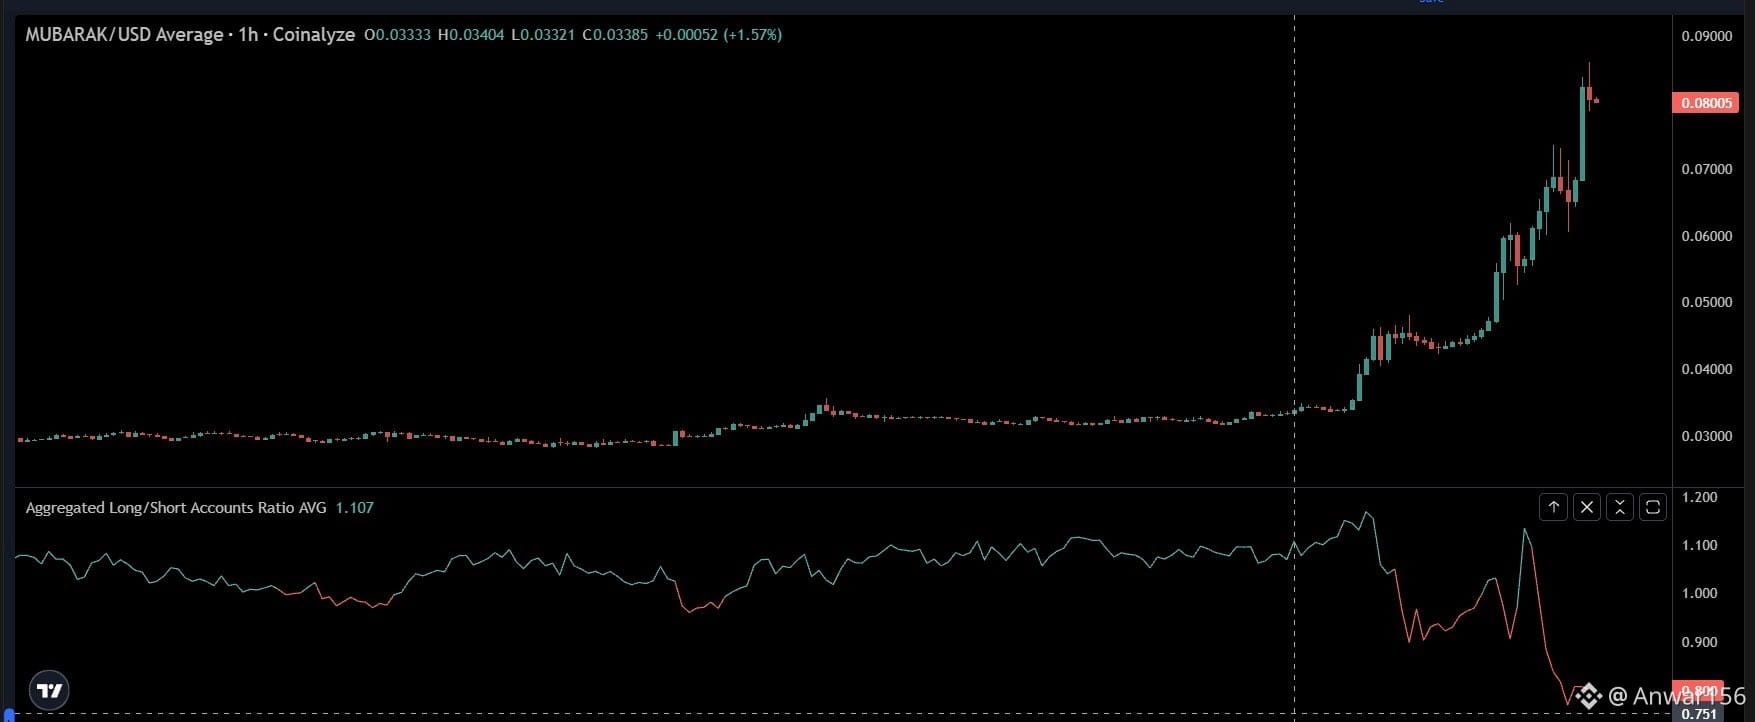
Guys, take a look at the Long/Short positioning on MUBARAK.
Around 58% to 59% of traders are short, while only around 41% to 42% are long on the short-term timeframes.
The Binance account ratio is around 0.82, while OKX is around 0.96, both showing a larger number of traders positioned short. Top trader accounts are also short-heavy at around 0.82.
But there’s an important detail here.
Top trader positions remain heavily long, with a Long/Short ratio of around 2.44.
So while the majority of traders are leaning short, larger positions are still tilted toward the long side.
Now consider the psychology behind this move.
MUBARAK has already pumped around 80% in a single day. After watching a move this aggressive, many traders naturally start thinking:
"It has already pumped too much. A dump must be coming."
That mindset can lead to a wave of short entries.
And when positioning becomes too crowded on one side, the market can sometimes move in the opposite direction and force those traders to rethink their positions.
Funding is also positive, sitting around +0.038% on Binance and +0.085% on Bybit, meaning longs are paying shorts.
If MUBARAK continues pushing higher, those crowded shorts could come under increasing pressure. Some traders may be forced to close, while others could face liquidation, potentially adding more buying pressure.
With so many traders already positioned short, $MUBARAK could still catch the market off guard if the momentum continues. 🔥
NFA. DYOR.
{future}(MUBARAKUSDT)
🚨 $MUBARAK Could Be Setting Up for Another Surprise Move
Guys, take a look at the Long/Short positioning on MUBARAK.
Around 58% to 59% of traders are short, while only around 41% to 42% are long on the short-term timeframes.
The Binance account ratio is around 0.82, while OKX is around 0.96, both showing a larger number of traders positioned short. Top trader accounts are also short-heavy at around 0.82.
But there’s an important detail here.
Top trader positions remain heavily long, with a Long/Short ratio of around 2.44.
So while the majority of traders are leaning short, larger positions are still tilted toward the long side.
Now consider the psychology behind this move.
MUBARAK has already pumped around 80% in a single day. After watching a move this aggressive, many traders naturally start thinking:
"It has already pumped too much. A dump must be coming."
That mindset can lead to a wave of short entries.
And when positioning becomes too crowded on one side, the market can sometimes move in the opposite direction and force those traders to rethink their positions.
Funding is also positive, sitting around +0.038% on Binance and +0.085% on Bybit, meaning longs are paying shorts.
If MUBARAK continues pushing higher, those crowded shorts could come under increasing pressure. Some traders may be forced to close, while others could face liquidation, potentially adding more buying pressure.
With so many traders already positioned short, $MUBARAK could still catch the market off guard if the momentum continues. 🔥
NFA. DYOR.
Guys, take a look at the Long/Short positioning on MUBARAK.
Around 58% to 59% of traders are short, while only around 41% to 42% are long on the short-term timeframes.
The Binance account ratio is around 0.82, while OKX is around 0.96, both showing a larger number of traders positioned short. Top trader accounts are also short-heavy at around 0.82.
But there’s an important detail here.
Top trader positions remain heavily long, with a Long/Short ratio of around 2.44.
So while the majority of traders are leaning short, larger positions are still tilted toward the long side.
Now consider the psychology behind this move.
MUBARAK has already pumped around 80% in a single day. After watching a move this aggressive, many traders naturally start thinking:
"It has already pumped too much. A dump must be coming."
That mindset can lead to a wave of short entries.
And when positioning becomes too crowded on one side, the market can sometimes move in the opposite direction and force those traders to rethink their positions.
Funding is also positive, sitting around +0.038% on Binance and +0.085% on Bybit, meaning longs are paying shorts.
If MUBARAK continues pushing higher, those crowded shorts could come under increasing pressure. Some traders may be forced to close, while others could face liquidation, potentially adding more buying pressure.
With so many traders already positioned short, $MUBARAK could still catch the market off guard if the momentum continues. 🔥
NFA. DYOR.
3
655
·
--
Bearish
$MARSCOIN is starting to move again, up nearly 20% and putting me around $79K in profit on the position.
I’m still looking for $0.20. The move has started, but I do not think the market has fully repriced the momentum here yet.
{future}(MARSCOINUSDT)
$MARSCOIN is starting to move again, up nearly 20% and putting me around $79K in profit on the position.
I’m still looking for $0.20. The move has started, but I do not think the market has fully repriced the momentum here yet.
I’m still looking for $0.20. The move has started, but I do not think the market has fully repriced the momentum here yet.

2
243
·
--
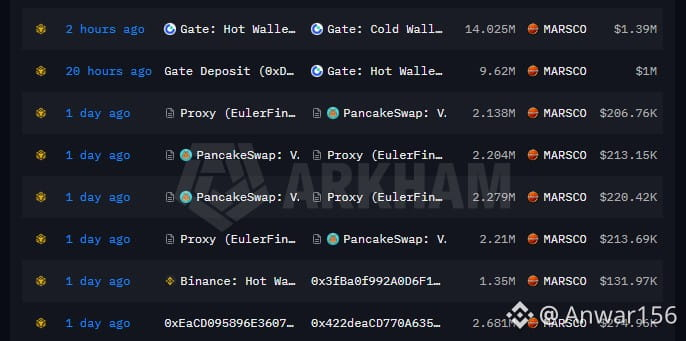
🚨 Over $2.3M in $MARSCOIN exchange activity in just 24 hours.
The latest on-chain flows are showing some serious movement behind the scenes.
• Gate: Received 9.62M $MARSCOIN (~$1M), then swept 14.025M tokens (~$1.39M) into cold storage.
• Euler Finance: Proxies rapidly moved 8.83M MARSCOIN (~$854K) through PancakeSwap pools as liquidity was rebalanced.
• Binance: Whales pulled another 1.35M MARSCOIN (~$132K) away from the exchange toward cold wallets.
A lot of $MARSCOIN is moving, but a significant portion is being shifted away from active exchange circulation. 👀
The next few moves could reveal whether this is accumulation, liquidity management, or preparation for another expansion.
{future}(MARSCOINUSDT)
🚨 Over $2.3M in $MARSCOIN exchange activity in just 24 hours.
The latest on-chain flows are showing some serious movement behind the scenes.
• Gate: Received 9.62M $MARSCOIN (~$1M), then swept 14.025M tokens (~$1.39M) into cold storage.
• Euler Finance: Proxies rapidly moved 8.83M MARSCOIN (~$854K) through PancakeSwap pools as liquidity was rebalanced.
• Binance: Whales pulled another 1.35M MARSCOIN (~$132K) away from the exchange toward cold wallets.
A lot of $MARSCOIN is moving, but a significant portion is being shifted away from active exchange circulation. 👀
The next few moves could reveal whether this is accumulation, liquidity management, or preparation for another expansion.
The latest on-chain flows are showing some serious movement behind the scenes.
• Gate: Received 9.62M $MARSCOIN (~$1M), then swept 14.025M tokens (~$1.39M) into cold storage.
• Euler Finance: Proxies rapidly moved 8.83M MARSCOIN (~$854K) through PancakeSwap pools as liquidity was rebalanced.
• Binance: Whales pulled another 1.35M MARSCOIN (~$132K) away from the exchange toward cold wallets.
A lot of $MARSCOIN is moving, but a significant portion is being shifted away from active exchange circulation. 👀
The next few moves could reveal whether this is accumulation, liquidity management, or preparation for another expansion.
4
9
6k
·
--
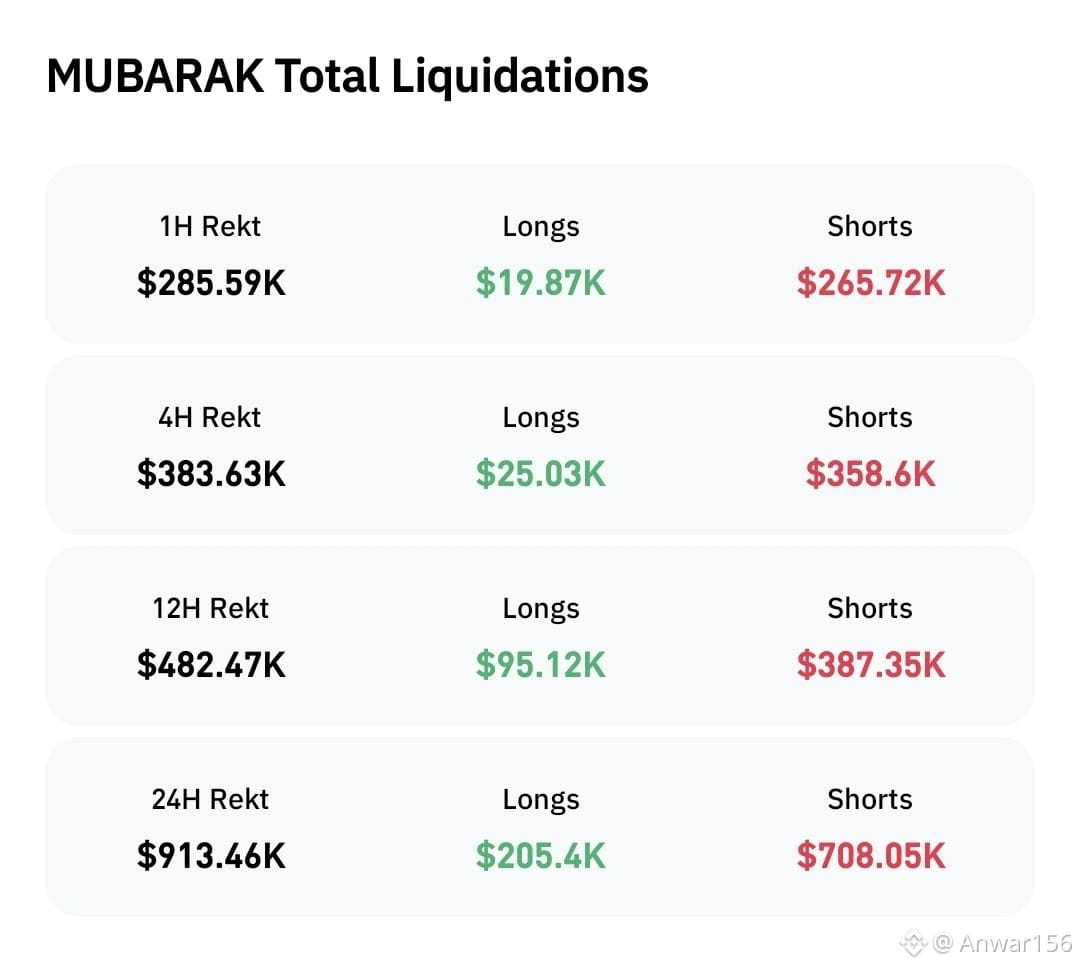
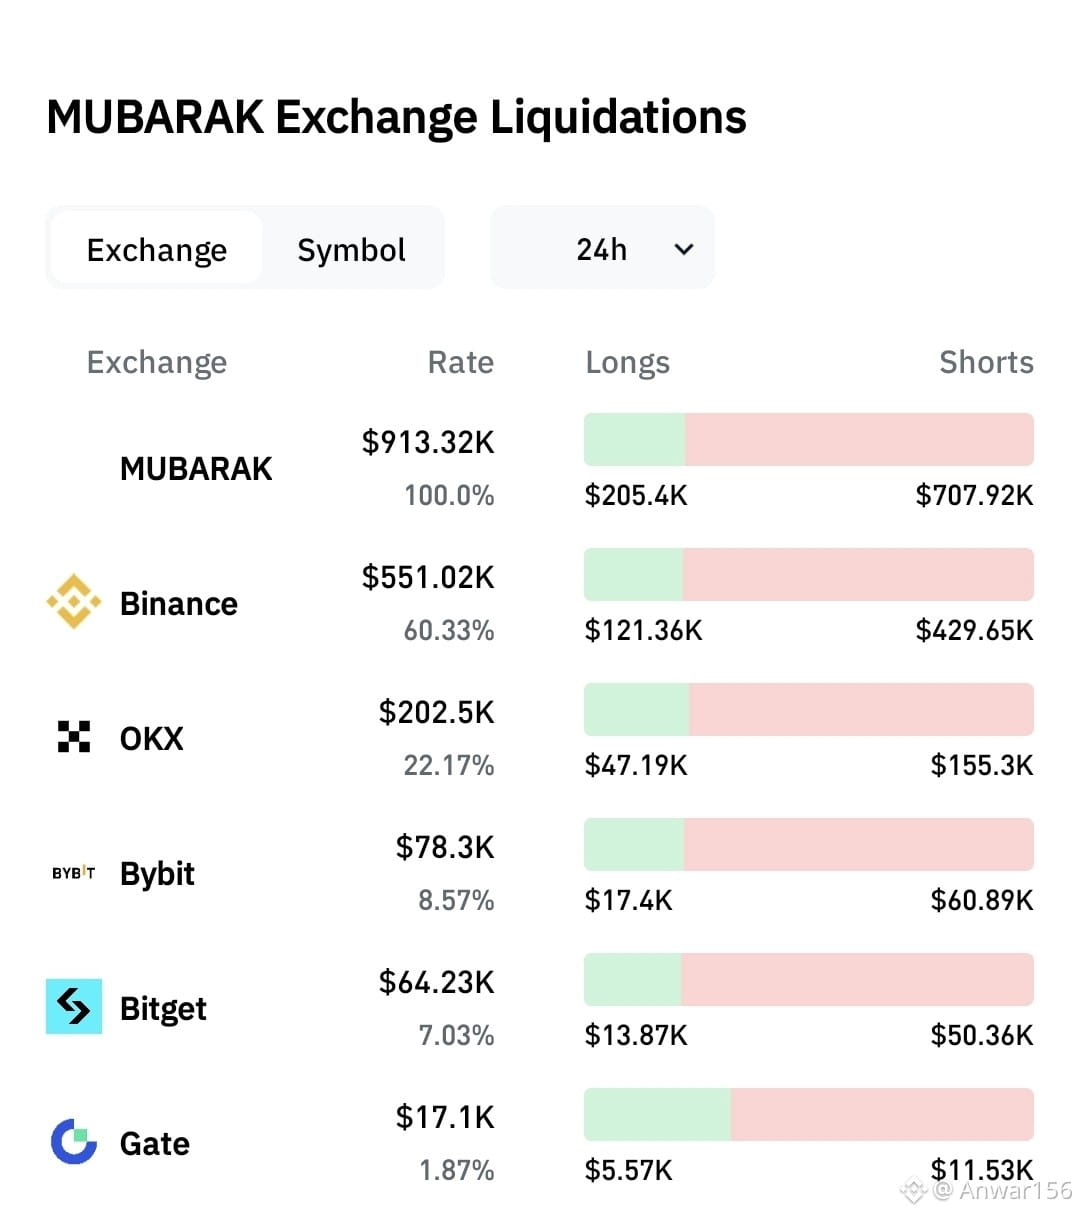
guys $MUBARAK liquidations are lopsided hard 📉
24h total sits at 913k in liquidations and 708k of that is shorts getting wiped only 205k was longs shorts are taking the brunt of this by a wide margin
same story on every timeframe 1h 4h and 12h all show shorts losing multiples more than longs this is not a one off spike it has been consistent
breaking it down by exchange Binance alone accounts for 551k in liquidations OKX at 202k then Bybit Bitget and Gate rounding out the rest same lopsided ratio on every single one shorts dominating the losses everywhere
when shorts keep getting liquidated at this rate across every exchange that usually means price kept grinding up against heavy short positioning
anyone short #MUBARAK right now or did you already get caught in this 📉
{future}(MUBARAKUSDT)
guys $MUBARAK liquidations are lopsided hard 📉
24h total sits at 913k in liquidations and 708k of that is shorts getting wiped only 205k was longs shorts are taking the brunt of this by a wide margin
same story on every timeframe 1h 4h and 12h all show shorts losing multiples more than longs this is not a one off spike it has been consistent
breaking it down by exchange Binance alone accounts for 551k in liquidations OKX at 202k then Bybit Bitget and Gate rounding out the rest same lopsided ratio on every single one shorts dominating the losses everywhere
when shorts keep getting liquidated at this rate across every exchange that usually means price kept grinding up against heavy short positioning
anyone short #MUBARAK right now or did you already get caught in this 📉
24h total sits at 913k in liquidations and 708k of that is shorts getting wiped only 205k was longs shorts are taking the brunt of this by a wide margin
same story on every timeframe 1h 4h and 12h all show shorts losing multiples more than longs this is not a one off spike it has been consistent
breaking it down by exchange Binance alone accounts for 551k in liquidations OKX at 202k then Bybit Bitget and Gate rounding out the rest same lopsided ratio on every single one shorts dominating the losses everywhere
when shorts keep getting liquidated at this rate across every exchange that usually means price kept grinding up against heavy short positioning
anyone short #MUBARAK right now or did you already get caught in this 📉
2
1.8k
·
--
Bearish
$AKE
{future}(AKEUSDT)
Around 300x from where we started tracking, down 73% from ATH, and 75% of circulating supply changed hands in 24 hours.
We started tracking AKE about 7 weeks ago, when price was sitting in the 0.0005 to 0.0006 range. Back then we were seeing aggressive wallet accumulation onchain. In the earlier post, measured against the ATH at the time of 0.16400, we called it roughly a 90x move.
The move didn't stop there. AKE went on to set a new ATH at 0.1647. Measured from where we started tracking, that's around 300x.
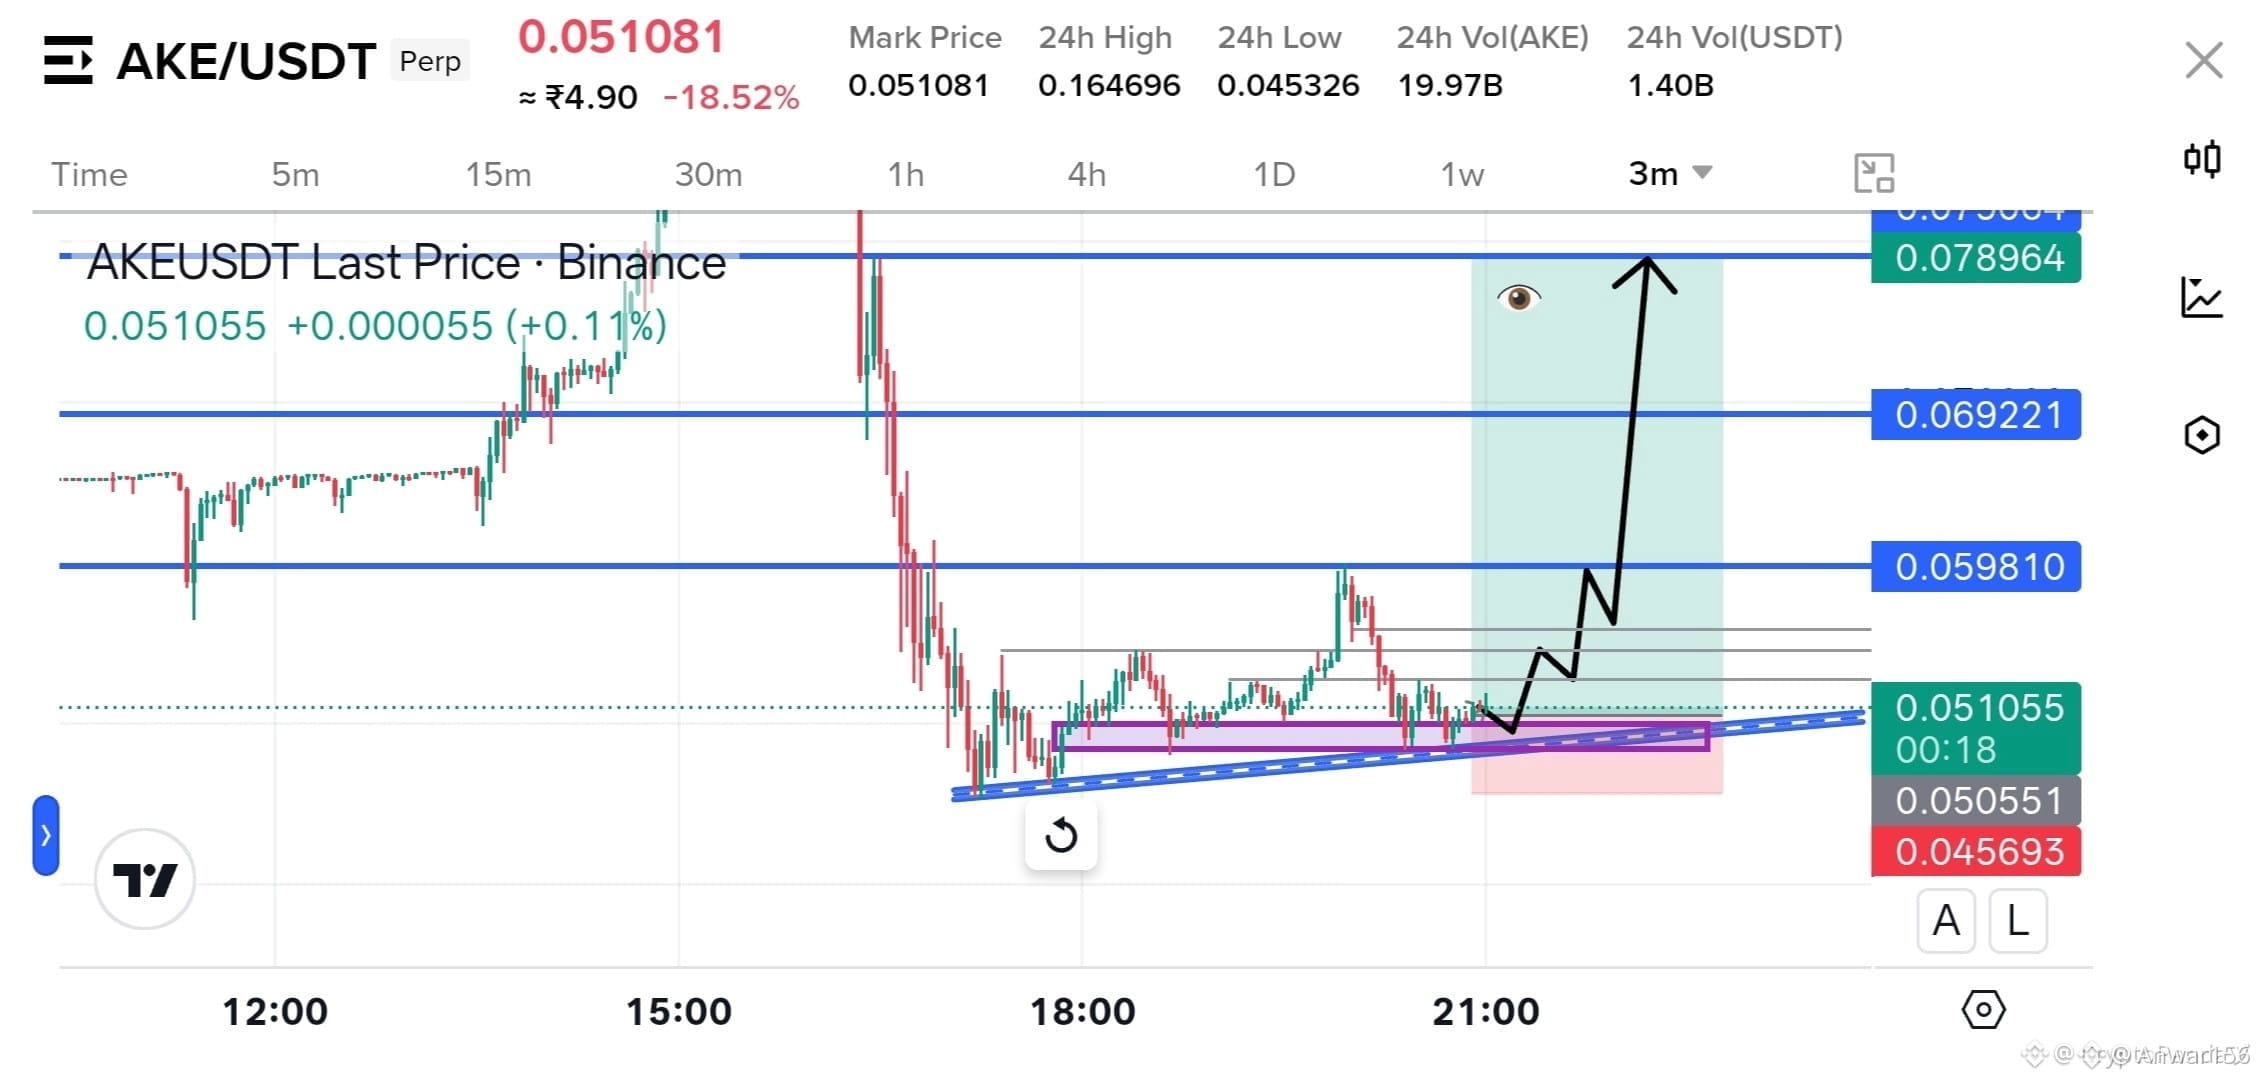
Now the picture has turned hard. Price is at 0.053, down 73% from ATH. Over the last 24 hours the high was 0.1526 and the low 0.0312, a gap of nearly 5x.
The volume is extraordinary. 16.5 billion AKE traded in the last 24 hours. Circulating supply is around 21.9 billion, so 75% of circulating supply changed hands in a single day. OI collapsed 71% over the same stretch, leverage has largely been flushed out.
Right now an ERC1967Proxy contract is distributing to dozens of wallets. The amounts aren't random: figures like 83.333M, 41.667M and 33.333M keep repeating, and those are an allocation split into monthly fractions. In other words, a scheduled vesting distribution. The contract held 9 billion tokens, and 6 billion remain.
There's an important detail here: the wallets receiving the distribution are holding, not sending to exchanges. So the 73% drop from ATH wasn't triggered by these vesting recipients. What carried the drop was the leverage flush, visible in the 71% collapse in OI.
But the real question hasn't been answered yet. 6 billion tokens are still sitting in the contract. That's $267M at current price, and equal to 27% of current circulating supply. On top of that, the 3 billion already distributed are sitting in the receiving wallets.
On the way up, liquid supply was shrinking, and that was the mechanism feeding the move. Now locked supply is being released, so the same mechanism is running in reverse. What decides it is whether the receiving wallets keep holding.
$AKE
Around 300x from where we started tracking, down 73% from ATH, and 75% of circulating supply changed hands in 24 hours.
We started tracking AKE about 7 weeks ago, when price was sitting in the 0.0005 to 0.0006 range. Back then we were seeing aggressive wallet accumulation onchain. In the earlier post, measured against the ATH at the time of 0.16400, we called it roughly a 90x move.
The move didn't stop there. AKE went on to set a new ATH at 0.1647. Measured from where we started tracking, that's around 300x.
Now the picture has turned hard. Price is at 0.053, down 73% from ATH. Over the last 24 hours the high was 0.1526 and the low 0.0312, a gap of nearly 5x.
The volume is extraordinary. 16.5 billion AKE traded in the last 24 hours. Circulating supply is around 21.9 billion, so 75% of circulating supply changed hands in a single day. OI collapsed 71% over the same stretch, leverage has largely been flushed out.
Right now an ERC1967Proxy contract is distributing to dozens of wallets. The amounts aren't random: figures like 83.333M, 41.667M and 33.333M keep repeating, and those are an allocation split into monthly fractions. In other words, a scheduled vesting distribution. The contract held 9 billion tokens, and 6 billion remain.
There's an important detail here: the wallets receiving the distribution are holding, not sending to exchanges. So the 73% drop from ATH wasn't triggered by these vesting recipients. What carried the drop was the leverage flush, visible in the 71% collapse in OI.
But the real question hasn't been answered yet. 6 billion tokens are still sitting in the contract. That's $267M at current price, and equal to 27% of current circulating supply. On top of that, the 3 billion already distributed are sitting in the receiving wallets.
On the way up, liquid supply was shrinking, and that was the mechanism feeding the move. Now locked supply is being released, so the same mechanism is running in reverse. What decides it is whether the receiving wallets keep holding.
Around 300x from where we started tracking, down 73% from ATH, and 75% of circulating supply changed hands in 24 hours.
We started tracking AKE about 7 weeks ago, when price was sitting in the 0.0005 to 0.0006 range. Back then we were seeing aggressive wallet accumulation onchain. In the earlier post, measured against the ATH at the time of 0.16400, we called it roughly a 90x move.
The move didn't stop there. AKE went on to set a new ATH at 0.1647. Measured from where we started tracking, that's around 300x.
Now the picture has turned hard. Price is at 0.053, down 73% from ATH. Over the last 24 hours the high was 0.1526 and the low 0.0312, a gap of nearly 5x.
The volume is extraordinary. 16.5 billion AKE traded in the last 24 hours. Circulating supply is around 21.9 billion, so 75% of circulating supply changed hands in a single day. OI collapsed 71% over the same stretch, leverage has largely been flushed out.
Right now an ERC1967Proxy contract is distributing to dozens of wallets. The amounts aren't random: figures like 83.333M, 41.667M and 33.333M keep repeating, and those are an allocation split into monthly fractions. In other words, a scheduled vesting distribution. The contract held 9 billion tokens, and 6 billion remain.
There's an important detail here: the wallets receiving the distribution are holding, not sending to exchanges. So the 73% drop from ATH wasn't triggered by these vesting recipients. What carried the drop was the leverage flush, visible in the 71% collapse in OI.
But the real question hasn't been answered yet. 6 billion tokens are still sitting in the contract. That's $267M at current price, and equal to 27% of current circulating supply. On top of that, the 3 billion already distributed are sitting in the receiving wallets.
On the way up, liquid supply was shrinking, and that was the mechanism feeding the move. Now locked supply is being released, so the same mechanism is running in reverse. What decides it is whether the receiving wallets keep holding.
2
44
·
--
🚨 $BR WHALE JUST UNLOCKED A MASSIVE PROFIT
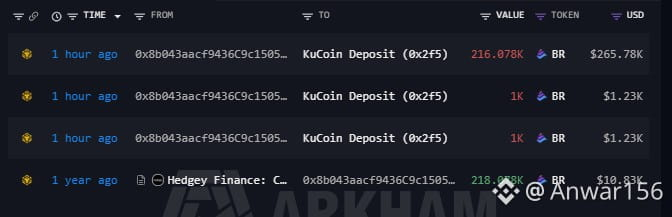
One year ago, a single wallet claimed 218,078 $BR through Hedgey Finance at roughly $0.049 per token.
Fast forward to today:
• 218,078 BR deposited to KuCoin
• Deposit value: $268.24K
• Average price: $1.23
• Initial value: $10.83K
• Gain: +2,370% (~25x)
The wallet first made two 1K $BR test deposits before sending the remaining bag to KuCoin.
Hedgey Claim ➝ 1K Test Deposits ➝ Full KuCoin Deposit
That’s roughly $257K+ in unrealized/realized value appreciation from the original allocation.
Now the key question: how much selling pressure can this whale create on $BR?
{future}(BRUSDT)
🚨 $BR WHALE JUST UNLOCKED A MASSIVE PROFIT
One year ago, a single wallet claimed 218,078 $BR through Hedgey Finance at roughly $0.049 per token.
Fast forward to today:
• 218,078 BR deposited to KuCoin
• Deposit value: $268.24K
• Average price: $1.23
• Initial value: $10.83K
• Gain: +2,370% (~25x)
The wallet first made two 1K $BR test deposits before sending the remaining bag to KuCoin.
Hedgey Claim ➝ 1K Test Deposits ➝ Full KuCoin Deposit
That’s roughly $257K+ in unrealized/realized value appreciation from the original allocation.
Now the key question: how much selling pressure can this whale create on $BR ?
One year ago, a single wallet claimed 218,078 $BR through Hedgey Finance at roughly $0.049 per token.
Fast forward to today:
• 218,078 BR deposited to KuCoin
• Deposit value: $268.24K
• Average price: $1.23
• Initial value: $10.83K
• Gain: +2,370% (~25x)
The wallet first made two 1K $BR test deposits before sending the remaining bag to KuCoin.
Hedgey Claim ➝ 1K Test Deposits ➝ Full KuCoin Deposit
That’s roughly $257K+ in unrealized/realized value appreciation from the original allocation.
Now the key question: how much selling pressure can this whale create on $BR ?
2
13
16.7k
·
--
guys checked top holders on $ZETA and this is one of the cleaner ones I have seen 👀
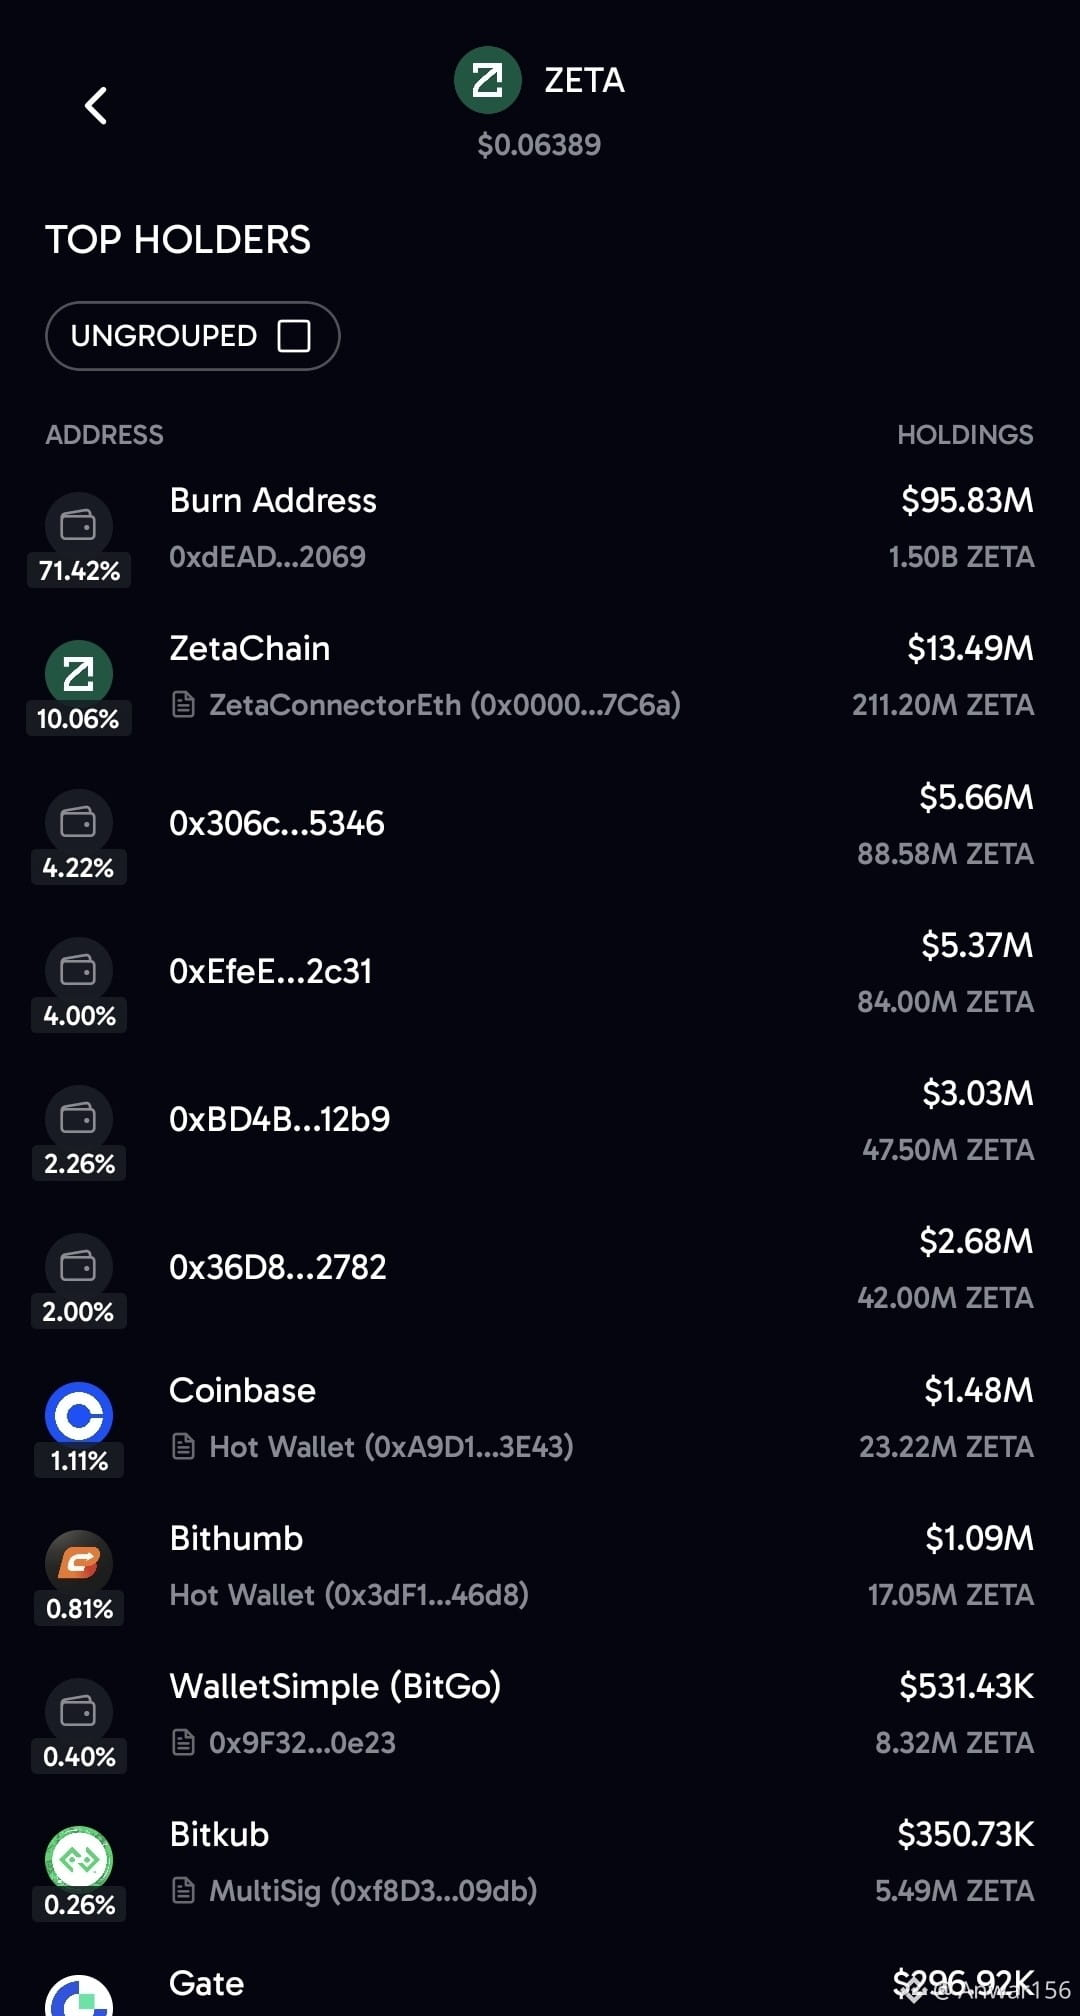
71.4% of total supply sits in a burn address that is permanently gone from circulation not a whale not a team wallet just removed forever
after that ZetaChain's own connector contract holds 10% which is protocol infrastructure not a tradeable position
the rest is spread across individual wallets in the low single digits plus normal exchange wallets Coinbase Bithumb BitGo Bitkub Gate none of them holding more than about 1%
this is what a healthy distribution actually looks like real float is small once you remove the burned supply and nobody outside the protocol itself is sitting on a dominant stack
good reminder that top holder percentage alone means nothing until you check what each wallet actually is
anyone else checking burn percentages before judging a token's holder concentration 👀
{future}(ZETAUSDT)
guys checked top holders on $ZETA and this is one of the cleaner ones I have seen 👀
71.4% of total supply sits in a burn address that is permanently gone from circulation not a whale not a team wallet just removed forever
after that ZetaChain's own connector contract holds 10% which is protocol infrastructure not a tradeable position
the rest is spread across individual wallets in the low single digits plus normal exchange wallets Coinbase Bithumb BitGo Bitkub Gate none of them holding more than about 1%
this is what a healthy distribution actually looks like real float is small once you remove the burned supply and nobody outside the protocol itself is sitting on a dominant stack
good reminder that top holder percentage alone means nothing until you check what each wallet actually is
anyone else checking burn percentages before judging a token's holder concentration 👀
71.4% of total supply sits in a burn address that is permanently gone from circulation not a whale not a team wallet just removed forever
after that ZetaChain's own connector contract holds 10% which is protocol infrastructure not a tradeable position
the rest is spread across individual wallets in the low single digits plus normal exchange wallets Coinbase Bithumb BitGo Bitkub Gate none of them holding more than about 1%
this is what a healthy distribution actually looks like real float is small once you remove the burned supply and nobody outside the protocol itself is sitting on a dominant stack
good reminder that top holder percentage alone means nothing until you check what each wallet actually is
anyone else checking burn percentages before judging a token's holder concentration 👀
1
235
·
--
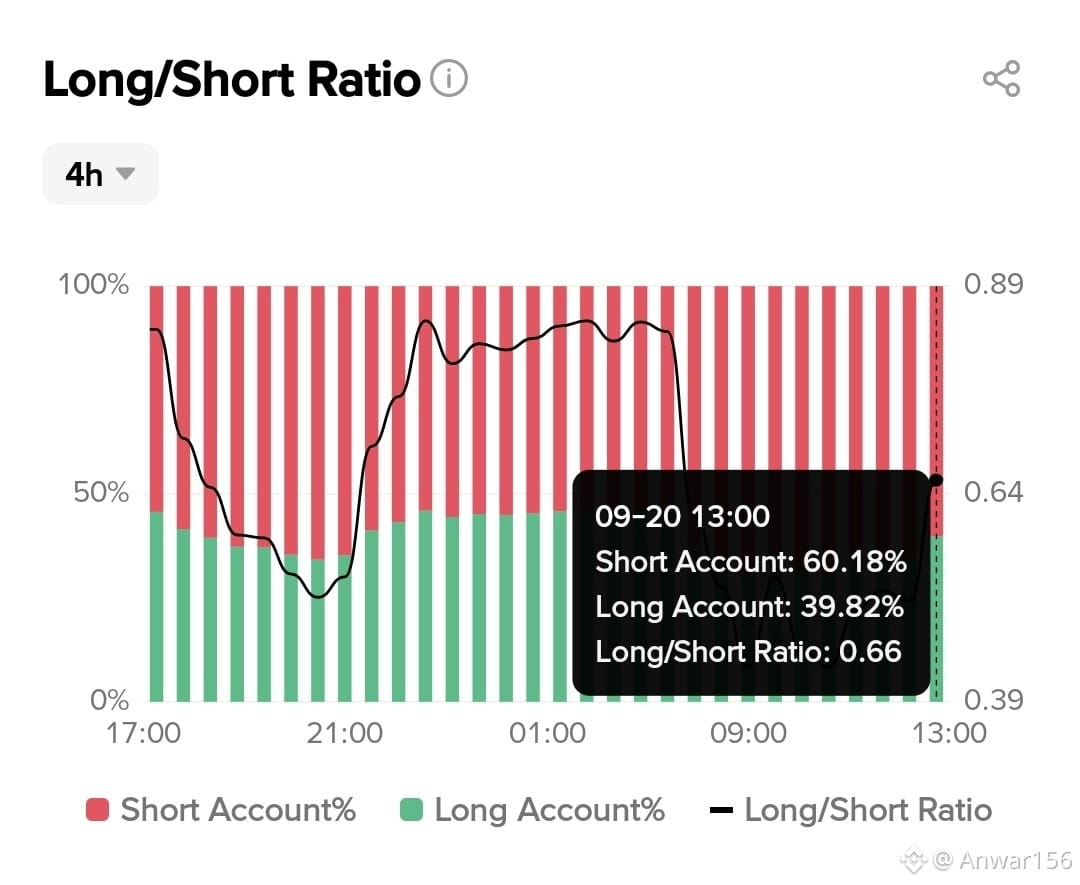
guys $AKE long short ratio just flipped hard 👀
right now shorts are sitting at 60% of accounts longs down at just under 40% ratio reading 0.66 that is a real skew toward shorts
what stands out is this was not always the case earlier in the session longs and shorts were almost balanced close to 50 50 for hours then shorts pushed sharply ahead in the last stretch leading into now
when positioning gets this lopsided one way it is always worth asking if the crowd is right or if this is exactly the kind of setup that gets squeezed
not calling a direction here just flagging how fast this flipped
do you think heavy short positioning like this means #AKE keeps falling or is this setting up a squeeze 👀
{future}(AKEUSDT)
guys $AKE long short ratio just flipped hard 👀
right now shorts are sitting at 60% of accounts longs down at just under 40% ratio reading 0.66 that is a real skew toward shorts
what stands out is this was not always the case earlier in the session longs and shorts were almost balanced close to 50 50 for hours then shorts pushed sharply ahead in the last stretch leading into now
when positioning gets this lopsided one way it is always worth asking if the crowd is right or if this is exactly the kind of setup that gets squeezed
not calling a direction here just flagging how fast this flipped
do you think heavy short positioning like this means #AKE keeps falling or is this setting up a squeeze 👀
right now shorts are sitting at 60% of accounts longs down at just under 40% ratio reading 0.66 that is a real skew toward shorts
what stands out is this was not always the case earlier in the session longs and shorts were almost balanced close to 50 50 for hours then shorts pushed sharply ahead in the last stretch leading into now
when positioning gets this lopsided one way it is always worth asking if the crowd is right or if this is exactly the kind of setup that gets squeezed
not calling a direction here just flagging how fast this flipped
do you think heavy short positioning like this means #AKE keeps falling or is this setting up a squeeze 👀
2
377
·
--
🚨 Forget the Gate Dumps — Watch the $13.8M $AKE Wall on Binance
Our earlier tracking spotted $535K in vested $AKE being aggressively moved toward MEXC and Gate.
But the bigger development happened hours earlier on Binance.
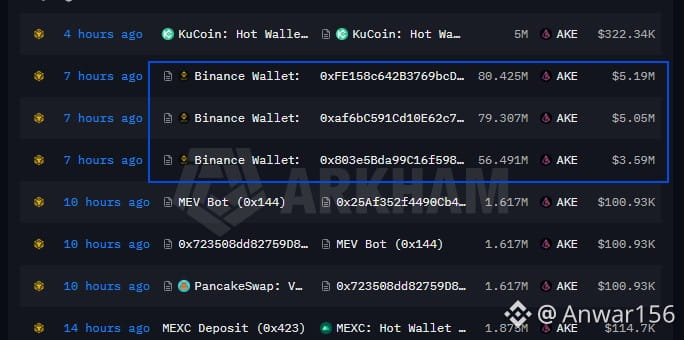
Seven hours ago, three Binance-associated wallets received massive AKE transfers:
• 80.425M AKE — $5.19M
• 79.307M AKE — $5.05M
• 56.491M AKE — $3.59M
That’s more than 216M AKE worth ~$13.83M sitting across Binance-linked wallets while AKE was entering a +90% daily squeeze.
The timing matters.
While smaller exchange deposits are being flagged, this much larger Binance-side supply is already positioned around the market.
If that supply reaches execution books, the liquidity available to absorb the retail bid could change quickly.
⚠️ $13.8M of $AKE is the number I’m watching now.
Chasing the middle of a vertical squeeze comes with serious supply and reversal risk.
Watch the Binance wallets. Watch the sell-side liquidity. Don’t ignore the flow.
🚨 Forget the Gate Dumps — Watch the $13.8M $AKE Wall on Binance
Our earlier tracking spotted $535K in vested $AKE being aggressively moved toward MEXC and Gate.
But the bigger development happened hours earlier on Binance.
Seven hours ago, three Binance-associated wallets received massive AKE transfers:
• 80.425M AKE — $5.19M
• 79.307M AKE — $5.05M
• 56.491M AKE — $3.59M
That’s more than 216M AKE worth ~$13.83M sitting across Binance-linked wallets while AKE was entering a +90% daily squeeze.
The timing matters.
While smaller exchange deposits are being flagged, this much larger Binance-side supply is already positioned around the market.
If that supply reaches execution books, the liquidity available to absorb the retail bid could change quickly.
⚠️ $13.8M of $AKE is the number I’m watching now.
Chasing the middle of a vertical squeeze comes with serious supply and reversal risk.
Watch the Binance wallets. Watch the sell-side liquidity. Don’t ignore the flow.
Our earlier tracking spotted $535K in vested $AKE being aggressively moved toward MEXC and Gate.
But the bigger development happened hours earlier on Binance.
Seven hours ago, three Binance-associated wallets received massive AKE transfers:
• 80.425M AKE — $5.19M
• 79.307M AKE — $5.05M
• 56.491M AKE — $3.59M
That’s more than 216M AKE worth ~$13.83M sitting across Binance-linked wallets while AKE was entering a +90% daily squeeze.
The timing matters.
While smaller exchange deposits are being flagged, this much larger Binance-side supply is already positioned around the market.
If that supply reaches execution books, the liquidity available to absorb the retail bid could change quickly.
⚠️ $13.8M of $AKE is the number I’m watching now.
Chasing the middle of a vertical squeeze comes with serious supply and reversal risk.
Watch the Binance wallets. Watch the sell-side liquidity. Don’t ignore the flow.
3
354
·
--
🚨 $AKE JUST TURNED INTO A SHORT-SQUEEZE NIGHTMARE.
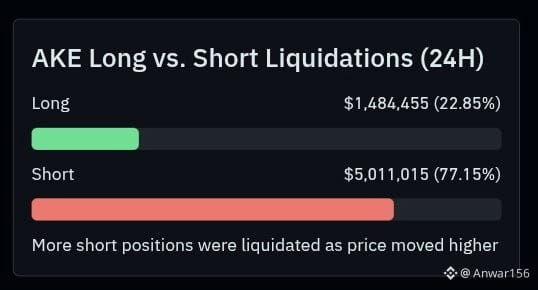
More than $5M in shorts were completely wiped out as the 155%+ volatility explosion accelerated.
• Total Liquidations: $6.49M
• Short Wipeout: $5.01M (77.15% of all liquidations)
• Traders Liquidated: 6,077 worldwide
• Intensity: 3.62x extreme vs the 7-day average
Between 10:00 and 11:00 today, the squeeze reached maximum speed.
Late shorts were caught on the wrong side, triggering forced buybacks that added even more fuel to the move as price pushed into overhead liquidity.
With 77.15% of all liquidations coming from shorts, the squeeze was heavily driven by trapped positions being forced out.
$AKE really said:
NO SHORTS.
NO LONGS.
NOBODY IS SAFE. 😤🔥
Are you already in a trade on $AKE?
{future}(AKEUSDT)
🚨 $AKE JUST TURNED INTO A SHORT-SQUEEZE NIGHTMARE.
More than $5M in shorts were completely wiped out as the 155%+ volatility explosion accelerated.
• Total Liquidations: $6.49M
• Short Wipeout: $5.01M (77.15% of all liquidations)
• Traders Liquidated: 6,077 worldwide
• Intensity: 3.62x extreme vs the 7-day average
Between 10:00 and 11:00 today, the squeeze reached maximum speed.
Late shorts were caught on the wrong side, triggering forced buybacks that added even more fuel to the move as price pushed into overhead liquidity.
With 77.15% of all liquidations coming from shorts, the squeeze was heavily driven by trapped positions being forced out.
$AKE really said:
NO SHORTS.
NO LONGS.
NOBODY IS SAFE. 😤🔥
Are you already in a trade on $AKE ?
More than $5M in shorts were completely wiped out as the 155%+ volatility explosion accelerated.
• Total Liquidations: $6.49M
• Short Wipeout: $5.01M (77.15% of all liquidations)
• Traders Liquidated: 6,077 worldwide
• Intensity: 3.62x extreme vs the 7-day average
Between 10:00 and 11:00 today, the squeeze reached maximum speed.
Late shorts were caught on the wrong side, triggering forced buybacks that added even more fuel to the move as price pushed into overhead liquidity.
With 77.15% of all liquidations coming from shorts, the squeeze was heavily driven by trapped positions being forced out.
$AKE really said:
NO SHORTS.
NO LONGS.
NOBODY IS SAFE. 😤🔥
Are you already in a trade on $AKE ?
2
288
Log in to explore more content
Join global crypto users on Binance Square
⚡️ Get latest and useful information about crypto.
💬 Trusted by the world’s largest crypto exchange.
👍 Discover real insights from verified creators.
Email / Phone number