Binance Square

AtonXBT

Not Financial Advice
High-Frequency Trader
4.2 Years
4 Following
156 Followers
191 Liked
Posts
·
--
$AIN will fall hard soon. Net inflow reaches -400k but still the price is moving sideways, positive funding rate is decreasing. I think this is a bull trap.
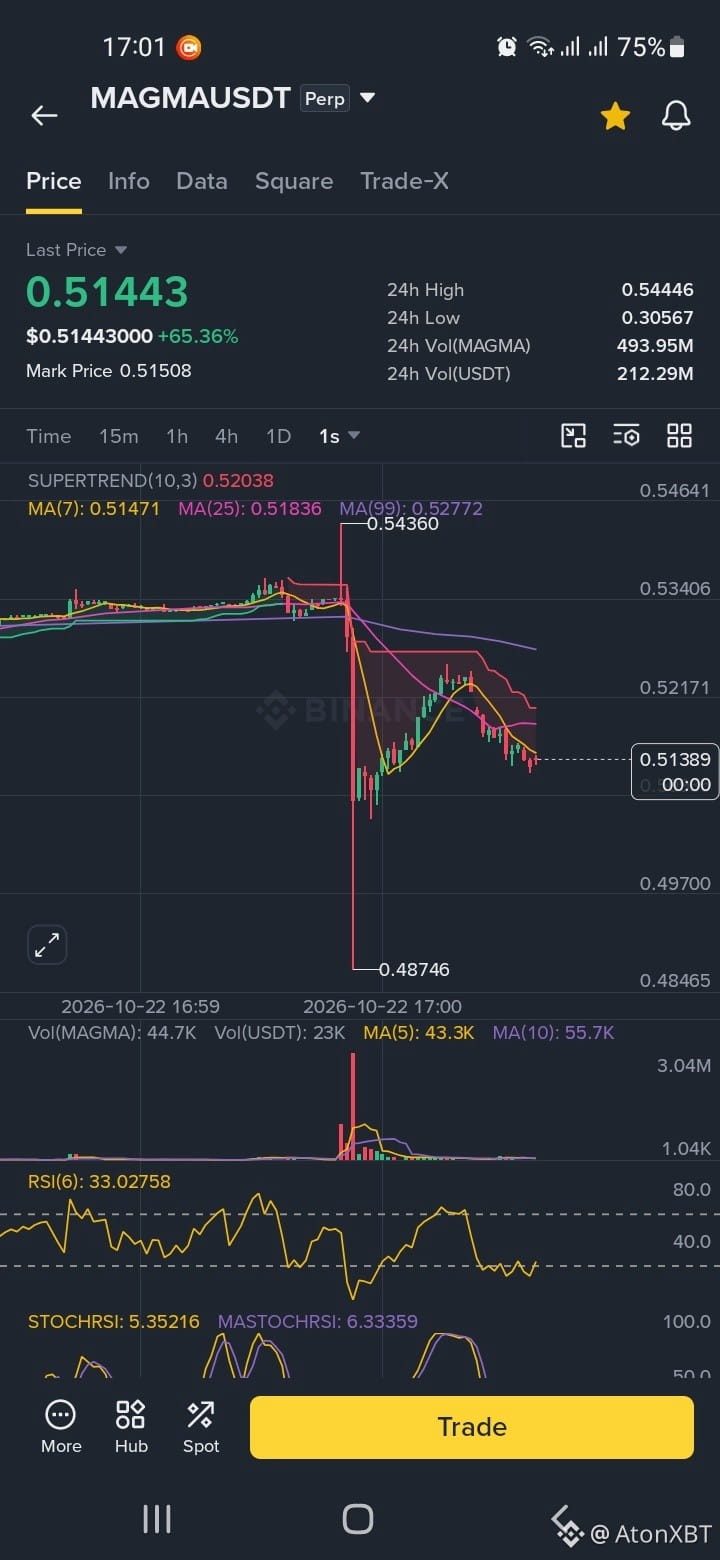
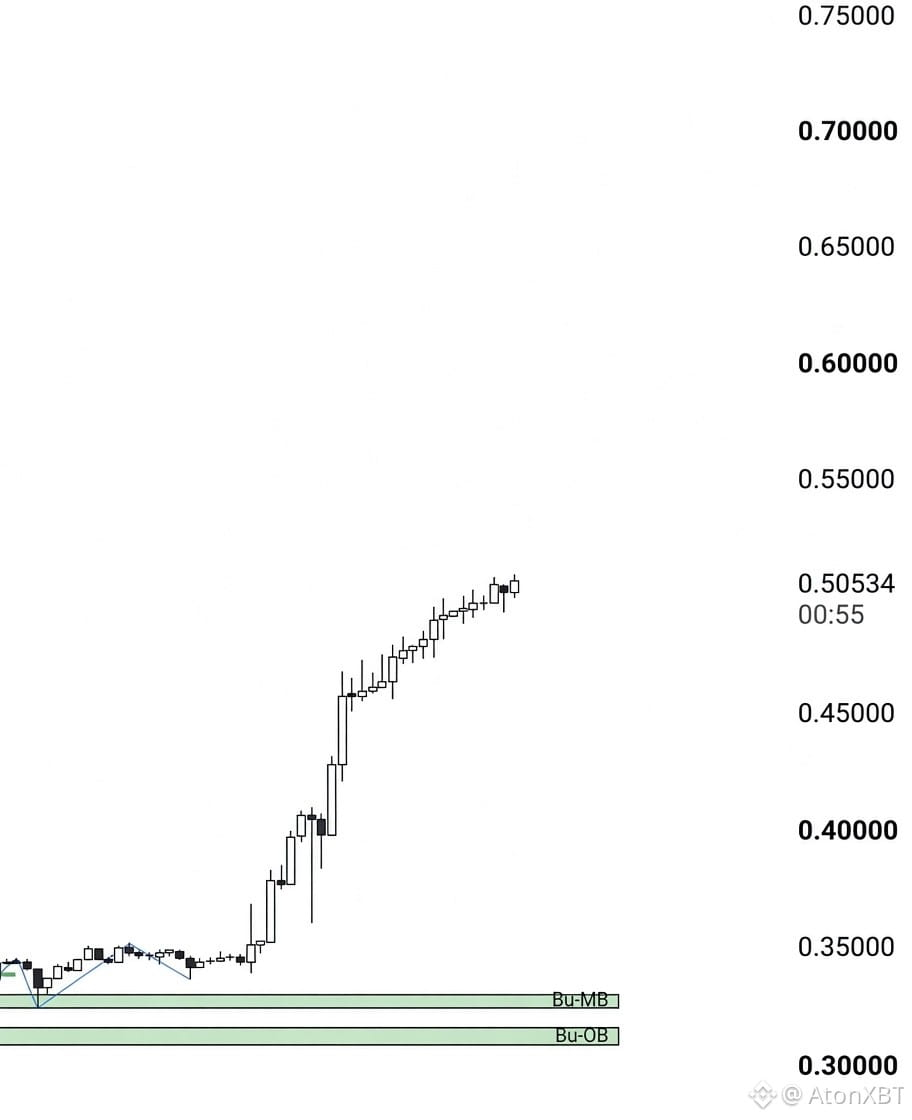
$MAGMA I'm getting really impatient. it's just more and more consolidation.......... When distribution?
·
--
Bearish
$MAGMA and just a few min later...... Absolute cinema 💸
AtonXBT
·
--
$MAGMA Smaller timeframes looks like a pumpfun token before rug pull scenario
$MAGMA | Short BiasPrice action has been aggressive on the upside, but the tape is telling a different story underneath.Order flow shows clear absorption: sell-side liquidity consistently outweighs buy-side, yet price continues to grind higher. Someone is stepping in front of the selling pressure to keep the move alive. That works until it doesn’t. As price extends, the size of those resting sells is increasing — classic sign that the absorption is becoming more expensive and less sustainable. Positioning is heavily skewed. Longs are overcrowded relative to shorts. When the majority is already leaning one way, the path of least resistance usually flips the other direction once the bid support cracks.Technically, we’re sitting in extreme overbought territory. Momentum is stretched and the risk/reward on the long side is deteriorating fast. Pullbacks from these levels tend to be sharp once the bid steps away.Trade plan:Bias: Short Entry: Current levels Stop: 0.5520 Target: 0.3772 Not fighting the trend for sport — the order flow, positioning, and momentum extremes are aligning for a mean-reversion move. Watching closely for any acceleration in sell absorption or a break in the higher-high structure.
$MAGMA | Short BiasPrice

action has been aggressive on the upside, but the tape is telling a different story underneath.Order flow shows clear absorption: sell-side liquidity consistently outweighs buy-side, yet price continues to grind higher.

Someone is stepping in front of the selling pressure to keep the move alive. That works until it doesn’t. As price extends, the size of those resting sells is increasing — classic sign that the absorption is becoming more expensive and less sustainable.

Positioning is heavily skewed. Longs are overcrowded relative to shorts. When the majority is already leaning one way, the path of least resistance usually flips the other direction once the bid support cracks.Technically, we’re sitting in extreme overbought territory.

Momentum is stretched and the risk/reward on the long side is deteriorating fast. Pullbacks from these levels tend to be sharp once the bid steps away.Trade plan:Bias: Short

Entry: Current levels
Stop: 0.5520
Target: 0.3772

Not fighting the trend for sport — the order flow, positioning, and momentum extremes are aligning for a mean-reversion move. Watching closely for any acceleration in sell absorption or a break in the higher-high structure.
·
--
Bullish
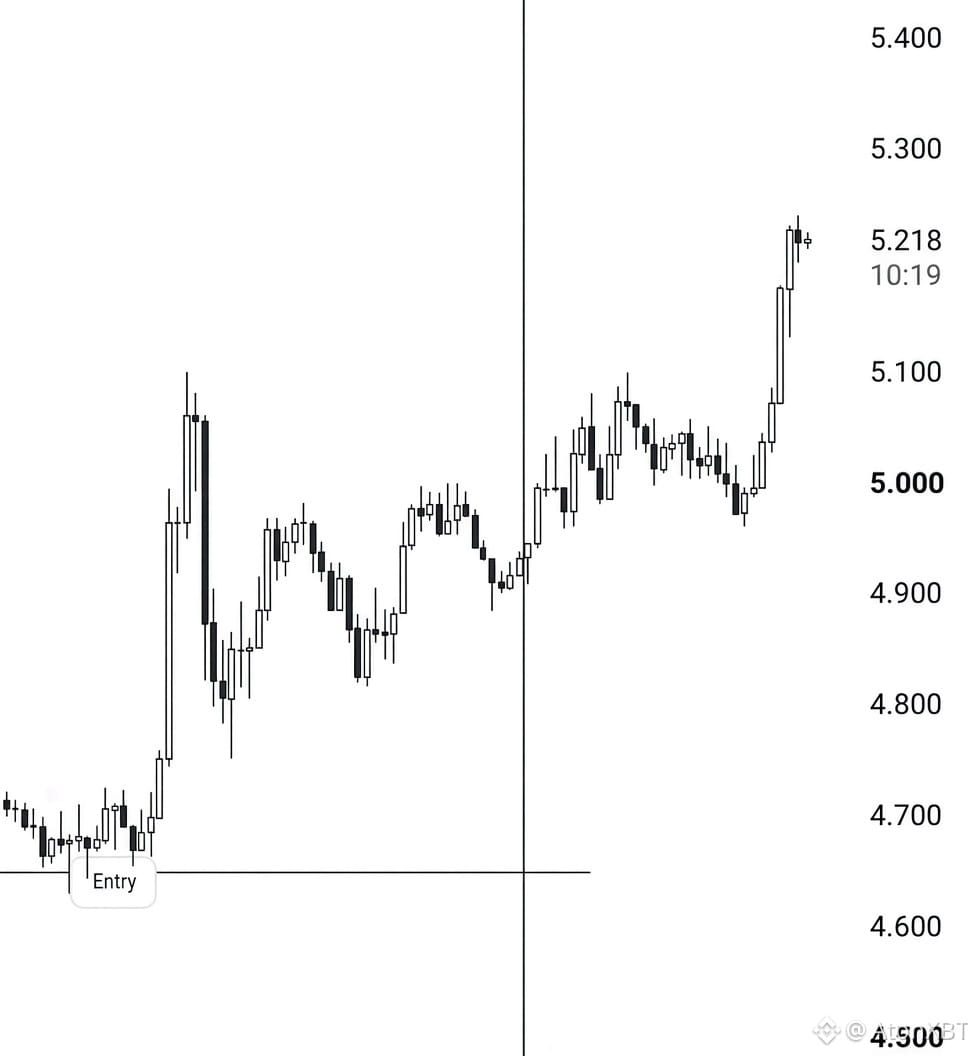
$NEAR just smashed our target! Long was opned at 4.672 Time: 20/10/2026 | 12:34 UTC Duration: 19h 15m Our primary target done: 121.14% (10xlev) You were warned! {future}(NEARUSDT)
$NEAR just smashed our target!

Long was opned at 4.672
Time: 20/10/2026 | 12:34 UTC
Duration: 19h 15m

Our primary target done: 121.14% (10xlev)

You were warned!
AtonXBT
·
--
Bullish
Going long on $NEAR

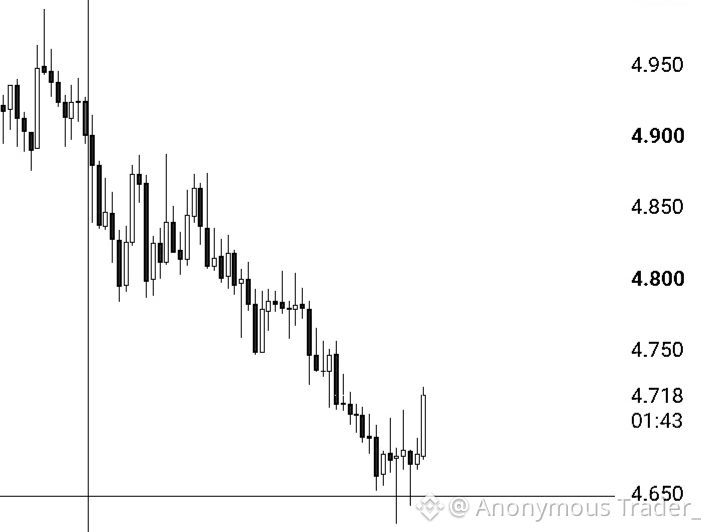
The previous support lies in this area. So currently we're sitting at the demand zone but there's also some liquidity bellow $4.6 but I think buyers are absorbing the selling pressure. So in short term the market is kinda bullish.

My SL is at $4.4 and TP at $5.1

#DYOR

$NEAR
·
--
Bullish
Going long on $NEAR The previous support lies in this area. So currently we're sitting at the demand zone but there's also some liquidity bellow $4.6 but I think buyers are absorbing the selling pressure. So in short term the market is kinda bullish. My SL is at $4.4 and TP at $5.1 #DYOR $NEAR
Going long on $NEAR

The previous support lies in this area. So currently we're sitting at the demand zone but there's also some liquidity bellow $4.6 but I think buyers are absorbing the selling pressure. So in short term the market is kinda bullish.

My SL is at $4.4 and TP at $5.1

#DYOR

$NEAR
·
--
Bullish
$WAL Is looking very bullish right now. Currently the price is in the overbrought area, so we might see a short correction. You can enter a long position right now with low levarage. Also there a lot of short positon liquidity clusters around 0.07 area which can push the price even higher. {future}(WALUSDT) Here are my entry, tp and sl given bellow. Levarage: 3-5x Entry: 0.05498-0.05640 TP,1: 0.05921 TP,2: 0.06244 TP,3: 0.06837 TP,4: 0.07113 SL: 0.04886
$WAL Is looking very bullish right now. Currently the price is in the overbrought area, so we might see a short correction. You can enter a long position right now with low levarage. Also there a lot of short positon liquidity clusters around 0.07 area which can push the price even higher.

Here are my entry, tp and sl given bellow.

Levarage: 3-5x

Entry: 0.05498-0.05640

TP,1: 0.05921
TP,2: 0.06244
TP,3: 0.06837
TP,4: 0.07113

SL: 0.04886
·
--
Bullish
$STRK net inflow is still positive. Whales are still holding. Also short positions are increasing rapidly. There's more liquidity above then bellow so as long as the retailers keeps increasing short positions, it'll work as the fuel for next pumps. My target is around $0.15-0.16 area. #dyor {future}(STRKUSDT)
$STRK net inflow is still positive. Whales are still holding. Also short positions are increasing rapidly. There's more liquidity above then bellow so as long as the retailers keeps increasing short positions, it'll work as the fuel for next pumps.

My target is around $0.15-0.16 area.

#dyor
·
--
Bullish
$MOVR might pump like $RIVER It has low supply. Also after analysing the volume closely, I noticed that bearish momentum has fallen. Bulls are gaining control. This token might reach $5-6 soon. DYOR! {future}(MOVRUSDT)
$MOVR might pump like $RIVER

It has low supply. Also after analysing the volume closely, I noticed that bearish momentum has fallen. Bulls are gaining control. This token might reach $5-6 soon.

DYOR!
·
--
Bullish
$MOVR Just broke a massive resistance level at 2.82 My next target sits around $3.4
$MOVR Just broke a massive resistance level at 2.82

My next target sits around $3.4
·
--
Bearish
Agreed
Agreed
Crypto4light
·
--
Bearish
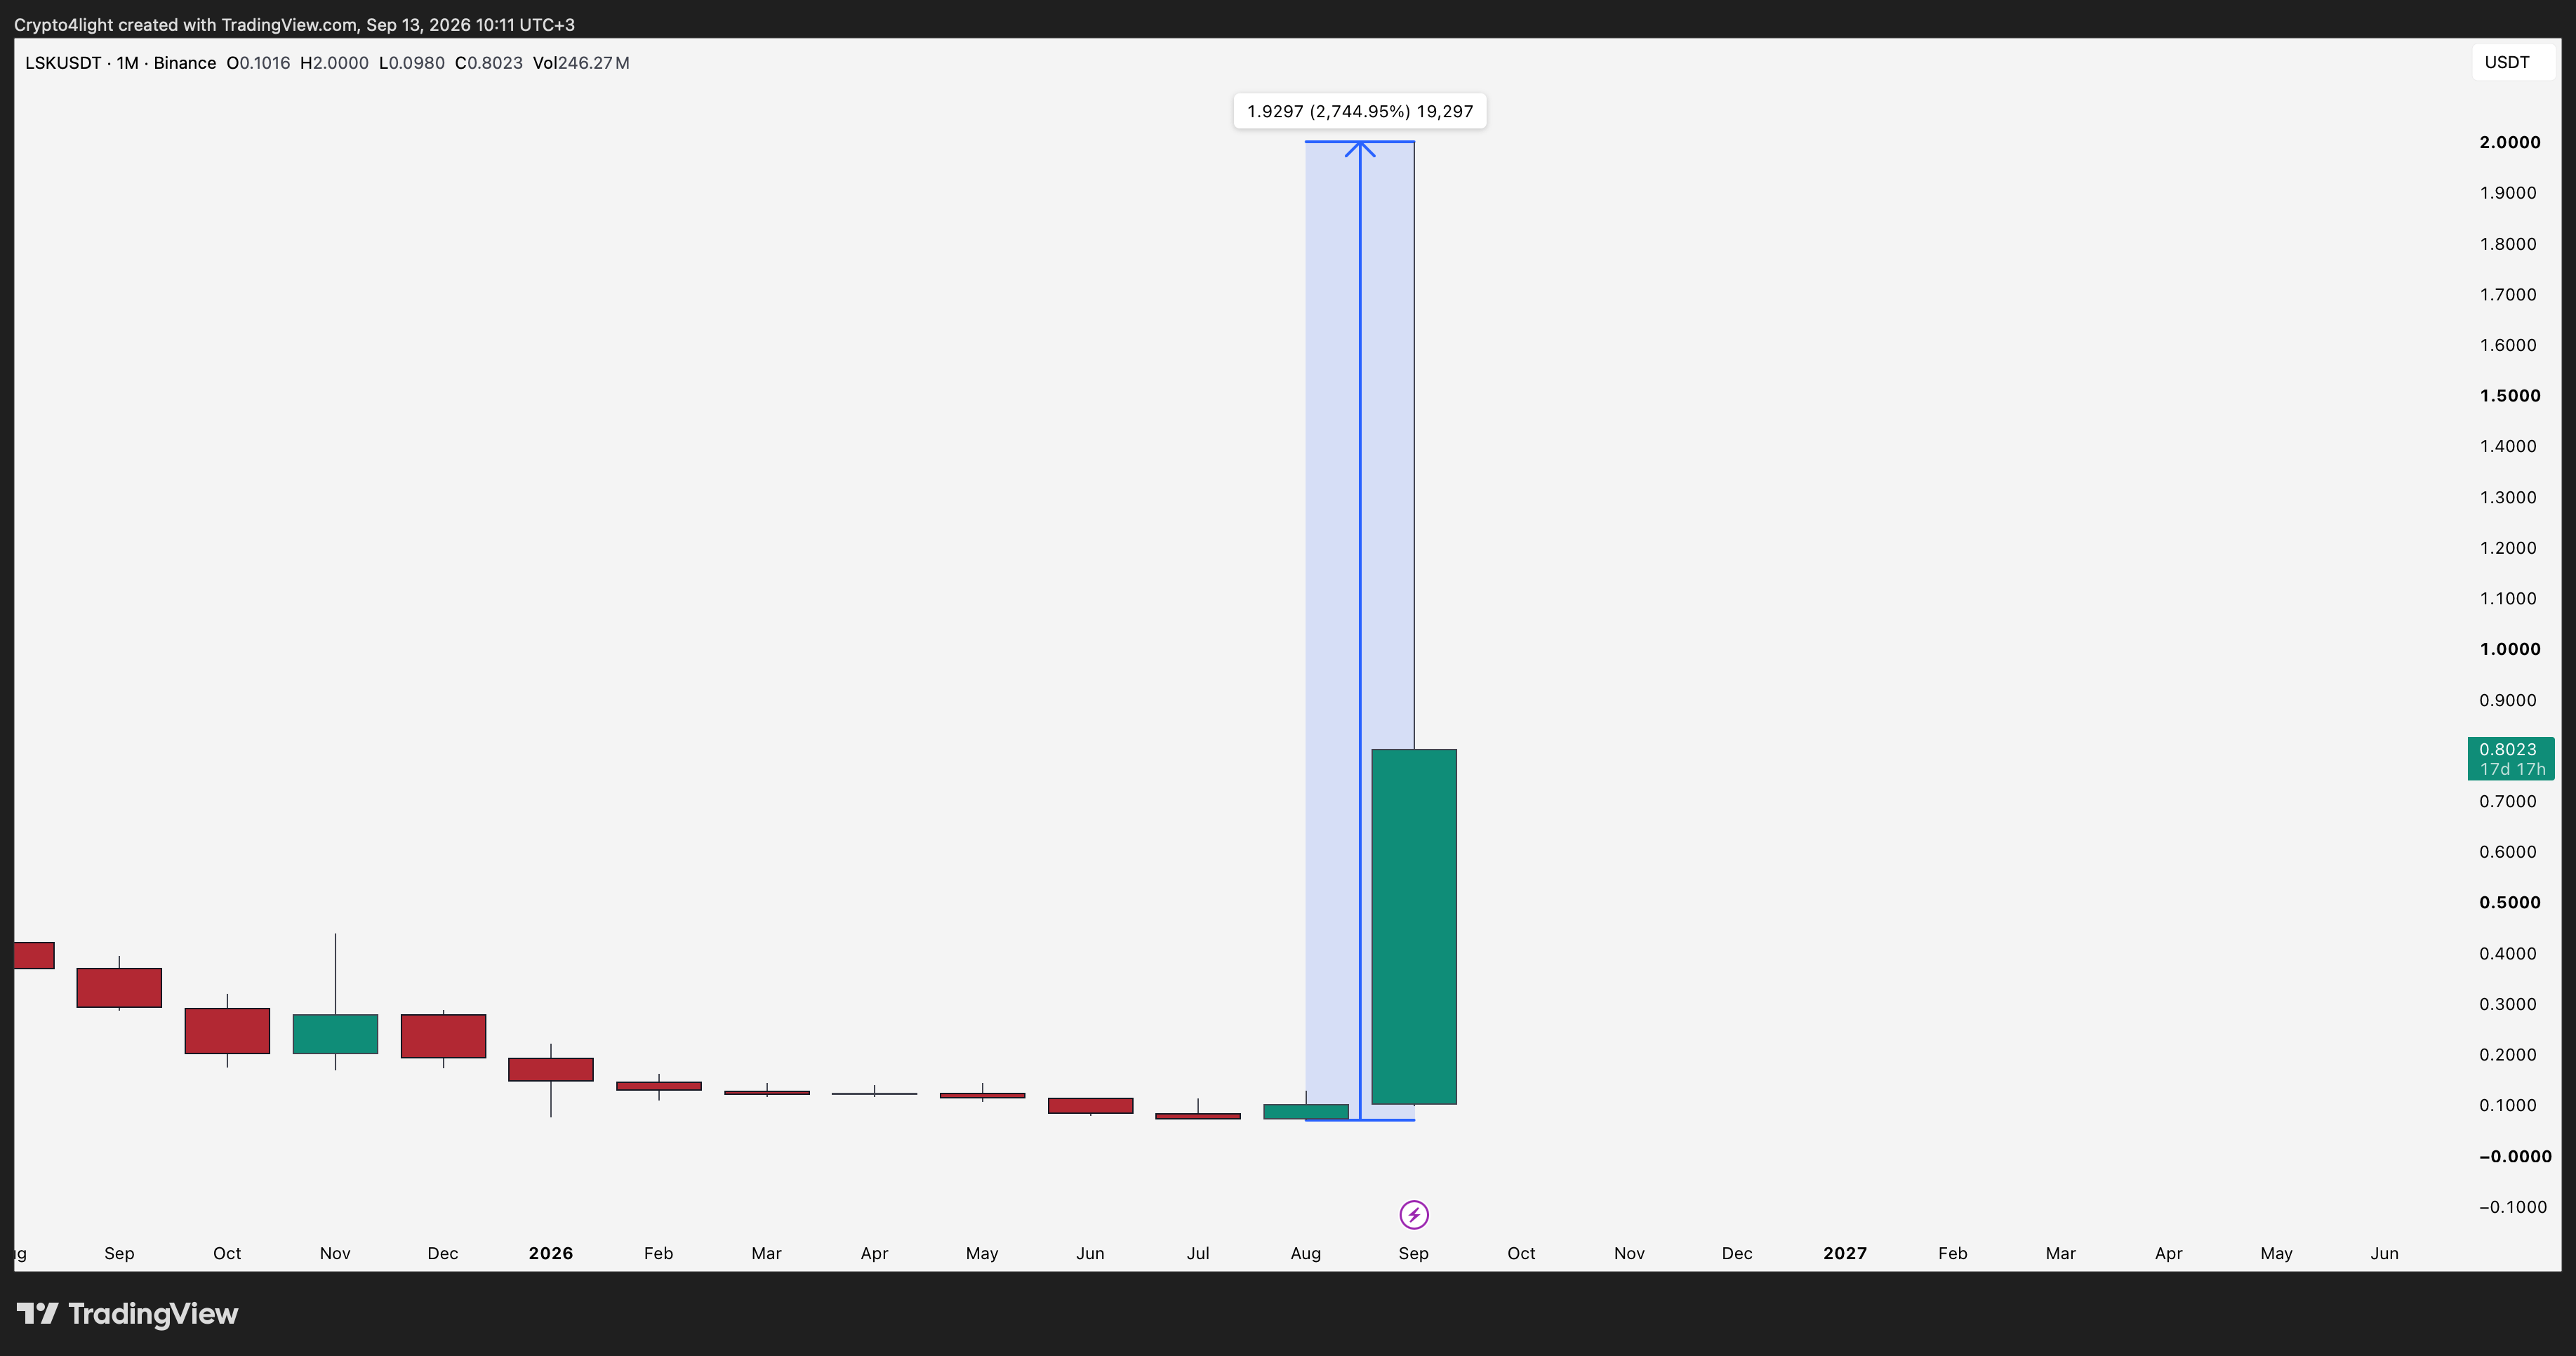
$LSK has been around since 2016. Just a couple of weeks ago, it revisited its 2017 all-time low because the market makers’ algorithm did exactly what it needed to do — and then the token exploded 2700% in just two months with only two candles!
What does this show us?
1. Any token is pure speculation.
So forget about all the fundamental research and all the bullshit influencers keep selling you about how “the chart is not the most important thing.”
The chart is actually one of the most important things. It shows us algorithmically WHERE the price can be pushed if the market makers decide to take it there at any given moment .
We know WHERE they can take the price.
We just don’t know WHEN.
Because we’re not insiders.
But we have other tools in our hands that can clearly show us the potential targets.
2. A “dead” token from 2016 can easily outperform supposedly fresh, cutting-edge tech tokens like Scroll, Starknet, ZRO, WLD, DYM, and plenty of other bs.
Funds don’t care what they make money on.
What matters is liquidity and areas of interest, not the bullshit projects post on social media about their tokens.
3. When you see a token pumping 1000–2700%, that is NOT the time to enter.
That could already be the final stage of its move — even if Bitcoin is still sitting near the lows and altseason indicators are also at low levels.
Why?
Because crypto bros have been brainwashed into thinking that tokens have to pump 10,000%.
The whole “Next 100x gem” narrative is just another stupid myth pushed by influencers.
Go back and study the charts.
During the massive 2021 bull run, many projects actually finished their major moves after gaining around 1300–1500%.
Look for tokens that are undervalued based on liquidity and algorithmic levels
A month ago, nobody was searching for LSK videos.
Now, after the pump, people are starting to search for it.
Do your own homework. 🔎 - click
$USELESS The resistance was around 0.22-0.24 and now it's broken so it shall fly. Also there's a lot of institutional absorption noticeable which is a very bullish sign. It's driven by pure hype with real inflow not fomo. So I believe it won't go down very easily. My TP is around 0.41 and SL at 0.26. I believe this coin has the potential to break the ATH. If you want to make a position, DYOR!
$USELESS The resistance was around 0.22-0.24 and now it's broken so it shall fly. Also there's a lot of institutional absorption noticeable which is a very bullish sign. It's driven by pure hype with real inflow not fomo. So I believe it won't go down very easily.

My TP is around 0.41 and SL at 0.26. I believe this coin has the potential to break the ATH.

If you want to make a position, DYOR!
·
--
Bearish
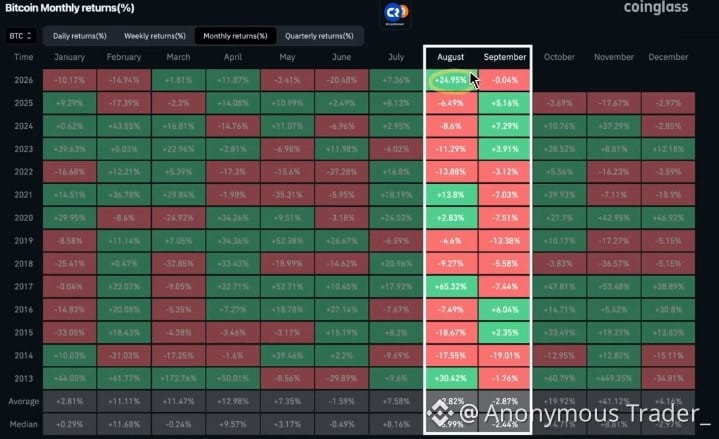
$BTC is going down as expected. I think this time it'll go bellow the support zone (76k) and the next support zone at 74k will open soon. Currently the BTC uptrend is completely broken and the market is testing the 76k level. I'm shorting BTC heavily currently while also purchasing short side leveraged ETF tokens. For those who's saying the bear market is over, Actually it isn't. Historically this is the 1st time when BTC price Pumped during August (In a bear market). And also the chart tells us whenever BTC pumped during August, it always dumped at September. {future}(BTCUSDT)
$BTC is going down as expected. I think this time it'll go bellow the support zone (76k) and the next support zone at 74k will open soon.

Currently the BTC uptrend is completely broken and the market is testing the 76k level.

I'm shorting BTC heavily currently while also purchasing short side leveraged ETF tokens.

For those who's saying the bear market is over, Actually it isn't.

Historically this is the 1st time when BTC price Pumped during August (In a bear market). And also the chart tells us whenever BTC pumped during August, it always dumped at September.
AtonXBT
·
--
Bearish
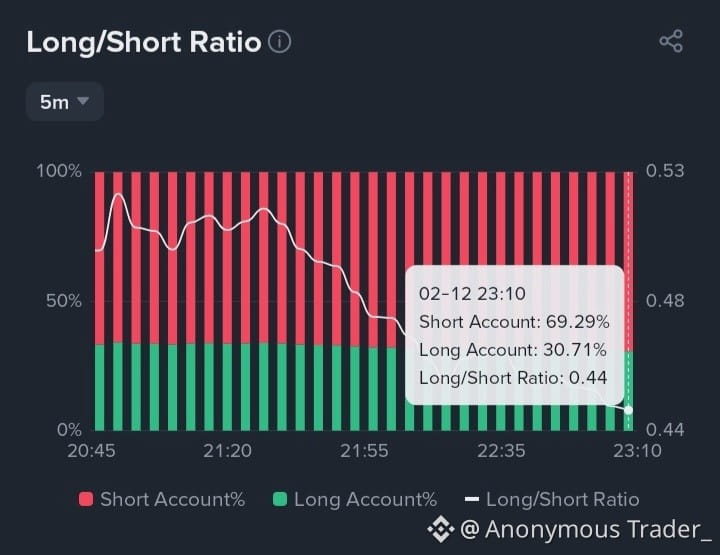
$BTC New resistance zone at 79.2k-79.6k.

Bitcoin will start to fall from here probably.

Target 74k-72k => 68k-62k
·
--
Bearish
$BTC New resistance zone at 79.2k-79.6k. Bitcoin will start to fall from here probably. Target 74k-72k => 68k-62k
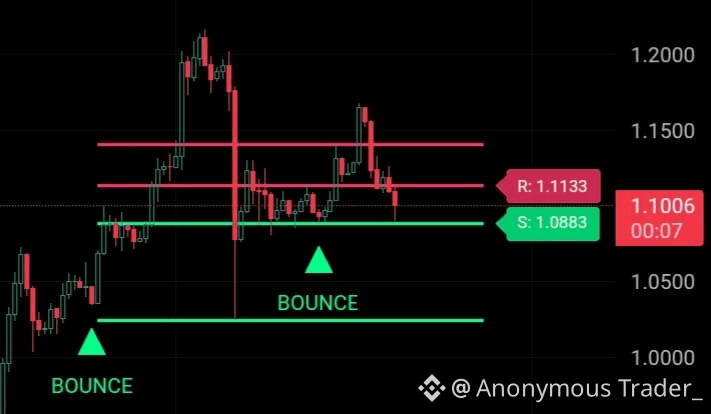
$BTC New resistance zone at 79.2k-79.6k.

Bitcoin will start to fall from here probably.

Target 74k-72k => 68k-62k
$PIPPIN Is just pure manipulation.
·
--
Bullish
$BTR Don't short it. There're too many short positions in the market currently. My advice is you should wait for a short squeeze and confirm the short entry then enter. Stay safe.
·
--
Bearish
$BTC Should go down towards 60k.
·
--
Bullish
Dimensional Support Resistance [JOAT] ◇Overview◇ Dimensional Support Resistance is an open-source overlay indicator that automatically detects and displays clean, non-overlapping support and resistance levels using pivot-based analysis with intelligent filtering. It identifies significant swing highs and lows, filters them by minimum distance to prevent visual clutter, and provides volume-confirmed bounce signals. What This Indicator Does? 《The indicator calculates and displays》 •Dynamic Pivot Levels - Automatically detected swing highs and lows based on configurable pivot strength •Distance Filtering - Ensures levels are spaced apart by a minimum percentage to prevent overlap •S/R Zones - Visual zones around each level showing the price area of significance •Bounce Detection - Identifies when price reverses at support or resistance levels •Volume Confirmation - Strong signals require above-average volume for confirmation #beat $BEAT {future}(BEATUSDT)
Dimensional Support Resistance [JOAT]

◇Overview◇
Dimensional Support Resistance is an open-source overlay indicator that automatically detects and displays clean, non-overlapping support and resistance levels using pivot-based analysis with intelligent filtering. It identifies significant swing highs and lows, filters them by minimum distance to prevent visual clutter, and provides volume-confirmed bounce signals.

What This Indicator Does?

《The indicator calculates and displays》

•Dynamic Pivot Levels - Automatically detected swing highs and lows based on configurable pivot strength
•Distance Filtering - Ensures levels are spaced apart by a minimum percentage to prevent overlap
•S/R Zones - Visual zones around each level showing the price area of significance
•Bounce Detection - Identifies when price reverses at support or resistance levels
•Volume Confirmation - Strong signals require above-average volume for confirmation

#beat $BEAT
Log in to explore more content
Join global crypto users on Binance Square
⚡️ Get latest and useful information about crypto.
💬 Trusted by the world’s largest crypto exchange.
👍 Discover real insights from verified creators.
Email / Phone number
Sitemap
Cookie Preferences
Platform T&Cs