

An2eGraund
В трейдинге 5 лет
9 Following
61 Followers
162 Liked
Posts
All
Quotes
PINNED




Maksym Mykhailovskyi
·
--
In the photo — 38-year-old grandmother and her 20-year-old daughter, although it is almost impossible to believe from the outside
The internet has once again brought a story that makes people first guess who is who instead of reading. The 38-year-old Californian Brittany Desboro went viral: she is constantly mistaken for her sister or even “twin” of her own 20-year-old daughter. The media reports that Brittany gave birth at 17, and later her daughter also became a mother at a young age, which is why by the age of 38, Brittany herself has already become a grandmother.
The most captivating aspect of this story is not even the age, but the feeling of a complete breakdown in family chronology. From the outside, it looks like the internet has thrown in not a photo of relatives, but a visual puzzle: the mother and daughter look almost like sisters, and the status of “grandmother” does not match the picture for many. This is precisely why such stories go viral — people enjoy it when reality breaks their usual patterns faster than they can write “I don’t believe it.”
The irony is that the internet has once again worked predictably: instead of a calm reaction, eternal debates began about who looks younger, who “resembles mom more,” and whether it is even possible to tell age by sight.
The internet has once again brought a story that makes people first guess who is who instead of reading. The 38-year-old Californian Brittany Desboro went viral: she is constantly mistaken for her sister or even “twin” of her own 20-year-old daughter. The media reports that Brittany gave birth at 17, and later her daughter also became a mother at a young age, which is why by the age of 38, Brittany herself has already become a grandmother.
The most captivating aspect of this story is not even the age, but the feeling of a complete breakdown in family chronology. From the outside, it looks like the internet has thrown in not a photo of relatives, but a visual puzzle: the mother and daughter look almost like sisters, and the status of “grandmother” does not match the picture for many. This is precisely why such stories go viral — people enjoy it when reality breaks their usual patterns faster than they can write “I don’t believe it.”
The irony is that the internet has once again worked predictably: instead of a calm reaction, eternal debates began about who looks younger, who “resembles mom more,” and whether it is even possible to tell age by sight.




Maya BNB 1
·
--
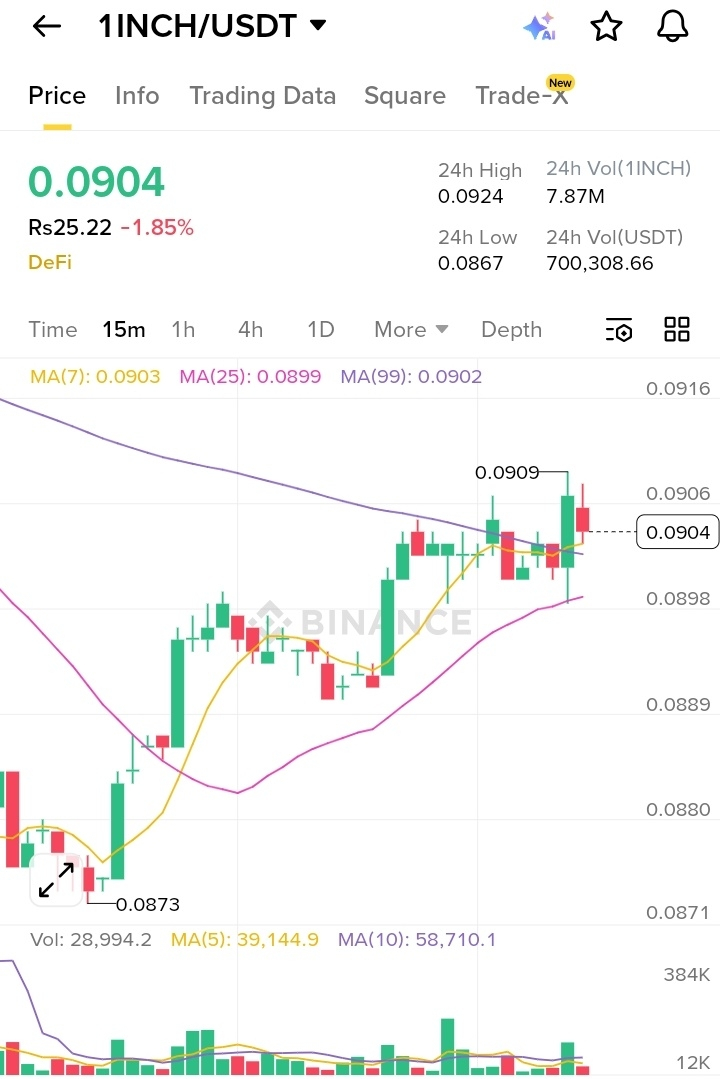
Bullish$1INCH / USDT Range Compressiontrading at 0.0904 after rejecting 0.0924 daily high and facing intraday resistance near 0.0909. Price is hovering around MA7, MA25, and MA99 on the 15m chart, signaling tight consolidation and indecision after the bounce from 0.0867. Structure remains slightly constructive but lacks breakout momentum.
Support: 0.0898 – 0.0889
Resistance: 0.0909 – 0.0924
Targets:
TG1: 0.0909
TG2: 0.0924
TG3: 0.0950
Holding above 0.0889 keeps bullish recovery intact. A clean break above 0.0924 can trigger expansion toward 0.0950. Loss of 0.0889 may shift momentum bearish short term. Market preparing for directional move.
#PredictionMarketsCFTCBacking #BTCMiningDifficultyIncrease #TokenizedRealEstate #TokenizedRealEstate #USJobsData
Support: 0.0898 – 0.0889
Resistance: 0.0909 – 0.0924
Targets:
TG1: 0.0909
TG2: 0.0924
TG3: 0.0950
Holding above 0.0889 keeps bullish recovery intact. A clean break above 0.0924 can trigger expansion toward 0.0950. Loss of 0.0889 may shift momentum bearish short term. Market preparing for directional move.
#PredictionMarketsCFTCBacking #BTCMiningDifficultyIncrease #TokenizedRealEstate #TokenizedRealEstate #USJobsData

SquareX IND
·
--
Expert advise me $1INCH what should i do ?



Log in to explore more content