Binance Square
实力技术瓜
6.3k Posts

实力技术瓜

星球实验室创始人 行业顶级交易员,kol,资本聚集地专业-精准-靠谱。每天代码多多 🏠 推特:实力技术瓜
Frequent Trader
5.6 Years
18 Following
11.8K+ Followers
22.8K+ Liked
Posts
PINNED
·
--
Welcome to the Little Family
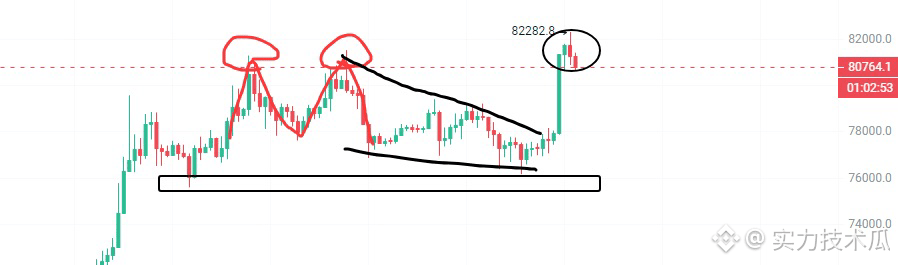
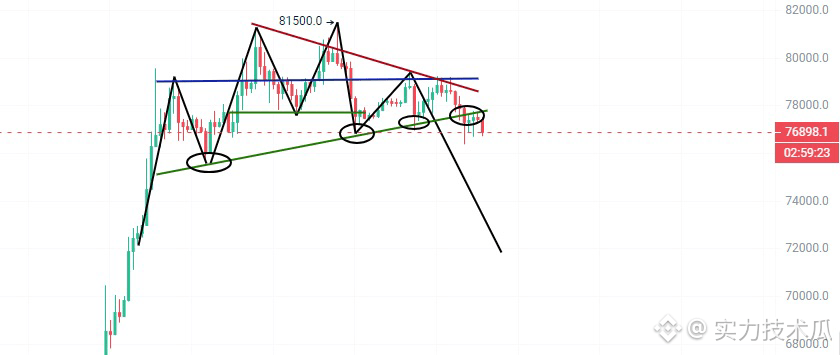
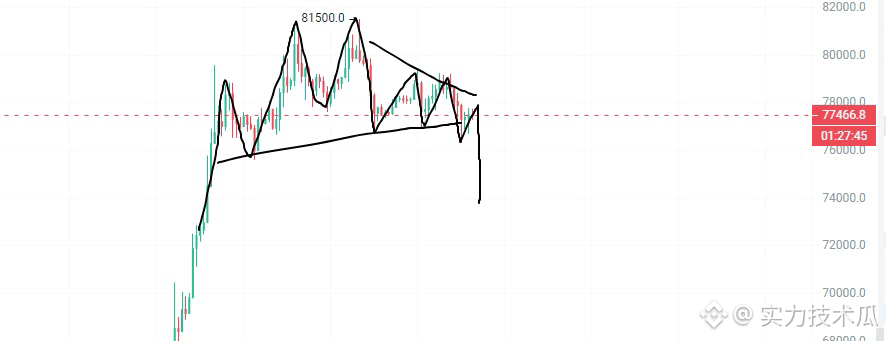
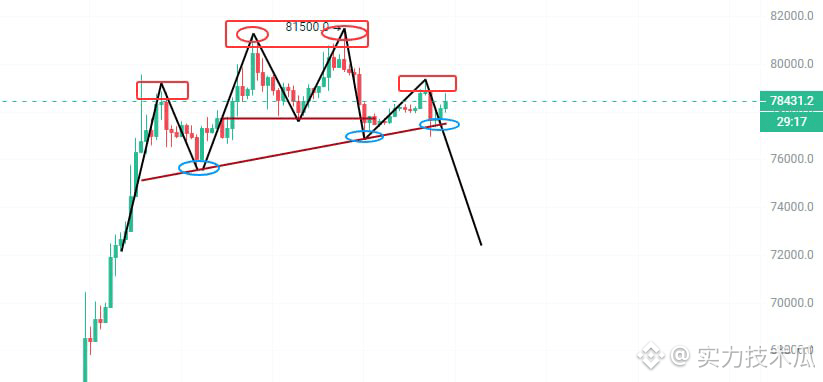
Btc seems to also have a composite head-and-shoulders pattern. The M-top appears to be a double top: the left shoulder is already formed, and the current right shoulder high needs confirmation. Once that high is completed, it may test the neckline downward again. If the price breaks below the neckline, it will directly enter an accelerated downtrend.
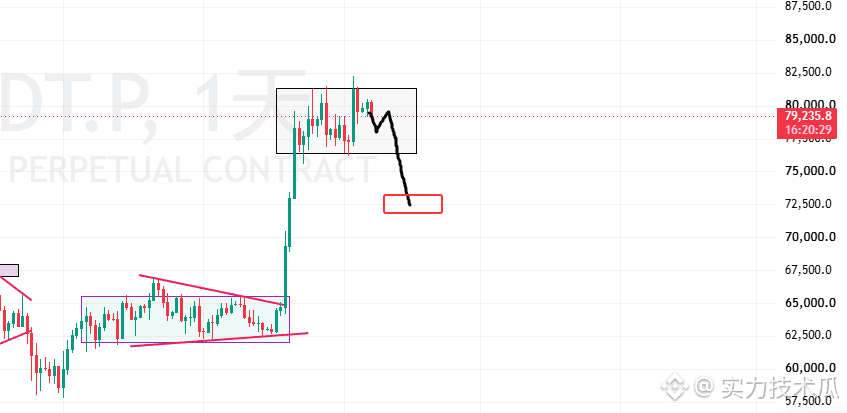
Update the BTC target levels. First, in terms of the short-term head formation, the rising wedge has already been confirmed. During the first leg of the acceleration drop, I essentially missed the move because the price hadn’t reached the expected level, so I missed the first wave of selling. But afterward, I shared the final “buy-the-dip” short entry opportunity, which was at the B-wave pullback position—this is also currently in line with expectations. Therefore, in the short term we have officially entered a downtrend. This decline will be a daily-chart-level drop. On the daily chart, a top formation has also appeared, indicating a very strong need for a pullback. There is also heavy overhead selling pressure. This decline basically needs to be completed. It’s also the first deep pullback since this recent up move. For now, the tentative prediction for the low point is the 73k–70k range; the exact level could be around 71.8k. This is also near the MA (moving average) support area and matches the low point of the Fibonacci retracement. It is also the target level for my short position. In addition, although the current higher-level price has formed a consolidation rectangle at the top range and price has reached a support area, if the smaller timeframe rebound cannot break above 78.5k, the probability of a massive dump will increase again. In short: in the short term, the bias is strongly bearish. At least wait for a big deep pullback before thinking about going long. So if my C-wave big pullback prediction is correct, the profit will be quite good—around 5,000–6,000 points. I’ve already indicated setting the break-even stop-loss risk so it’s essentially close to zero. As the chart evolves, I’ll keep updating it continuously.
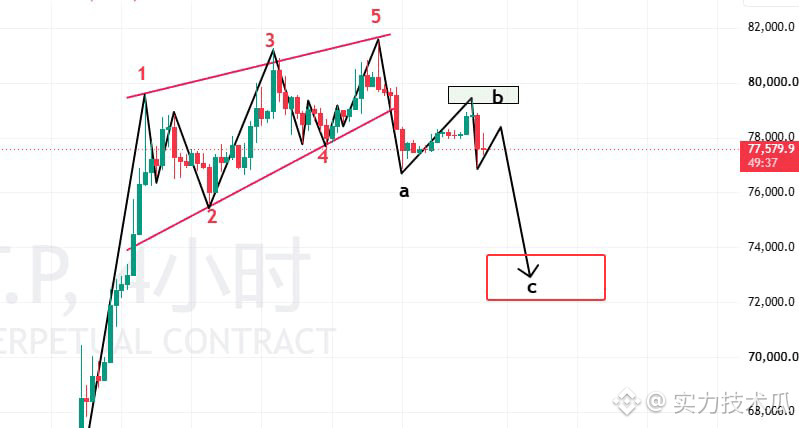
Update the BTC target levels. First, in terms of the short-term head formation, the rising wedge has already been confirmed. During the first leg of the acceleration drop, I essentially missed the move because the price hadn’t reached the expected level, so I missed the first wave of selling. But afterward, I shared the final “buy-the-dip” short entry opportunity, which was at the B-wave pullback position—this is also currently in line with expectations.

Therefore, in the short term we have officially entered a downtrend. This decline will be a daily-chart-level drop. On the daily chart, a top formation has also appeared, indicating a very strong need for a pullback. There is also heavy overhead selling pressure. This decline basically needs to be completed. It’s also the first deep pullback since this recent up move.

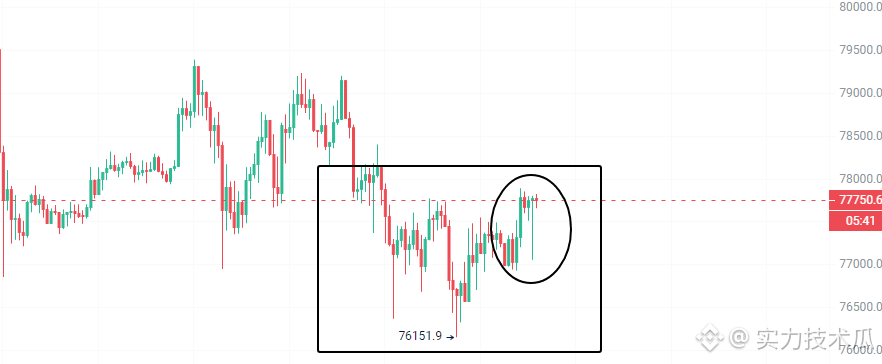
For now, the tentative prediction for the low point is the 73k–70k range; the exact level could be around 71.8k. This is also near the MA (moving average) support area and matches the low point of the Fibonacci retracement. It is also the target level for my short position. In addition, although the current higher-level price has formed a consolidation rectangle at the top range and price has reached a support area, if the smaller timeframe rebound cannot break above 78.5k, the probability of a massive dump will increase again.

In short: in the short term, the bias is strongly bearish. At least wait for a big deep pullback before thinking about going long. So if my C-wave big pullback prediction is correct, the profit will be quite good—around 5,000–6,000 points. I’ve already indicated setting the break-even stop-loss risk so it’s essentially close to zero. As the chart evolves, I’ll keep updating it continuously.
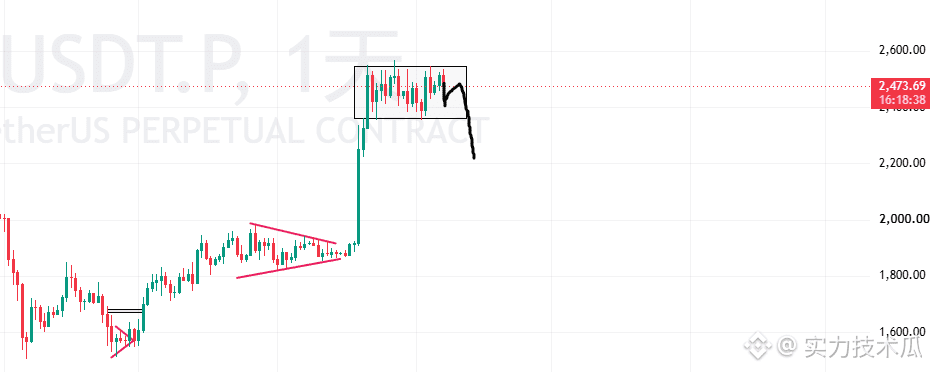
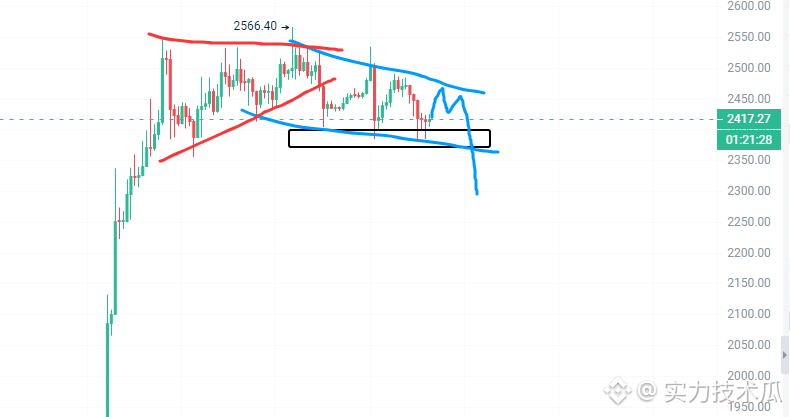
Update the ETH target levels. First, the short-term predicted head shape is a symmetrical triangle: the head formation is basically already established. The current price has completed a breakdown move lower. After the first leg of the decline accelerated, it then pushed upward and formed a B-segment retracement that made a high point—this can also be understood as a secondary high. We are now about to formally enter a daily-chart level downtrend. Also, the short-term B-segment retracement high has already been completed. Based on the earlier judgment, the C-segment big selloff is about to come. The support of the smaller time-frame rectangle basically needs to be ground down; once it breaks, an acceleration lower will begin. The target area for this move is 2250–2210. Specifically, it’s roughly around 2218 (u), which is also my short position target. From the daily-chart perspective, there have been multiple tight closes above, which indicates the sell pressure profit-taking is very heavy. On top of that, the symmetrical triangle forms a top signal, and the bulls have already started contracting volume, implying a high-level dead cross is about to occur. So in the short term the bias is bearish. The short trade has already been given a break-even stop/protection. If the prediction fails, there is zero risk of losing back to a loss (break-even risk is effectively zero). If the prediction is correct, you can take the full profit— the risk-reward ratio is maximized!
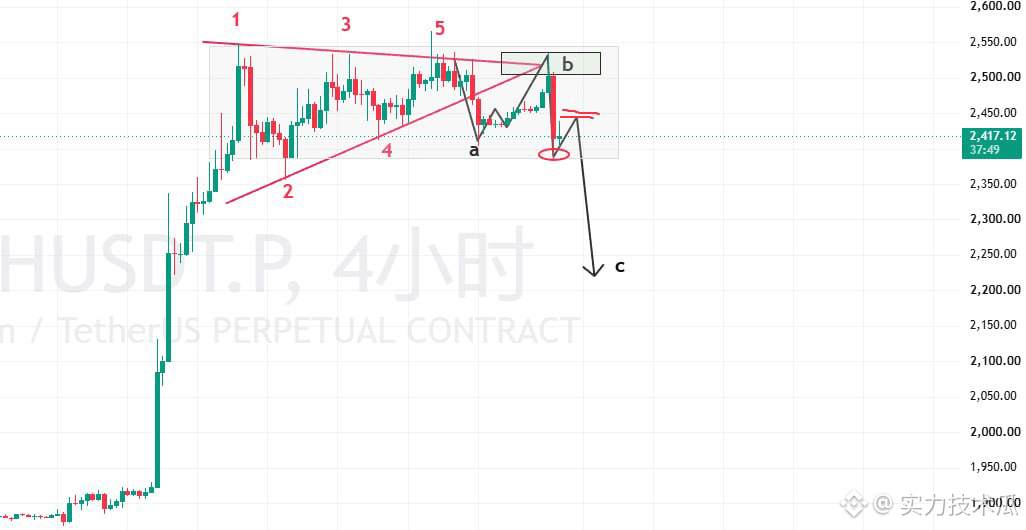
Update the ETH target levels. First, the short-term predicted head shape is a symmetrical triangle: the head formation is basically already established. The current price has completed a breakdown move lower. After the first leg of the decline accelerated, it then pushed upward and formed a B-segment retracement that made a high point—this can also be understood as a secondary high. We are now about to formally enter a daily-chart level downtrend.

Also, the short-term B-segment retracement high has already been completed. Based on the earlier judgment, the C-segment big selloff is about to come. The support of the smaller time-frame rectangle basically needs to be ground down; once it breaks, an acceleration lower will begin. The target area for this move is 2250–2210. Specifically, it’s roughly around 2218 (u), which is also my short position target.

From the daily-chart perspective, there have been multiple tight closes above, which indicates the sell pressure profit-taking is very heavy. On top of that, the symmetrical triangle forms a top signal, and the bulls have already started contracting volume, implying a high-level dead cross is about to occur. So in the short term the bias is bearish. The short trade has already been given a break-even stop/protection. If the prediction fails, there is zero risk of losing back to a loss (break-even risk is effectively zero). If the prediction is correct, you can take the full profit— the risk-reward ratio is maximized!
Also, the ETH short order has been received. The cost is around 2500. At the time, we also analyzed it in detail: in the short term, the B-segment pullback is the last opportunity to go short. The entry level provided was to short in the 2470–2500 range. It later rose to around 2534. And the short-term B-segment pullback formed a bull-trap pattern: it quickly surged up and then immediately snapped down, with a sharp drop afterward. Now it has entered the C-segment acceleration stage of a massive selloff. So you can just hold the short positions. Currently, you’re already close to about a $100 profit. You can set a break-even stop-loss strategy!
Also, the ETH short order has been received. The cost is around 2500. At the time, we also analyzed it in detail: in the short term, the B-segment pullback is the last opportunity to go short. The entry level provided was to short in the 2470–2500 range. It later rose to around 2534.

And the short-term B-segment pullback formed a bull-trap pattern: it quickly surged up and then immediately snapped down, with a sharp drop afterward. Now it has entered the C-segment acceleration stage of a massive selloff. So you can just hold the short positions. Currently, you’re already close to about a $100 profit. You can set a break-even stop-loss strategy!
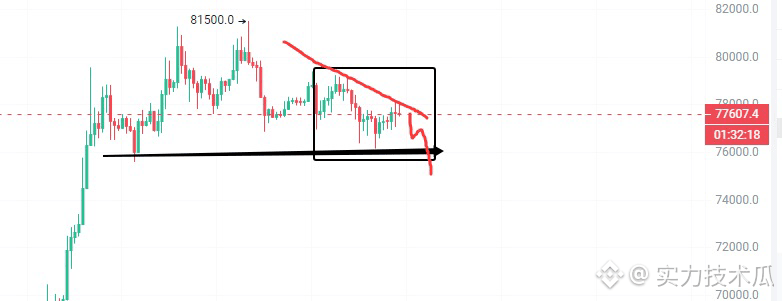
Btc matched my prediction. When I was analyzing it, I said there would be a short-term rebound, which is a B-segment pullback market. The high point I predicted was not above 79.7k, which was also the final opportunity to enter a short. In the end, the B-segment high reached around 79.4k, so the shorts were entered in the 79k–80k range as well. That’s roughly over a thousand points of profit. Also, those who entered the short can set the break-even stop. If, on the smaller timeframe, it can’t break and stay above 78.5k, then the downtrend should basically be coming. And the C-segment decline will be even stronger. Continuing the earlier judgment: if the wedge is the top pattern, then at least this week we should begin a deep pullback for a period of time. Hold the short and sit tight—you’re set to make a huge profit.
Btc matched my prediction. When I was analyzing it, I said there would be a short-term rebound, which is a B-segment pullback market. The high point I predicted was not above 79.7k, which was also the final opportunity to enter a short. In the end, the B-segment high reached around 79.4k, so the shorts were entered in the 79k–80k range as well. That’s roughly over a thousand points of profit.

Also, those who entered the short can set the break-even stop. If, on the smaller timeframe, it can’t break and stay above 78.5k, then the downtrend should basically be coming. And the C-segment decline will be even stronger. Continuing the earlier judgment: if the wedge is the top pattern, then at least this week we should begin a deep pullback for a period of time. Hold the short and sit tight—you’re set to make a huge profit.
The BTC short-term top pattern is still an ascending wedge, which is basically consistent with what I predicted. However, the shorting entry point is a bit off and didn’t reach my expected level, so for now I missed the trade. I originally thought that last night’s news could drive a quick upward wick to provide an opportunity to catch a short order. But the news backdrop yesterday was more bearish. So the price broke down directly. The current price has already fallen below the lower trendline of the wedge. Here, it’s likely that the short-term top pattern has already formed. Next will be a deep pullback in the short term, and the eventual low could go to the 7.3–7w range. As for the trading idea on the smaller timeframe: this is currently the first leg of the wedge drop. The first leg usually comes with acceleration. Following a three-leg decline, the first leg is in line with expectations. Next there should be a small rebound. This rebound will be my entry point to place the short after missing the trade. In the short term, I’ll wait for this level to enter a short. Regarding price levels: roughly the 7.9w–8w range. The high shouldn’t exceed 7.97w. Also, as mentioned yesterday, if I’m betting that the news will push another high to the expected shorting position, I might still miss the trade. That’s because at that time the short-term candles had already formed three consecutive tighter closes (tighter range), and combined with the ascending wedge—which is a top signal—the odds of further downside are higher. The facts have indeed confirmed that the drop happened immediately.
The BTC short-term top pattern is still an ascending wedge, which is basically consistent with what I predicted. However, the shorting entry point is a bit off and didn’t reach my expected level, so for now I missed the trade. I originally thought that last night’s news could drive a quick upward wick to provide an opportunity to catch a short order. But the news backdrop yesterday was more bearish.

So the price broke down directly. The current price has already fallen below the lower trendline of the wedge. Here, it’s likely that the short-term top pattern has already formed. Next will be a deep pullback in the short term, and the eventual low could go to the 7.3–7w range.

As for the trading idea on the smaller timeframe: this is currently the first leg of the wedge drop. The first leg usually comes with acceleration. Following a three-leg decline, the first leg is in line with expectations. Next there should be a small rebound. This rebound will be my entry point to place the short after missing the trade. In the short term, I’ll wait for this level to enter a short.

Regarding price levels: roughly the 7.9w–8w range. The high shouldn’t exceed 7.97w. Also, as mentioned yesterday, if I’m betting that the news will push another high to the expected shorting position, I might still miss the trade. That’s because at that time the short-term candles had already formed three consecutive tighter closes (tighter range), and combined with the ascending wedge—which is a top signal—the odds of further downside are higher. The facts have indeed confirmed that the drop happened immediately.
ETH ultimately still formed a symmetrical triangle pattern, and this pullback also missed the short entry. However, as mentioned yesterday: if the news flow can bring a wave of positive catalysts, there’s a chance to get in on the short; otherwise, we might miss it. From the current situation, the short hasn’t been entered yet, and price has already broken below the lower trendline of the triangle. So for now, this short is temporarily missed. The price has already fallen below the lower boundary of the triangle. I’m planning to wait for a small timeframe rebound, then enter the short. Because once the level breaks and price continues downward, the move should at least target 2330, or even around 2210. In the short term, a top-and-reversal signal has basically appeared. If there’s a rebound on the smaller timeframe and it goes above 2470, I’ll consider entering the short directly. For now, I’ll stand by and observe!
ETH ultimately still formed a symmetrical triangle pattern, and this pullback also missed the short entry. However, as mentioned yesterday: if the news flow can bring a wave of positive catalysts, there’s a chance to get in on the short; otherwise, we might miss it. From the current situation, the short hasn’t been entered yet, and price has already broken below the lower trendline of the triangle.

So for now, this short is temporarily missed. The price has already fallen below the lower boundary of the triangle. I’m planning to wait for a small timeframe rebound, then enter the short. Because once the level breaks and price continues downward, the move should at least target 2330, or even around 2210. In the short term, a top-and-reversal signal has basically appeared. If there’s a rebound on the smaller timeframe and it goes above 2470, I’ll consider entering the short directly. For now, I’ll stand by and observe!
ETH basic and its prediction are consistent. In the short term it has been running within a triangle pattern. Although a smaller timeframe formed a high, it failed to hold there and was pushed back down again. That high also served as a warning at the time, because it was said that ETH’s move was slightly stronger and it might do a quick upward fake breakout and wick above. As it turns out, it indeed pushed up to around 2566u. However, the current pattern is still a symmetrical triangle. The probability of it evolving into an ascending triangle is low for now. If later tonight, news-driven factors push another high, it could evolve into a terminal wedge. In any case, they are all bearish patterns. So if you want to go in with ETH and play it safe, wait for a high point to enter and short. But that also risks missing the entry. Personally, I want to take a gamble that tonight’s news will be taken into account for entering a short.
ETH basic and its prediction are consistent. In the short term it has been running within a triangle pattern. Although a smaller timeframe formed a high, it failed to hold there and was pushed back down again. That high also served as a warning at the time, because it was said that ETH’s move was slightly stronger and it might do a quick upward fake breakout and wick above. As it turns out, it indeed pushed up to around 2566u.

However, the current pattern is still a symmetrical triangle. The probability of it evolving into an ascending triangle is low for now. If later tonight, news-driven factors push another high, it could evolve into a terminal wedge. In any case, they are all bearish patterns. So if you want to go in with ETH and play it safe, wait for a high point to enter and short. But that also risks missing the entry. Personally, I want to take a gamble that tonight’s news will be taken into account for entering a short.
Btc is basically on schedule. The support in the fourth segment held, and then price moved upward to the last high. However, that last high feels quite uncomfortable. My initial prediction was to short around 8.27w, but the last high ended up reaching 8.15w—slightly off. So currently the short position still hasn’t been entered. At this stage, it looks like all three swing highs have tightened up, showing signs of a possible top. But there will be news later tonight, and I still want to take a shot that with the push from the news, price will move up to create another high point. Also, the 4H-level divergence has been almost fully digested. If another high is made, it could form a second divergence. Then entering a short would be more stable. So for now, I’m not considering directly opening a short position. I’ll bet on the news catalyst to push price up and make a high above 8.27w; only then will I consider entering a short. If I miss the trade, I’ll accept it.
Btc is basically on schedule. The support in the fourth segment held, and then price moved upward to the last high. However, that last high feels quite uncomfortable. My initial prediction was to short around 8.27w, but the last high ended up reaching 8.15w—slightly off. So currently the short position still hasn’t been entered. At this stage, it looks like all three swing highs have tightened up, showing signs of a possible top.

But there will be news later tonight, and I still want to take a shot that with the push from the news, price will move up to create another high point. Also, the 4H-level divergence has been almost fully digested. If another high is made, it could form a second divergence. Then entering a short would be more stable. So for now, I’m not considering directly opening a short position. I’ll bet on the news catalyst to push price up and make a high above 8.27w; only then will I consider entering a short. If I miss the trade, I’ll accept it.
Niu Lai is just too strong. When we were talking about it yesterday it was still around 40m, but now it’s already come to 60m. I guess there’s a high probability that a contract will be listed soon. No wonder GMGN’s co-founder has been buying so much—there’s a reason. After all, in the near term the BSC chain’s height can only be broken by Niu Lai. Once the height gets built up, more coins with “height” will come out afterward. In a situation where the market is surging like crazy, Niu Lai’s narrative is unbeatable. Also, the Robinhood chain already has two coins with market caps over 100m. Cash Cat’s market cap is over 200m, and Pons is also over 100m. Even the AI coins that have been rising lately have already broken above 60m in market cap. So if you want to grab a share of the market’s meme sector, you can only roll out a coin with a market cap of over 100m to push up the BSC chain’s height. Mars—the one everyone is hoping for—has been a bit disappointing for now. But it’s still these two coins that will break the BSC chain’s height. Niu Lai’s narrative is even more unbeatable, and it can make everyone in the community form a much stronger consensus.
Niu Lai is just too strong. When we were talking about it yesterday it was still around 40m, but now it’s already come to 60m. I guess there’s a high probability that a contract will be listed soon. No wonder GMGN’s co-founder has been buying so much—there’s a reason. After all, in the near term the BSC chain’s height can only be broken by Niu Lai. Once the height gets built up, more coins with “height” will come out afterward. In a situation where the market is surging like crazy, Niu Lai’s narrative is unbeatable.

Also, the Robinhood chain already has two coins with market caps over 100m. Cash Cat’s market cap is over 200m, and Pons is also over 100m. Even the AI coins that have been rising lately have already broken above 60m in market cap. So if you want to grab a share of the market’s meme sector, you can only roll out a coin with a market cap of over 100m to push up the BSC chain’s height. Mars—the one everyone is hoping for—has been a bit disappointing for now. But it’s still these two coins that will break the BSC chain’s height. Niu Lai’s narrative is even more unbeatable, and it can make everyone in the community form a much stronger consensus.
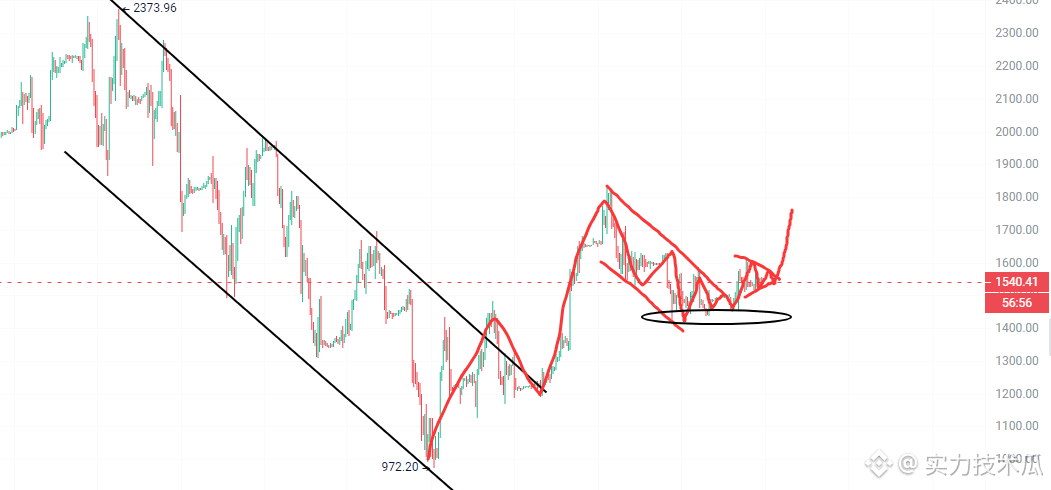
After SanDisk broke through the downward trend, it began to gradually rebound and enter an uptrend. In this rebound phase, I think it can be understood as already having entered an uptrend. The probability of falling again back into a downward channel is very small. It has also been continuously rebounding for about a month. In terms of the cycle, the downtrend has already ended, and it is temporarily entering an uptrend. Even the short-term chart structure is more likely to be bullish. Currently, it is an upswing continuation pattern within an uptrend—something that can be understood as a bullish flag pattern. The current price is near the flag’s upper boundary line. As long as it breaks through, it may accelerate upward again. For SanDisk’s short-term outlook, it is bullish.
After SanDisk broke through the downward trend, it began to gradually rebound and enter an uptrend. In this rebound phase, I think it can be understood as already having entered an uptrend. The probability of falling again back into a downward channel is very small. It has also been continuously rebounding for about a month. In terms of the cycle, the downtrend has already ended, and it is temporarily entering an uptrend.

Even the short-term chart structure is more likely to be bullish. Currently, it is an upswing continuation pattern within an uptrend—something that can be understood as a bullish flag pattern. The current price is near the flag’s upper boundary line. As long as it breaks through, it may accelerate upward again. For SanDisk’s short-term outlook, it is bullish.
Btc continues the previous assessment: the current pattern is still an ascending wedge. It is also a standard wedge pattern. Structurally, it is basically made up of five segments. In more detail, there are two lows and three highs. We are currently in the rebound phase of the last high point. The fourth segment is support along the lower trendline. In the short term, the next small timeframe may test the fourth segment support again. Once it holds, a rebound should begin. Therefore, the fifth segment high should be valid in normal circumstances. The high should be around 8.27w. In addition, the first divergence is about to be absorbed, which increases the probability of successfully forming the last high. So the short position plan I have is still waiting for another high point to form. It’s possible that the final segment may be completed with the help of news catalysts. The last high point usually quickly rebounds upward, forms a bull-trap, and then drops sharply. The probability of a bull-trap pattern is relatively higher. Also, the upper trendline is located near the early high area. Above it, there is still strong selling pressure, including profit-taking. As for the current daily chart: although it has already shown a pullback/rejection, the price has not broken down after retracing to support. Overall, it is temporarily consolidating in a high range. Before the decline, my bias is still more toward pushing upward first rather than a direct drop, so for now I will continue to wait for opportunities to enter a short position according to this structure. Let me highlight one detail: the current smaller timeframe is in the rebound phase. You can pay attention to the 7.95–8w area, because it corresponds to the first segment’s high and also the second high at the golden ratio level. It may also develop into the right-shoulder high of a head-and-shoulders top. If the last high point is not formed, then this second-high area would be another entry point for a short. Be mindful of this level. In the future, I will keep updating the evolution of the pattern. For now, I am still holding the short orders placed around 8.27w for the last high point.
Btc continues the previous assessment: the current pattern is still an ascending wedge. It is also a standard wedge pattern. Structurally, it is basically made up of five segments. In more detail, there are two lows and three highs. We are currently in the rebound phase of the last high point. The fourth segment is support along the lower trendline.

In the short term, the next small timeframe may test the fourth segment support again. Once it holds, a rebound should begin. Therefore, the fifth segment high should be valid in normal circumstances. The high should be around 8.27w. In addition, the first divergence is about to be absorbed, which increases the probability of successfully forming the last high. So the short position plan I have is still waiting for another high point to form. It’s possible that the final segment may be completed with the help of news catalysts.

The last high point usually quickly rebounds upward, forms a bull-trap, and then drops sharply. The probability of a bull-trap pattern is relatively higher. Also, the upper trendline is located near the early high area. Above it, there is still strong selling pressure, including profit-taking. As for the current daily chart: although it has already shown a pullback/rejection, the price has not broken down after retracing to support. Overall, it is temporarily consolidating in a high range. Before the decline, my bias is still more toward pushing upward first rather than a direct drop, so for now I will continue to wait for opportunities to enter a short position according to this structure.

Let me highlight one detail: the current smaller timeframe is in the rebound phase. You can pay attention to the 7.95–8w area, because it corresponds to the first segment’s high and also the second high at the golden ratio level. It may also develop into the right-shoulder high of a head-and-shoulders top. If the last high point is not formed, then this second-high area would be another entry point for a short. Be mindful of this level. In the future, I will keep updating the evolution of the pattern. For now, I am still holding the short orders placed around 8.27w for the last high point.
ETH continues yesterday’s assessment; it is still within a symmetrical triangle pattern. In the short term, the price is also roughly in line with what I predicted. After a pullback to the lower edge line, it started to rebound to test the pressure at the upper edge line. The point I mentioned at the time was 2522u, but the current high is around 2515u—off by a few points, though it still fits the forecast. So, following normal standards, the internal five-wave structure within a symmetrical triangle should basically be in place. The last E high point from yesterday has already rebounced up. Therefore, the next thing to watch is the upper edge line. If the breakout attempt fails, the triangle pattern may continue. If the pattern continues and exceeds the standard five-wave structure, the probability of a subsequent breakout would be smaller. However, considering that ETH is still stronger than BTC in the short term, I’m not in a hurry to short for now. The main reason is that ETH’s strength disrupted my timing. For BTC, I still expect a high point. If ETH keeps showing strength, it may push for another high and form a false breakout move. Then entering would be better depending on how things develop. If it turns weak, then the green line will continue the symmetrical triangle oscillation. Once the price reaches the end of the pattern, the probability of a breakdown to the downside would only increase. After that, there will still be opportunities to trade. In short: focus on the upper edge line right now. If it breaks out directly with volume, then I’ll abandon the idea of shorting. Going forward, I’ll pay attention to BTC’s pattern structure and consider shorting. For now, I’m just observing—see how the pattern evolves, then make a further plan!
ETH continues yesterday’s assessment; it is still within a symmetrical triangle pattern. In the short term, the price is also roughly in line with what I predicted. After a pullback to the lower edge line, it started to rebound to test the pressure at the upper edge line. The point I mentioned at the time was 2522u, but the current high is around 2515u—off by a few points, though it still fits the forecast.

So, following normal standards, the internal five-wave structure within a symmetrical triangle should basically be in place. The last E high point from yesterday has already rebounced up. Therefore, the next thing to watch is the upper edge line. If the breakout attempt fails, the triangle pattern may continue. If the pattern continues and exceeds the standard five-wave structure, the probability of a subsequent breakout would be smaller.

However, considering that ETH is still stronger than BTC in the short term, I’m not in a hurry to short for now. The main reason is that ETH’s strength disrupted my timing. For BTC, I still expect a high point. If ETH keeps showing strength, it may push for another high and form a false breakout move. Then entering would be better depending on how things develop. If it turns weak, then the green line will continue the symmetrical triangle oscillation. Once the price reaches the end of the pattern, the probability of a breakdown to the downside would only increase. After that, there will still be opportunities to trade.

In short: focus on the upper edge line right now. If it breaks out directly with volume, then I’ll abandon the idea of shorting. Going forward, I’ll pay attention to BTC’s pattern structure and consider shorting. For now, I’m just observing—see how the pattern evolves, then make a further plan!
Judging from the liquidation chart of BTC over the past week, I think the pattern I predicted has slightly higher chances of success, because there are still quite a lot of people directly shorting. Of course, more people are also chasing the price higher. At this point, if another high is made, those shorts above would become fuel, and the probability of pushing the price further toward around 82.7k would be higher. Once it reaches this level, most of the positions above are basically liquidated as well, which would also attract even more people to chase the price. Then, if the quick sell-off pinches downward and starts falling, liquidating the longs could trigger a chain-reaction selloff.
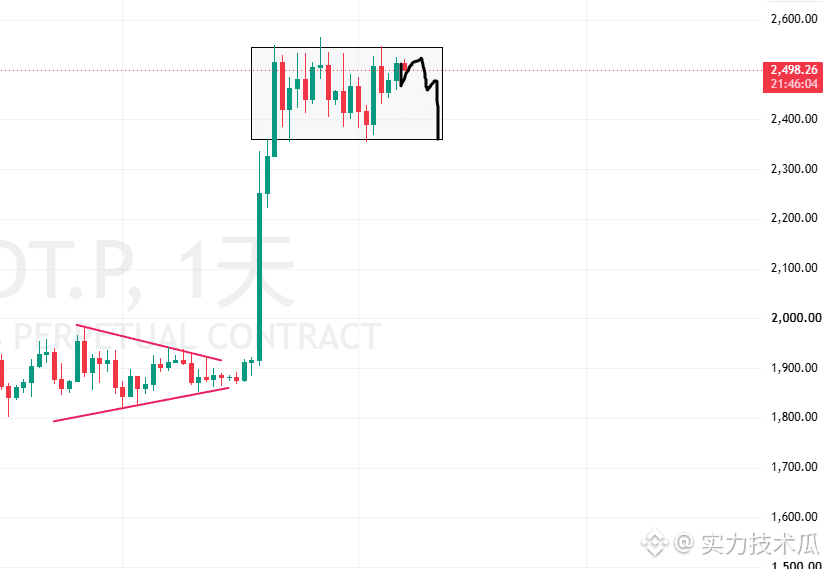
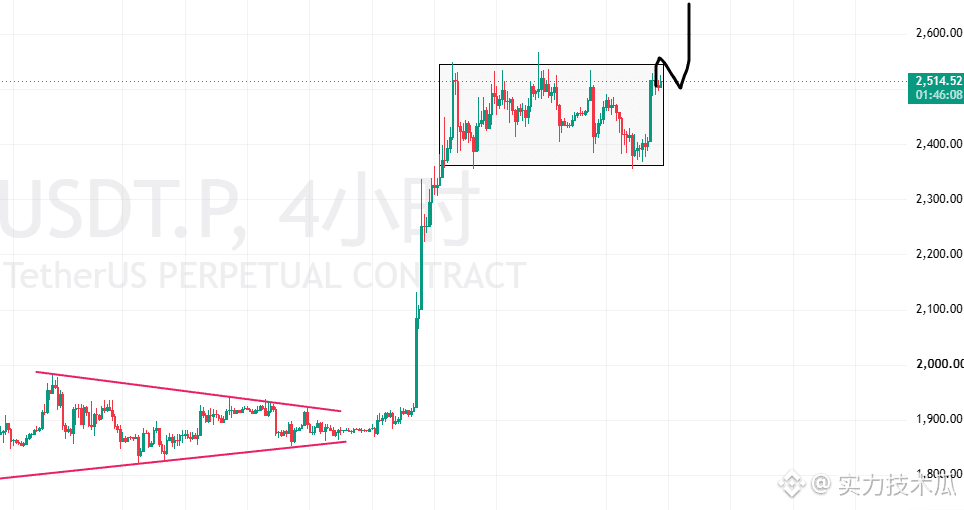
Analyze ETH: its current pattern has evolved from a double-top into a triangle. This is because after a minor-level pullback to support, there was a tightening and rebound, which means the minor support is effective. Therefore, the double-top’s neckline pullback is temporarily invalid. Here, the probability of forming a triangle pattern is higher. Triangle patterns also come in several variations. An ascending triangle can be ruled out—it’s clearly not that. In the short term, the price at the highs and lows continues to converge, which most likely indicates a symmetrical triangle. Judging by the triangle pattern, the internal structure has already completed the ABCD four legs. Usually, the internal structure involves five legs of movement. Clearly, one more D point is still missing to complete the triangle. In other words, after those five legs finish, the breakout direction will emerge. As for the trend: although it is an uptrend—and it occurs as a hedging triangle at relatively high levels within the uptrend—the probability of using it as an upward continuation is generally higher. But I don’t think that. I believe the probability of forming a short-term top pattern is higher. Because this rally has been oscillating for a long time in the form of a large triangle from the low, and then it directly accelerated upward. This caused many people to miss the move, meaning the position “load” is light—most didn’t expect it to rise by more than 30%. Even if they are on the train, their positions are still light. At that moment, the psychology of those who missed the rally becomes very aggressive; they’ll desperately and impulsively chase the price higher. So that kind of impulsive, blind chasing is when it becomes “the moment to pick up the hand” (i.e., to reverse). I think there will be a deep pullback to take away everyone who chased. Another point: looking at liquidation charts, a continuous rise of 30%+ means the shorts have basically been entirely consumed as fuel. This wave of liquidation data is even extremely dramatic. Now, those who are chasing include traders who are still betting on a reversal after breaking the previous high. As a result, the “car gets heavier” as price moves up. And with no shorts left to act as bullish fuel, the market can’t push higher anymore. It can only start clearing downward. After a deep liquidation, the “car gets lighter,” and I think that’s what will happen. In summary: the current symmetrical triangle will likely be a short-term top signal. The D-point location is around the upper edge line of the triangle near 2522 (the sell/short entry area). After that, it should begin a deep pullback to around 2210—about a 200–300 point correction. Also: although I expect BTC to make another high, I think the final “liquidity grab/stop-hunt” phase for ETH will be slightly weaker than BTC. So BTC will make a new high, while ETH will be roughly near its short-term previous high.
Analyze ETH: its current pattern has evolved from a double-top into a triangle. This is because after a minor-level pullback to support, there was a tightening and rebound, which means the minor support is effective. Therefore, the double-top’s neckline pullback is temporarily invalid. Here, the probability of forming a triangle pattern is higher.

Triangle patterns also come in several variations. An ascending triangle can be ruled out—it’s clearly not that. In the short term, the price at the highs and lows continues to converge, which most likely indicates a symmetrical triangle. Judging by the triangle pattern, the internal structure has already completed the ABCD four legs. Usually, the internal structure involves five legs of movement. Clearly, one more D point is still missing to complete the triangle. In other words, after those five legs finish, the breakout direction will emerge.

As for the trend: although it is an uptrend—and it occurs as a hedging triangle at relatively high levels within the uptrend—the probability of using it as an upward continuation is generally higher. But I don’t think that. I believe the probability of forming a short-term top pattern is higher.

Because this rally has been oscillating for a long time in the form of a large triangle from the low, and then it directly accelerated upward. This caused many people to miss the move, meaning the position “load” is light—most didn’t expect it to rise by more than 30%. Even if they are on the train, their positions are still light. At that moment, the psychology of those who missed the rally becomes very aggressive; they’ll desperately and impulsively chase the price higher. So that kind of impulsive, blind chasing is when it becomes “the moment to pick up the hand” (i.e., to reverse). I think there will be a deep pullback to take away everyone who chased.

Another point: looking at liquidation charts, a continuous rise of 30%+ means the shorts have basically been entirely consumed as fuel. This wave of liquidation data is even extremely dramatic. Now, those who are chasing include traders who are still betting on a reversal after breaking the previous high. As a result, the “car gets heavier” as price moves up. And with no shorts left to act as bullish fuel, the market can’t push higher anymore. It can only start clearing downward. After a deep liquidation, the “car gets lighter,” and I think that’s what will happen.

In summary: the current symmetrical triangle will likely be a short-term top signal. The D-point location is around the upper edge line of the triangle near 2522 (the sell/short entry area). After that, it should begin a deep pullback to around 2210—about a 200–300 point correction.

Also: although I expect BTC to make another high, I think the final “liquidity grab/stop-hunt” phase for ETH will be slightly weaker than BTC. So BTC will make a new high, while ETH will be roughly near its short-term previous high.
I made a bold prediction about the BTC trend. Based on the pattern currently about to form, here’s a preliminary take. First, the near-term top structure may form a rising wedge. So using the rising wedge as the basis: within a rising wedge, the internal structure is three high points at the top and two low points at the bottom. From where things stand now, two high points have already formed, and there is still one more high point needed to complete the pattern. If this prediction is correct, the next high point should fall in the 8.25–8.35w range, which is also near the prior high (the planned short entry). After that, a deeper pullback is expected, potentially dropping to around 7w–7.3w. In the short term, the price may retrace to the 7.8w area. That’s the support region along the lower edge of the wedge and also corresponds to the second retracement low. As long as the price does not break below this level, the final high point should still form. The move would likely quickly spike upward, then “needle back” downward. Therefore, once it reaches the next high point, you can enter a short position. Set the stop loss above 8.4w. If the prediction is right, the profit potential is close to about ten thousand points. Also, the wedge’s high point is a resistance area on the weekly timeframe trendline. In the last weekly bounce, price touched it and then was pushed down immediately, so I don’t think it will break through that easily. In addition, what we have now is a rebound trend, not a reversal trend. After all, during this strong uptrend, most of the shorts have basically been squeezed out. Short liquidations have become the “fuel” that supports the move. But looking at the weekly liquidation chart, the fuel has already been consumed to a large extent. Lastly, people who FOMO their way in will inevitably keep chasing prices. Over the past few days of consecutive gains, anyone bold enough to chase after the move made some profit. But after making money, it only fuels desire and confidence. Then, that final leg of chasing—if it comes with a deep pullback—will cause nearly all the profits from the past few days to be given back. Historically, in every uptrend, those who can’t resist chasing at the end usually end up吐 it all back—principal plus interest—during the final phase. That also fits the behavior of “smart money” perfectly. Of course, the above is only a preliminary pattern-based forecast and reflects my own way of thinking. It’s for reference only. You still need to see whether the pattern can actually form; subsequent actions will depend on whether the top structure confirms.
I made a bold prediction about the BTC trend. Based on the pattern currently about to form, here’s a preliminary take. First, the near-term top structure may form a rising wedge. So using the rising wedge as the basis: within a rising wedge, the internal structure is three high points at the top and two low points at the bottom. From where things stand now, two high points have already formed, and there is still one more high point needed to complete the pattern. If this prediction is correct, the next high point should fall in the 8.25–8.35w range, which is also near the prior high (the planned short entry). After that, a deeper pullback is expected, potentially dropping to around 7w–7.3w.

In the short term, the price may retrace to the 7.8w area. That’s the support region along the lower edge of the wedge and also corresponds to the second retracement low. As long as the price does not break below this level, the final high point should still form. The move would likely quickly spike upward, then “needle back” downward. Therefore, once it reaches the next high point, you can enter a short position. Set the stop loss above 8.4w. If the prediction is right, the profit potential is close to about ten thousand points.

Also, the wedge’s high point is a resistance area on the weekly timeframe trendline. In the last weekly bounce, price touched it and then was pushed down immediately, so I don’t think it will break through that easily. In addition, what we have now is a rebound trend, not a reversal trend. After all, during this strong uptrend, most of the shorts have basically been squeezed out. Short liquidations have become the “fuel” that supports the move. But looking at the weekly liquidation chart, the fuel has already been consumed to a large extent.

Lastly, people who FOMO their way in will inevitably keep chasing prices. Over the past few days of consecutive gains, anyone bold enough to chase after the move made some profit. But after making money, it only fuels desire and confidence. Then, that final leg of chasing—if it comes with a deep pullback—will cause nearly all the profits from the past few days to be given back. Historically, in every uptrend, those who can’t resist chasing at the end usually end up吐 it all back—principal plus interest—during the final phase. That also fits the behavior of “smart money” perfectly.

Of course, the above is only a preliminary pattern-based forecast and reflects my own way of thinking. It’s for reference only. You still need to see whether the pattern can actually form; subsequent actions will depend on whether the top structure confirms.
ETH does show signs of having topped, because the first peak hasn’t been broken in the short term yet—it's a bit like a second-high point. However, the big coin hasn’t produced a clear “top” signal yet (e.g., a reversal confirmation), so it’s still not something you dare to short ETH for now. If it can’t break the first high next, it may easily form a double-top structure. Specifically, keep an eye on how the pattern evolves.
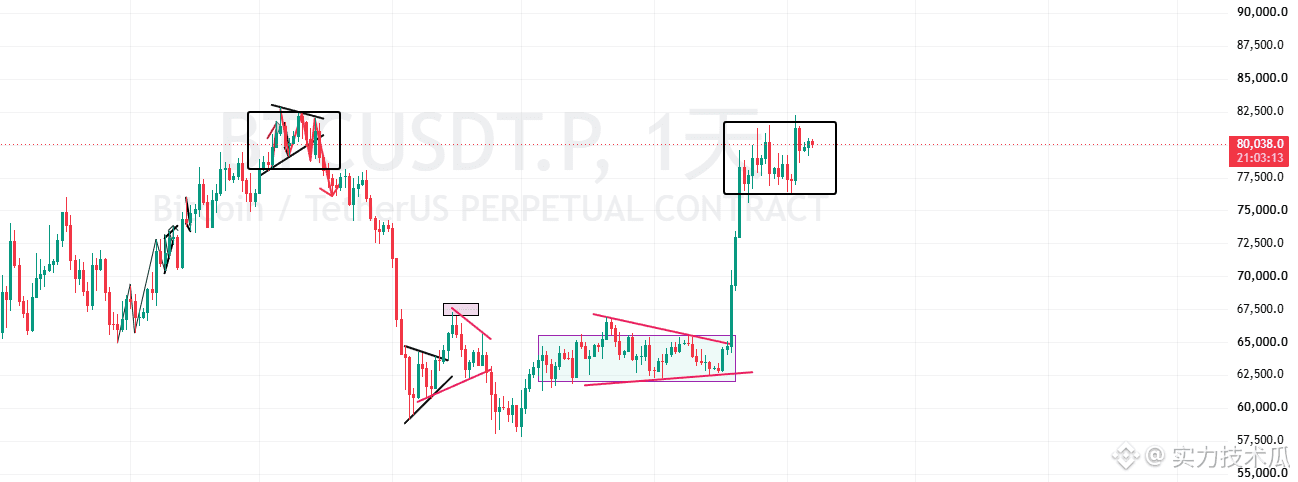
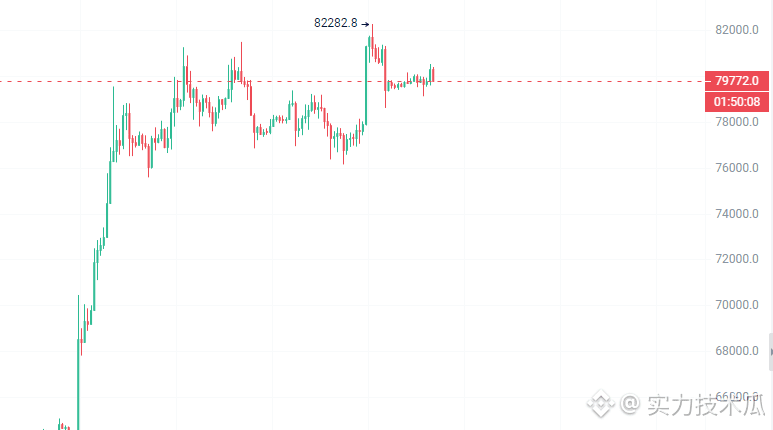
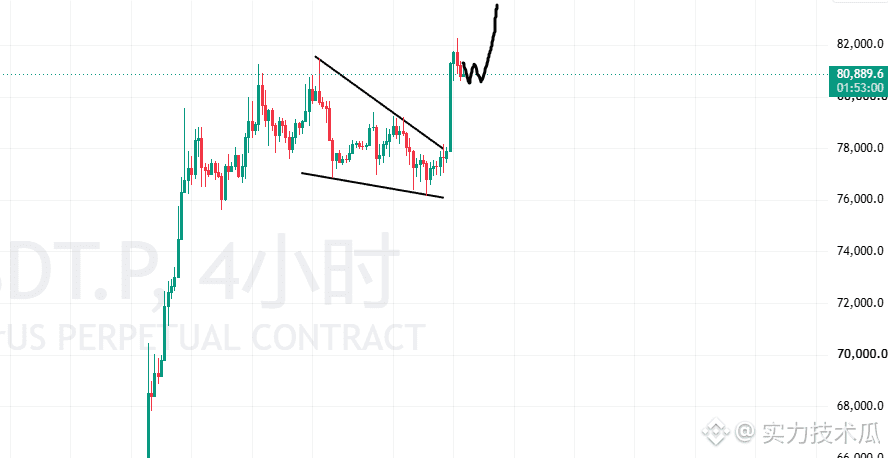
After BTC formed a falling wedge, it made another high point again. Yesterday I also mentioned that this area may form a bullish continuation pattern. After that, it accelerated and broke out. The current price is above 80,000 now. There still hasn’t been any clear top reversal sign or any head/top formation, so all we can do is keep watching. The risk-reward ratio of chasing after the rally is already very low. Watch the overhead resistance at the previous high around 82,800!
Btc has been experiencing continuous weekend oscillations for two days, but the price still remains in a high-range consolidation. Here, the pattern may form a descending wedge, which is a bullish continuation pattern. This means you cannot short for the time being. It may form another high first. Once a new high appears, I will consider entering a short position. For now, I’m waiting and watching.
Log in to explore more content
Join global crypto users on Binance Square
⚡️ Get latest and useful information about crypto.
💬 Trusted by the world’s largest crypto exchange.
👍 Discover real insights from verified creators.
Email / Phone number
Sitemap
Cookie Preferences
Platform T&Cs