
Crypto Man Mab 1
258 Posts

Crypto Man Mab 1
Report
Block User
Top Coin Market Cap KOL - Content Writer - Trader - Investors - DM for Collab tg : @MAB350
0 Following
2 Followers
2 Liked
Posts
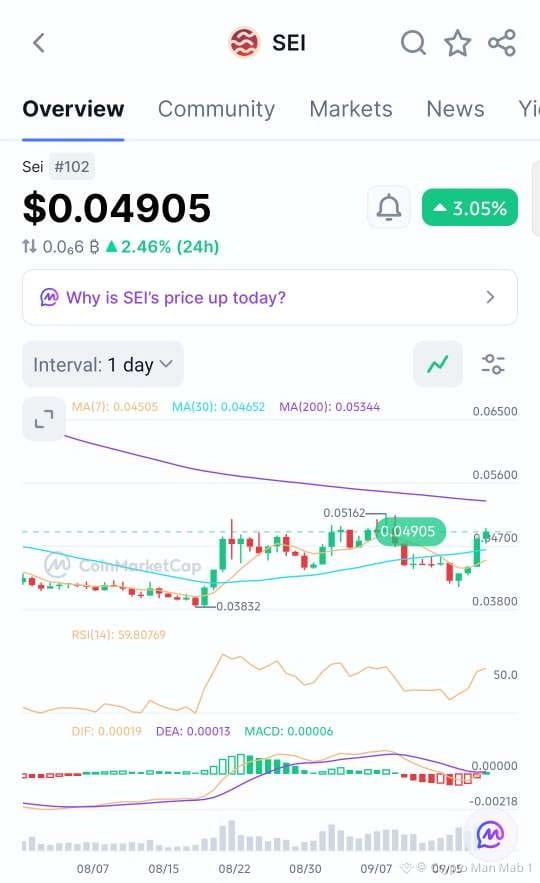
$SEI is showing signs of a recovery on the daily chart after bouncing from the $0.0383 area.
Price is now around $0.049 and has reclaimed the 30-day MA at $0.0465. The 7-day MA is also below price at $0.0450, which supports the short-term bullish structure.
RSI is around 60, so momentum is improving without being extremely overbought. MACD has also turned positive, with DIF above DEA, suggesting buyers are starting to regain control.
The main level I’m watching is $0.0516. If SEI breaks and holds above this resistance, the next important area is around $0.0534, which also lines up with the 200-day MA.
For a pullback, $0.0465–$0.0470 is the key zone to watch. Holding this area could keep the recovery structure intact.
Overall, SEI is showing improving momentum, but the $0.0516–$0.0534 zone is where the real breakout confirmation would come.
$SEI is showing signs of a recovery on the daily chart after bouncing from the $0.0383 area.
Price is now around $0.049 and has reclaimed the 30-day MA at $0.0465. The 7-day MA is also below price at $0.0450, which supports the short-term bullish structure.
RSI is around 60, so momentum is improving without being extremely overbought. MACD has also turned positive, with DIF above DEA, suggesting buyers are starting to regain control.
The main level I’m watching is $0.0516. If SEI breaks and holds above this resistance, the next important area is around $0.0534, which also lines up with the 200-day MA.
For a pullback, $0.0465–$0.0470 is the key zone to watch. Holding this area could keep the recovery structure intact.
Overall, SEI is showing improving momentum, but the $0.0516–$0.0534 zone is where the real breakout confirmation would come.
Price is now around $0.049 and has reclaimed the 30-day MA at $0.0465. The 7-day MA is also below price at $0.0450, which supports the short-term bullish structure.
RSI is around 60, so momentum is improving without being extremely overbought. MACD has also turned positive, with DIF above DEA, suggesting buyers are starting to regain control.
The main level I’m watching is $0.0516. If SEI breaks and holds above this resistance, the next important area is around $0.0534, which also lines up with the 200-day MA.
For a pullback, $0.0465–$0.0470 is the key zone to watch. Holding this area could keep the recovery structure intact.
Overall, SEI is showing improving momentum, but the $0.0516–$0.0534 zone is where the real breakout confirmation would come.
48
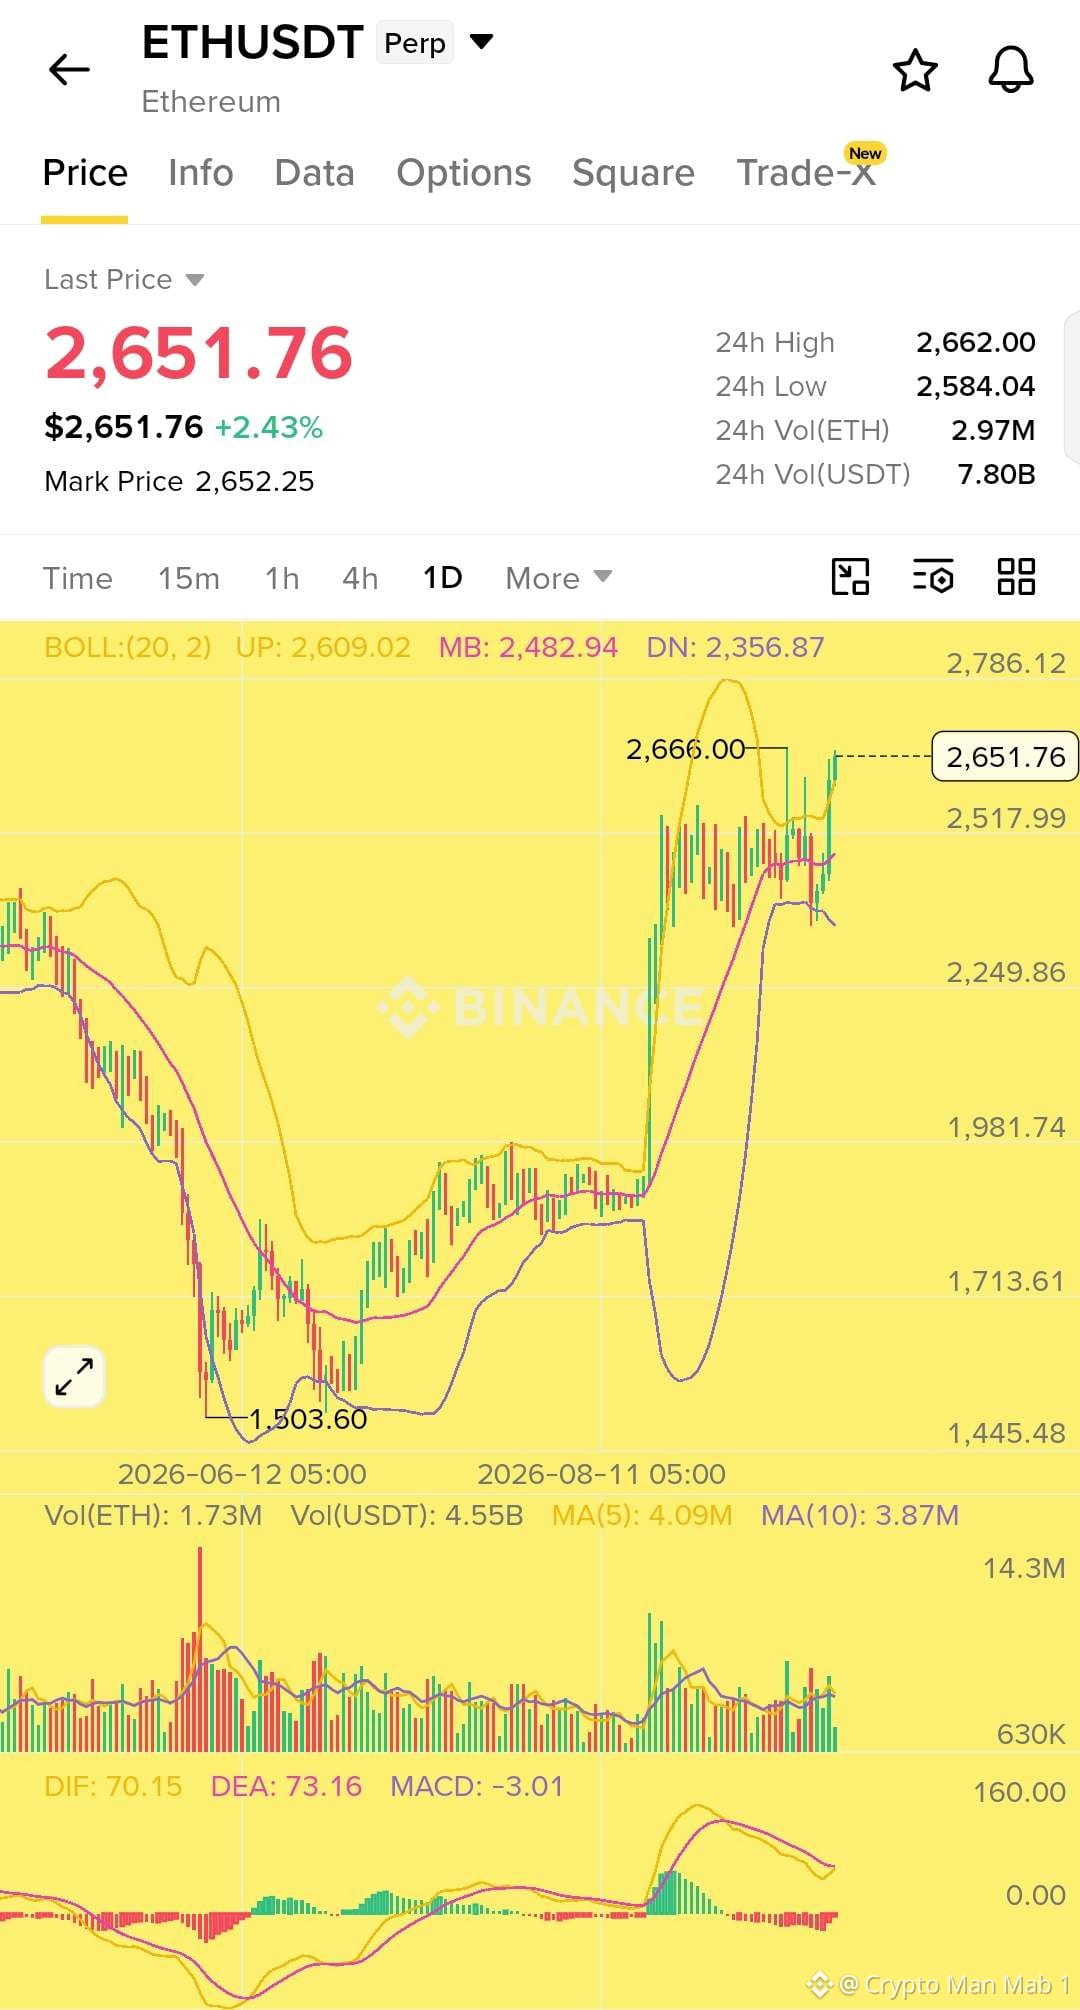
$ETH is still showing strong bullish momentum on the daily chart, but the current price is getting stretched after the recent move higher.
ETH is trading around $2,652 and recently pushed toward $2,666. The price is above the Bollinger midline at $2,483 and has broken above the upper Bollinger Band around $2,609, showing strong buying pressure.
However, MACD is starting to cool off, with DIF below DEA and the histogram turning negative. So I’d avoid chasing the move here and instead watch for a pullback toward the $2,600–$2,620 area.
If ETH holds that zone and buyers step back in, the next levels I’m watching are → $2,670 → $2,700 → $2,800 → $3,000.
The bigger picture remains bullish, but $2,666 is the immediate resistance to watch. A clean break and hold above it could open the door for another leg higher. 🚀
$ETH is still showing strong bullish momentum on the daily chart, but the current price is getting stretched after the recent move higher.
ETH is trading around $2,652 and recently pushed toward $2,666. The price is above the Bollinger midline at $2,483 and has broken above the upper Bollinger Band around $2,609, showing strong buying pressure.
However, MACD is starting to cool off, with DIF below DEA and the histogram turning negative. So I’d avoid chasing the move here and instead watch for a pullback toward the $2,600–$2,620 area.
If ETH holds that zone and buyers step back in, the next levels I’m watching are → $2,670 → $2,700 → $2,800 → $3,000.
The bigger picture remains bullish, but $2,666 is the immediate resistance to watch. A clean break and hold above it could open the door for another leg higher. 🚀
ETH is trading around $2,652 and recently pushed toward $2,666. The price is above the Bollinger midline at $2,483 and has broken above the upper Bollinger Band around $2,609, showing strong buying pressure.
However, MACD is starting to cool off, with DIF below DEA and the histogram turning negative. So I’d avoid chasing the move here and instead watch for a pullback toward the $2,600–$2,620 area.
If ETH holds that zone and buyers step back in, the next levels I’m watching are → $2,670 → $2,700 → $2,800 → $3,000.
The bigger picture remains bullish, but $2,666 is the immediate resistance to watch. A clean break and hold above it could open the door for another leg higher. 🚀
60
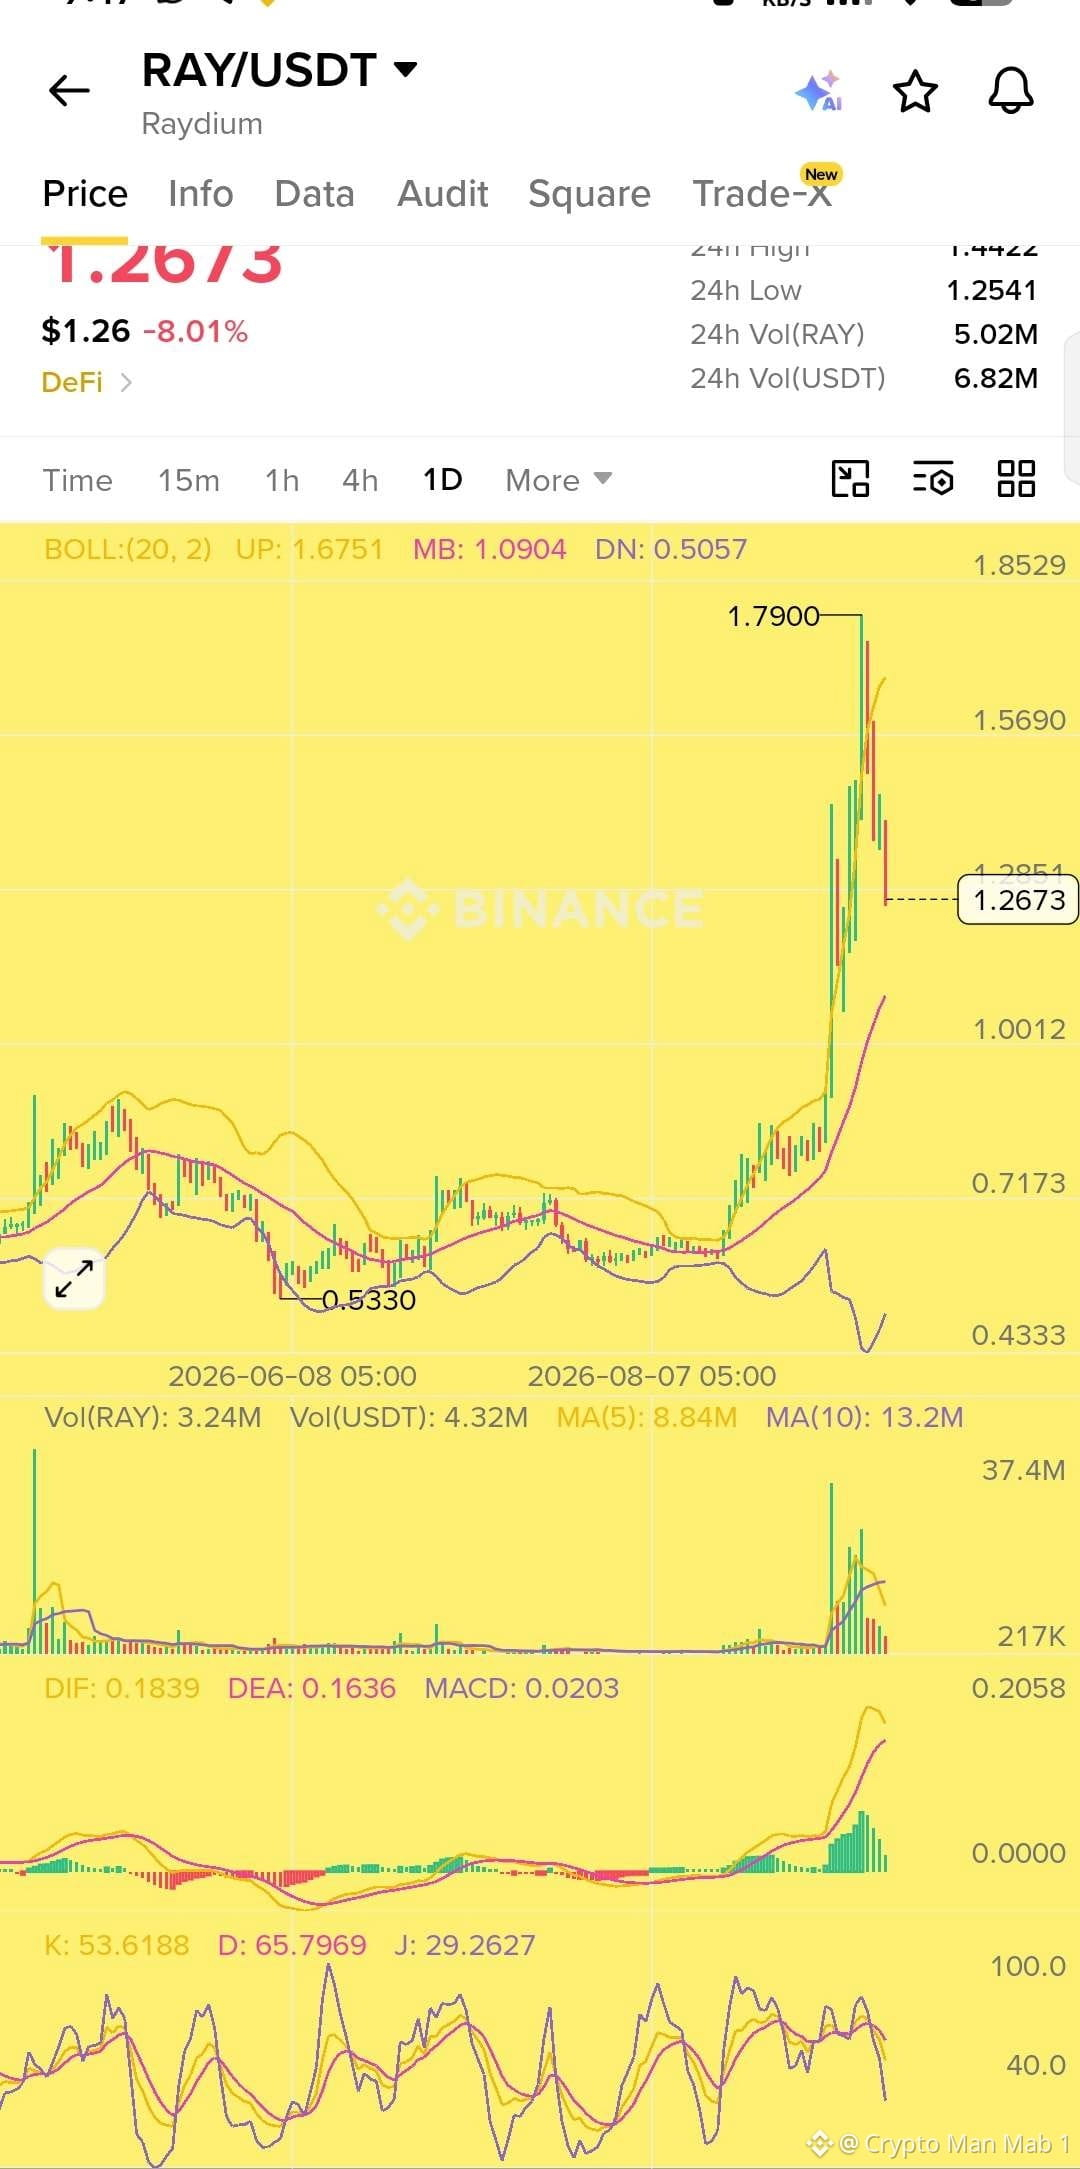
$RAY cooling off after a wild run. Price tripled from $0.53 to a high of $1.79 in a few weeks, now pulling back hard to $1.2673, down 8% today after getting rejected at the top.
Classic blow off top candle right after the peak. Bollinger Bands show price falling back from the upper band toward the mid band near $1.09. MACD momentum is fading and KDJ already flipped bearish, so short term trend has turned down.
Big picture is still bullish since price is way above the moving averages, but this looks like a healthy reset after a parabolic move. Watching $1.09 as the next support level.
Not financial advice, just reading the chart.
$RAY cooling off after a wild run. Price tripled from $0.53 to a high of $1.79 in a few weeks, now pulling back hard to $1.2673, down 8% today after getting rejected at the top.
Classic blow off top candle right after the peak. Bollinger Bands show price falling back from the upper band toward the mid band near $1.09. MACD momentum is fading and KDJ already flipped bearish, so short term trend has turned down.
Big picture is still bullish since price is way above the moving averages, but this looks like a healthy reset after a parabolic move. Watching $1.09 as the next support level.
Not financial advice, just reading the chart.
Classic blow off top candle right after the peak. Bollinger Bands show price falling back from the upper band toward the mid band near $1.09. MACD momentum is fading and KDJ already flipped bearish, so short term trend has turned down.
Big picture is still bullish since price is way above the moving averages, but this looks like a healthy reset after a parabolic move. Watching $1.09 as the next support level.
Not financial advice, just reading the chart.
58
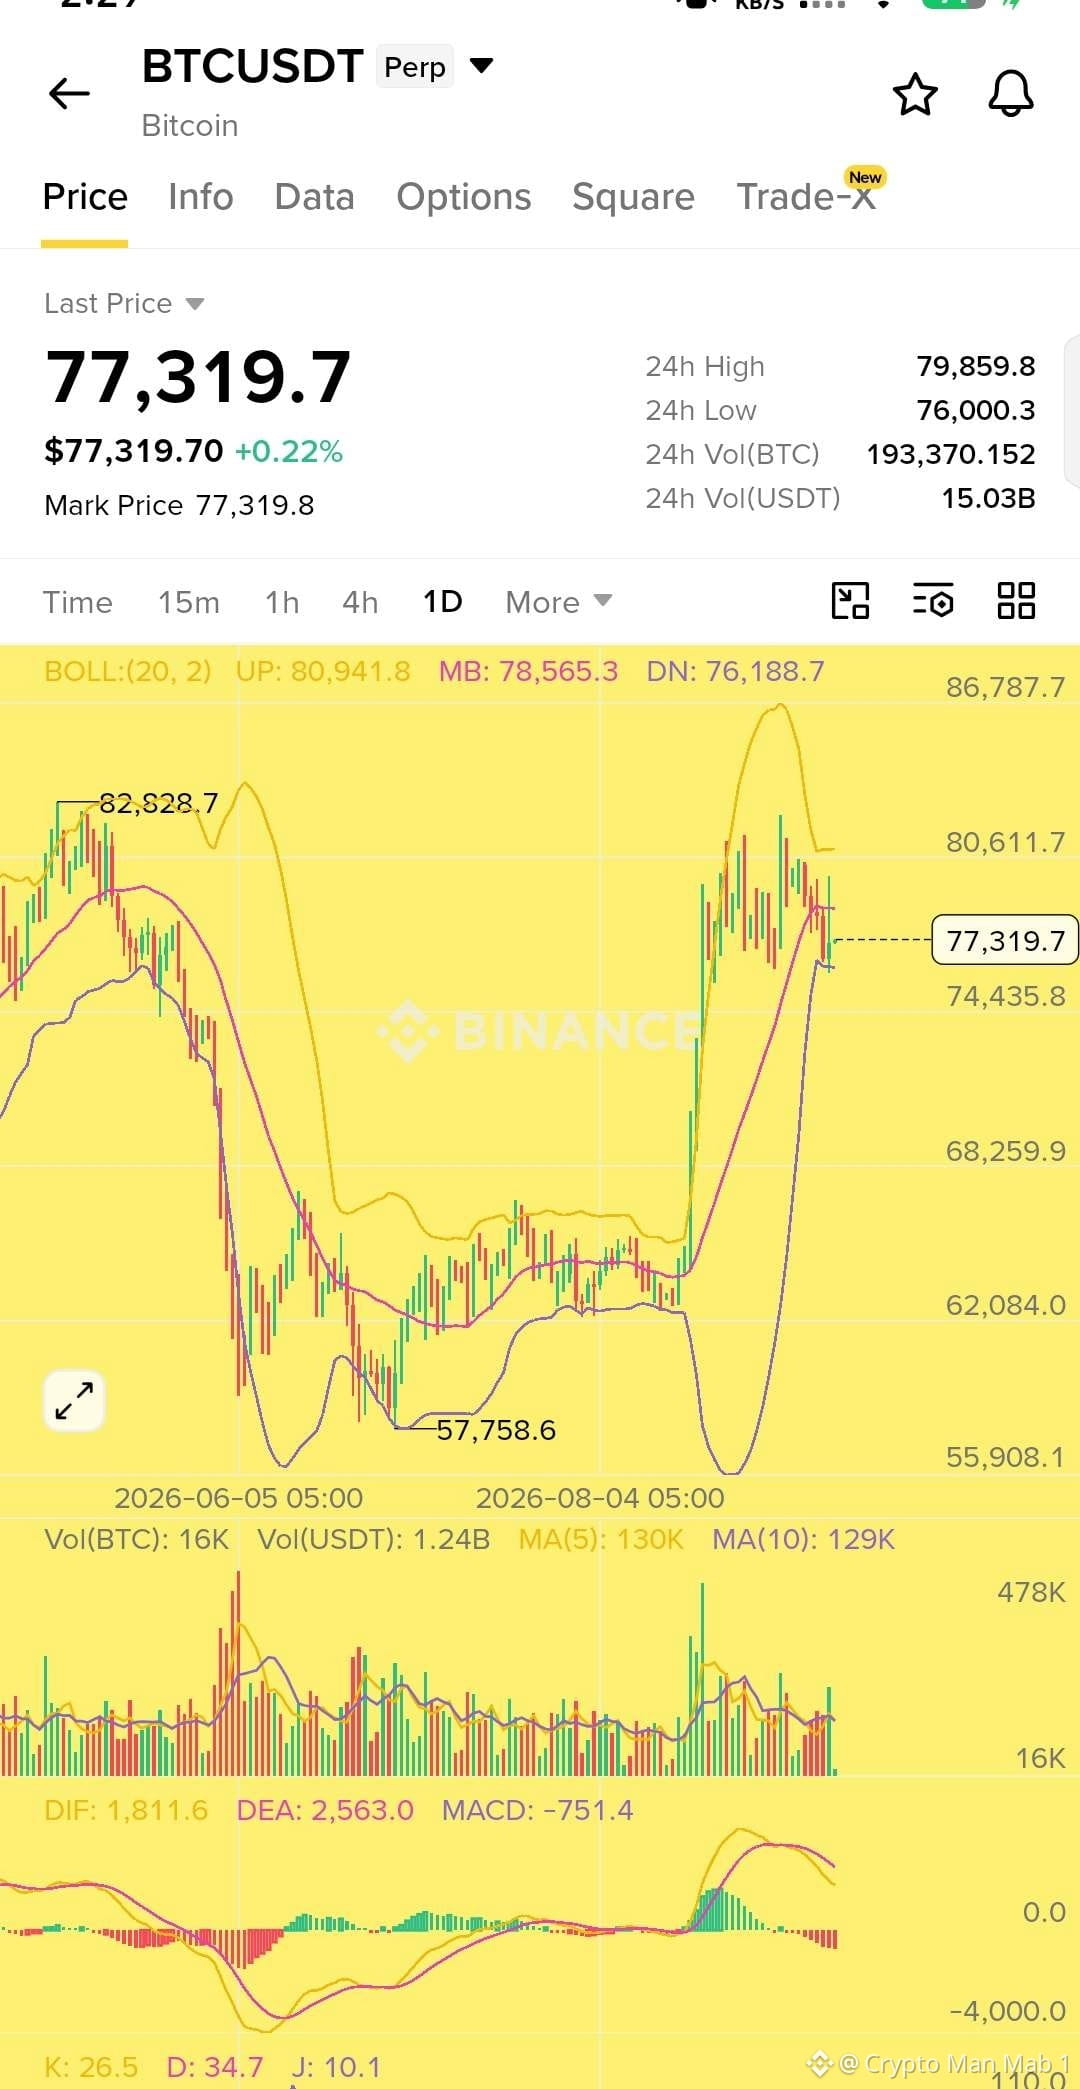
$BTC Daily chart is showing a clear short term bearish structure.
BTC is currently trading around $77.3K and sitting below the Bollinger mid band at $78.56K. MACD has turned bearish with the histogram below zero while KDJ is also showing weak momentum.
The key level to watch is $78.5K. If BTC fails to reclaim this area then another move toward $76K and potentially $74.4K is possible.
For the bulls I would want to see a strong daily close above $78.5K. That could open the door toward $80.6K and $81K.
#BTC Price Analysis#
My view right now: cautious bearish below $78.5K.
$BTC Daily chart is showing a clear short term bearish structure.
BTC is currently trading around $77.3K and sitting below the Bollinger mid band at $78.56K. MACD has turned bearish with the histogram below zero while KDJ is also showing weak momentum.
The key level to watch is $78.5K. If BTC fails to reclaim this area then another move toward $76K and potentially $74.4K is possible.
For the bulls I would want to see a strong daily close above $78.5K. That could open the door toward $80.6K and $81K.
#BTC Price Analysis#
My view right now: cautious bearish below $78.5K.
BTC is currently trading around $77.3K and sitting below the Bollinger mid band at $78.56K. MACD has turned bearish with the histogram below zero while KDJ is also showing weak momentum.
The key level to watch is $78.5K. If BTC fails to reclaim this area then another move toward $76K and potentially $74.4K is possible.
For the bulls I would want to see a strong daily close above $78.5K. That could open the door toward $80.6K and $81K.
#BTC Price Analysis#
My view right now: cautious bearish below $78.5K.
63
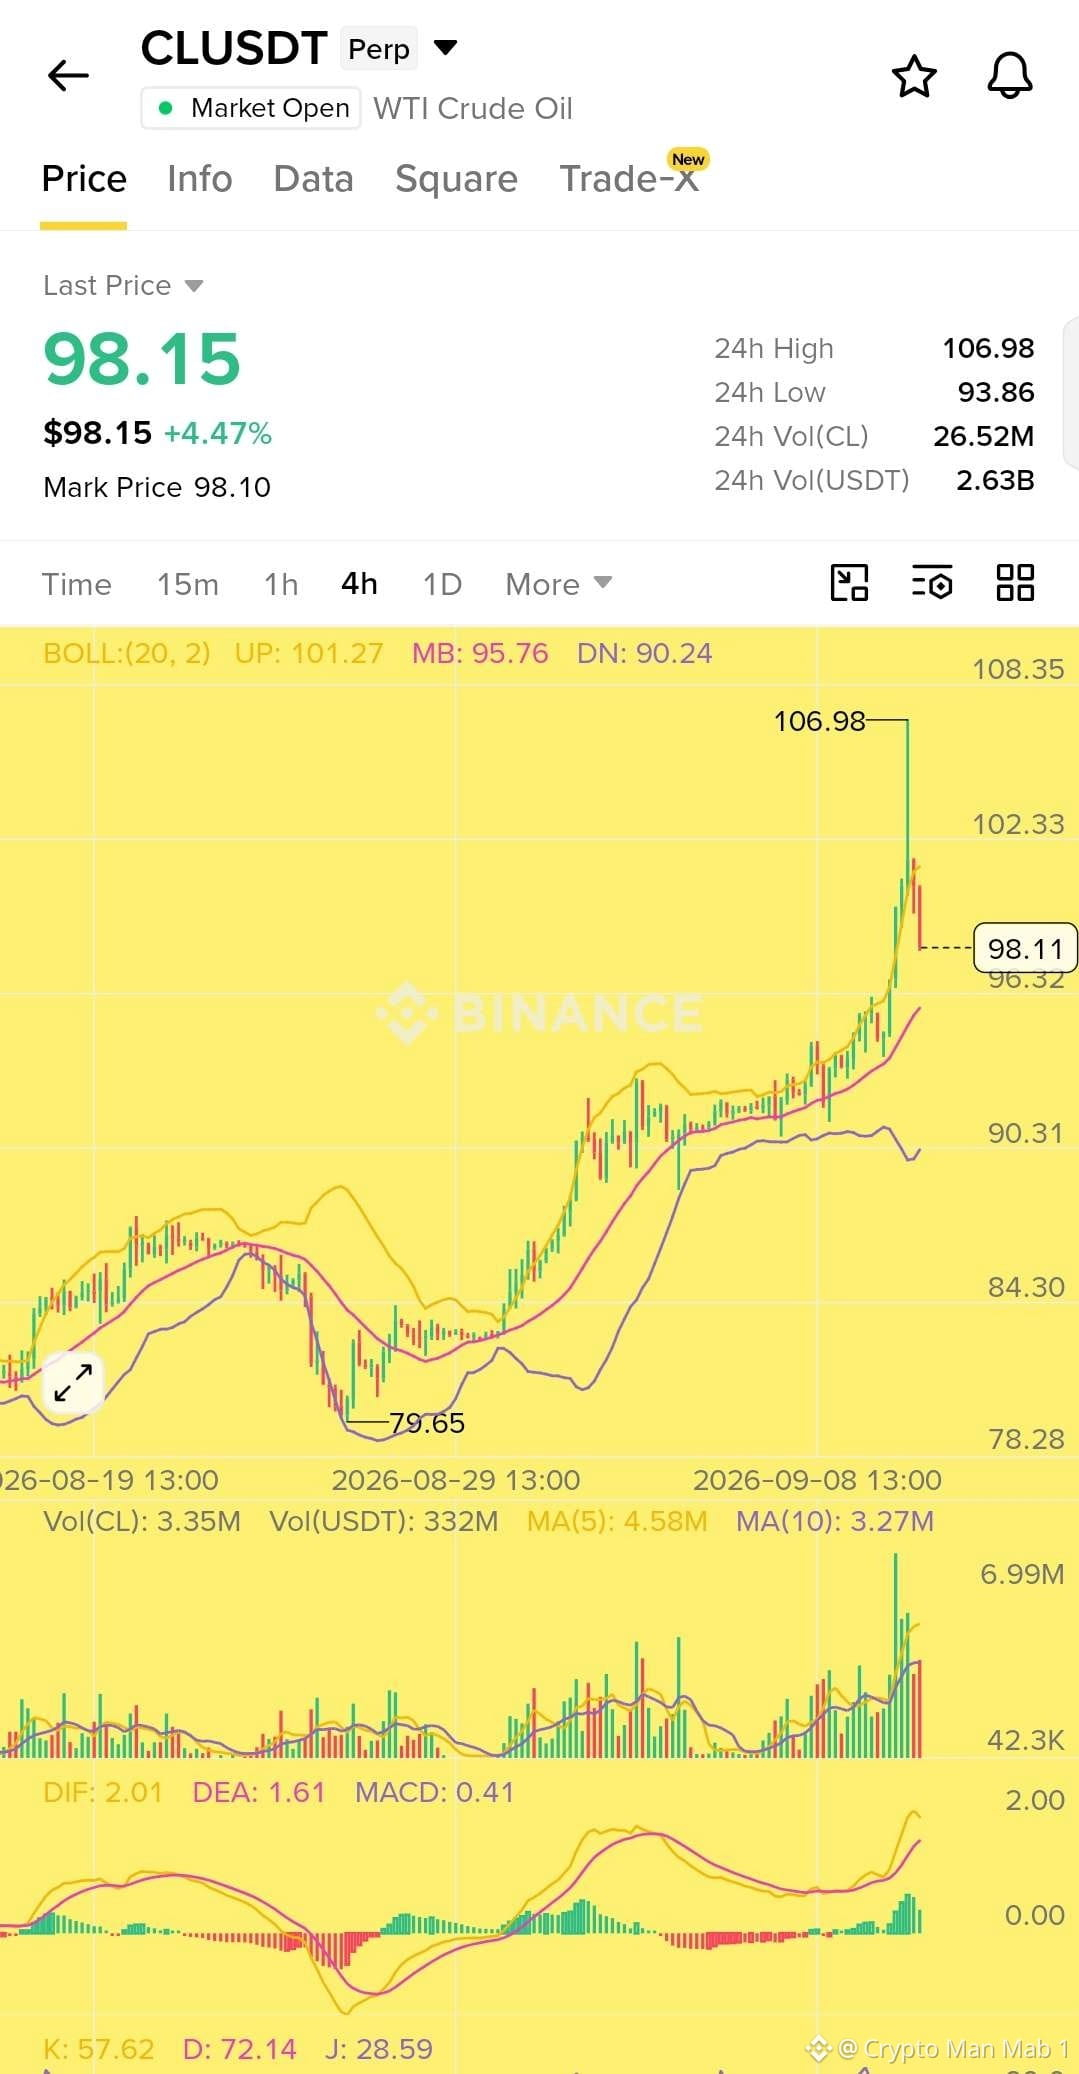
$CL is showing signs of exhaustion after the sharp move toward the $106.98 high.
Price is now pulling back from the upper Bollinger Band while the 4H chart shows a stretched move and momentum starting to cool. I’m watching the $100 area closely. If price fails to reclaim and hold above $100 then a deeper pullback toward $97 to $94 becomes possible.
For a scalp I think the short side offers a better risk to reward here.
Scalp Short $CL
Entry: $100 - $98
TP: $97 - $96 - $95 - $94
SL: $102
Key confirmation: rejection around $100 and continued weakness below $98.
$CL is showing signs of exhaustion after the sharp move toward the $106.98 high.
Price is now pulling back from the upper Bollinger Band while the 4H chart shows a stretched move and momentum starting to cool. I’m watching the $100 area closely. If price fails to reclaim and hold above $100 then a deeper pullback toward $97 to $94 becomes possible.
For a scalp I think the short side offers a better risk to reward here.
Scalp Short $CL
Entry: $100 - $98
TP: $97 - $96 - $95 - $94
SL: $102
Key confirmation: rejection around $100 and continued weakness below $98.
Price is now pulling back from the upper Bollinger Band while the 4H chart shows a stretched move and momentum starting to cool. I’m watching the $100 area closely. If price fails to reclaim and hold above $100 then a deeper pullback toward $97 to $94 becomes possible.
For a scalp I think the short side offers a better risk to reward here.
Scalp Short $CL
Entry: $100 - $98
TP: $97 - $96 - $95 - $94
SL: $102
Key confirmation: rejection around $100 and continued weakness below $98.
64
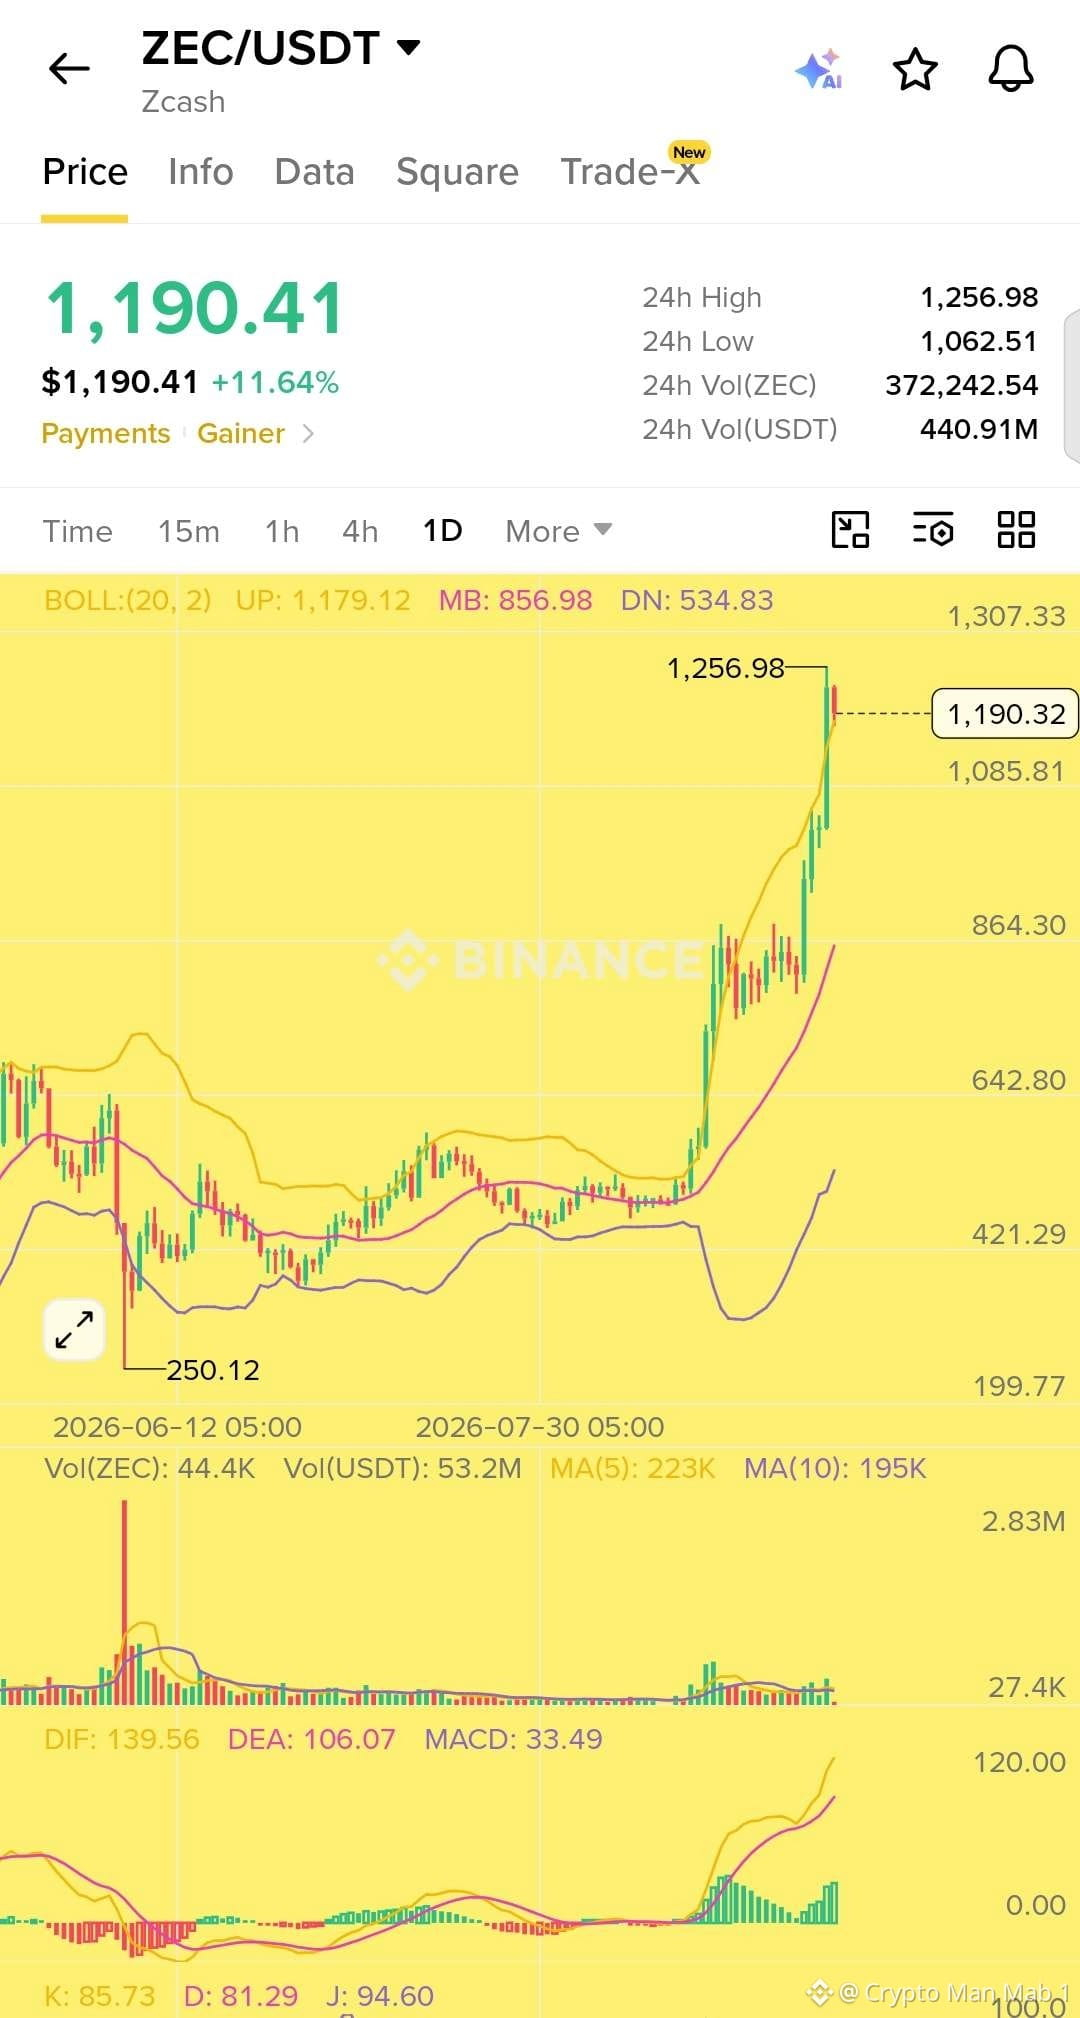
$ZEC just broke above $1,190 🚨👀
Zcash is now trading around $1,195, pushing its market cap close to $19.5B.
The big catalyst? Grayscale reportedly increased its ZEC holdings by 10.5%, marking a strong shift from the flat flows seen after its August launch.
That buying helped squeeze shorts, triggering around $34.5M in liquidations and sending ZEC into the top 10.
But there’s another side to this move.
Futures open interest has climbed to roughly $2.57B, meaning a huge amount of leverage is now sitting behind the rally.
$ZEC just broke above $1,190 🚨👀
Zcash is now trading around $1,195, pushing its market cap close to $19.5B.
The big catalyst? Grayscale reportedly increased its ZEC holdings by 10.5%, marking a strong shift from the flat flows seen after its August launch.
That buying helped squeeze shorts, triggering around $34.5M in liquidations and sending ZEC into the top 10.
But there’s another side to this move.
Futures open interest has climbed to roughly $2.57B, meaning a huge amount of leverage is now sitting behind the rally.
Zcash is now trading around $1,195, pushing its market cap close to $19.5B.
The big catalyst? Grayscale reportedly increased its ZEC holdings by 10.5%, marking a strong shift from the flat flows seen after its August launch.
That buying helped squeeze shorts, triggering around $34.5M in liquidations and sending ZEC into the top 10.
But there’s another side to this move.
Futures open interest has climbed to roughly $2.57B, meaning a huge amount of leverage is now sitting behind the rally.
71
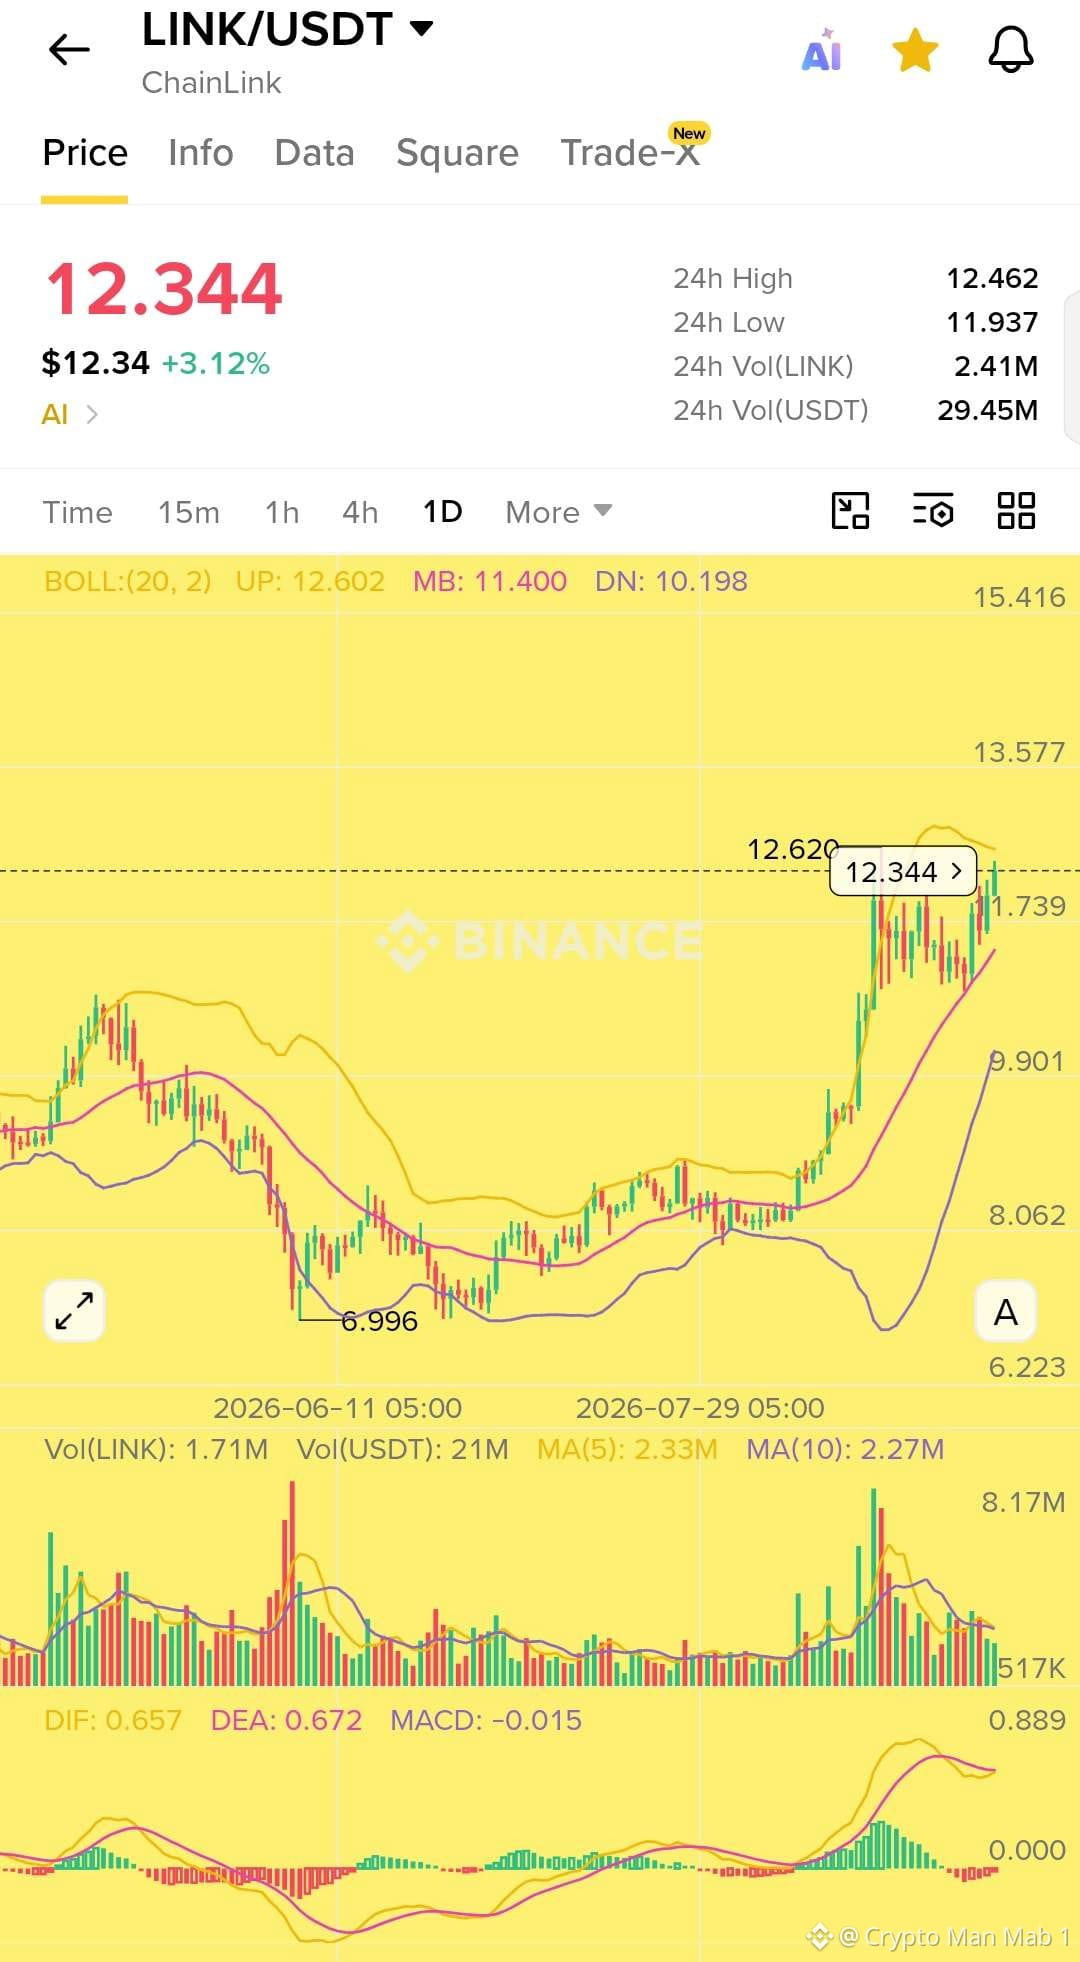
$LINK is looking strong on the daily chart 👀
Chainlink has made a strong move higher and is now consolidating around $12.3 after breaking out from the lower range.
Price is still holding above the Bollinger middle band around $11.40, which keeps the bigger picture bullish. The main level to watch now is $12.60. A clean breakout above that area with strong volume could open the door toward $13.50+.
At the same time, MACD momentum is cooling slightly, so I’d avoid chasing and wait for confirmation.
📌 Key levels
Support: $11.40 → $10.20
Resistance: $12.60 → $13.57 → $15.40
If LINK flips $12.60 into support, the next leg could get interesting.
#LINK #Chainlink #LINKUSDT #CryptoTrading #Altcoins
$LINK is looking strong on the daily chart 👀
Chainlink has made a strong move higher and is now consolidating around $12.3 after breaking out from the lower range.
Price is still holding above the Bollinger middle band around $11.40, which keeps the bigger picture bullish. The main level to watch now is $12.60. A clean breakout above that area with strong volume could open the door toward $13.50+.
At the same time, MACD momentum is cooling slightly, so I’d avoid chasing and wait for confirmation.
📌 Key levels
Support: $11.40 → $10.20
Resistance: $12.60 → $13.57 → $15.40
If LINK flips $12.60 into support, the next leg could get interesting.
#LINK #Chainlink #LINKUSDT #CryptoTrading #Altcoins
Chainlink has made a strong move higher and is now consolidating around $12.3 after breaking out from the lower range.
Price is still holding above the Bollinger middle band around $11.40, which keeps the bigger picture bullish. The main level to watch now is $12.60. A clean breakout above that area with strong volume could open the door toward $13.50+.
At the same time, MACD momentum is cooling slightly, so I’d avoid chasing and wait for confirmation.
📌 Key levels
Support: $11.40 → $10.20
Resistance: $12.60 → $13.57 → $15.40
If LINK flips $12.60 into support, the next leg could get interesting.
#LINK #Chainlink #LINKUSDT #CryptoTrading #Altcoins
66
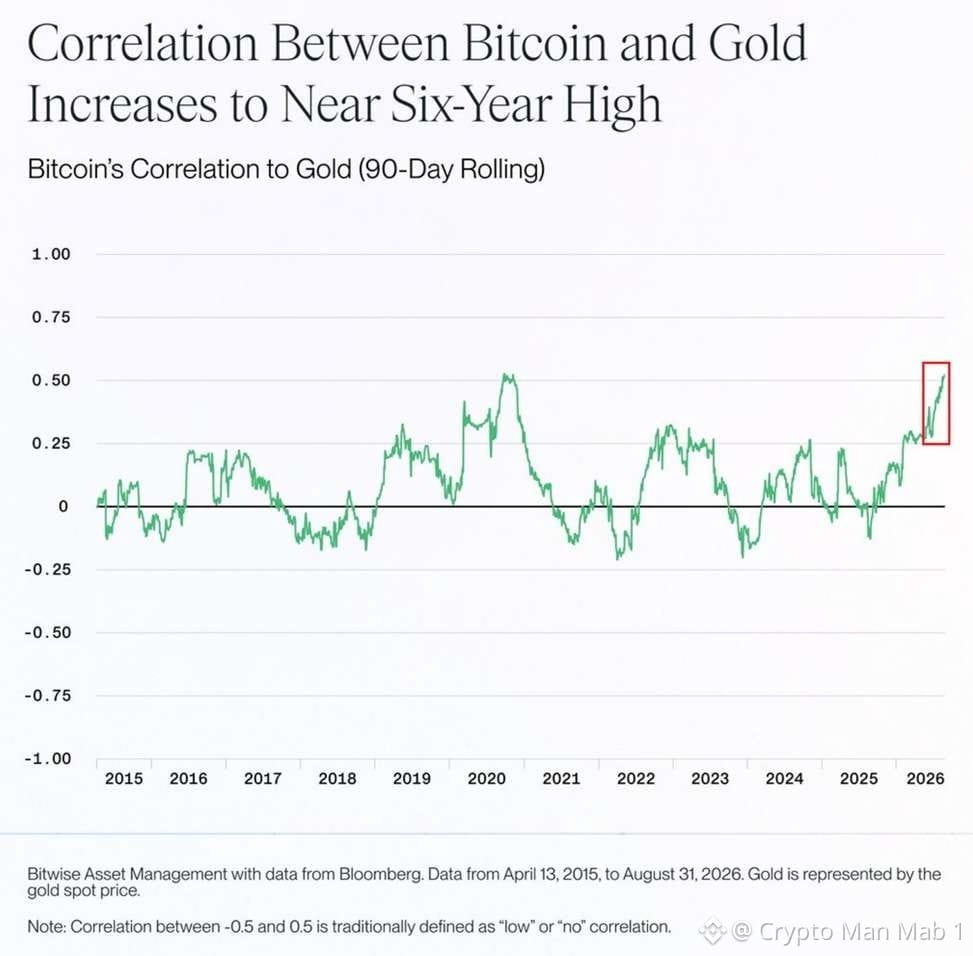
Bitcoin and gold are starting to move more and more alike.
The 90 day correlation between BTC and gold has climbed to around +0.50, getting close to the record levels we saw during the 2020 pandemic.
What’s even more interesting is that this correlation has more than doubled since the beginning of the year.
For comparison, during the recovery from the 2022 bear market, the correlation only reached around +0.30.
The latest move picked up after the US Treasury announced on August 19 that it would at least double its buybacks of long dated government debt, increasing them from $2 billion to $4 billion per operation.
At the same time, Bitcoin’s correlation with the Nasdaq 100 has fallen to around 0.30, its lowest level in a year.
#BTC Price Analysis#
$BTC
Bitcoin and gold are starting to move more and more alike.
The 90 day correlation between BTC and gold has climbed to around +0.50, getting close to the record levels we saw during the 2020 pandemic.
What’s even more interesting is that this correlation has more than doubled since the beginning of the year.
For comparison, during the recovery from the 2022 bear market, the correlation only reached around +0.30.
The latest move picked up after the US Treasury announced on August 19 that it would at least double its buybacks of long dated government debt, increasing them from $2 billion to $4 billion per operation.
At the same time, Bitcoin’s correlation with the Nasdaq 100 has fallen to around 0.30, its lowest level in a year.
#BTC Price Analysis#
$BTC
The 90 day correlation between BTC and gold has climbed to around +0.50, getting close to the record levels we saw during the 2020 pandemic.
What’s even more interesting is that this correlation has more than doubled since the beginning of the year.
For comparison, during the recovery from the 2022 bear market, the correlation only reached around +0.30.
The latest move picked up after the US Treasury announced on August 19 that it would at least double its buybacks of long dated government debt, increasing them from $2 billion to $4 billion per operation.
At the same time, Bitcoin’s correlation with the Nasdaq 100 has fallen to around 0.30, its lowest level in a year.
#BTC Price Analysis#
$BTC
66
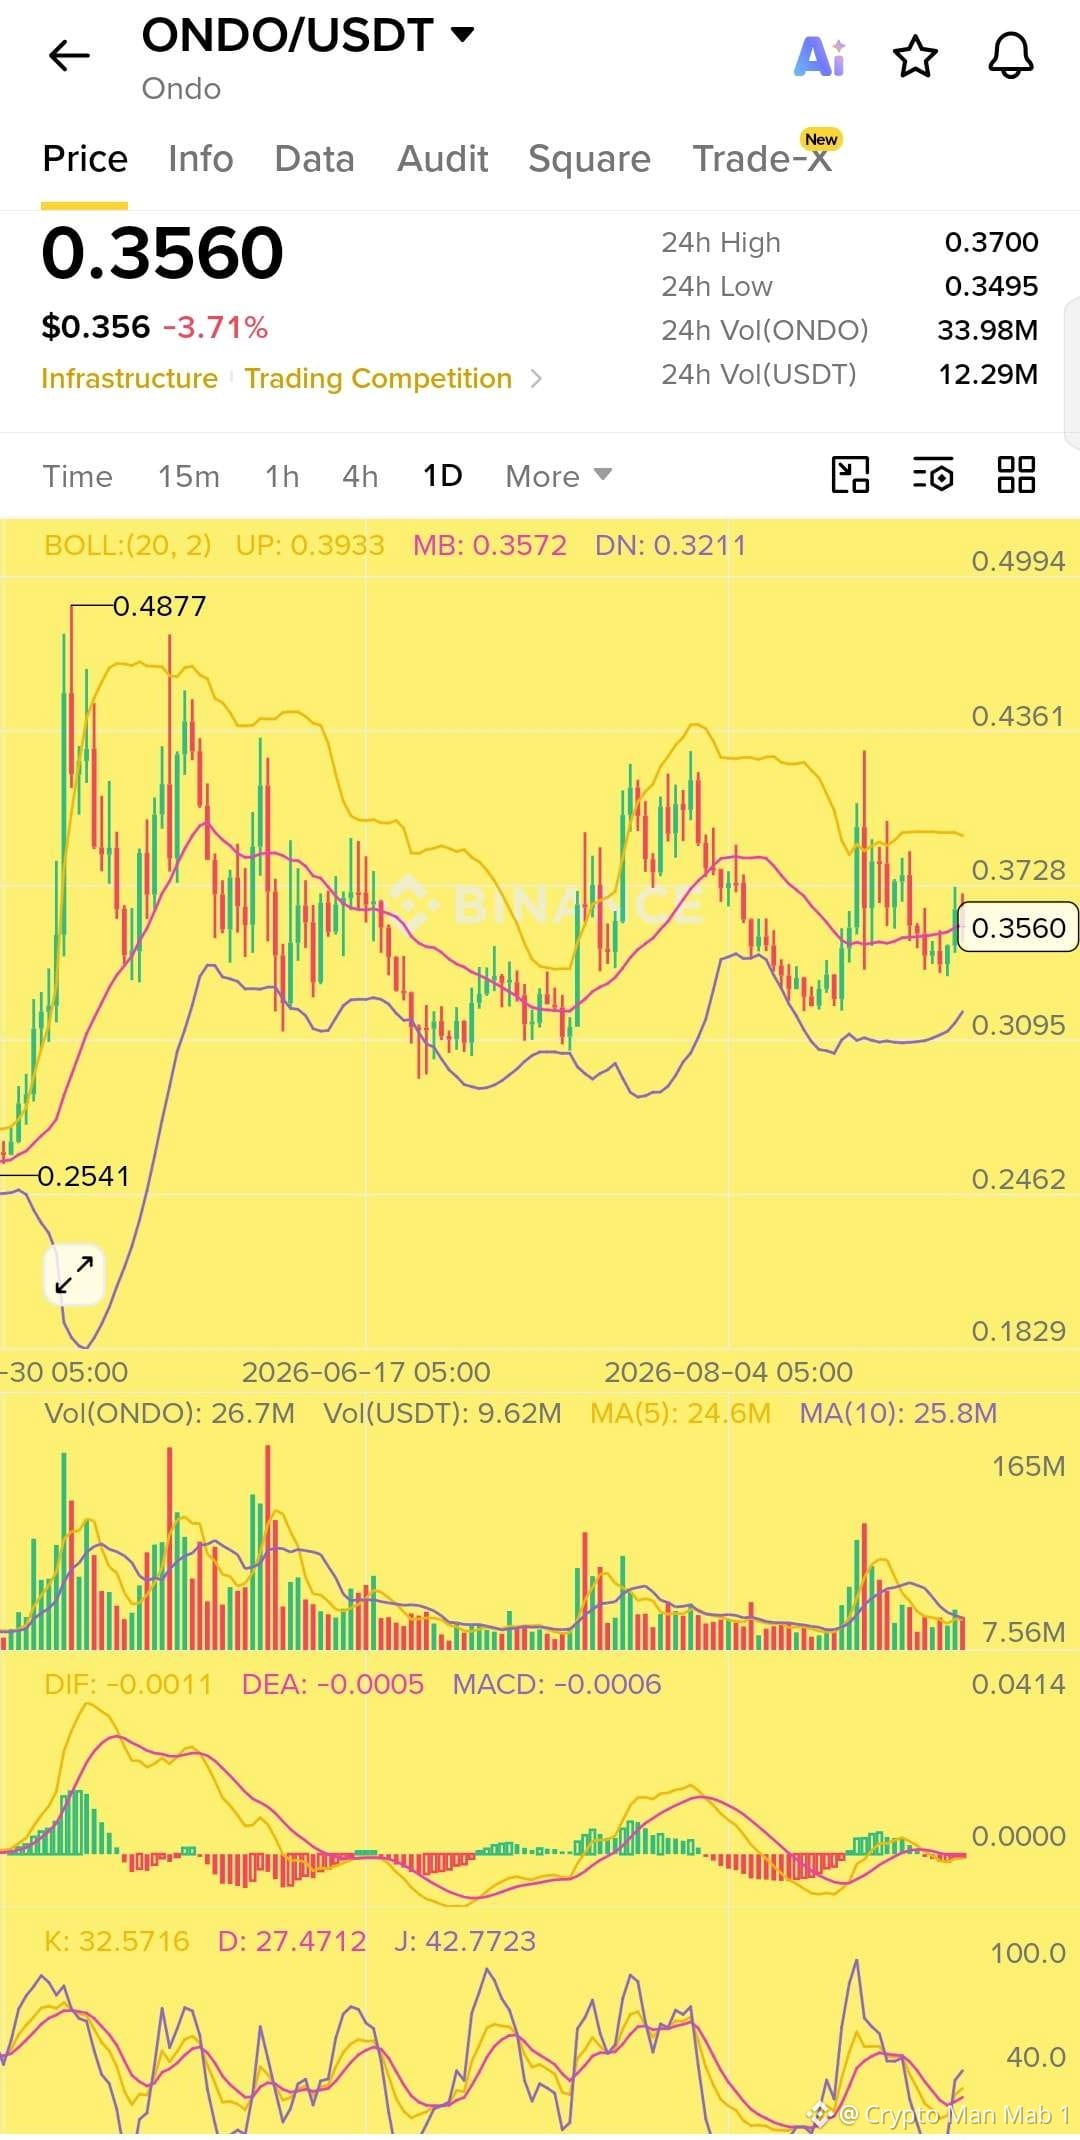
$ONDO is sitting at an interesting level 👀
ONDO is trading around $0.356, right near the Bollinger middle band at $0.357. Price has been moving sideways for a while, but buyers are still defending the $0.34–$0.35 area.
If ONDO can reclaim $0.37–$0.38 with good volume, the next levels I’m watching are around $0.393 and potentially $0.43.
On the downside, losing $0.34 could send price back toward the $0.32 support area.
Overall, I’m watching for a breakout rather than chasing the current range. 📈
Key levels:
🟢 Support: $0.34 → $0.32
🚀 Resistance: $0.37 → $0.393 → $0.43
#ONDO #ONDOUSDT #Crypto #CryptoTrading #RWA
$ONDO is sitting at an interesting level 👀
ONDO is trading around $0.356, right near the Bollinger middle band at $0.357. Price has been moving sideways for a while, but buyers are still defending the $0.34–$0.35 area.
If ONDO can reclaim $0.37–$0.38 with good volume, the next levels I’m watching are around $0.393 and potentially $0.43.
On the downside, losing $0.34 could send price back toward the $0.32 support area.
Overall, I’m watching for a breakout rather than chasing the current range. 📈
Key levels:
🟢 Support: $0.34 → $0.32
🚀 Resistance: $0.37 → $0.393 → $0.43
#ONDO #ONDOUSDT #Crypto #CryptoTrading #RWA
ONDO is trading around $0.356, right near the Bollinger middle band at $0.357. Price has been moving sideways for a while, but buyers are still defending the $0.34–$0.35 area.
If ONDO can reclaim $0.37–$0.38 with good volume, the next levels I’m watching are around $0.393 and potentially $0.43.
On the downside, losing $0.34 could send price back toward the $0.32 support area.
Overall, I’m watching for a breakout rather than chasing the current range. 📈
Key levels:
🟢 Support: $0.34 → $0.32
🚀 Resistance: $0.37 → $0.393 → $0.43
#ONDO #ONDOUSDT #Crypto #CryptoTrading #RWA
88
Ethereum ETFs are keeping the momentum alive. 🔥
ETH ETFs have now recorded 11 consecutive sessions of inflows, while XRP and Solana funds have each reached 10 straight positive days.
That kind of consistency is hard to ignore.
It shows that institutional interest is expanding beyond Bitcoin, with capital increasingly flowing into major altcoins.
If this trend continues, the next phase of the market could get very interesting. 👀📈
Crypto liquidity is moving, and the altcoin market is starting to feel it.
$SOL $ETH $BTC
Ethereum ETFs are keeping the momentum alive. 🔥
ETH ETFs have now recorded 11 consecutive sessions of inflows, while XRP and Solana funds have each reached 10 straight positive days.
That kind of consistency is hard to ignore.
It shows that institutional interest is expanding beyond Bitcoin, with capital increasingly flowing into major altcoins.
If this trend continues, the next phase of the market could get very interesting. 👀📈
Crypto liquidity is moving, and the altcoin market is starting to feel it.
$SOL $ETH $BTC
ETH ETFs have now recorded 11 consecutive sessions of inflows, while XRP and Solana funds have each reached 10 straight positive days.
That kind of consistency is hard to ignore.
It shows that institutional interest is expanding beyond Bitcoin, with capital increasingly flowing into major altcoins.
If this trend continues, the next phase of the market could get very interesting. 👀📈
Crypto liquidity is moving, and the altcoin market is starting to feel it.
$SOL $ETH $BTC

65
🎂 Happy Birthday @BNBChain 🟡
6 years ago, BNB Smart Chain launched with a simple mission: make Web3 faster, cheaper and accessible to the next billion users.
Look at what it has become today 👇
🚀 5,000+ projects building across the ecosystem
👥 611M+ unique BSC addresses
⚡ 31M daily transactions reached an all-time high
💰 $14B+ peak TVL
🏦 $1.8B+ in tokenized real-world assets
💵 $14B stablecoin market cap at its peak
🔥 95% reduction in malicious MEV attacks
⛽ Gas fees pushed as low as $0.001
🌐 BNB Chain has expanded beyond BSC with opBNB and BNB Greenfield, building a broader infrastructure for DeFi, AI, gaming, payments, RWAs and more.
And the network keeps evolving.
Today, BNB Chain is processing millions of daily active users while pushing toward faster finality, lower fees and greater scalability.
From DeFi summer to stablecoins, RWAs, AI and the next generation of Web3 applications, BNB Chain has played a massive role in bringing crypto to millions of users.
6 years down.
The next billion users are still waiting.
Happy Birthday, BNB Chain! 🟡
#BNBChain #BNB #BNBDay #Web3 #Crypto
$BNB
🎂 Happy Birthday @BNBChain 🟡
6 years ago, BNB Smart Chain launched with a simple mission: make Web3 faster, cheaper and accessible to the next billion users.
Look at what it has become today 👇
🚀 5,000+ projects building across the ecosystem
👥 611M+ unique BSC addresses
⚡ 31M daily transactions reached an all-time high
💰 $14B+ peak TVL
🏦 $1.8B+ in tokenized real-world assets
💵 $14B stablecoin market cap at its peak
🔥 95% reduction in malicious MEV attacks
⛽ Gas fees pushed as low as $0.001
🌐 BNB Chain has expanded beyond BSC with opBNB and BNB Greenfield, building a broader infrastructure for DeFi, AI, gaming, payments, RWAs and more.
And the network keeps evolving.
Today, BNB Chain is processing millions of daily active users while pushing toward faster finality, lower fees and greater scalability.
From DeFi summer to stablecoins, RWAs, AI and the next generation of Web3 applications, BNB Chain has played a massive role in bringing crypto to millions of users.
6 years down.
The next billion users are still waiting.
Happy Birthday, BNB Chain! 🟡
#BNBChain #BNB #BNBDay #Web3 #Crypto
$BNB
6 years ago, BNB Smart Chain launched with a simple mission: make Web3 faster, cheaper and accessible to the next billion users.
Look at what it has become today 👇
🚀 5,000+ projects building across the ecosystem
👥 611M+ unique BSC addresses
⚡ 31M daily transactions reached an all-time high
💰 $14B+ peak TVL
🏦 $1.8B+ in tokenized real-world assets
💵 $14B stablecoin market cap at its peak
🔥 95% reduction in malicious MEV attacks
⛽ Gas fees pushed as low as $0.001
🌐 BNB Chain has expanded beyond BSC with opBNB and BNB Greenfield, building a broader infrastructure for DeFi, AI, gaming, payments, RWAs and more.
And the network keeps evolving.
Today, BNB Chain is processing millions of daily active users while pushing toward faster finality, lower fees and greater scalability.
From DeFi summer to stablecoins, RWAs, AI and the next generation of Web3 applications, BNB Chain has played a massive role in bringing crypto to millions of users.
6 years down.
The next billion users are still waiting.
Happy Birthday, BNB Chain! 🟡
#BNBChain #BNB #BNBDay #Web3 #Crypto
$BNB

81
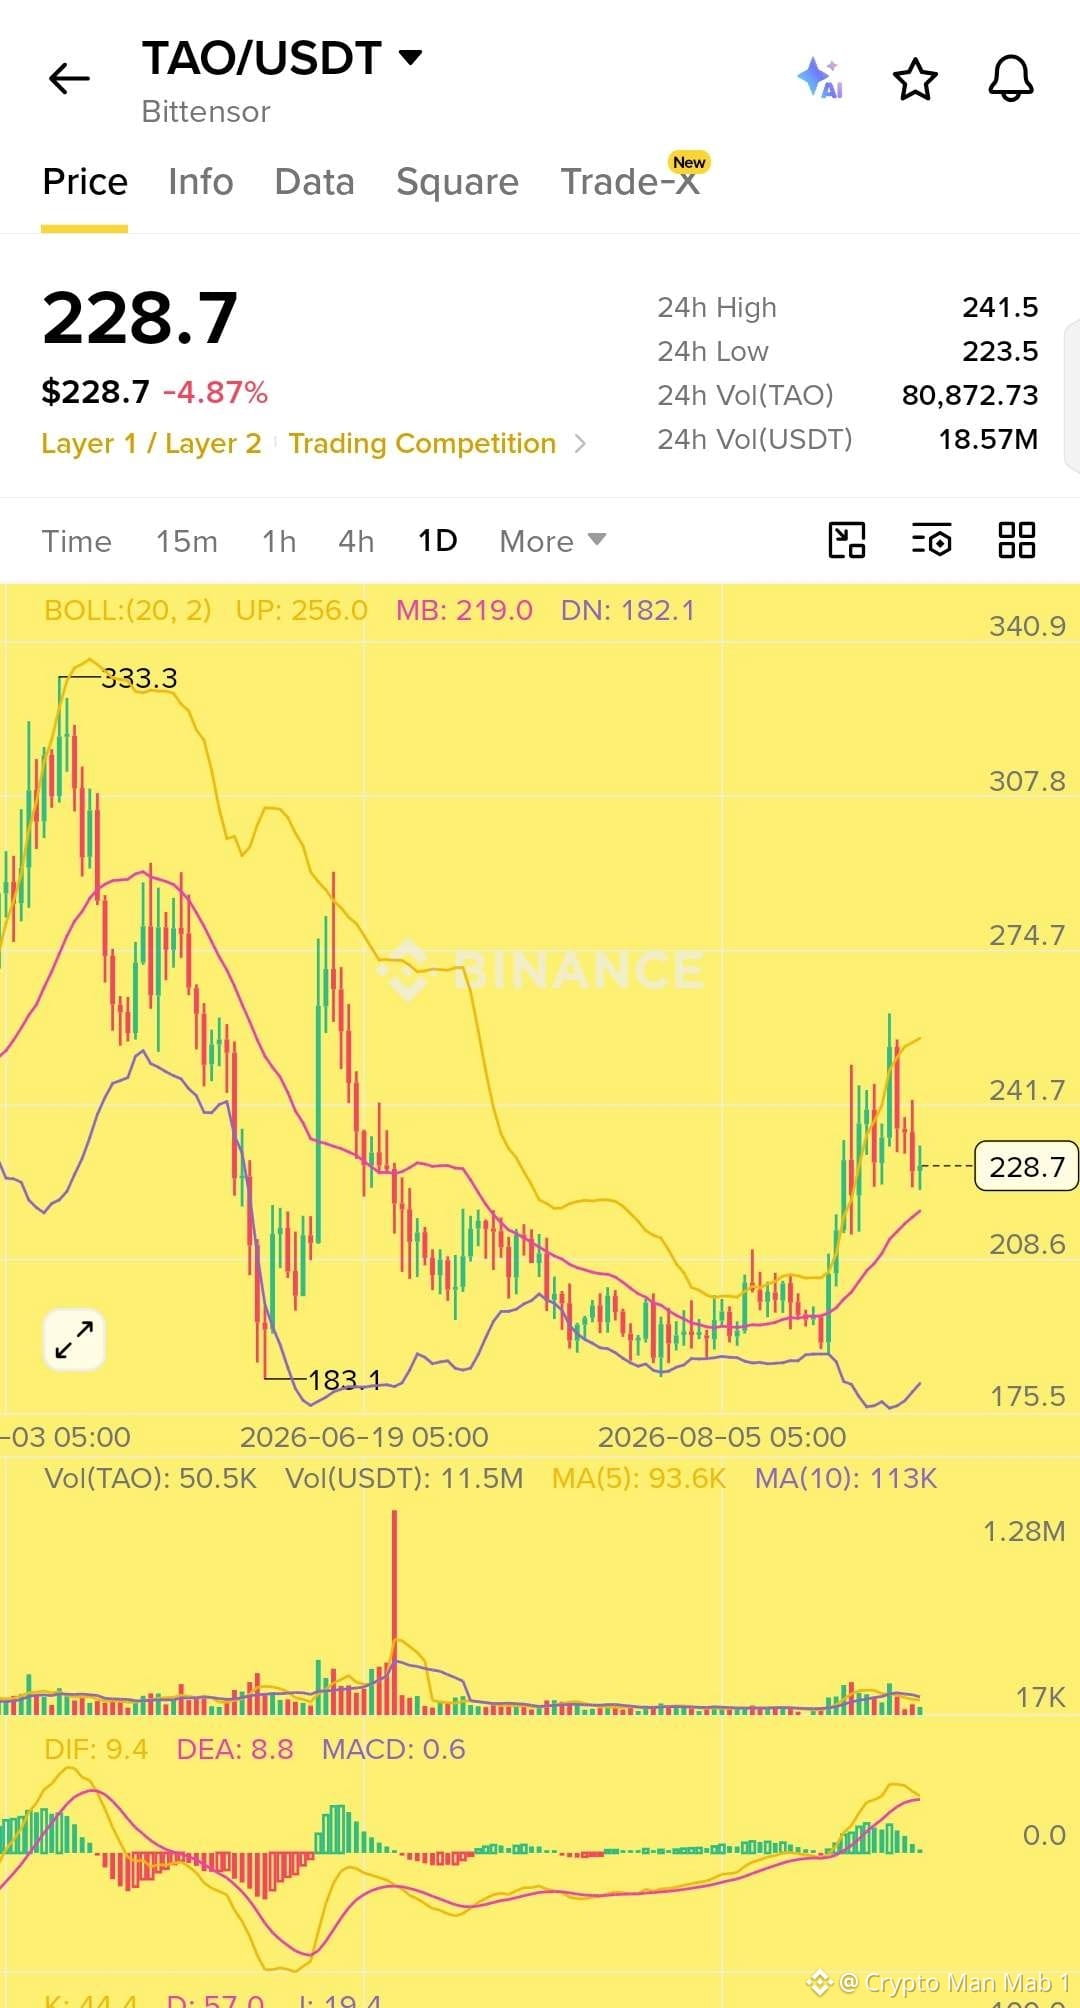
$TAO is looking interesting after the recent breakout 👀
Price pushed above $240 but is now cooling off around $228. The important thing is that the overall structure still looks stronger than it did during the previous downtrend.
The daily Bollinger middle band is around $219, while MACD is still in positive territory. Volume also picked up during the breakout, showing that there was real buying interest behind the move.
Right now, TAO looks like it’s taking a breather after the rally. If buyers step back in and price manages to reclaim the $240 area, that could be an important sign that the bullish momentum is returning.
For now, I’d watch how price behaves around the $220 to $225 region rather than chasing the move. 📈
$TAO is looking interesting after the recent breakout 👀
Price pushed above $240 but is now cooling off around $228. The important thing is that the overall structure still looks stronger than it did during the previous downtrend.
The daily Bollinger middle band is around $219, while MACD is still in positive territory. Volume also picked up during the breakout, showing that there was real buying interest behind the move.
Right now, TAO looks like it’s taking a breather after the rally. If buyers step back in and price manages to reclaim the $240 area, that could be an important sign that the bullish momentum is returning.
For now, I’d watch how price behaves around the $220 to $225 region rather than chasing the move. 📈
Price pushed above $240 but is now cooling off around $228. The important thing is that the overall structure still looks stronger than it did during the previous downtrend.
The daily Bollinger middle band is around $219, while MACD is still in positive territory. Volume also picked up during the breakout, showing that there was real buying interest behind the move.
Right now, TAO looks like it’s taking a breather after the rally. If buyers step back in and price manages to reclaim the $240 area, that could be an important sign that the bullish momentum is returning.
For now, I’d watch how price behaves around the $220 to $225 region rather than chasing the move. 📈
71
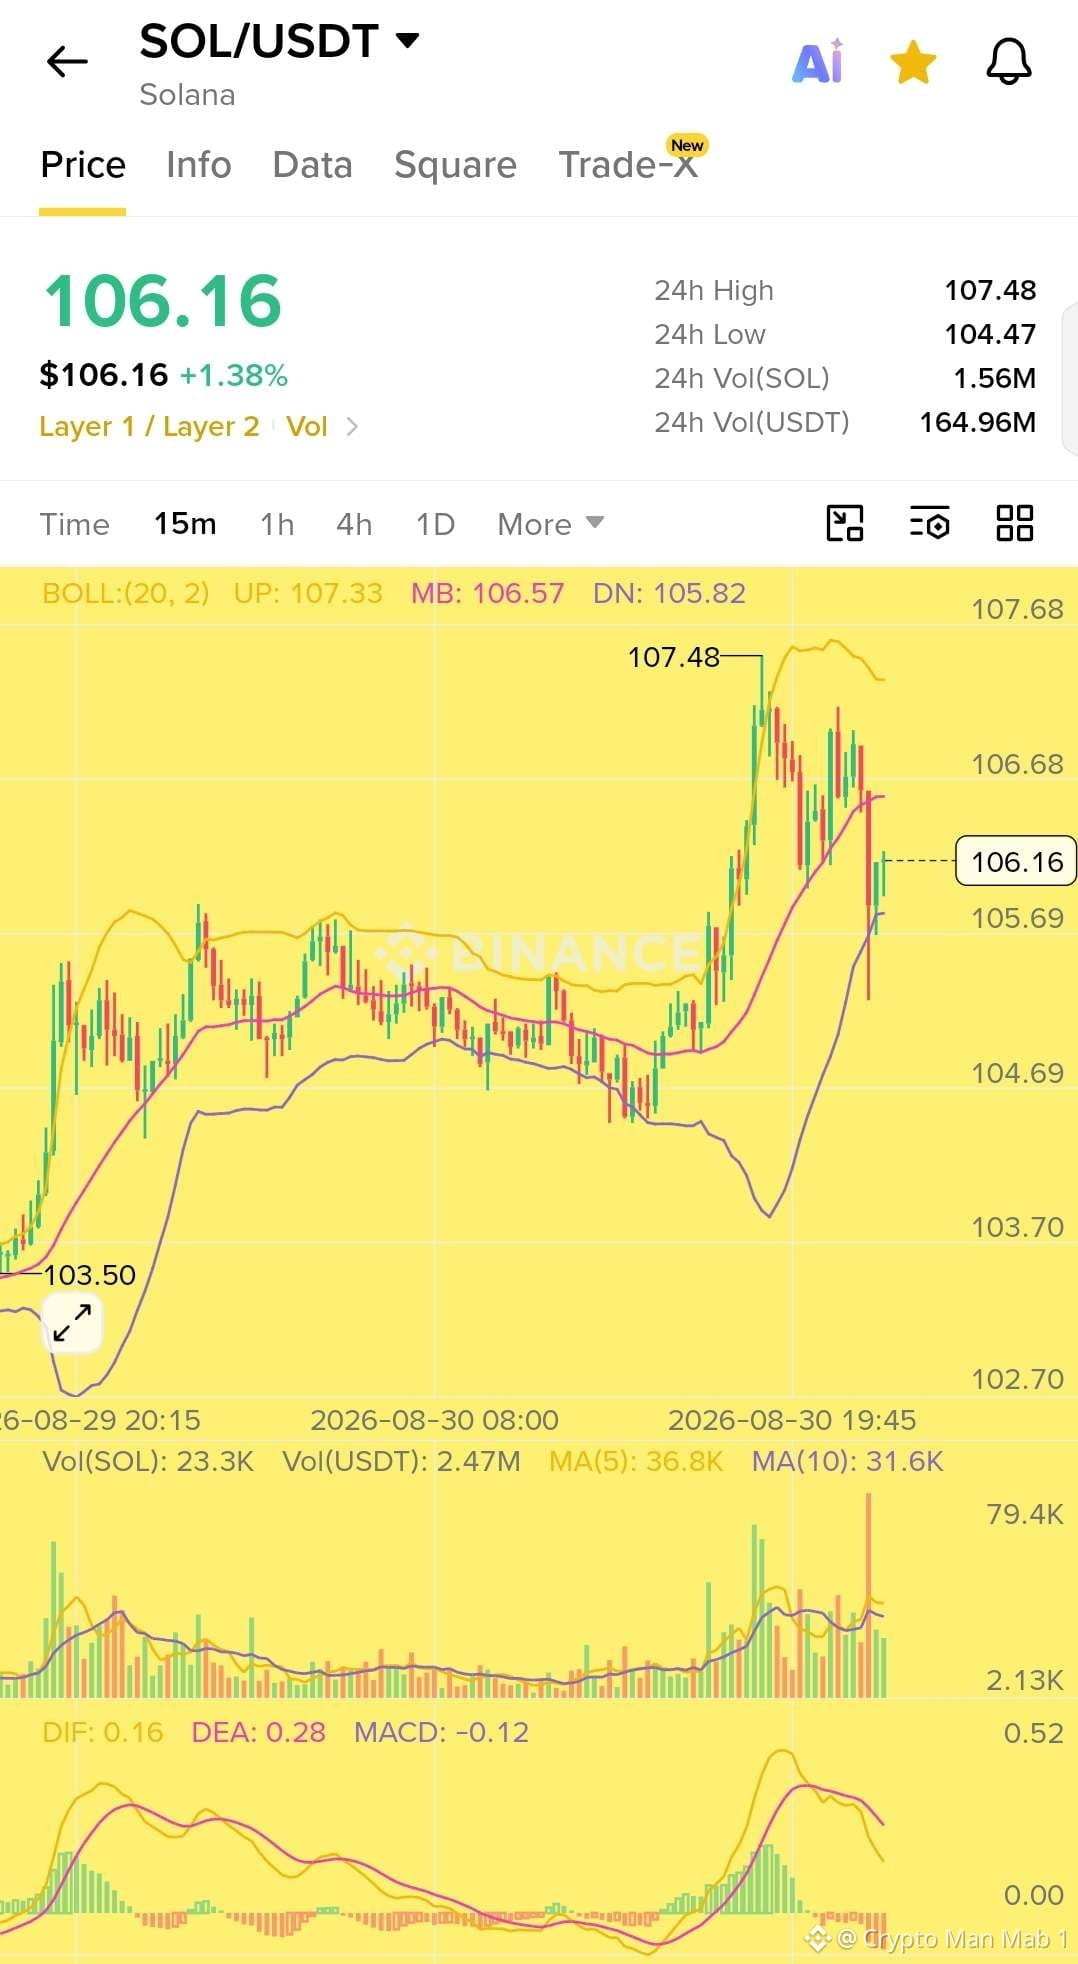
$SOLSolana governance vote delivers 25% transaction speed boost
A recent on-chain governance vote on the Solana network has resulted in a 25% increase in transaction speed, marking a notable improvement in network efficiency.
The upgrade was passed through Solana's on-chain governance process, reflecting the network's ability to implement protocol-level changes through community consensus.
$SOLSolana governance vote delivers 25% transaction speed boost
A recent on-chain governance vote on the Solana network has resulted in a 25% increase in transaction speed, marking a notable improvement in network efficiency.
The upgrade was passed through Solana's on-chain governance process, reflecting the network's ability to implement protocol-level changes through community consensus.
A recent on-chain governance vote on the Solana network has resulted in a 25% increase in transaction speed, marking a notable improvement in network efficiency.
The upgrade was passed through Solana's on-chain governance process, reflecting the network's ability to implement protocol-level changes through community consensus.
72
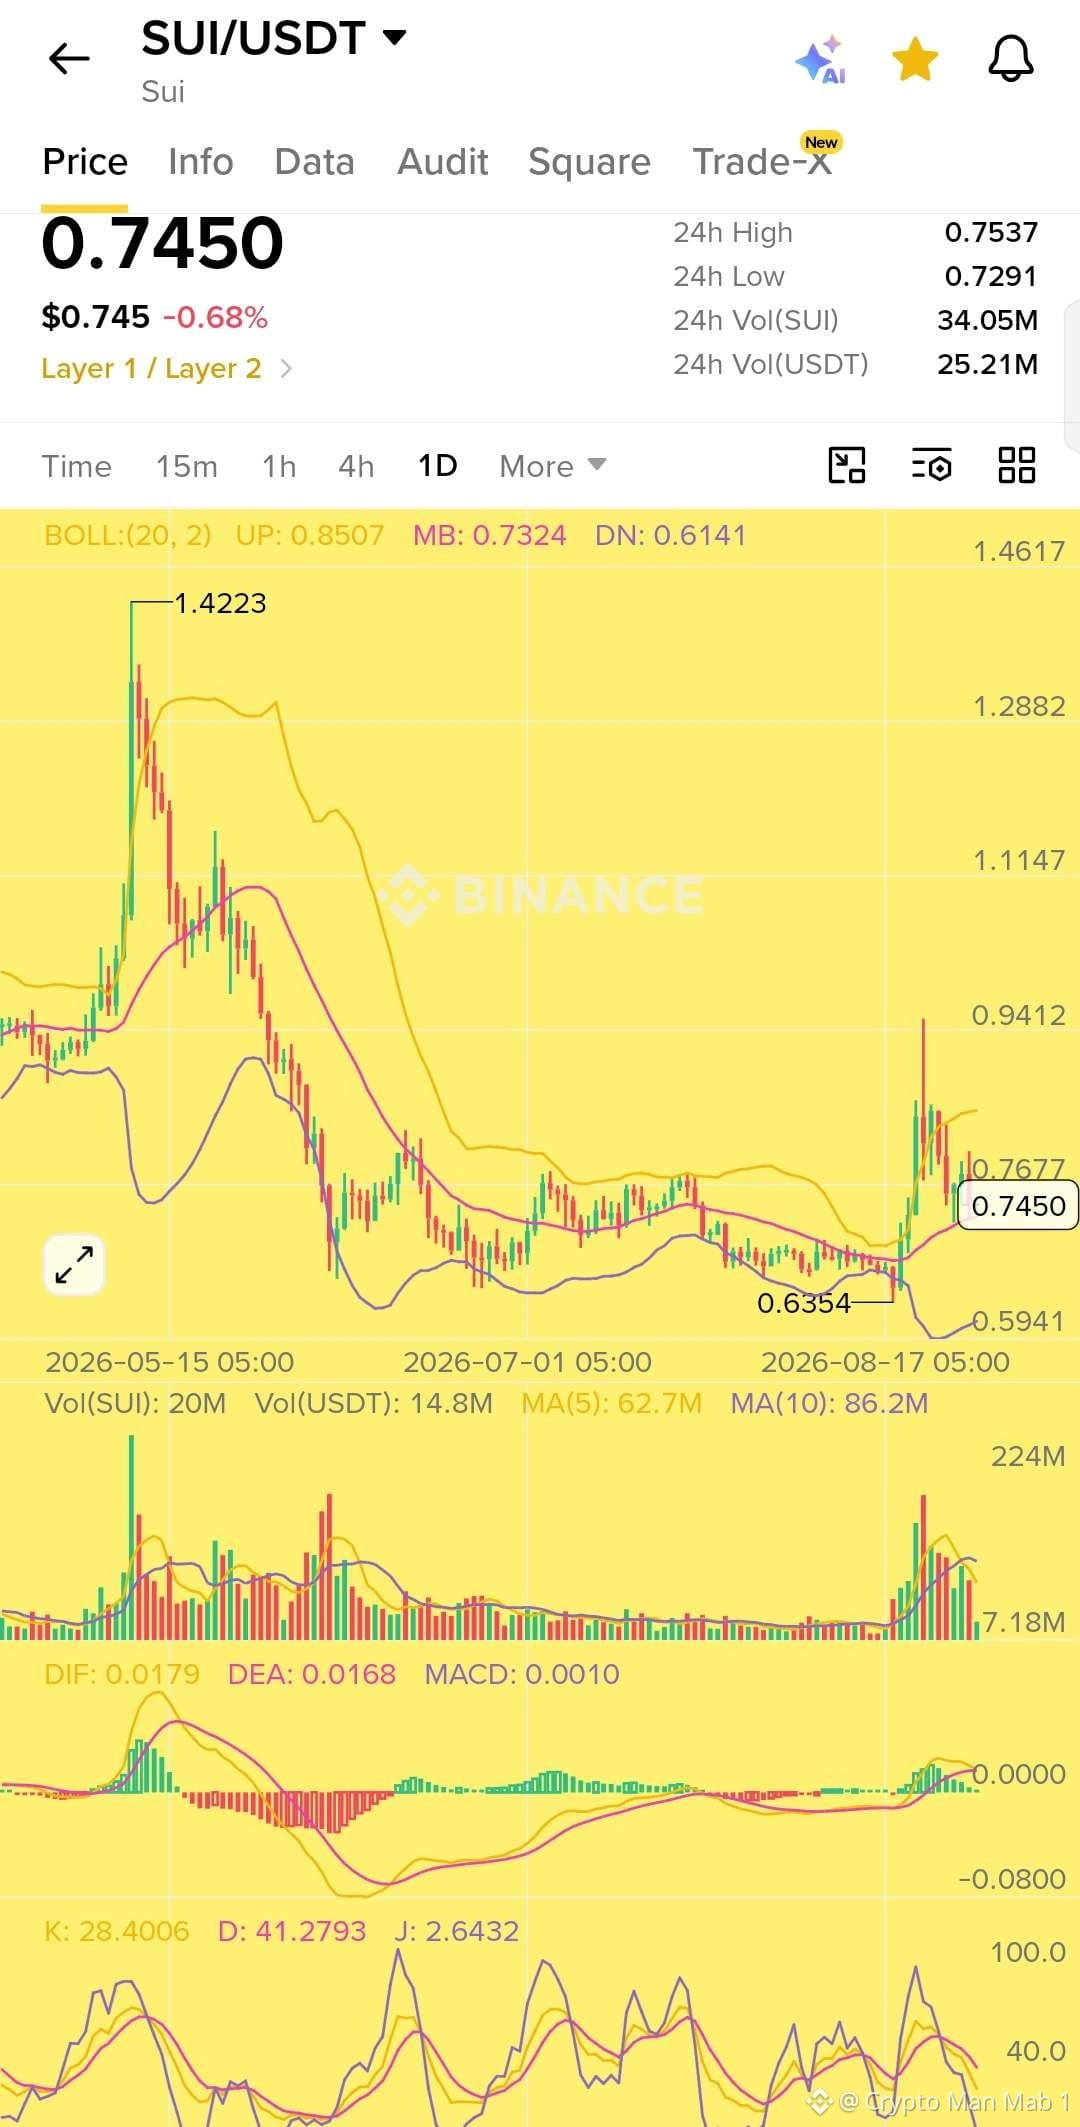
$SUI is starting to look interesting here 👀
Price is holding around $0.745 and has managed to stay above the Bollinger middle band near $0.732. MACD is also showing positive momentum while volume has picked up after the recent move.
The key level to watch now is $0.767. A strong daily close above this area could open the way toward $0.80 then $0.85 and potentially $0.94.
For me $0.72 to $0.75 is an interesting zone to watch for a long setup.
Entry: $0.72 to $0.75
Confirmation: Break and close above $0.767
TP: $0.80 $0.85 $0.94
SL: $0.70
If $0.70 breaks with strong selling pressure I would stay away from longs because $0.635 could come back into play.
Watching $SUI closely from here. 📈
$SUI is starting to look interesting here 👀
Price is holding around $0.745 and has managed to stay above the Bollinger middle band near $0.732. MACD is also showing positive momentum while volume has picked up after the recent move.
The key level to watch now is $0.767. A strong daily close above this area could open the way toward $0.80 then $0.85 and potentially $0.94.
For me $0.72 to $0.75 is an interesting zone to watch for a long setup.
Entry: $0.72 to $0.75
Confirmation: Break and close above $0.767
TP: $0.80 $0.85 $0.94
SL: $0.70
If $0.70 breaks with strong selling pressure I would stay away from longs because $0.635 could come back into play.
Watching $SUI closely from here. 📈
Price is holding around $0.745 and has managed to stay above the Bollinger middle band near $0.732. MACD is also showing positive momentum while volume has picked up after the recent move.
The key level to watch now is $0.767. A strong daily close above this area could open the way toward $0.80 then $0.85 and potentially $0.94.
For me $0.72 to $0.75 is an interesting zone to watch for a long setup.
Entry: $0.72 to $0.75
Confirmation: Break and close above $0.767
TP: $0.80 $0.85 $0.94
SL: $0.70
If $0.70 breaks with strong selling pressure I would stay away from longs because $0.635 could come back into play.
Watching $SUI closely from here. 📈
76
$BTC 🟠 Bitcoin Completes Its First Quantum Safe Transaction
Bitcoin has reportedly completed its first transaction secured with QSB or Quantum Safe Bitcoin.
The new approach is designed to protect Bitcoin against Shor’s algorithm which could theoretically allow powerful quantum computers to break the elliptic curve cryptography Bitcoin currently relies on.
What makes QSB interesting is that it works within Bitcoin’s existing legacy rules. No hard fork or consensus change was required to execute the transaction.
As quantum computing continues to advance this could become an important step toward making Bitcoin more resilient against future cryptographic threats.
Quantum computing may still be years away from posing a real threat but preparing for it today could be one of the most important challenges for Bitcoin’s long term security. 🟠
$BTC 🟠 Bitcoin Completes Its First Quantum Safe Transaction
Bitcoin has reportedly completed its first transaction secured with QSB or Quantum Safe Bitcoin.
The new approach is designed to protect Bitcoin against Shor’s algorithm which could theoretically allow powerful quantum computers to break the elliptic curve cryptography Bitcoin currently relies on.
What makes QSB interesting is that it works within Bitcoin’s existing legacy rules. No hard fork or consensus change was required to execute the transaction.
As quantum computing continues to advance this could become an important step toward making Bitcoin more resilient against future cryptographic threats.
Quantum computing may still be years away from posing a real threat but preparing for it today could be one of the most important challenges for Bitcoin’s long term security. 🟠
Bitcoin has reportedly completed its first transaction secured with QSB or Quantum Safe Bitcoin.
The new approach is designed to protect Bitcoin against Shor’s algorithm which could theoretically allow powerful quantum computers to break the elliptic curve cryptography Bitcoin currently relies on.
What makes QSB interesting is that it works within Bitcoin’s existing legacy rules. No hard fork or consensus change was required to execute the transaction.
As quantum computing continues to advance this could become an important step toward making Bitcoin more resilient against future cryptographic threats.
Quantum computing may still be years away from posing a real threat but preparing for it today could be one of the most important challenges for Bitcoin’s long term security. 🟠

68
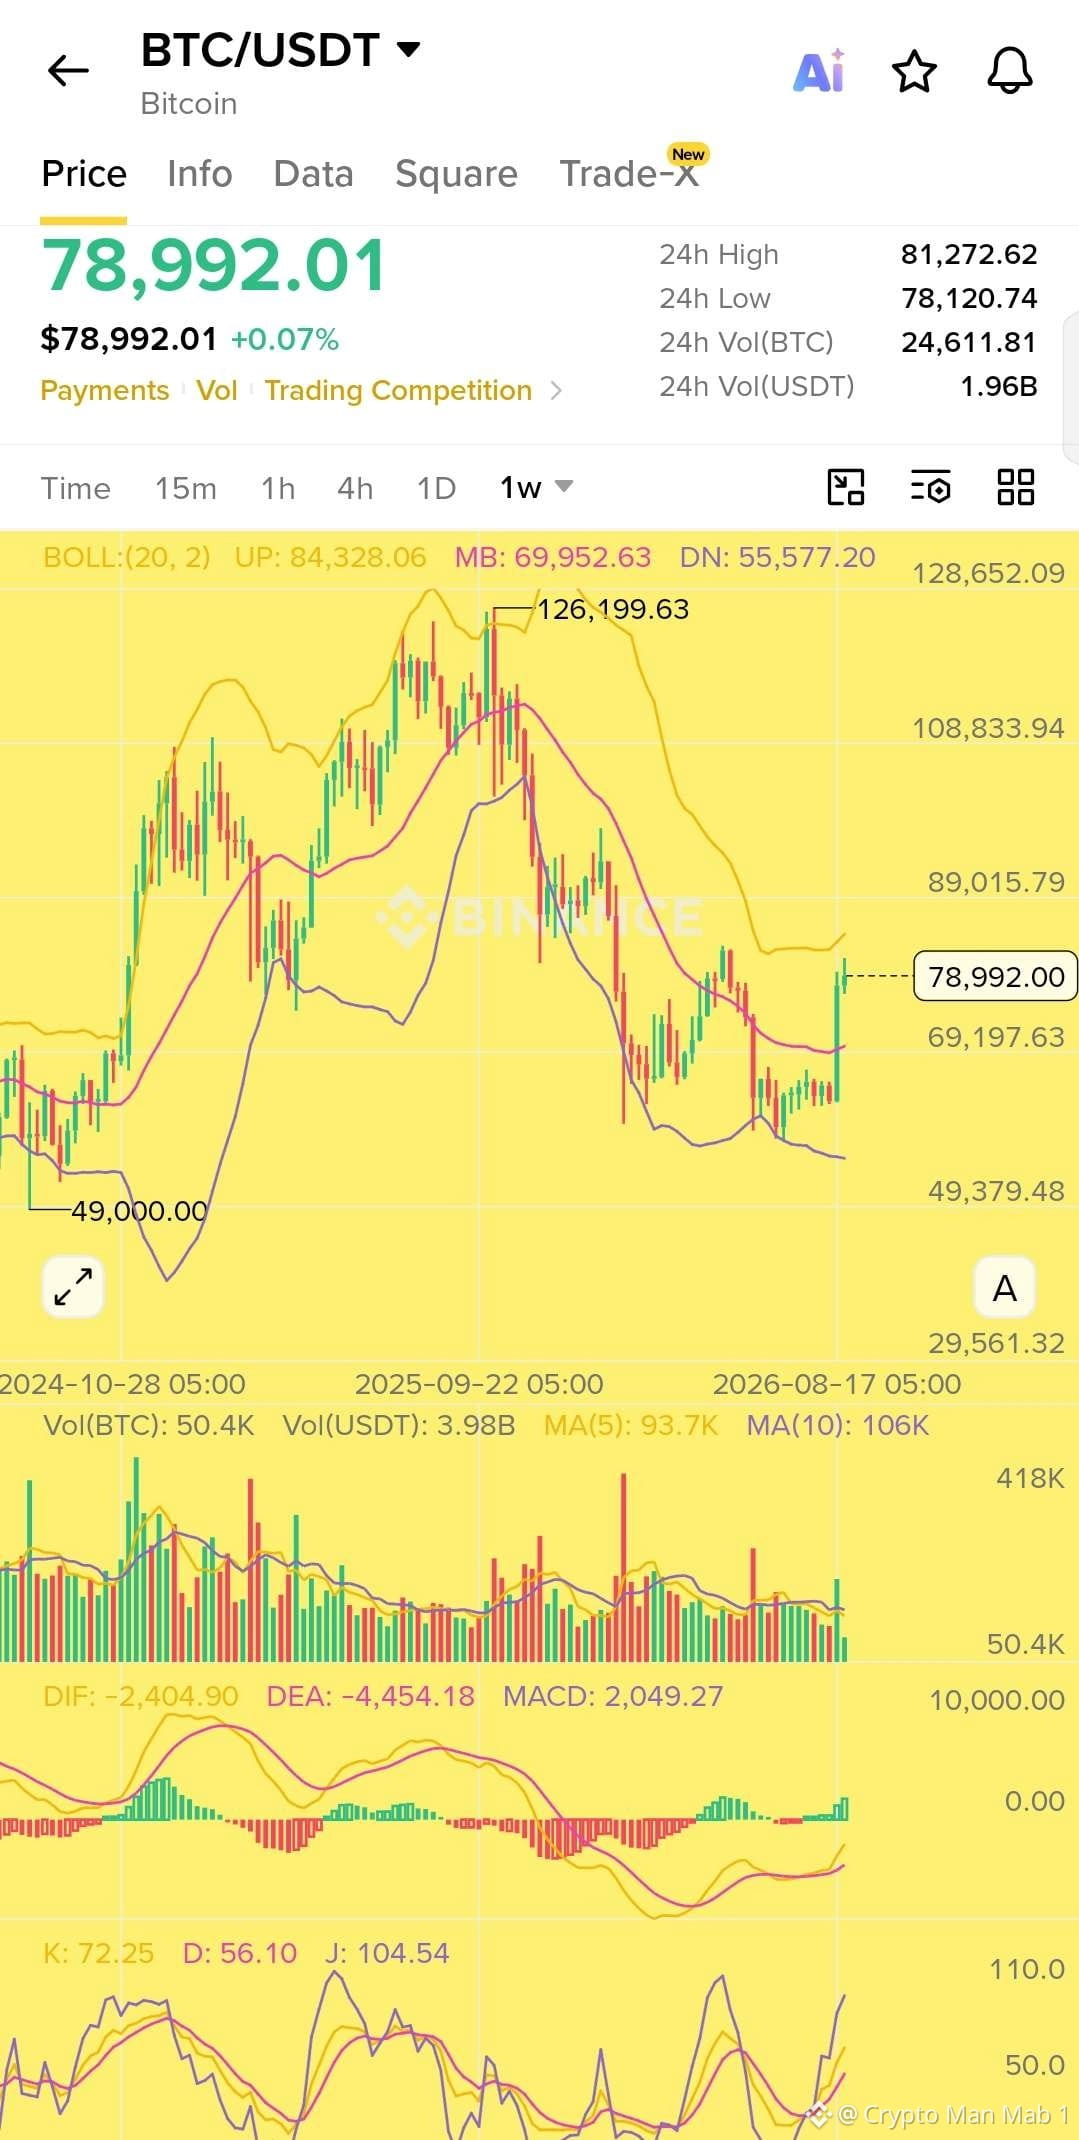
$BTC is starting to look interesting again 👀
On the weekly chart Bitcoin has pushed back above the $78K area after recovering strongly from the $55K zone.
The important level now is $81K to $84K. This is where I expect sellers to test the strength of this move.
If BTC breaks and closes the week above $84.3K then the next big area to watch is around $89K.
The momentum is also improving. MACD has turned positive and the weekly structure is looking much stronger than it was a few weeks ago.
But I wouldn't blindly chase the pump here.
If BTC gets rejected from $81K to $84K then a pullback toward $75K or even $70K would not surprise me.
For me the key level remains $70K.
Above it I'm still bullish.
Now BTC needs to prove that this recovery is more than just a bounce. 👀
$BTC is starting to look interesting again 👀
On the weekly chart Bitcoin has pushed back above the $78K area after recovering strongly from the $55K zone.
The important level now is $81K to $84K. This is where I expect sellers to test the strength of this move.
If BTC breaks and closes the week above $84.3K then the next big area to watch is around $89K.
The momentum is also improving. MACD has turned positive and the weekly structure is looking much stronger than it was a few weeks ago.
But I wouldn't blindly chase the pump here.
If BTC gets rejected from $81K to $84K then a pullback toward $75K or even $70K would not surprise me.
For me the key level remains $70K.
Above it I'm still bullish.
Now BTC needs to prove that this recovery is more than just a bounce. 👀
On the weekly chart Bitcoin has pushed back above the $78K area after recovering strongly from the $55K zone.
The important level now is $81K to $84K. This is where I expect sellers to test the strength of this move.
If BTC breaks and closes the week above $84.3K then the next big area to watch is around $89K.
The momentum is also improving. MACD has turned positive and the weekly structure is looking much stronger than it was a few weeks ago.
But I wouldn't blindly chase the pump here.
If BTC gets rejected from $81K to $84K then a pullback toward $75K or even $70K would not surprise me.
For me the key level remains $70K.
Above it I'm still bullish.
Now BTC needs to prove that this recovery is more than just a bounce. 👀
93
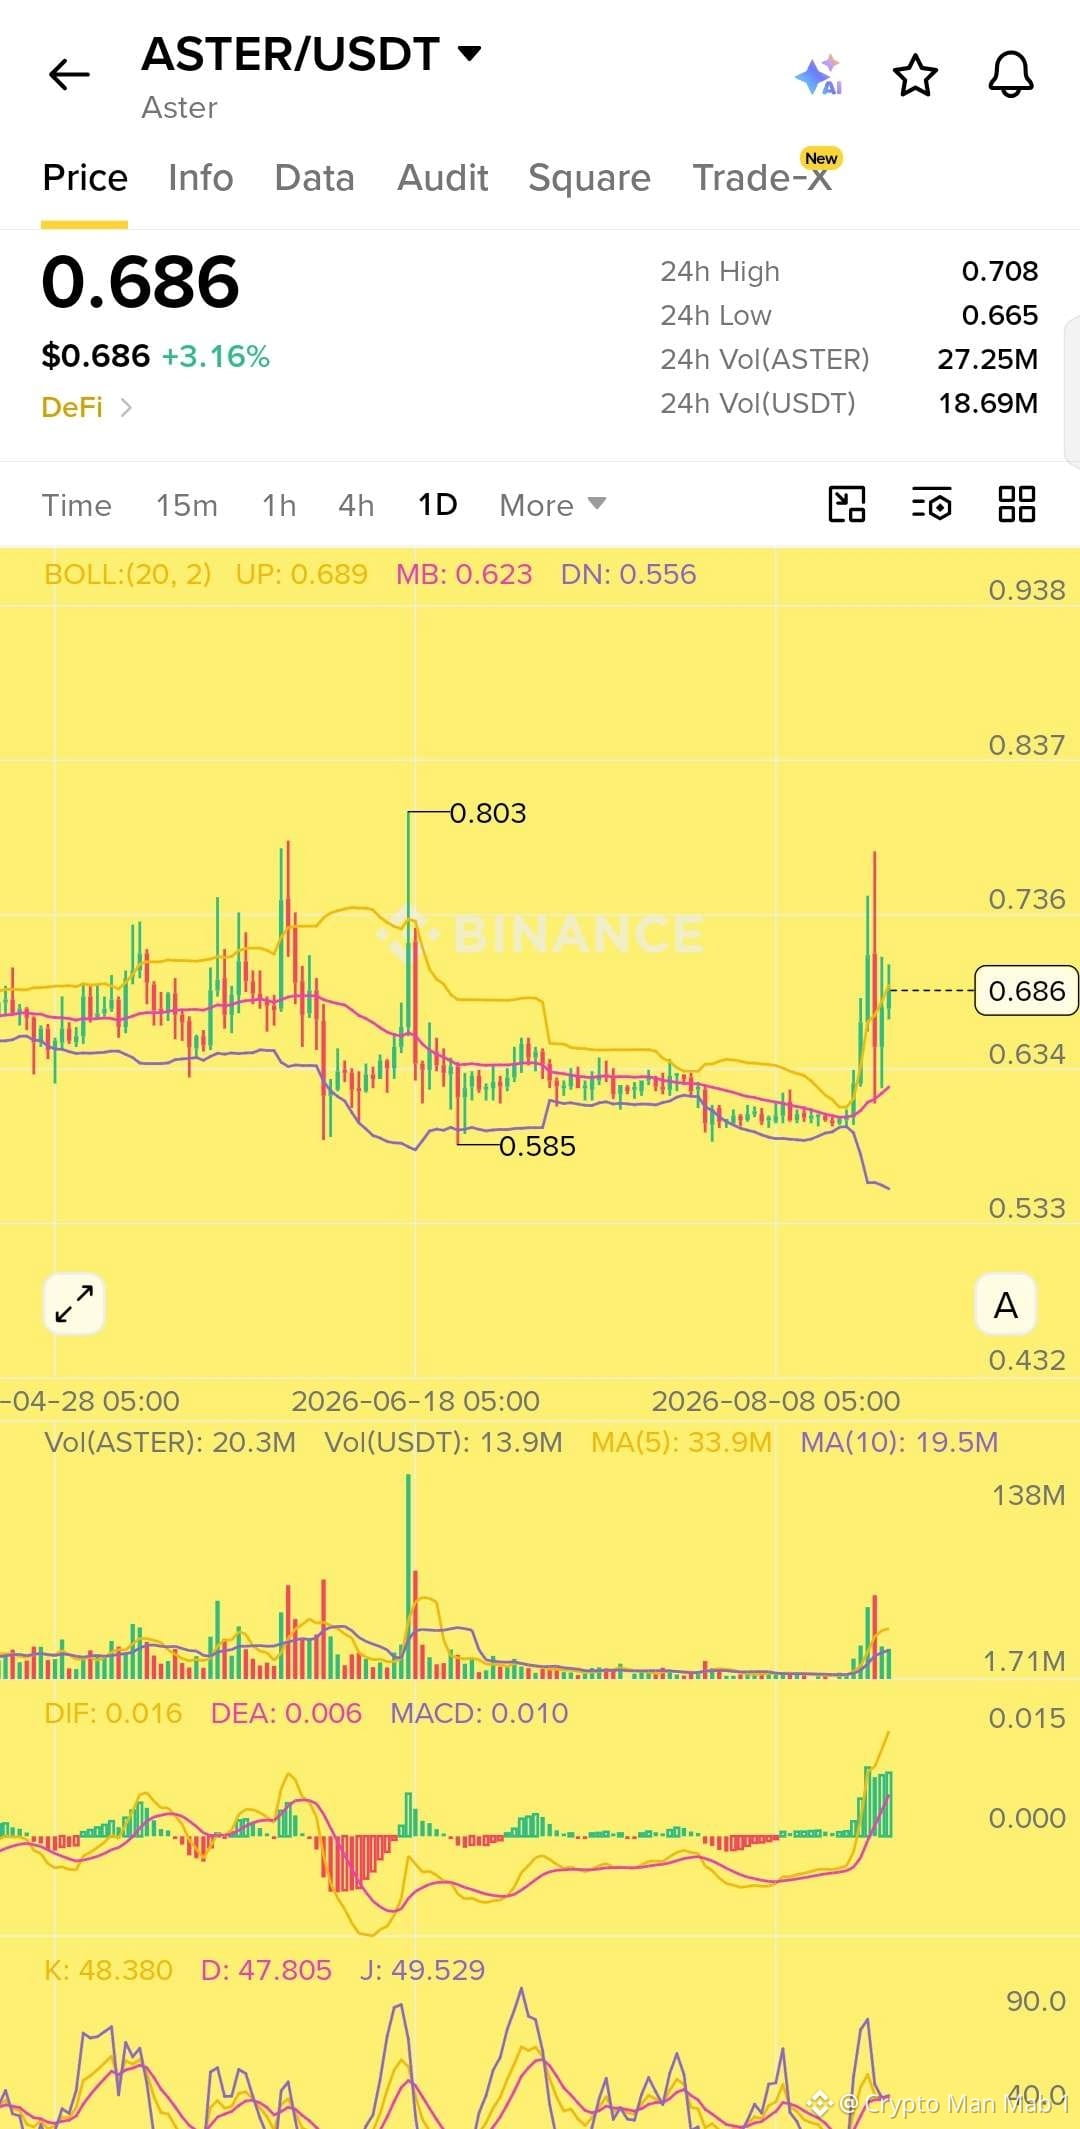
$ASTER and World LibertyFi are opening up major rewards for USD1 markets 👀
Aster has launched Phase 1 of its USD1 RWA campaign which will run until December 31 2026.
The campaign includes:
125M $WLFI rewards based on eligible open interest
6.25M $USD1 rewards based on eligible trading volume
And the interesting part is that you can qualify for both reward pools because open interest and trading volume are calculated separately.
Aster is also giving eligible USD1 denominated RWA positions a 2x open interest boost.
To get the full boost in Single Asset Mode you need to use only USD1 as collateral.
In Multi Asset Mode USD1 needs to represent more than 50% of your average collateral.
This could make USD1 RWA markets very interesting for traders looking to maximize rewards while trading.
Keep an eye on this one 👀
$ASTER and World LibertyFi are opening up major rewards for USD1 markets 👀
Aster has launched Phase 1 of its USD1 RWA campaign which will run until December 31 2026.
The campaign includes:
125M $WLFI rewards based on eligible open interest
6.25M $USD1 rewards based on eligible trading volume
And the interesting part is that you can qualify for both reward pools because open interest and trading volume are calculated separately.
Aster is also giving eligible USD1 denominated RWA positions a 2x open interest boost.
To get the full boost in Single Asset Mode you need to use only USD1 as collateral.
In Multi Asset Mode USD1 needs to represent more than 50% of your average collateral.
This could make USD1 RWA markets very interesting for traders looking to maximize rewards while trading.
Keep an eye on this one 👀
Aster has launched Phase 1 of its USD1 RWA campaign which will run until December 31 2026.
The campaign includes:
125M $WLFI rewards based on eligible open interest
6.25M $USD1 rewards based on eligible trading volume
And the interesting part is that you can qualify for both reward pools because open interest and trading volume are calculated separately.
Aster is also giving eligible USD1 denominated RWA positions a 2x open interest boost.
To get the full boost in Single Asset Mode you need to use only USD1 as collateral.
In Multi Asset Mode USD1 needs to represent more than 50% of your average collateral.
This could make USD1 RWA markets very interesting for traders looking to maximize rewards while trading.
Keep an eye on this one 👀
70
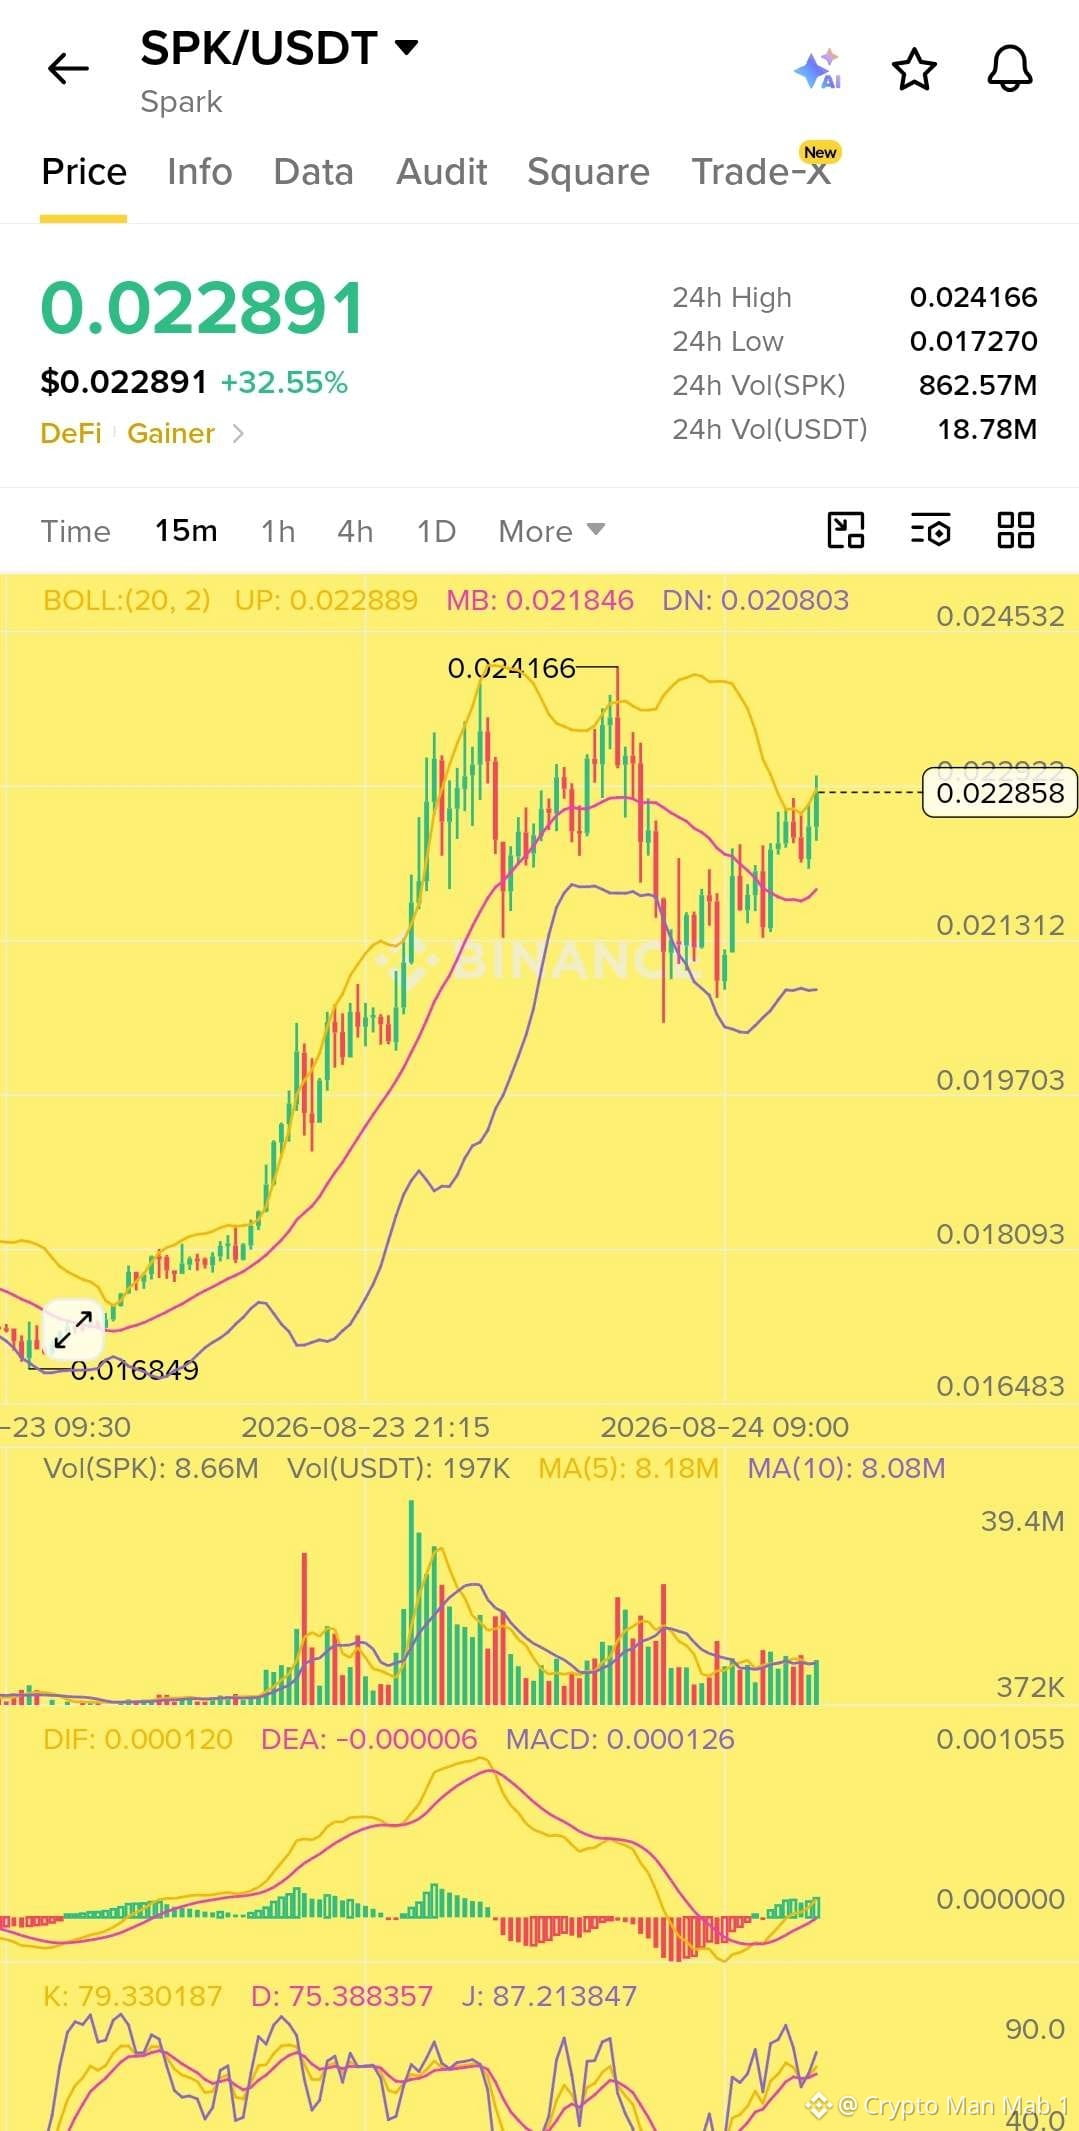
$SPK is showing strong bullish momentum on the 15M chart 📈
Price is currently around $0.02289 after a strong move higher. MACD is turning bullish and price is holding above the Bollinger middle band which keeps the short term structure positive.
The key zone to watch is $0.0230-$0.0232. A clean breakout with strong volume could open the way toward $0.0238 and then the 24H high around $0.02416.
However the KDJ is already in the overbought zone so chasing the current price is risky. A pullback toward $0.0220-$0.0223 could offer a better long entry if support holds.
Support: $0.0220-$0.0223
Resistance: $0.0230-$0.0232
Next target: $0.0238-$0.02416
Bullish above support but watch for rejection near resistance. DYOR.
$SPK is showing strong bullish momentum on the 15M chart 📈
Price is currently around $0.02289 after a strong move higher. MACD is turning bullish and price is holding above the Bollinger middle band which keeps the short term structure positive.
The key zone to watch is $0.0230-$0.0232. A clean breakout with strong volume could open the way toward $0.0238 and then the 24H high around $0.02416.
However the KDJ is already in the overbought zone so chasing the current price is risky. A pullback toward $0.0220-$0.0223 could offer a better long entry if support holds.
Support: $0.0220-$0.0223
Resistance: $0.0230-$0.0232
Next target: $0.0238-$0.02416
Bullish above support but watch for rejection near resistance. DYOR.
Price is currently around $0.02289 after a strong move higher. MACD is turning bullish and price is holding above the Bollinger middle band which keeps the short term structure positive.
The key zone to watch is $0.0230-$0.0232. A clean breakout with strong volume could open the way toward $0.0238 and then the 24H high around $0.02416.
However the KDJ is already in the overbought zone so chasing the current price is risky. A pullback toward $0.0220-$0.0223 could offer a better long entry if support holds.
Support: $0.0220-$0.0223
Resistance: $0.0230-$0.0232
Next target: $0.0238-$0.02416
Bullish above support but watch for rejection near resistance. DYOR.
75
Zcash has officially hit its highest price in 8 years.
$ZEC surged 47% to $865, a level it hasn't seen since January 2018, according to CoinDesk.
Back in June, the token crashed to $250 after an AI discovered a critical counterfeiting vulnerability that had been live for four years. Since that low, $ZEC has rallied 3.4x.
The rally picked up speed after Grayscale filed to convert its Zcash Trust into what would be the first U.S. spot ZEC ETF, according to The Block.
Even with this surge, $ZEC is still roughly 73% below its all-time high of $3,191.
Zcash has officially hit its highest price in 8 years.
$ZEC surged 47% to $865, a level it hasn't seen since January 2018, according to CoinDesk.
Back in June, the token crashed to $250 after an AI discovered a critical counterfeiting vulnerability that had been live for four years. Since that low, $ZEC has rallied 3.4x.
The rally picked up speed after Grayscale filed to convert its Zcash Trust into what would be the first U.S. spot ZEC ETF, according to The Block.
Even with this surge, $ZEC is still roughly 73% below its all-time high of $3,191.
$ZEC surged 47% to $865, a level it hasn't seen since January 2018, according to CoinDesk.
Back in June, the token crashed to $250 after an AI discovered a critical counterfeiting vulnerability that had been live for four years. Since that low, $ZEC has rallied 3.4x.
The rally picked up speed after Grayscale filed to convert its Zcash Trust into what would be the first U.S. spot ZEC ETF, according to The Block.
Even with this surge, $ZEC is still roughly 73% below its all-time high of $3,191.
54
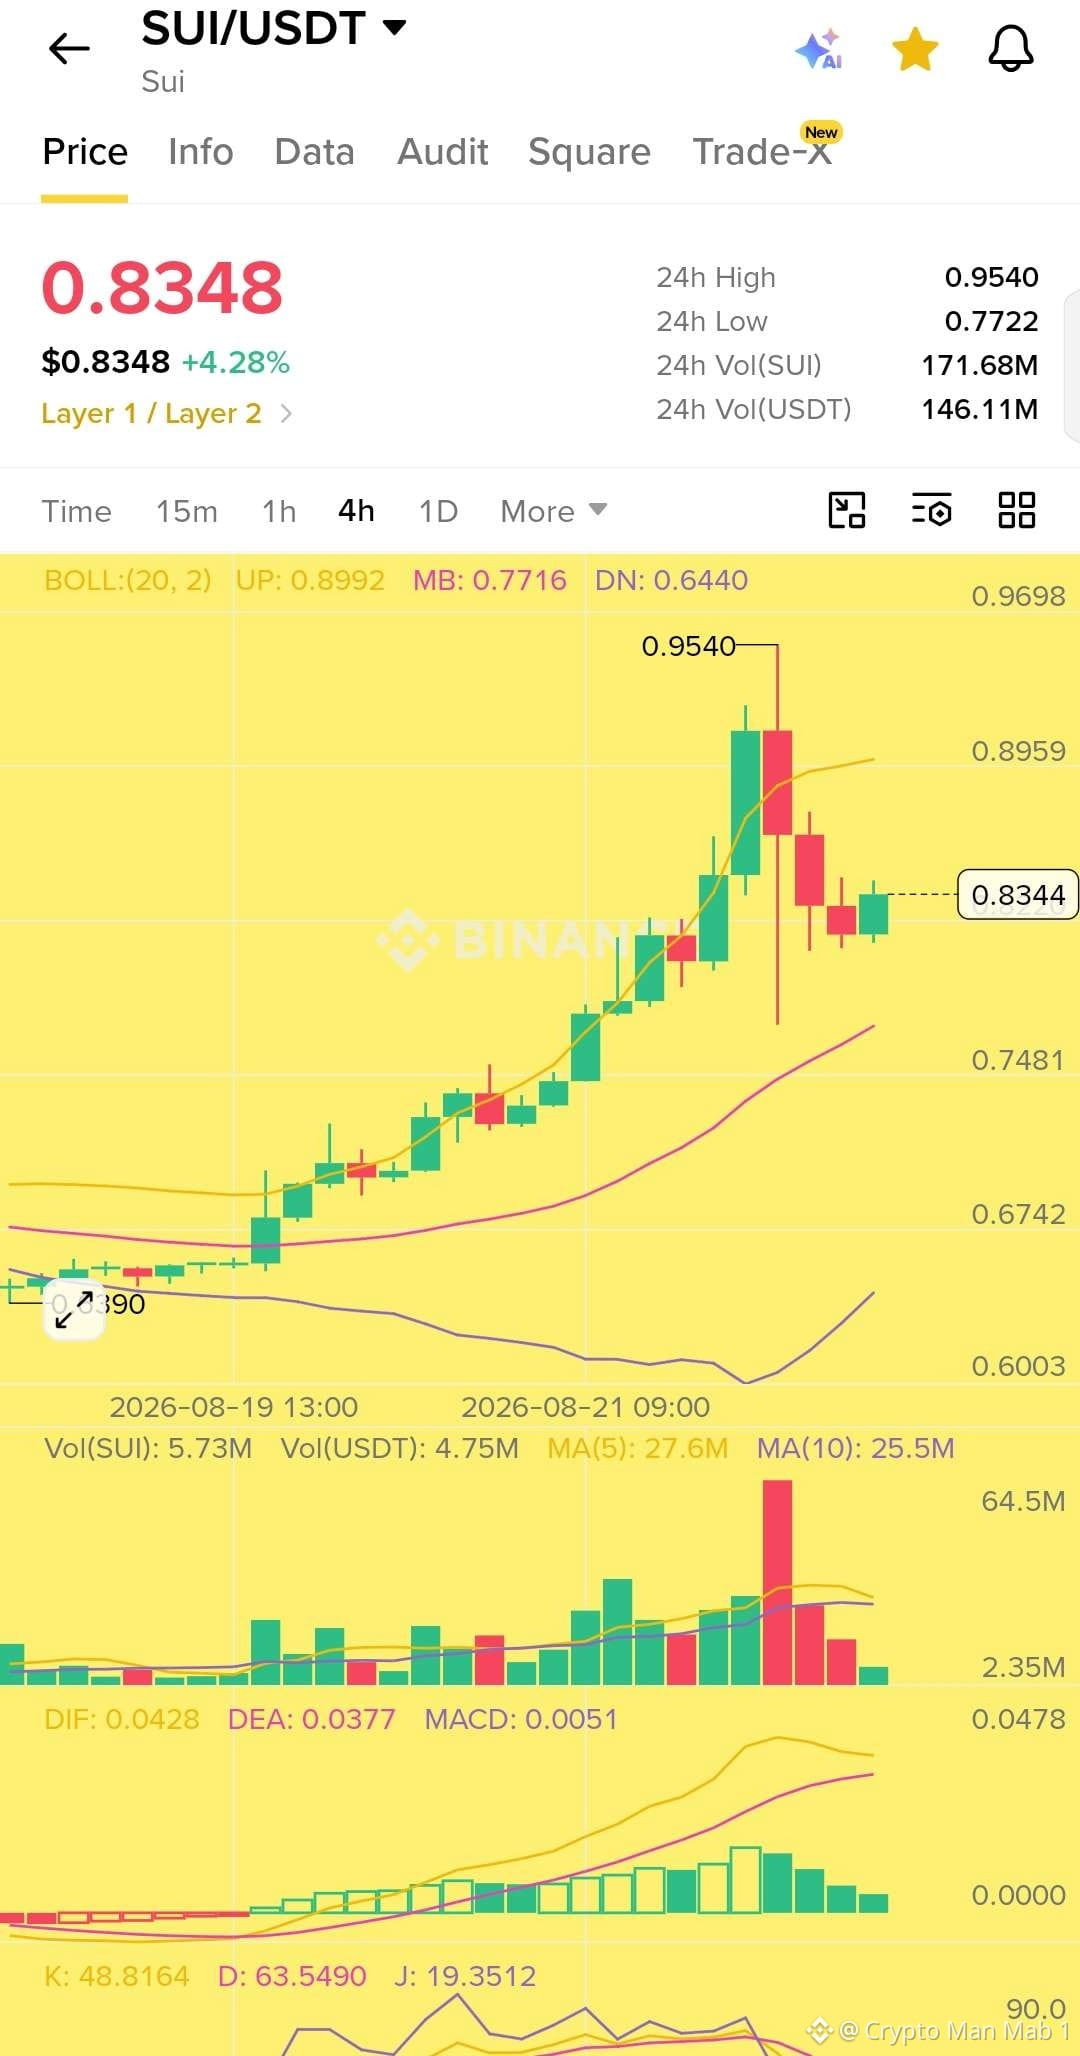
$SUI Sitting at $0.8348 right now, +4.28% on the day. Wild few days honestly, this thing ran from about $0.60 all the way up to $0.954 before cooling off.
That top candle came with a massive volume spike (biggest bar on the whole chart), which usually means people started taking profits hard. Since then it's been pulling back, now hovering around the $0.77 to $0.83 zone.
Still technically in an uptrend. MACD's holding positive, price is above the key moving averages, but short term momentum (KDJ) is starting to fade a bit. So this feels more like a breather than a full reversal, but worth watching if it can hold above $0.77 to $0.80 support.
Not financial advice, just tracking the chart. DYOR 🙏
$SUI Sitting at $0.8348 right now, +4.28% on the day. Wild few days honestly, this thing ran from about $0.60 all the way up to $0.954 before cooling off.
That top candle came with a massive volume spike (biggest bar on the whole chart), which usually means people started taking profits hard. Since then it's been pulling back, now hovering around the $0.77 to $0.83 zone.
Still technically in an uptrend. MACD's holding positive, price is above the key moving averages, but short term momentum (KDJ) is starting to fade a bit. So this feels more like a breather than a full reversal, but worth watching if it can hold above $0.77 to $0.80 support.
Not financial advice, just tracking the chart. DYOR 🙏
That top candle came with a massive volume spike (biggest bar on the whole chart), which usually means people started taking profits hard. Since then it's been pulling back, now hovering around the $0.77 to $0.83 zone.
Still technically in an uptrend. MACD's holding positive, price is above the key moving averages, but short term momentum (KDJ) is starting to fade a bit. So this feels more like a breather than a full reversal, but worth watching if it can hold above $0.77 to $0.80 support.
Not financial advice, just tracking the chart. DYOR 🙏
63
Log in to explore more content
Join global crypto users on Binance Square
⚡️ Get latest and useful information about crypto.
💬 Trusted by the world’s largest crypto exchange.
👍 Discover real insights from verified creators.
Email / Phone number
Trending Topics
BOJRaisesRatesTo31YearHigh
88,062 views
1,390 Discussing
#bojraisesratesto31yearhigh
🇯🇵 BOJ Raised Rates. So Why Did the Yen FALL?
Imagine borrowing a currency whose central bank just raised rates…
…and that currency still gets weaker. 😂
On Sept. 18, the BOJ raised rates 25bp to 1.25%, the highest level in 31 years.
The vote? 7–2.
But USD/JPY jumped as high as 158.05 as traders questioned how aggressive the next hikes will be.
BUT HERE’S WHAT MANY PEOPLE MISS 👀
The market wasn't simply trading the hike.
It was trading the guidance gap.
The 25bp move was widely expected. What mattered was whether BOJ Governor Ueda would signal a clear path for more tightening.
He didn't commit to a preset pace.
Meanwhile, the U.S.–Japan rate gap remains wide enough to keep the carry-trade story alive: cheap-yen funding can still compete with higher-yielding assets elsewhere.
And then came the crypto twist:
BTC rebounded ~5.9% toward $81K after the BOJ decision.
So:
BOJ tightening ≠ automatic crypto selloff.
But there is another risk.
If USD/JPY pushes higher, intervention concerns can intensify. If the yen suddenly strengthens, crowded carry positions could unwind quickly.
🧠 Square Insight:
Markets don't trade the rate hike. They trade the gap between what was expected and what was delivered.
Do you think the next BOJ move will finally break the carry trade?
Market commentary only. Not financial advice.
#BOJ #JapaneseYen #CarryTrade
$BTC
TuilaNamKy
·4 Likes
·5.4k views
BuffettStepsDownAsBerkshireChairman
39,737 views
642 Discussing
XRPExchangeReservesHitSevenYearLow
45,492 views
610 Discussing