
艾叔
6.2k Posts

艾叔
 Square Verified+
公众号:AiUnclebit /推特:@Qzzonebit /微博:艾叔bit
/币安合约锦标赛冠军/合约锦标赛个人赛第九名/机构订单原理/波浪/
🎈手续费8折:AISHUBIT 邀请码

Live Trader

Creator Awards 2024

原创之星
Open Trade
Frequent Trader
5.6 Years
84 Following
100.9K+ Followers
218.4K+ Liked
4 Badges
Posts
Portfolio
All
Quotes
Videos
Live
PINNED

PINNED


艾叔
·
--
##币安合约锦标赛
This tournament is coming to an end.
Four weeks of competition, each week ended with the first place far ahead.
Thank you for your support, friends.
After the end tomorrow, the public media in Lianlian Square will start to give out red envelopes for a week to give back to the brothers. By the way, there will also be a limited number of peripherals.
PS: Teachers who win every day, the event is over, you can come out to show your skills, no need to do tricks secretly, the opportunity to prove yourself will be announced in advance, it will be around November.
This tournament is coming to an end.
Four weeks of competition, each week ended with the first place far ahead.
Thank you for your support, friends.
After the end tomorrow, the public media in Lianlian Square will start to give out red envelopes for a week to give back to the brothers. By the way, there will also be a limited number of peripherals.
PS: Teachers who win every day, the event is over, you can come out to show your skills, no need to do tricks secretly, the opportunity to prove yourself will be announced in advance, it will be around November.
艾叔
·
--
$BTC
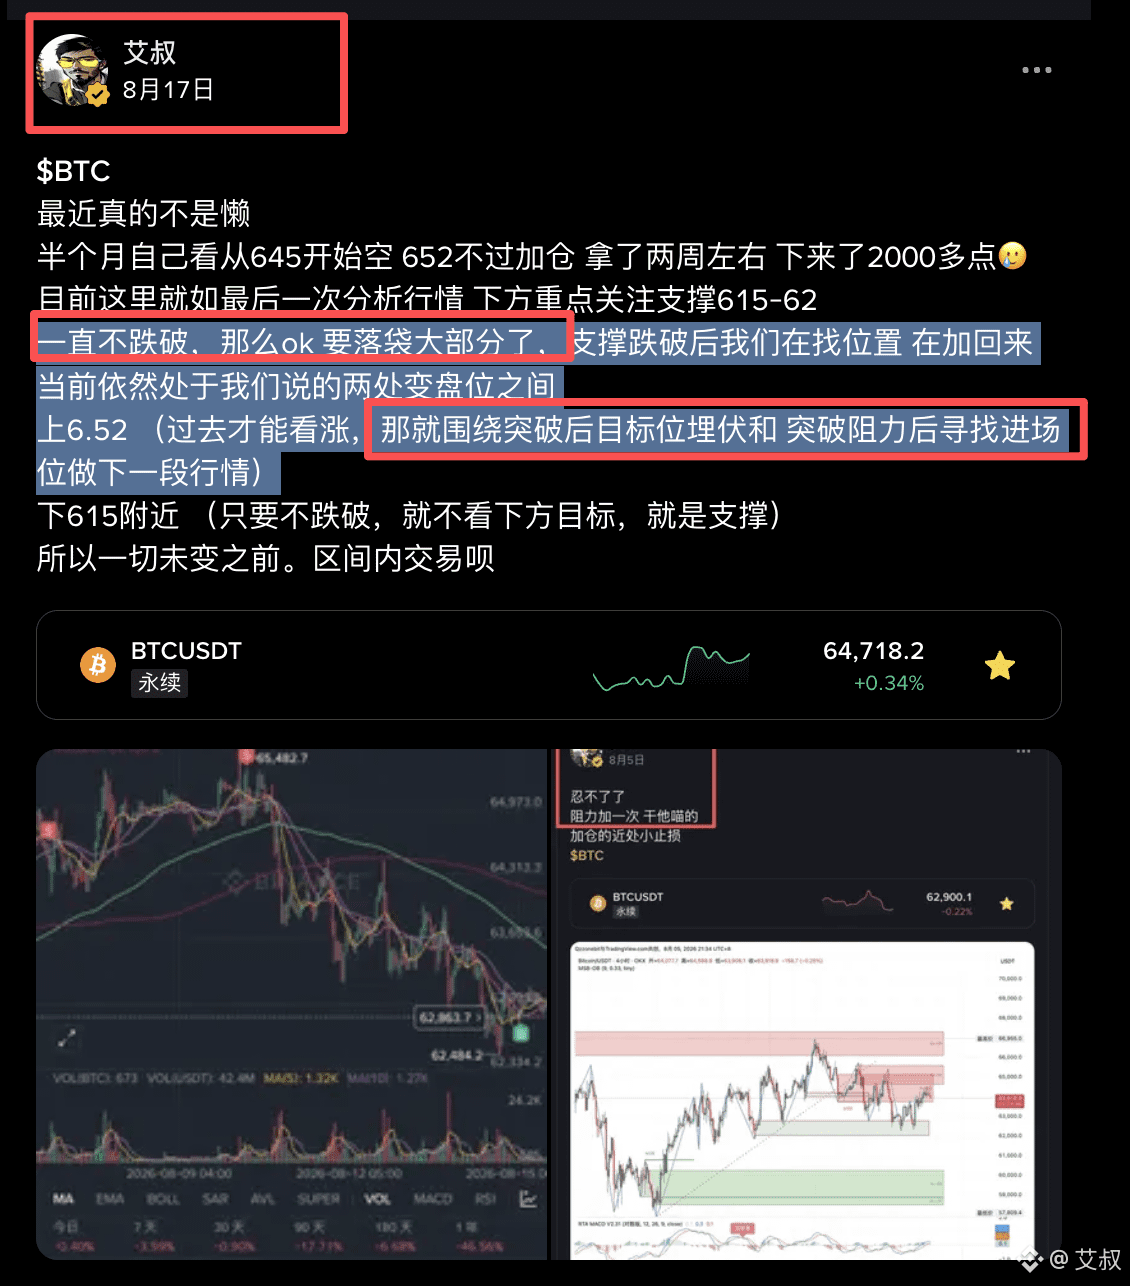
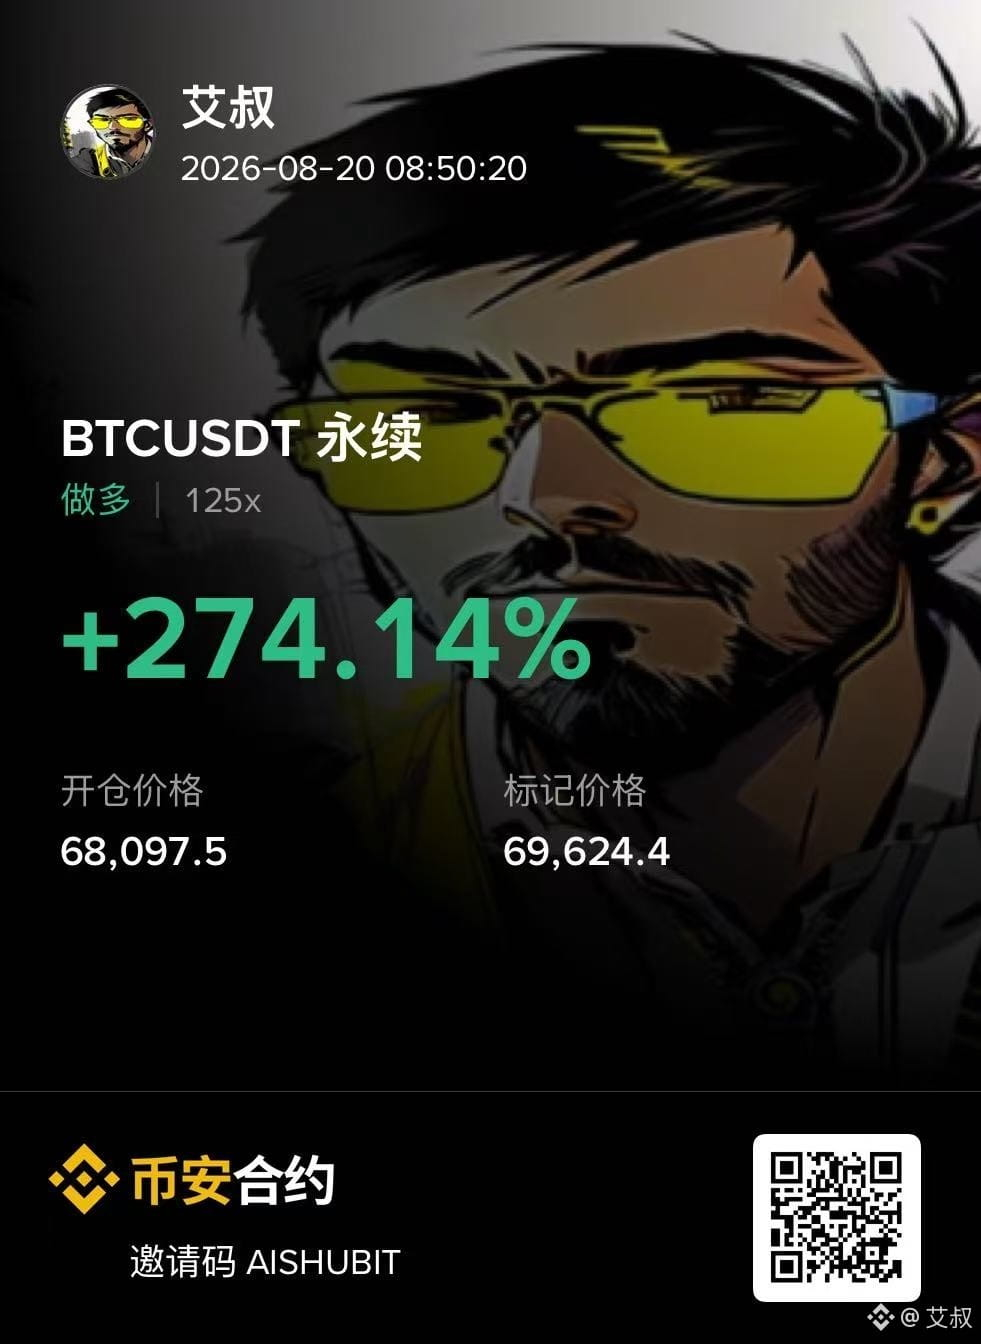
Recently I’m really not being lazy.
For half a month I’ve been watching—started from 645, it went to 652, but I added more. I held it for about two weeks and it dropped by a little over 2000🥲
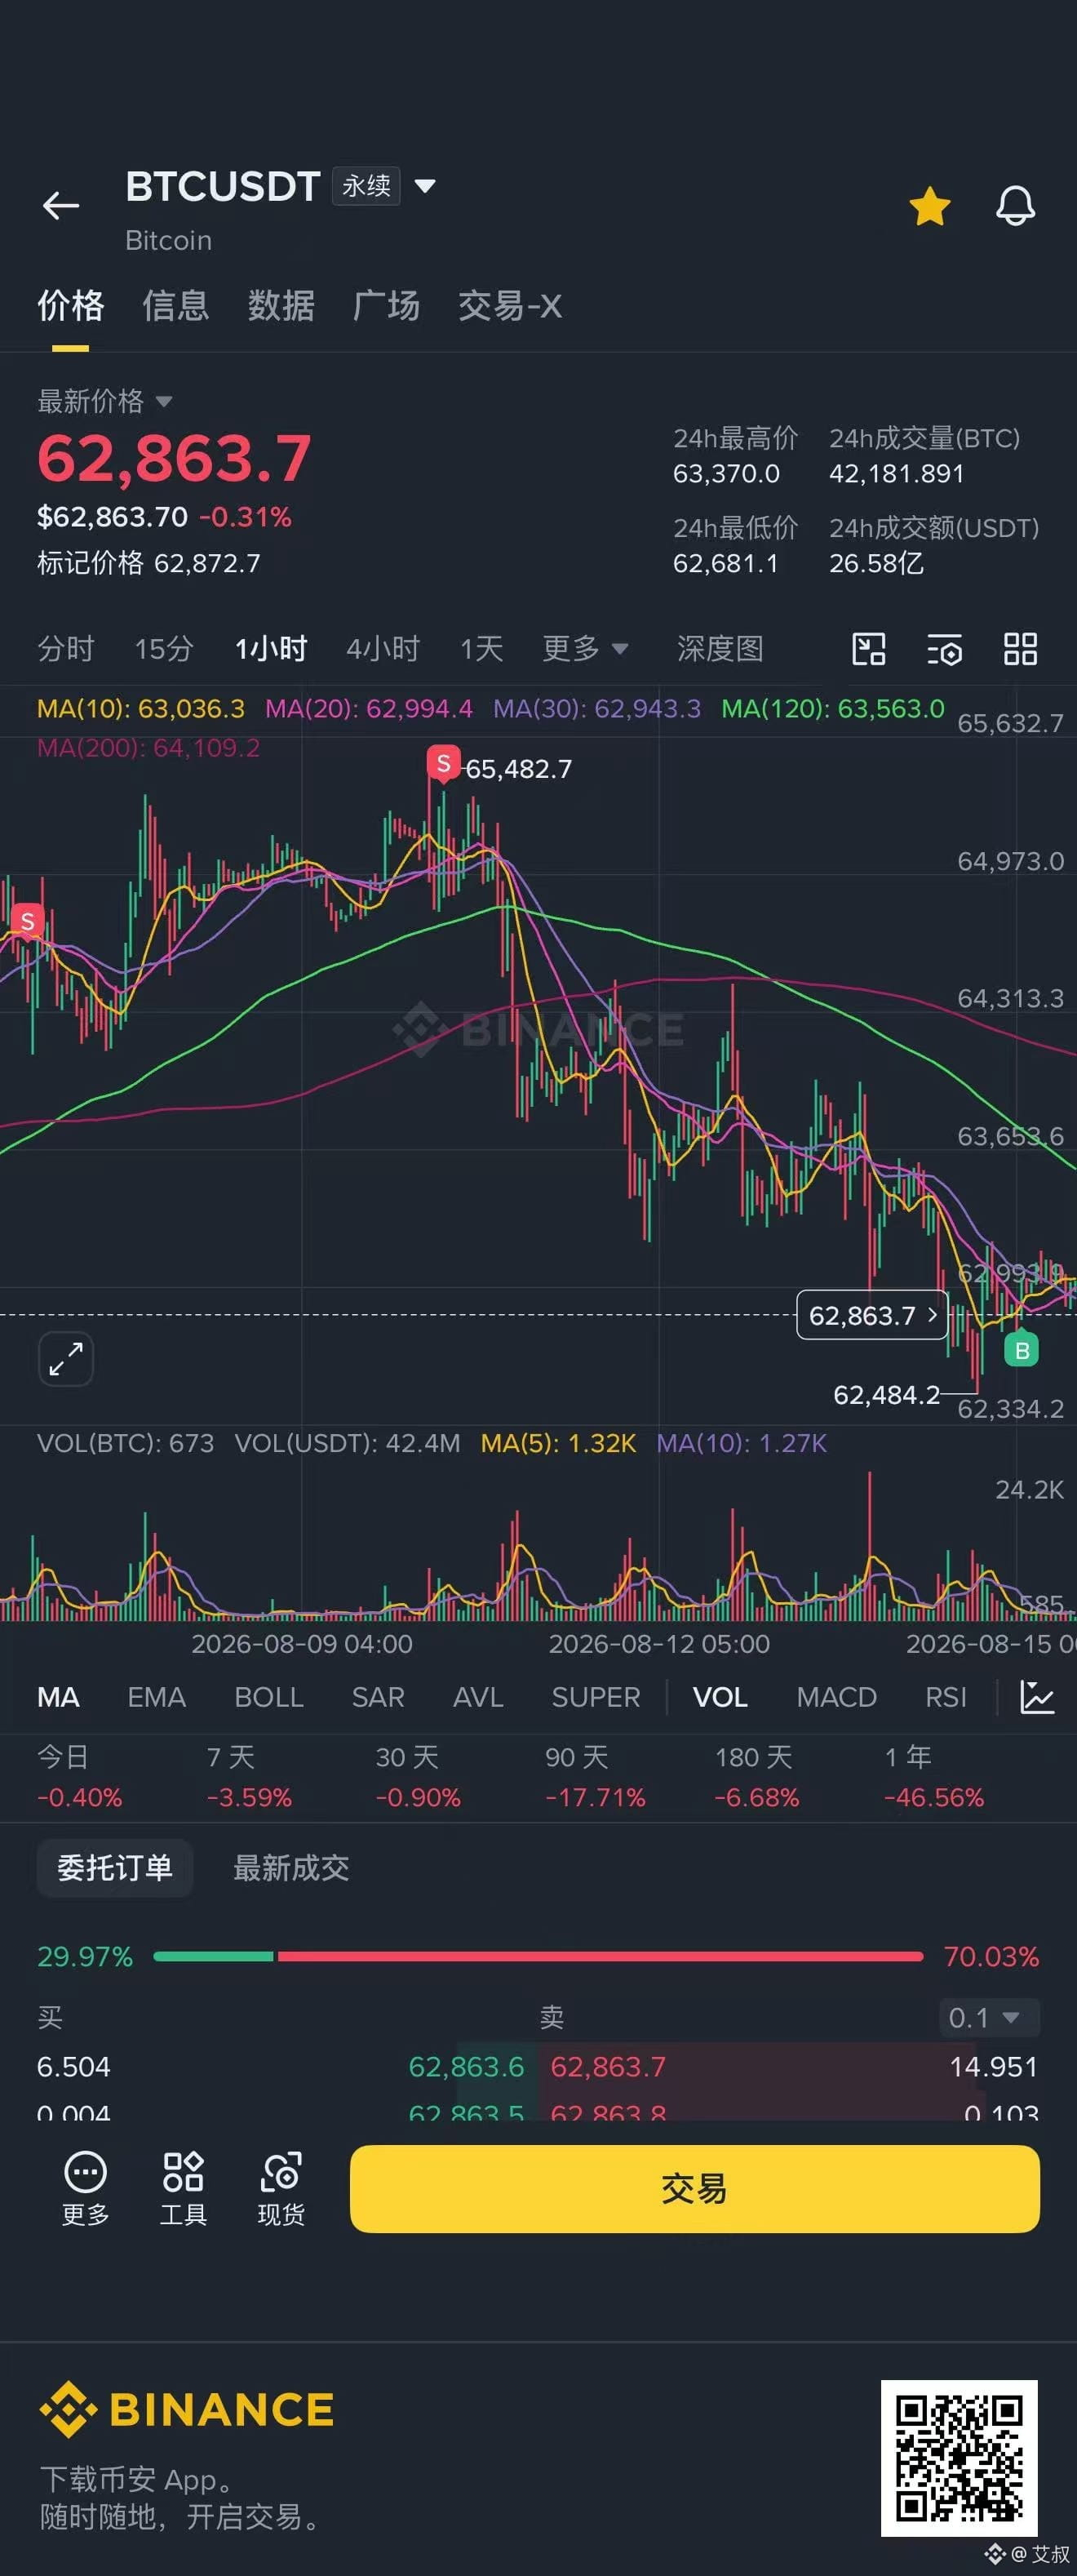
Right now, it’s exactly like in the last market analysis: below, the key support to watch is 615-62.
As long as it doesn’t break, then it’s basically fine—we’ll lock in most of the profits. After the support breaks, then we look for a position and add back.
Currently it’s still between the two turning points we mentioned.
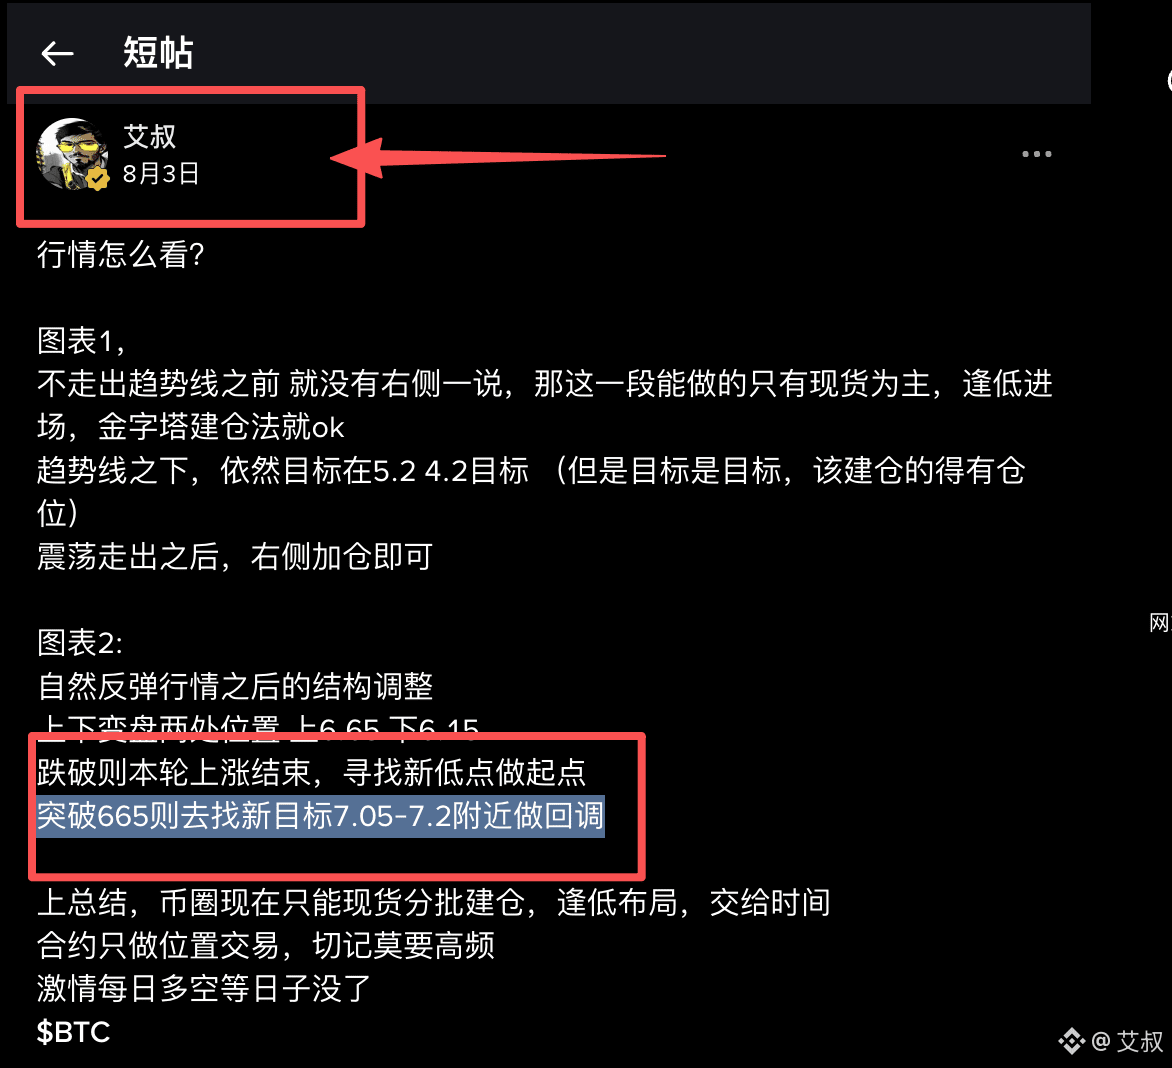
Up at 6.52 (in the past, only then we could look bullish—so we’ll wait around the post-breakout target area, and after the breakout resistance, look for an entry point to take the next leg of the move)
Down around 615 (as long as it doesn’t break, we won’t look to the downside targets—this is support).
So everything remains unchanged. Trade within the range.
Recently I’m really not being lazy.
For half a month I’ve been watching—started from 645, it went to 652, but I added more. I held it for about two weeks and it dropped by a little over 2000🥲
Right now, it’s exactly like in the last market analysis: below, the key support to watch is 615-62.
As long as it doesn’t break, then it’s basically fine—we’ll lock in most of the profits. After the support breaks, then we look for a position and add back.
Currently it’s still between the two turning points we mentioned.
Up at 6.52 (in the past, only then we could look bullish—so we’ll wait around the post-breakout target area, and after the breakout resistance, look for an entry point to take the next leg of the move)
Down around 615 (as long as it doesn’t break, we won’t look to the downside targets—this is support).
So everything remains unchanged. Trade within the range.
艾叔
·
--
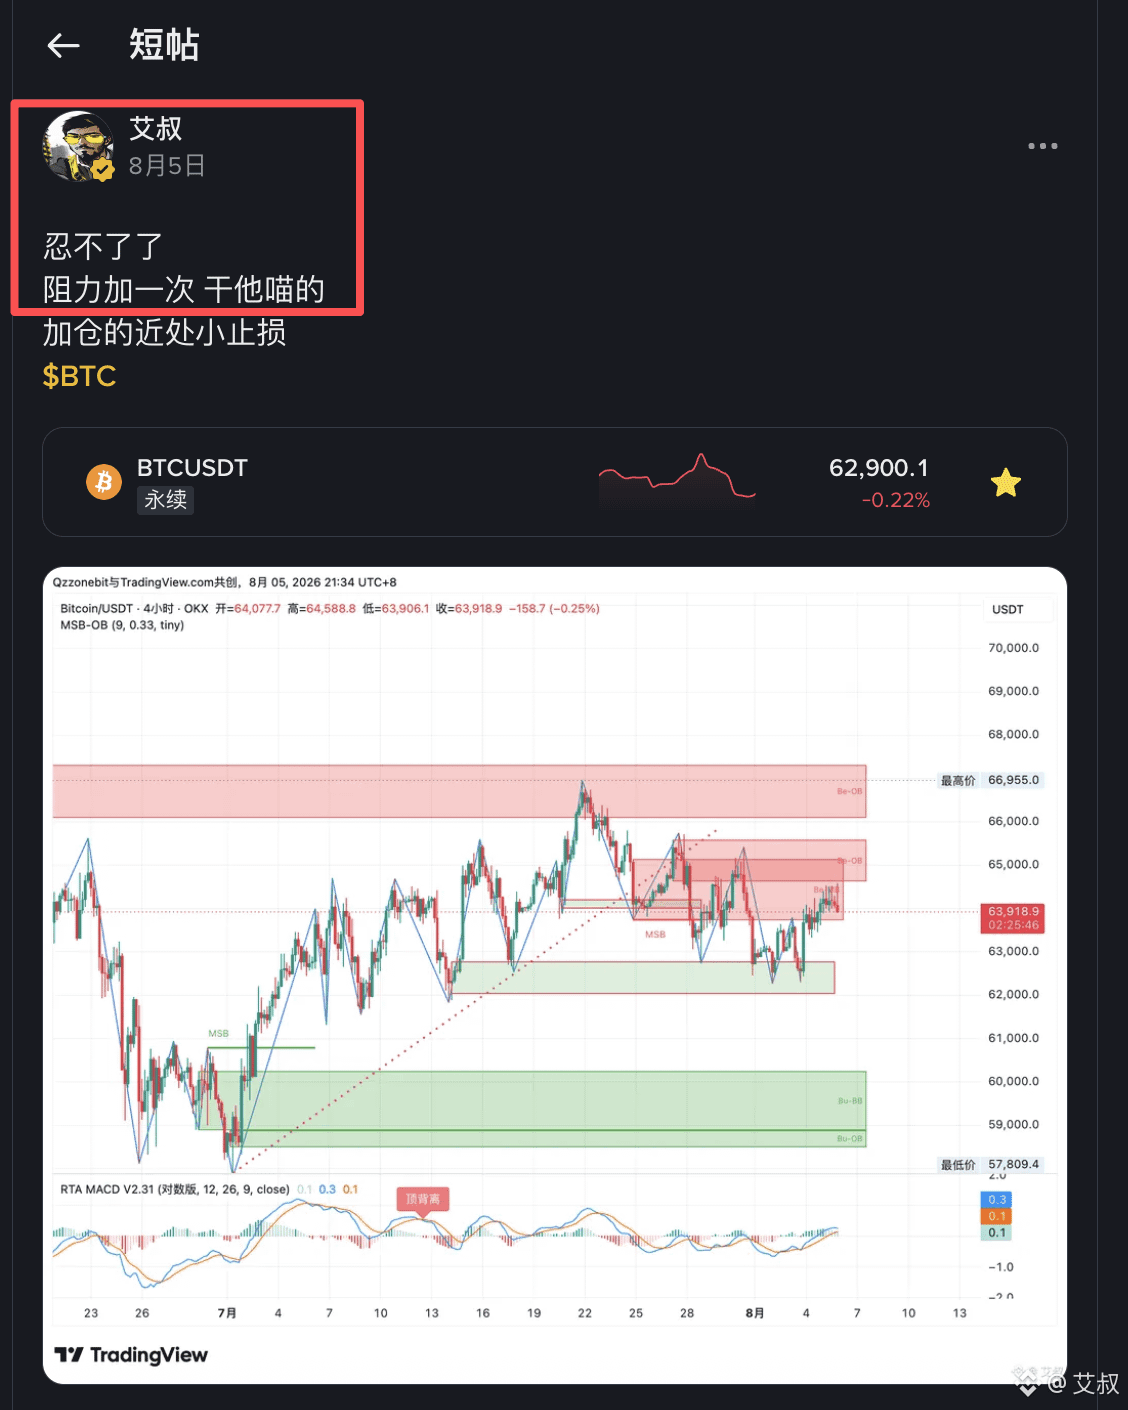
I can’t take it anymore
Add resistance once. Go ahead and hit it, damn it.
Add to the position near this and set a small stop-loss
$BTC
Add resistance once. Go ahead and hit it, damn it.
Add to the position near this and set a small stop-loss
$BTC
艾叔
·
--
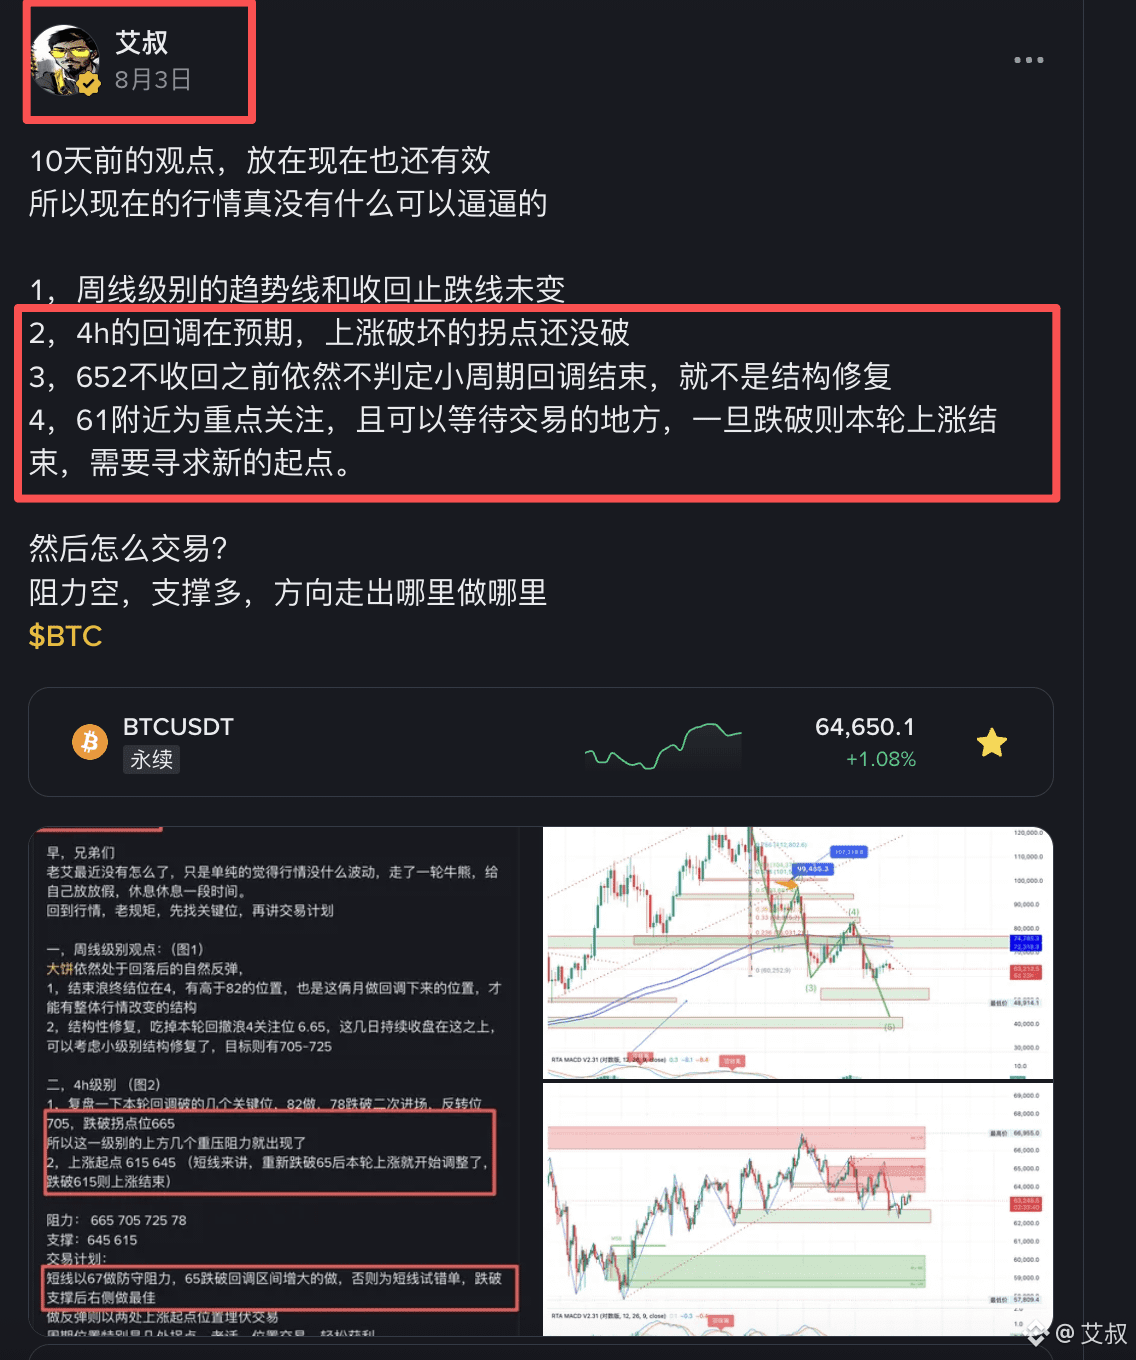
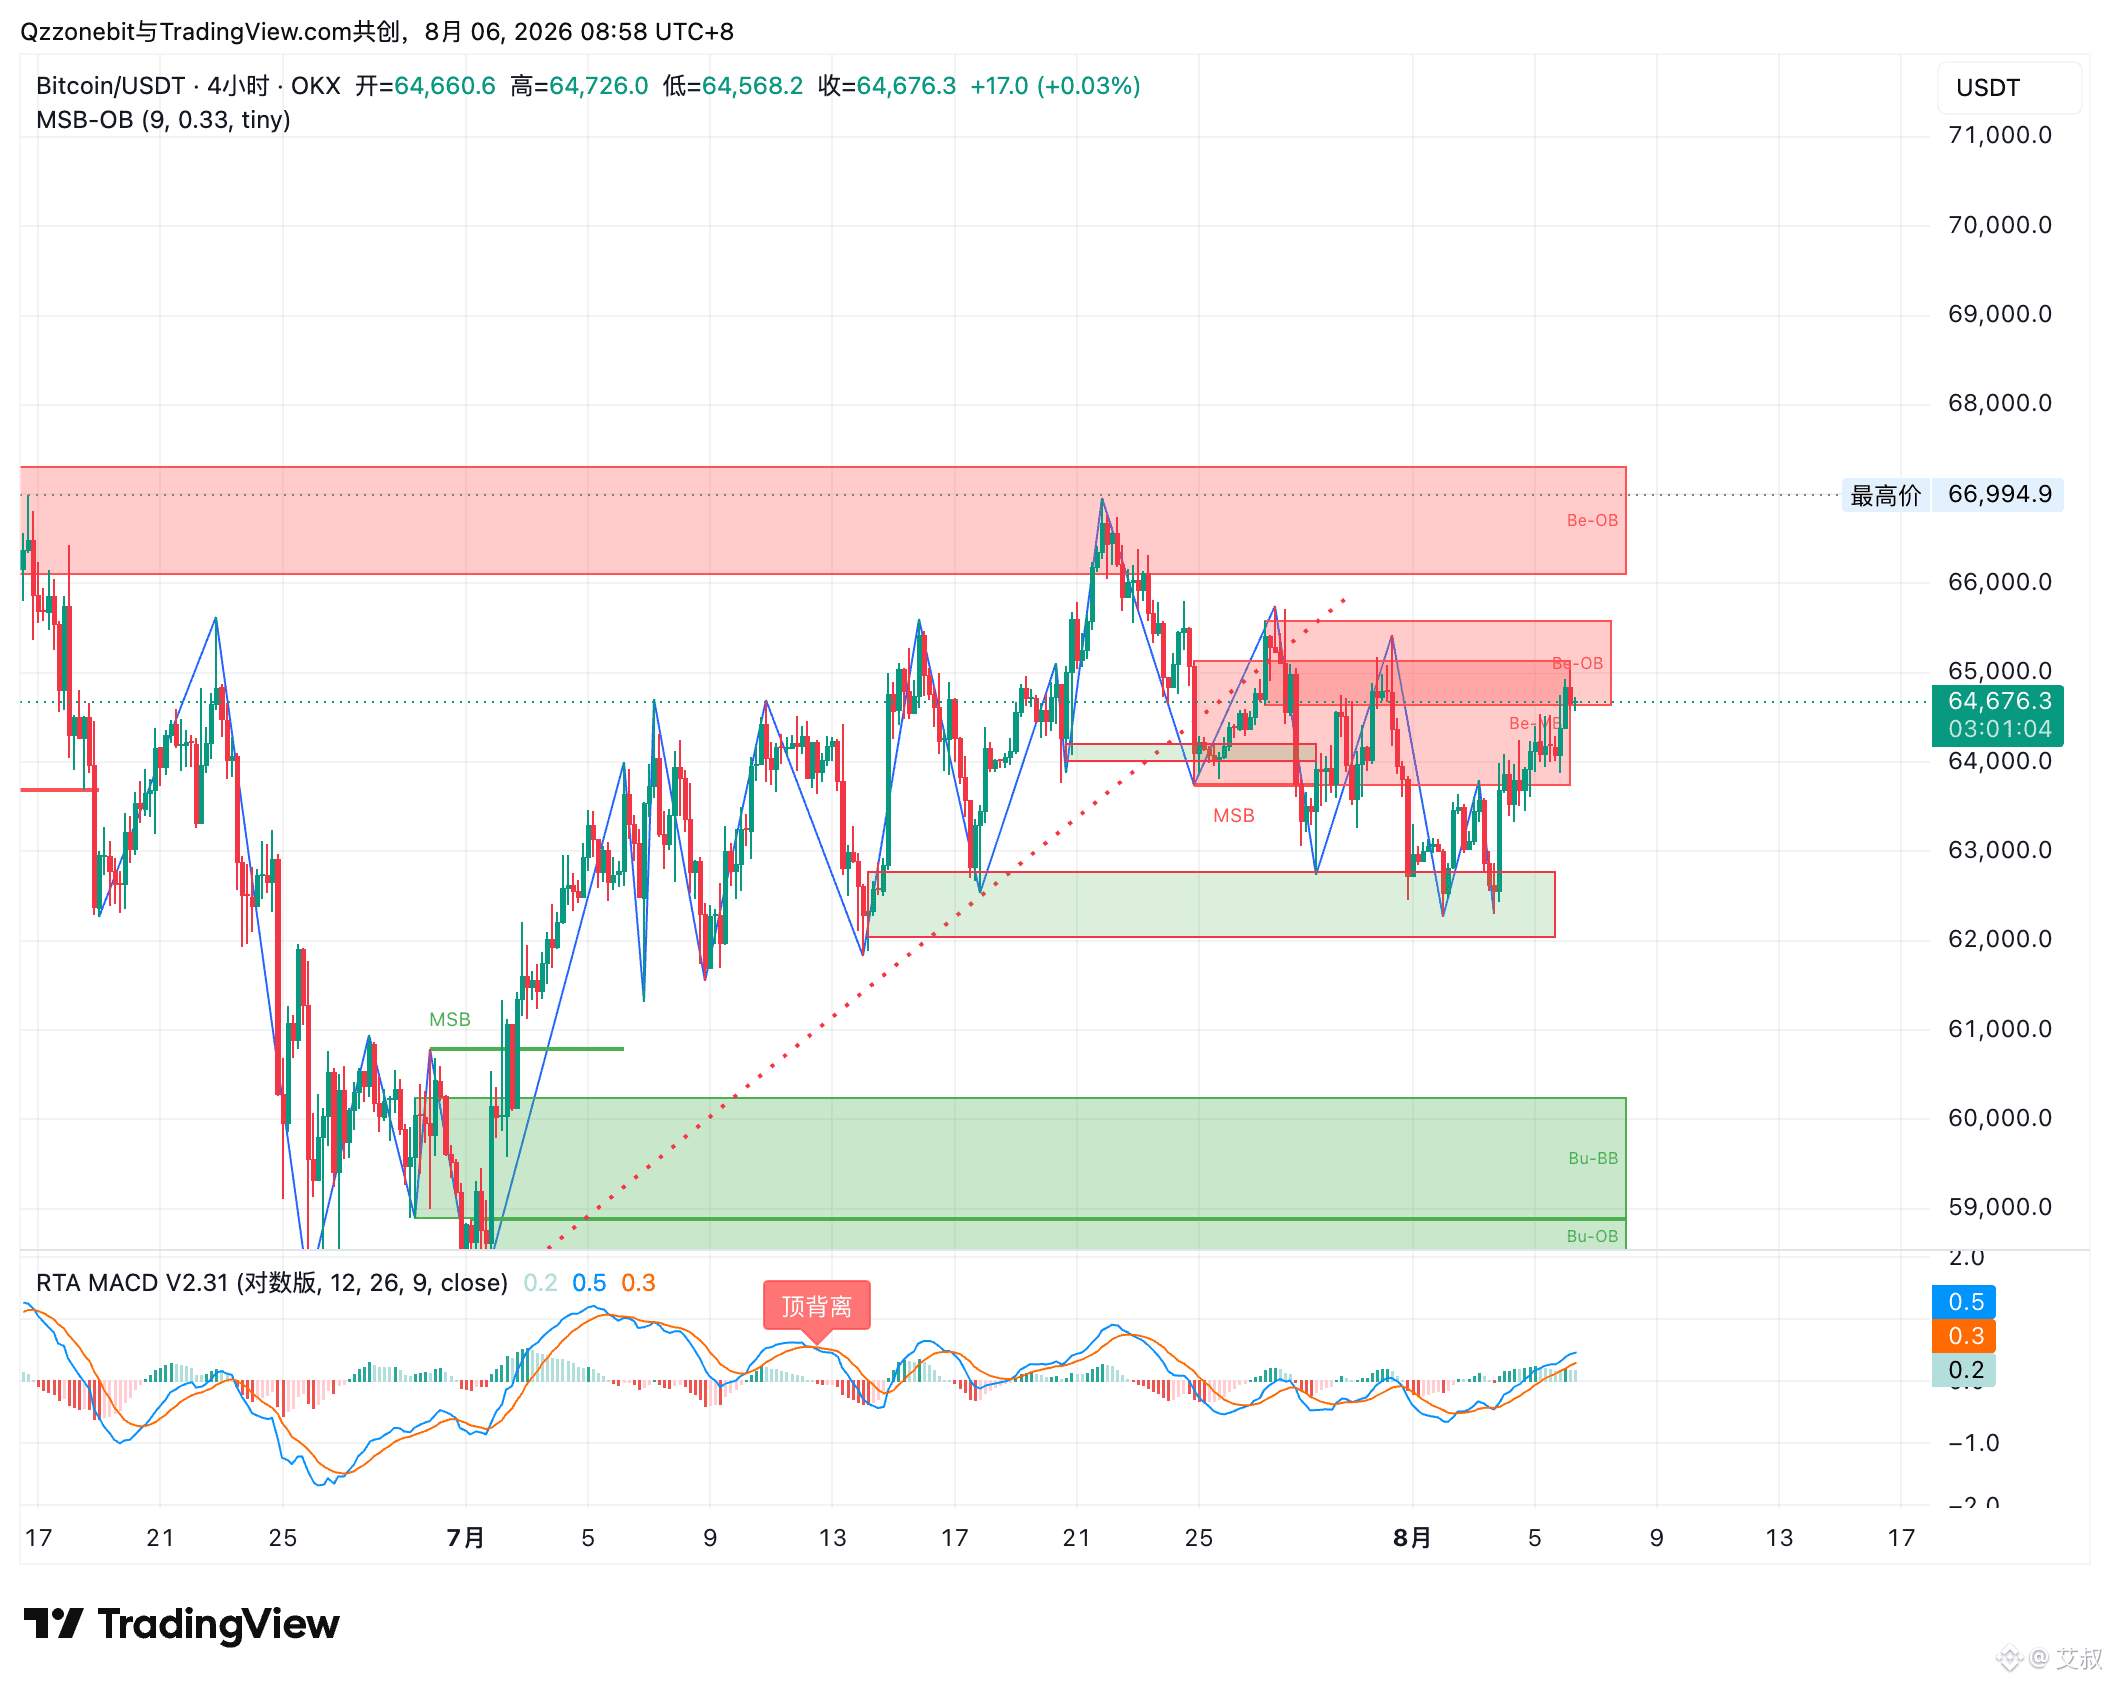
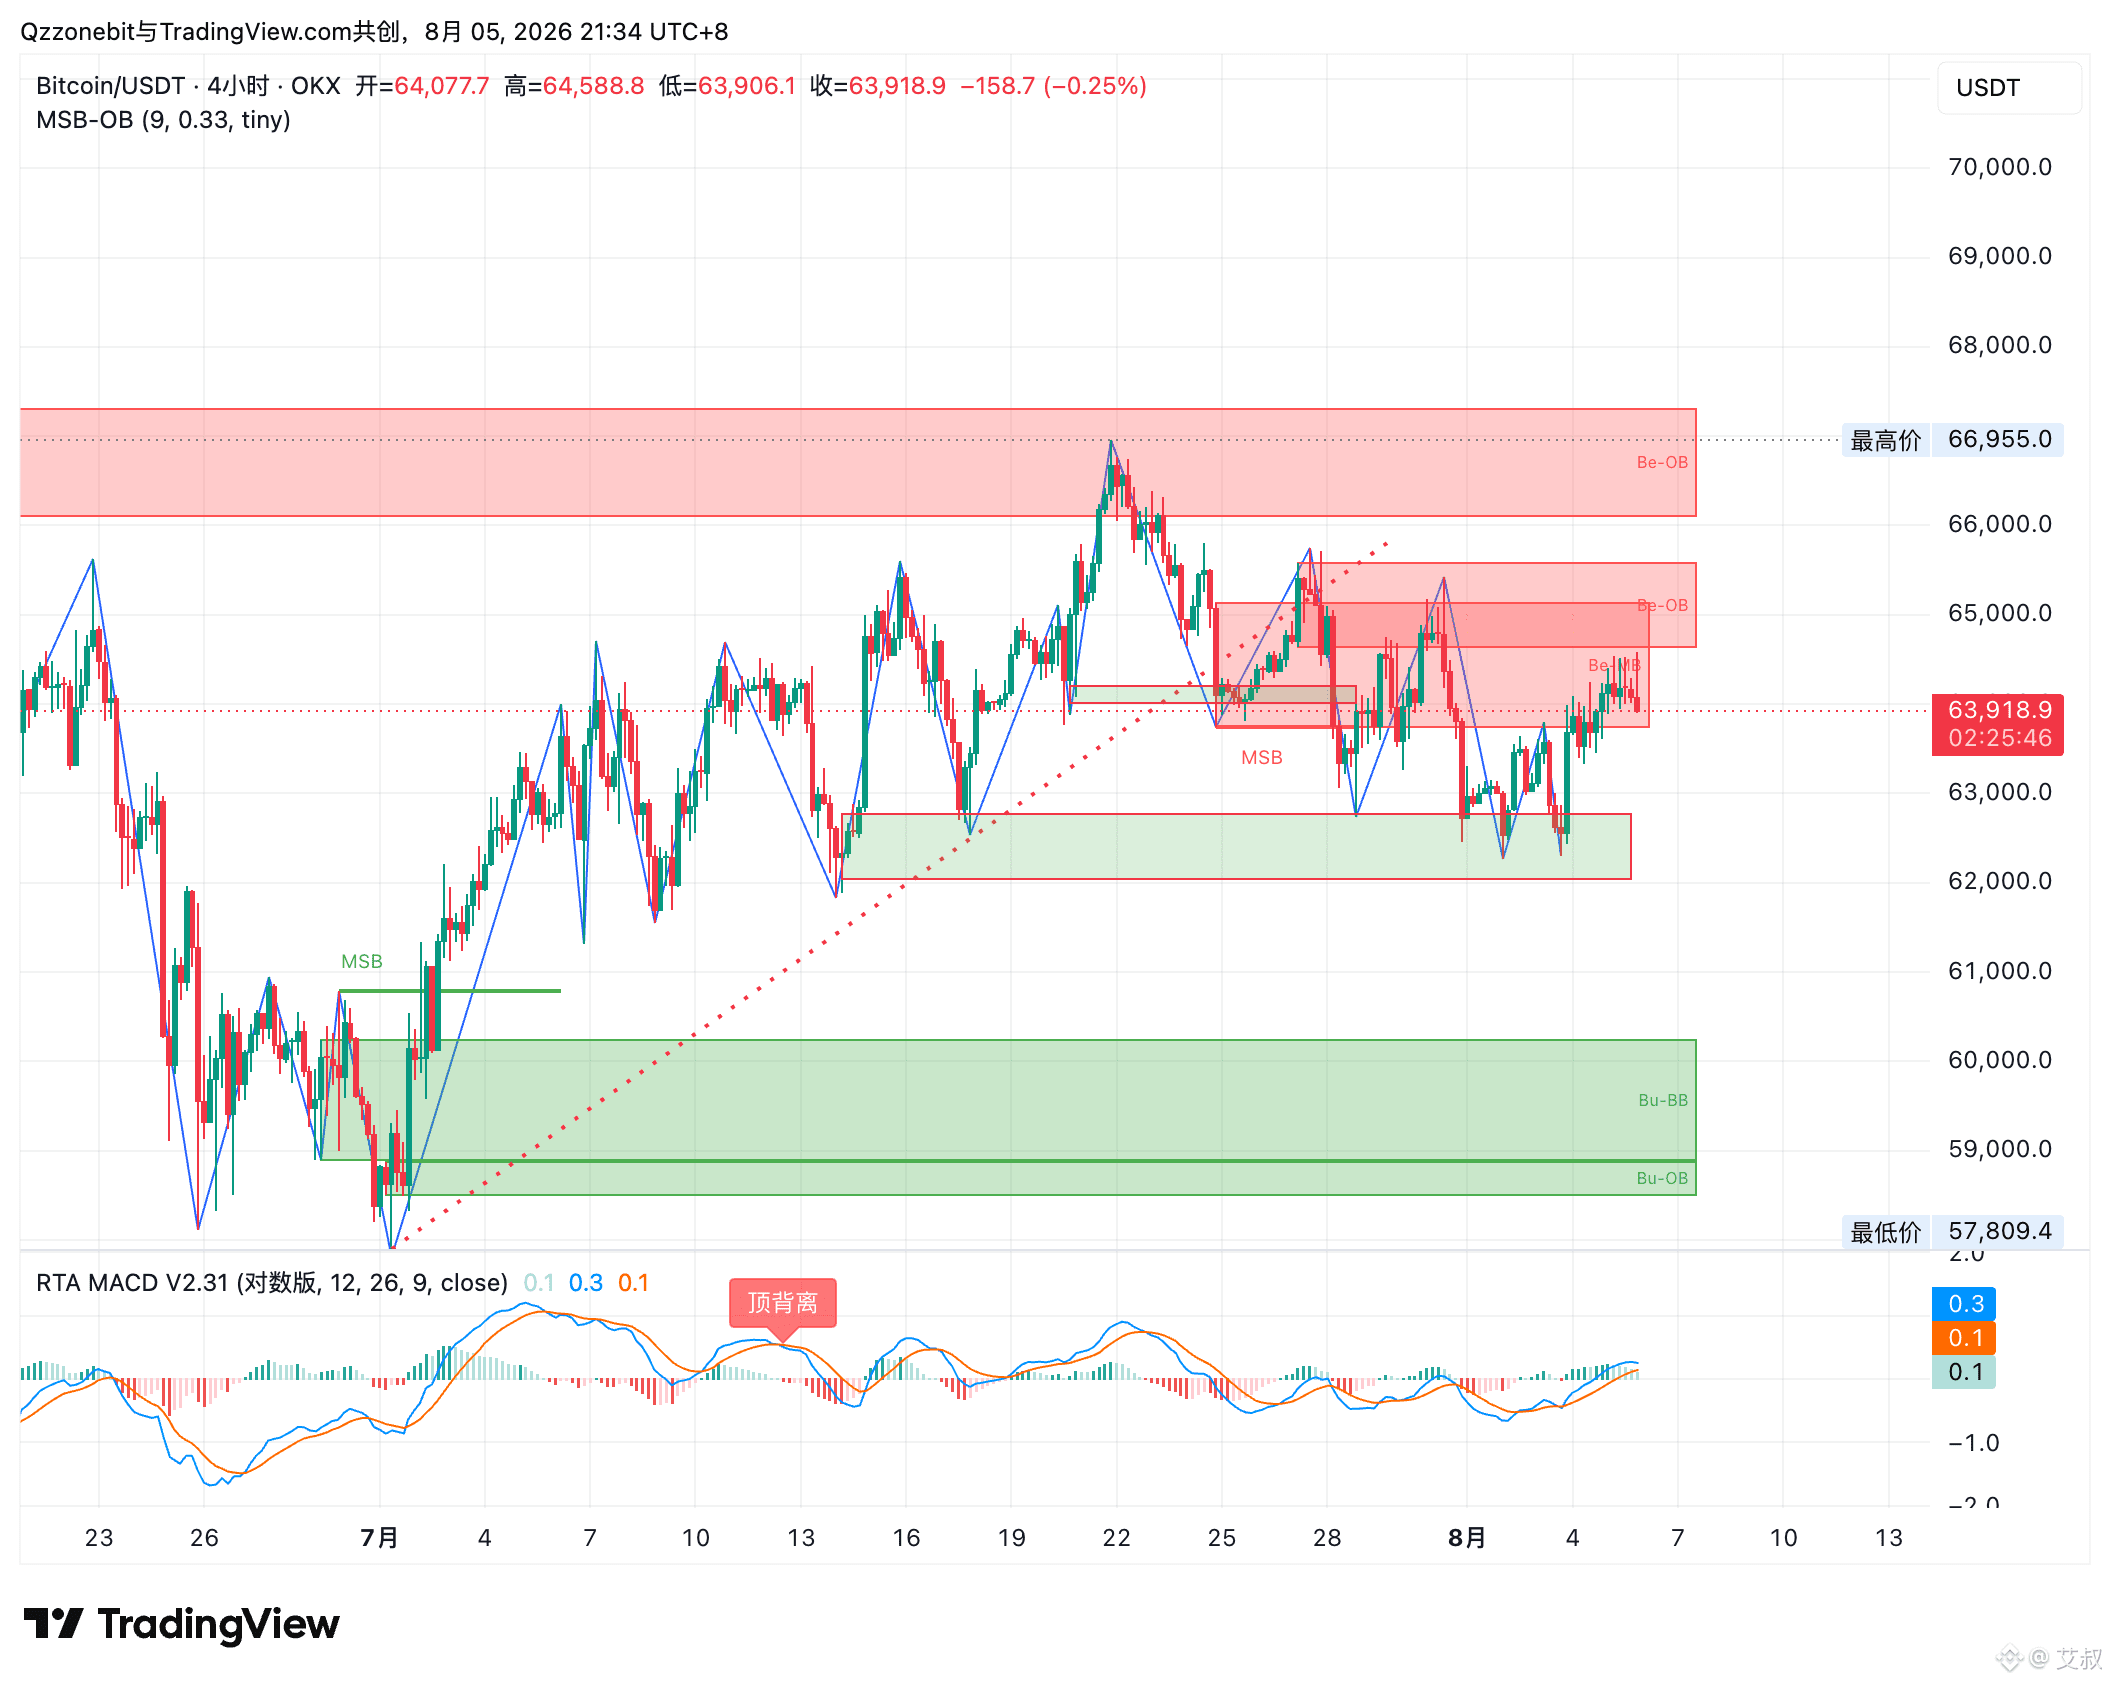
Opinions from 10 days ago are still valid today.
So there really isn’t anything to talk about or hype up in the current market.
1. The weekly-level trend line and the stop-decline line haven’t changed.
2. The 4H pullback is within expectations; the turning point that would invalidate the prior rise hasn’t been broken yet.
3. Until 652 is reclaimed, we will not declare the end of a lower-timeframe pullback; it’s not considered structural repair.
4. Around 61 is the key area to watch, and also a place to wait for a trade. If it breaks down, this round of the rally is over, and we need to find a new starting point.
So how do you trade?
Sell at resistance, buy at support—trade where the direction shows up.
$BTC
So there really isn’t anything to talk about or hype up in the current market.
1. The weekly-level trend line and the stop-decline line haven’t changed.
2. The 4H pullback is within expectations; the turning point that would invalidate the prior rise hasn’t been broken yet.
3. Until 652 is reclaimed, we will not declare the end of a lower-timeframe pullback; it’s not considered structural repair.
4. Around 61 is the key area to watch, and also a place to wait for a trade. If it breaks down, this round of the rally is over, and we need to find a new starting point.
So how do you trade?
Sell at resistance, buy at support—trade where the direction shows up.
$BTC
艾叔
·
--
Come on, brothers.
Lao Ai hasn’t really been doing much lately. He just feels the market isn’t moving much. He went through a cycle of bull and bear and gave himself some time off—taking a break for a while.
Back to the market: same old routine—first find the key levels, then talk about the trading plan.
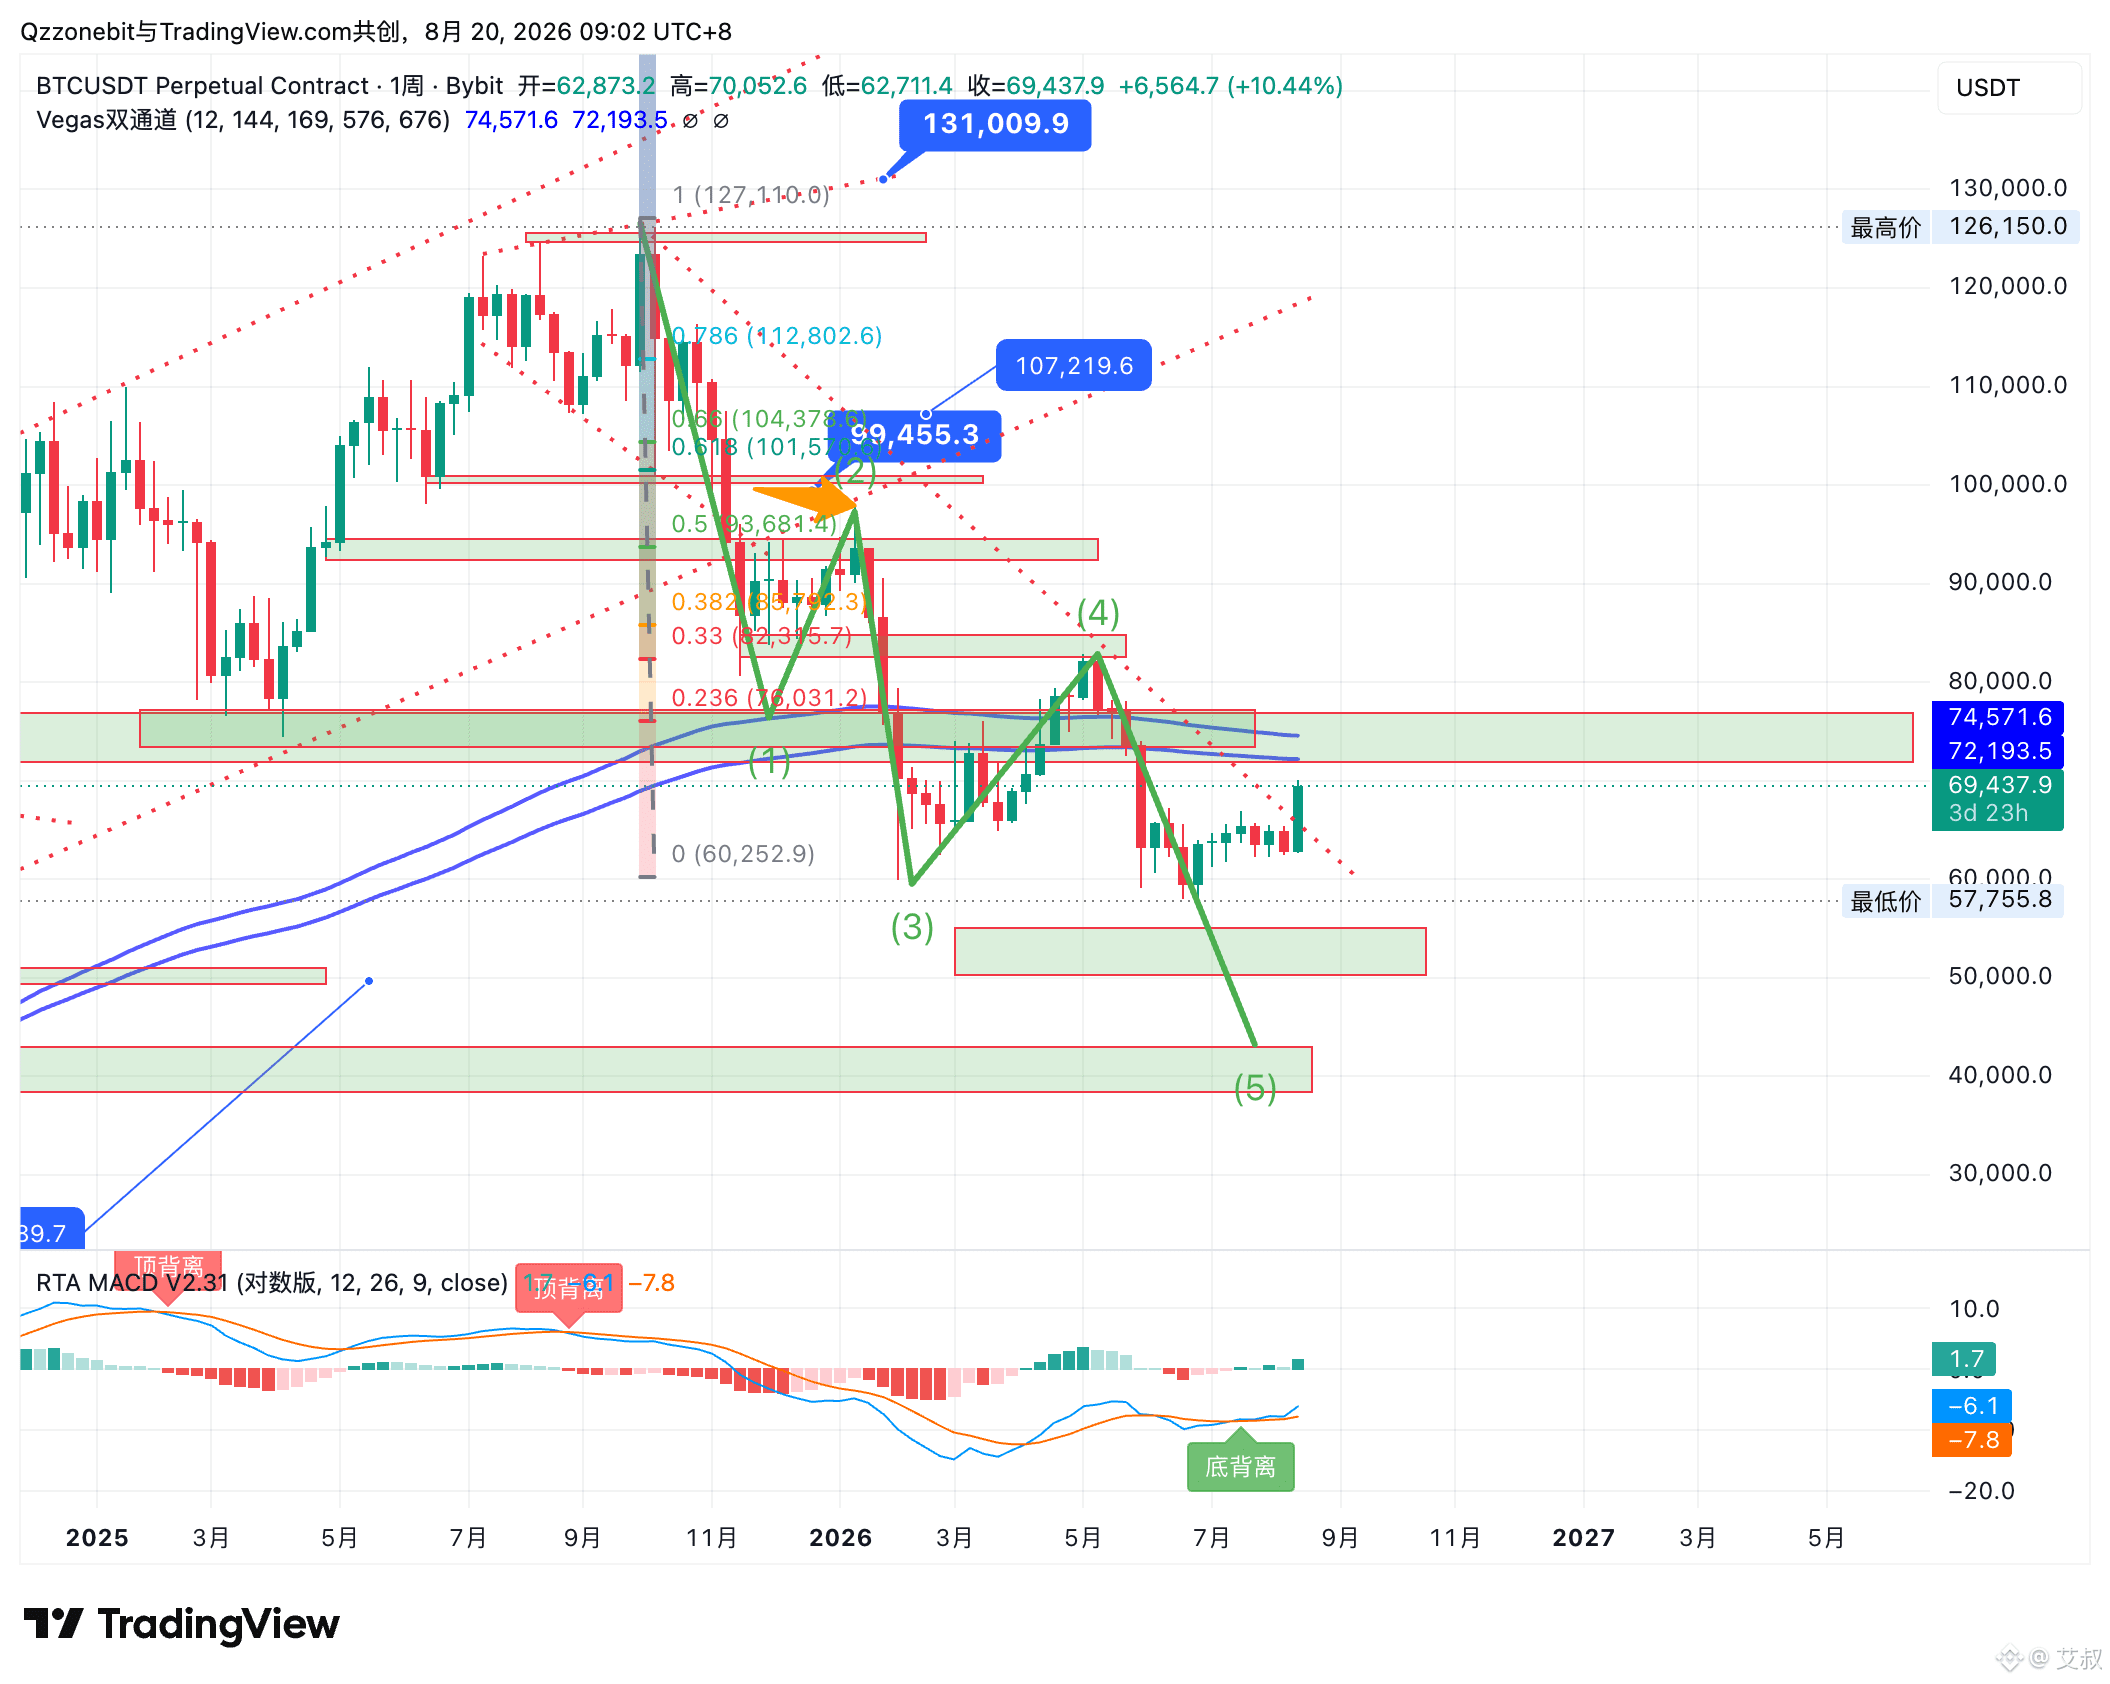
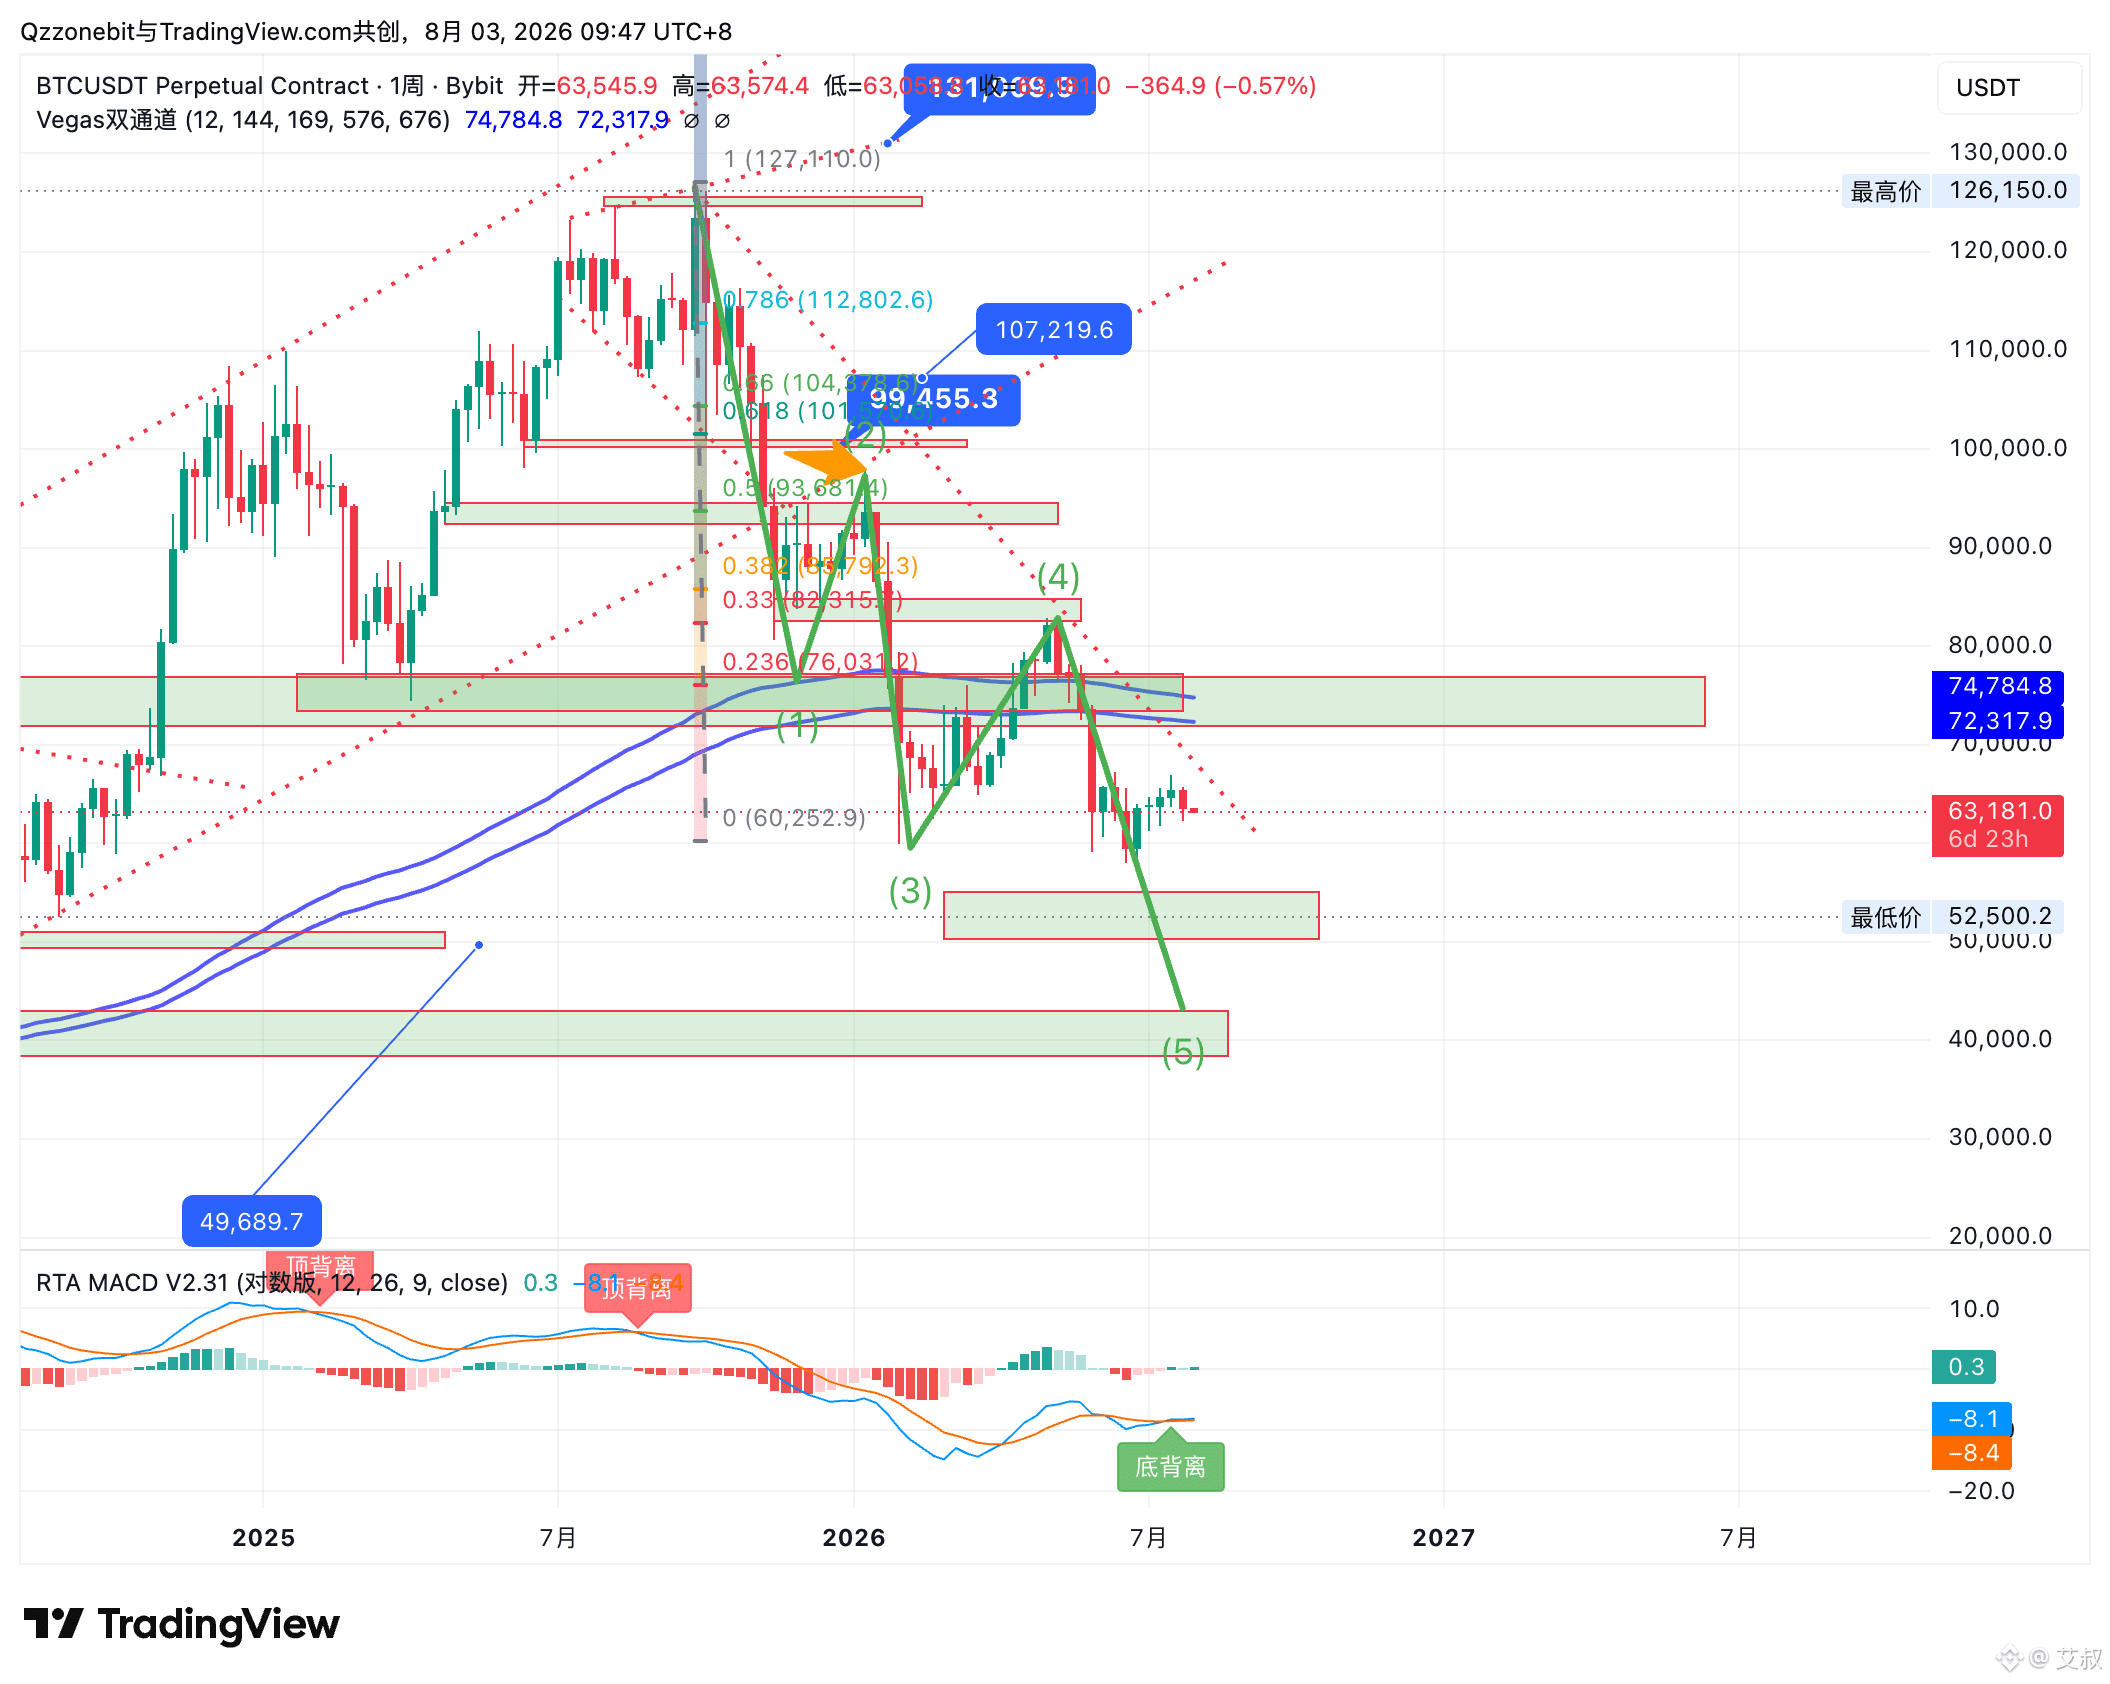
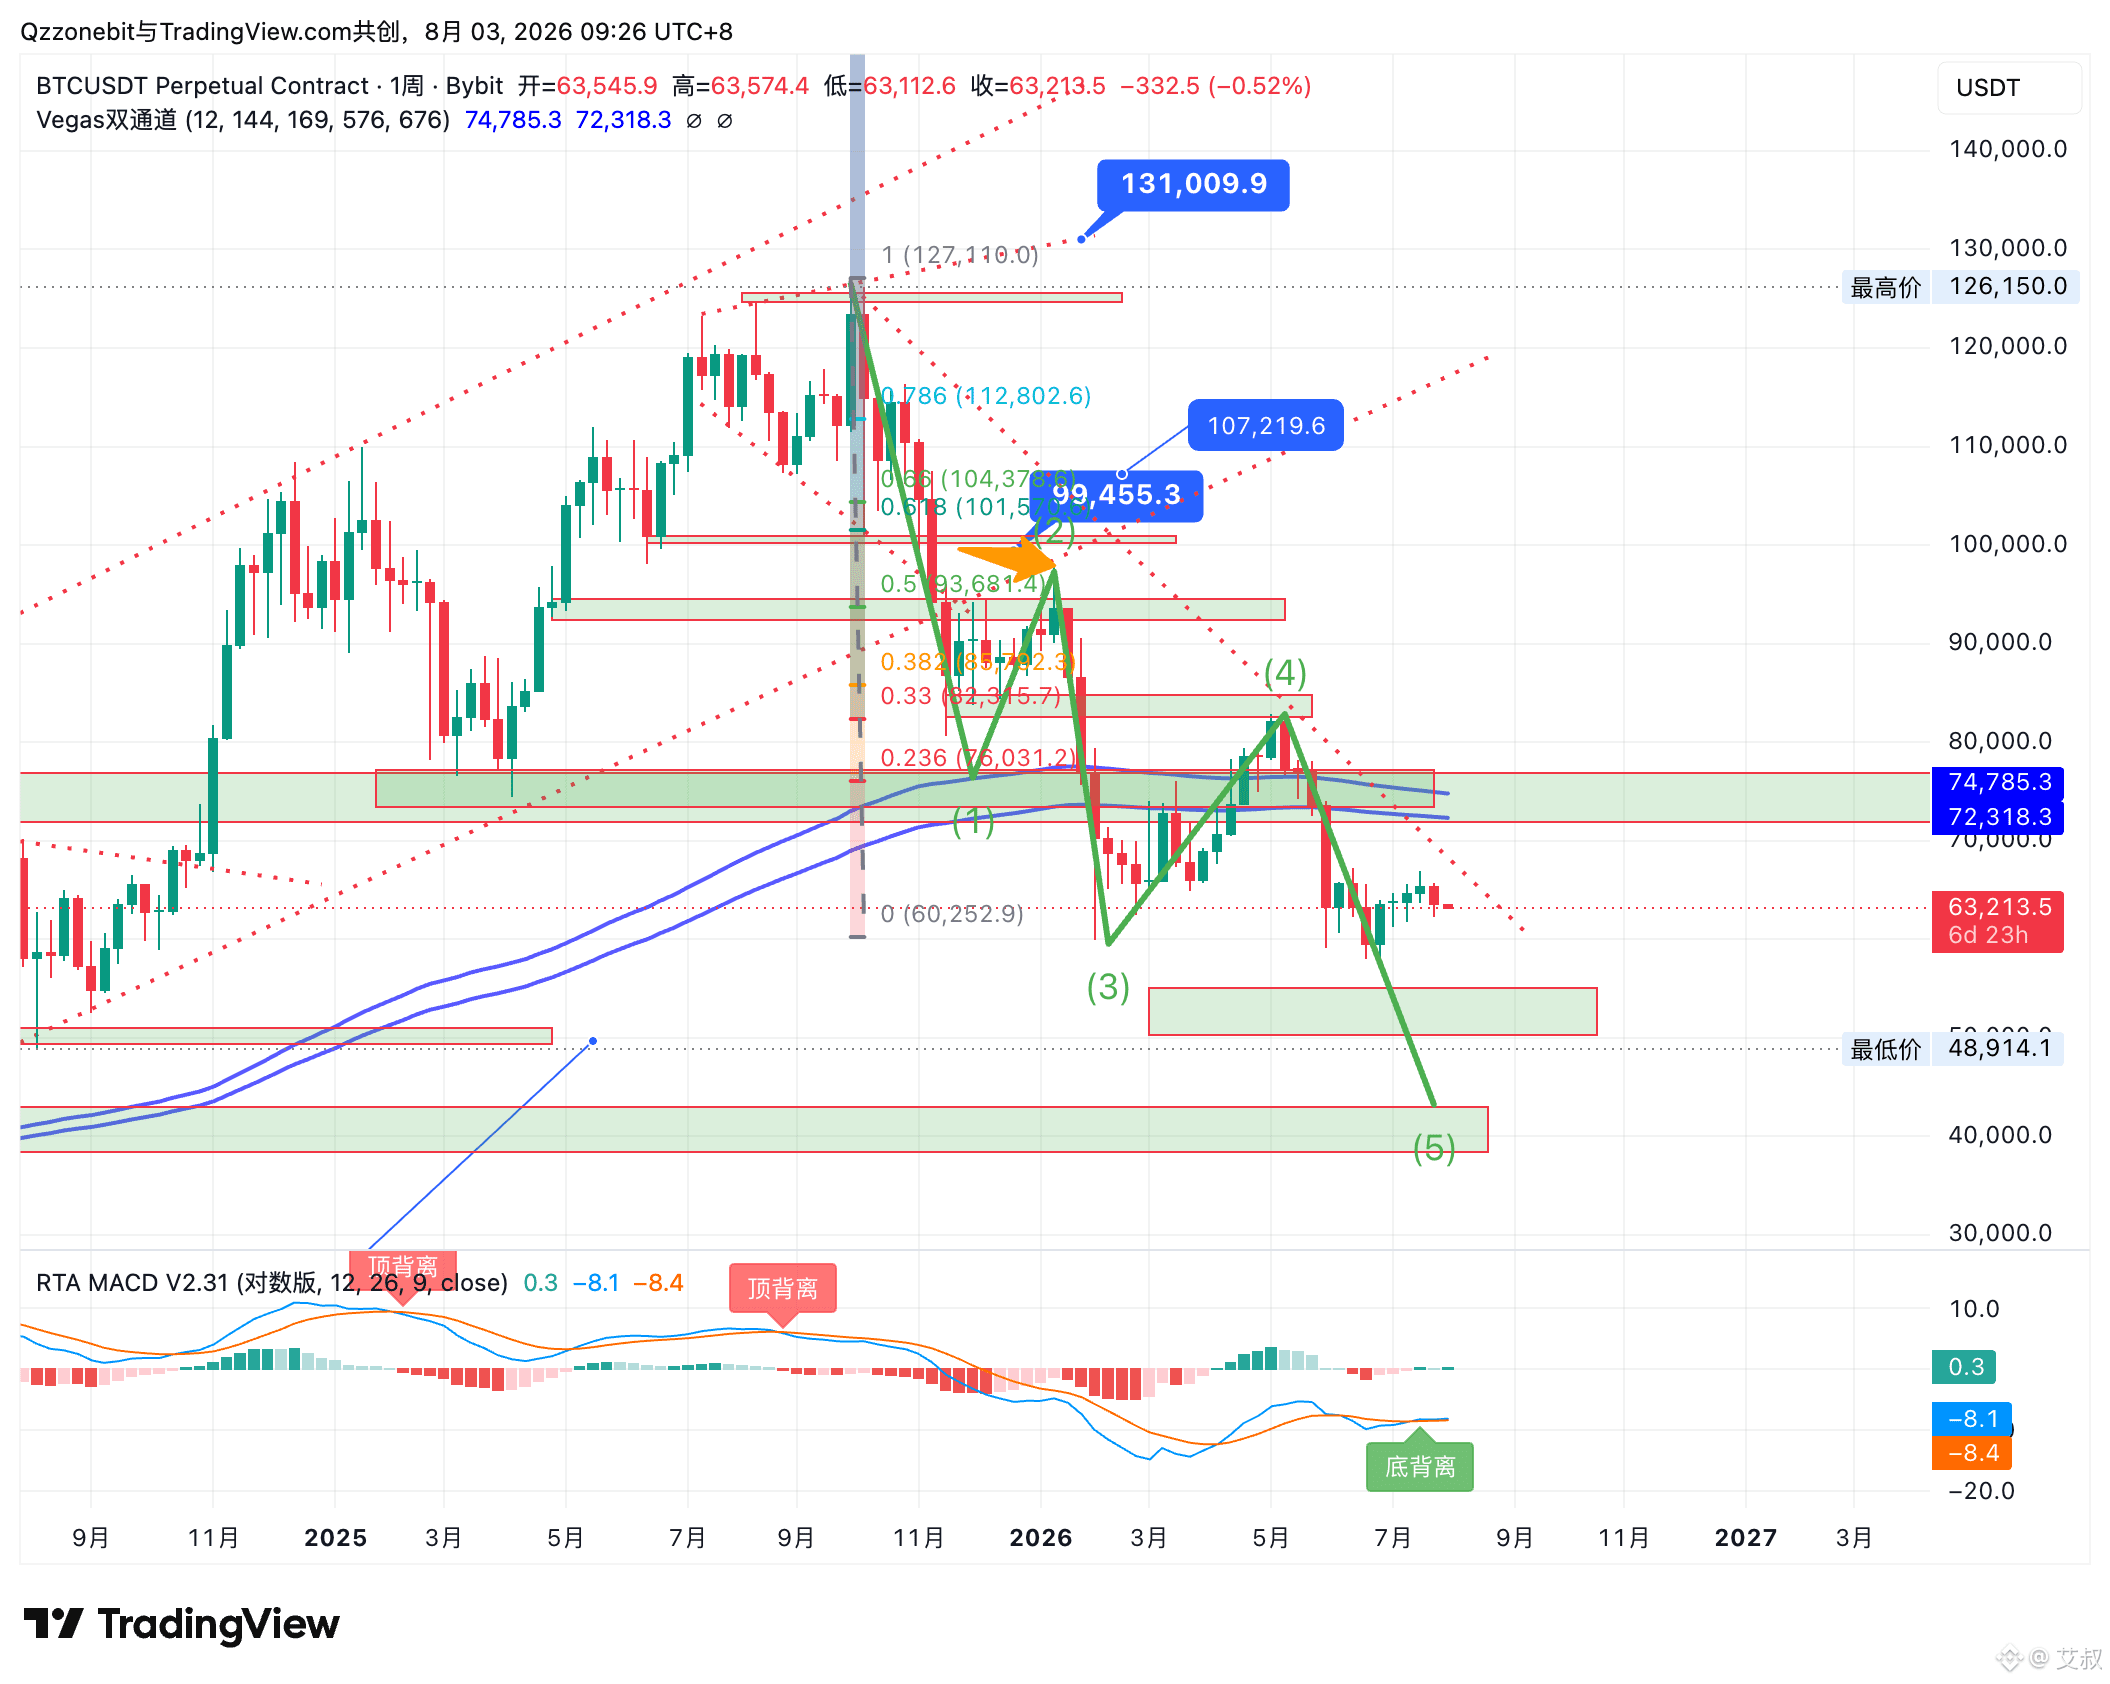
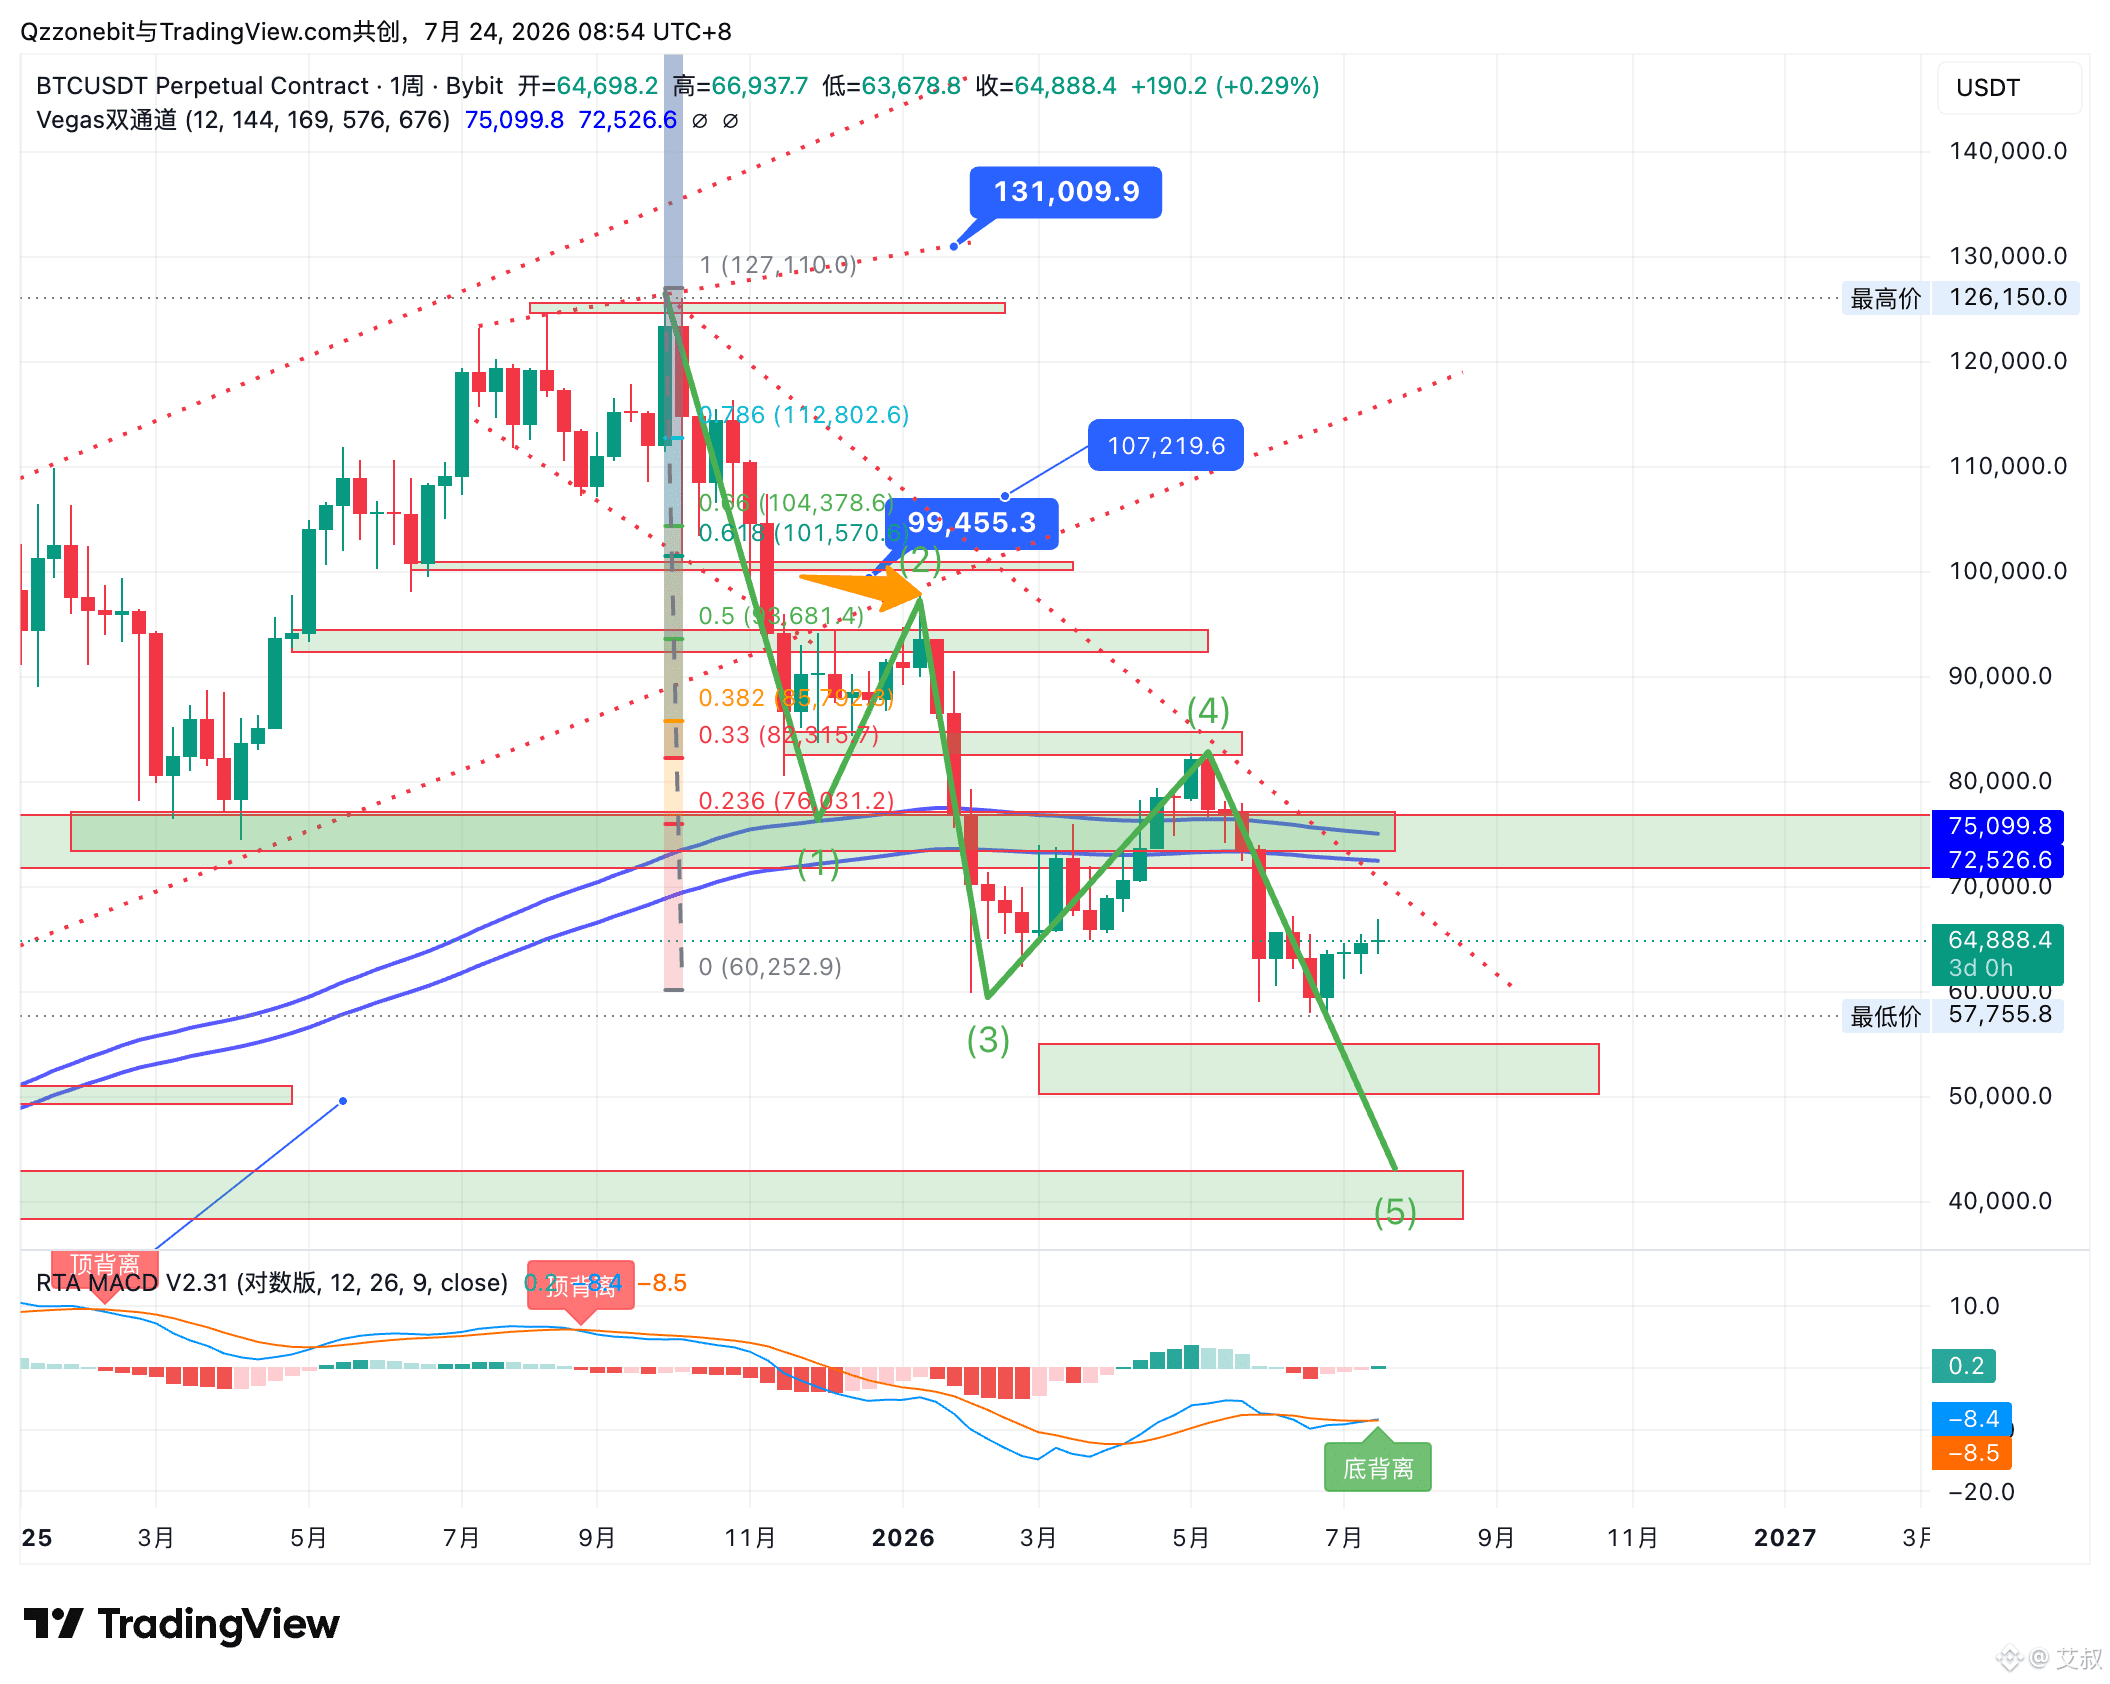
I. Weekly-level perspective: (Figure 1)
The big BTC is still in a natural rebound after the pullback.
1. The end-of-wave termination level is 4. If it’s above 82, that’s also the level where these past couple of months’ pullbacks ended—only then can the overall market structure change.
2. Structural repair: eat up this current pullback wave 4’s focus level at 6.65. If during these days price keeps closing above it, then on a smaller timeframe you can consider that the structural repair is already underway. The targets are 705–725.
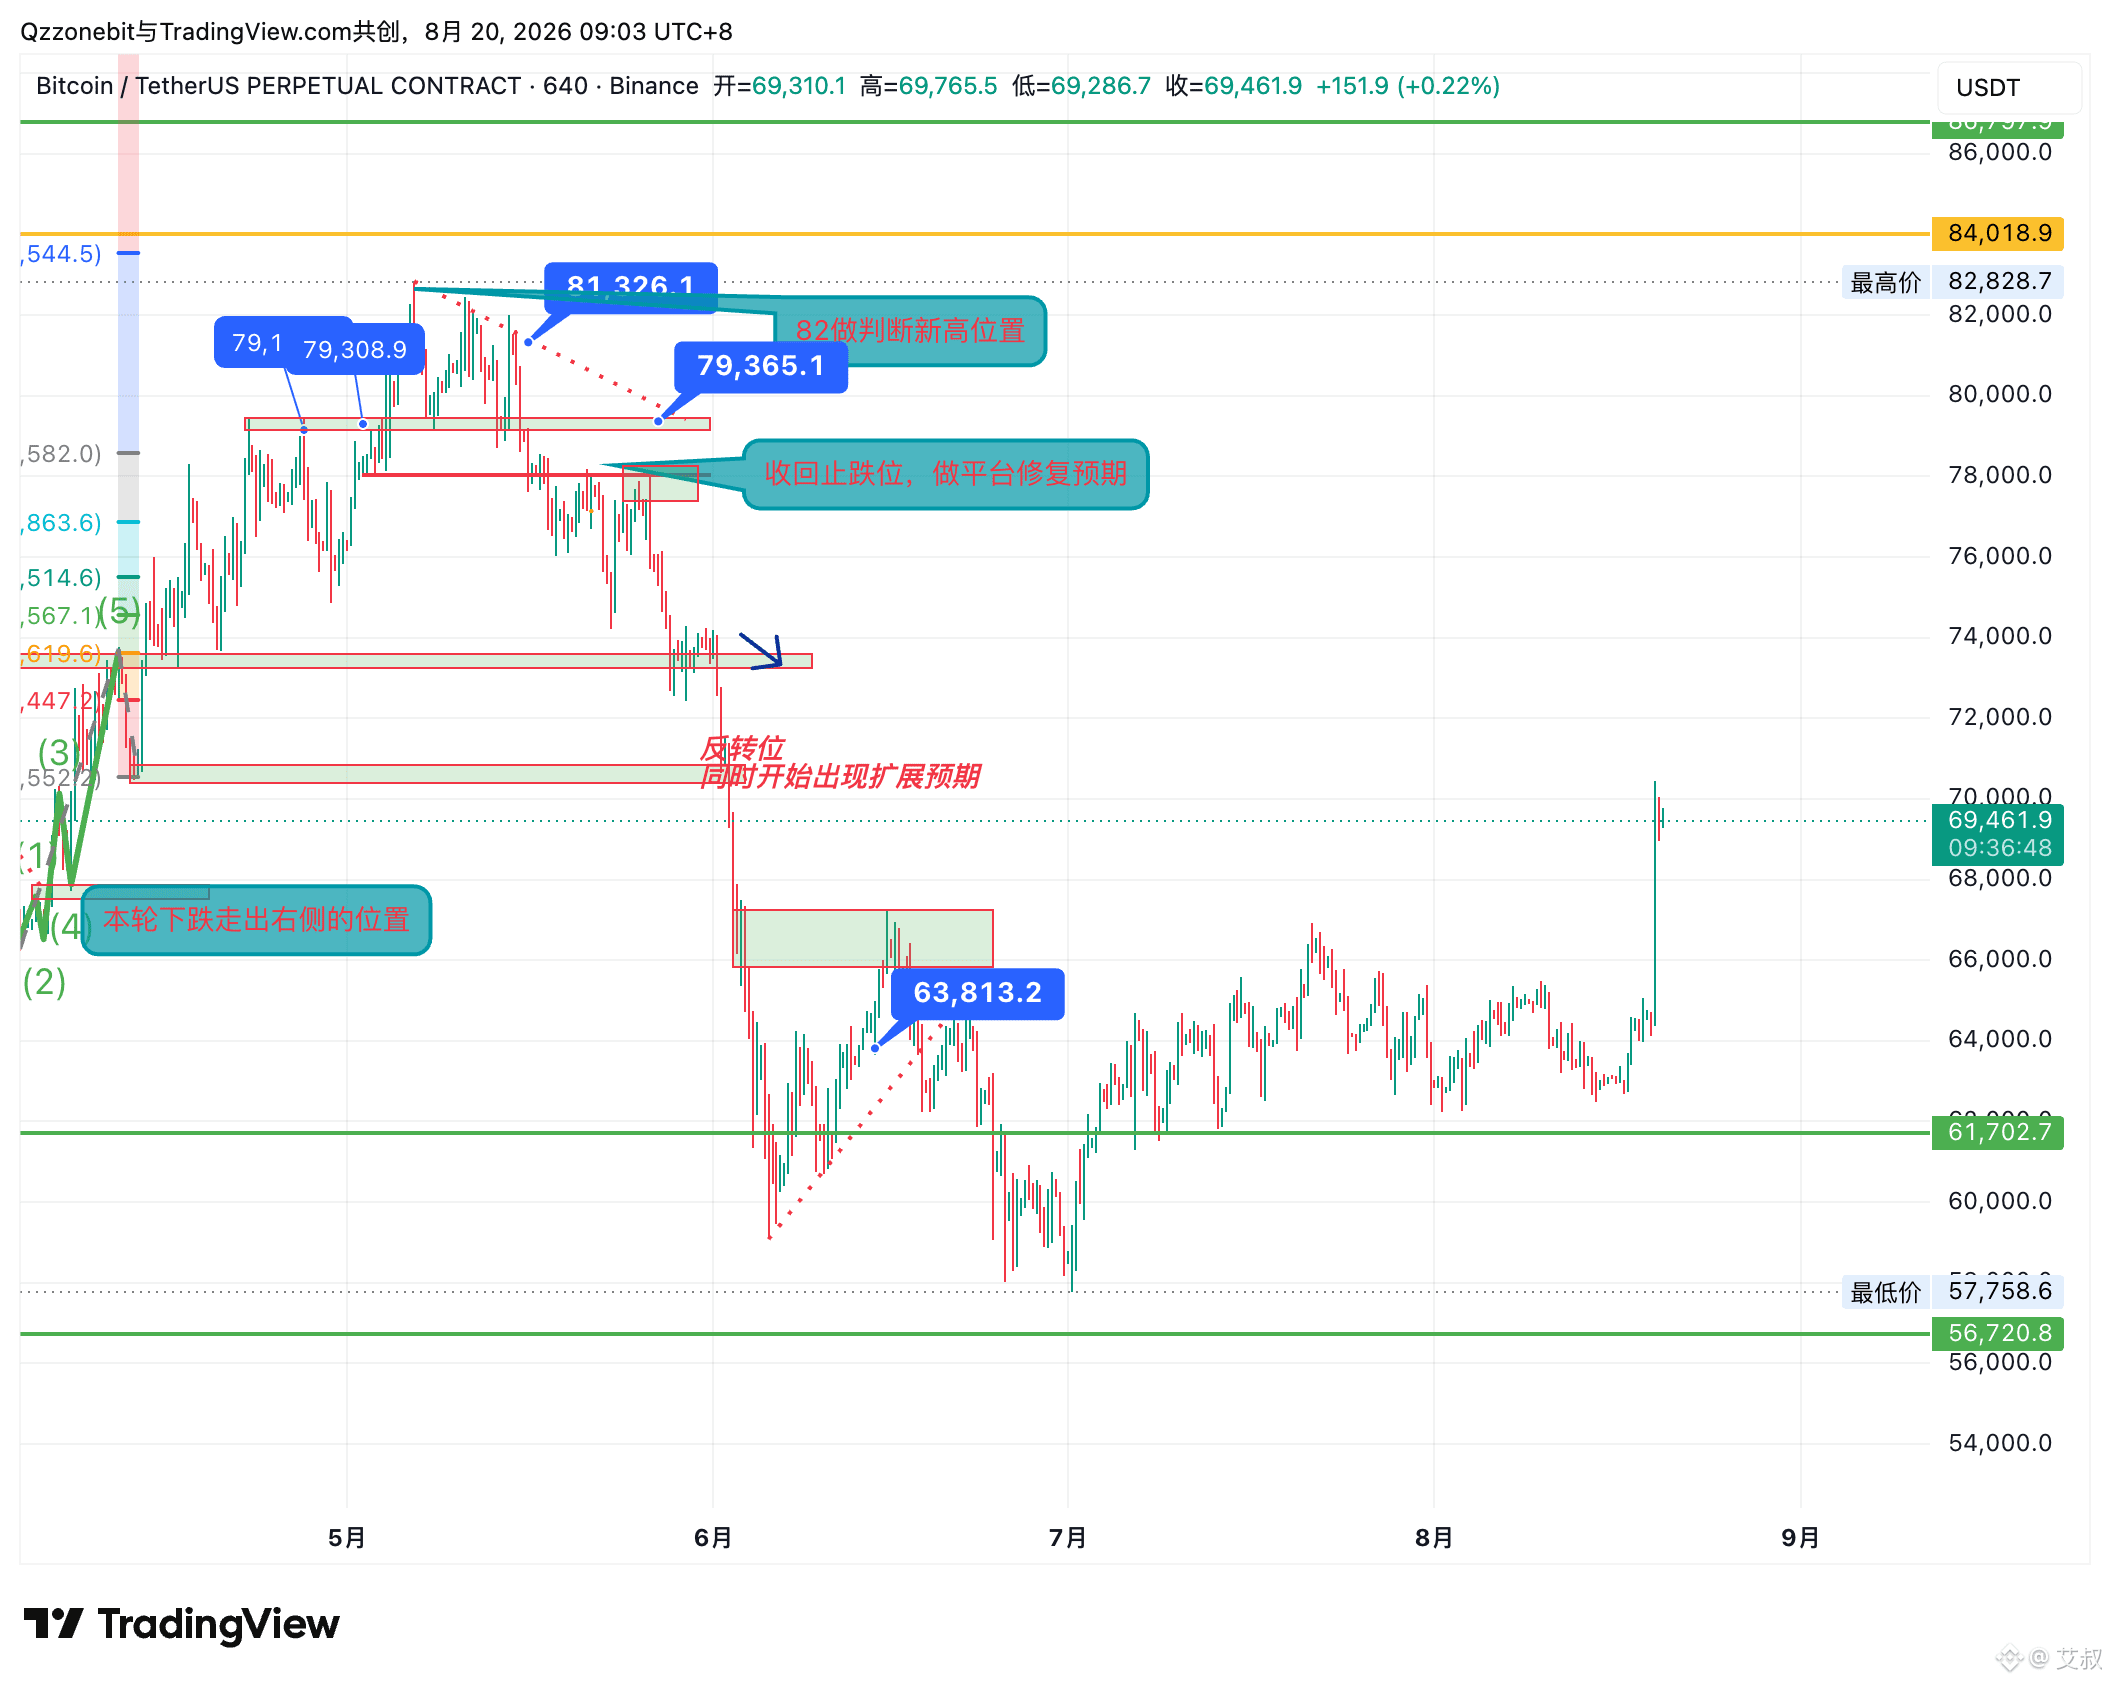
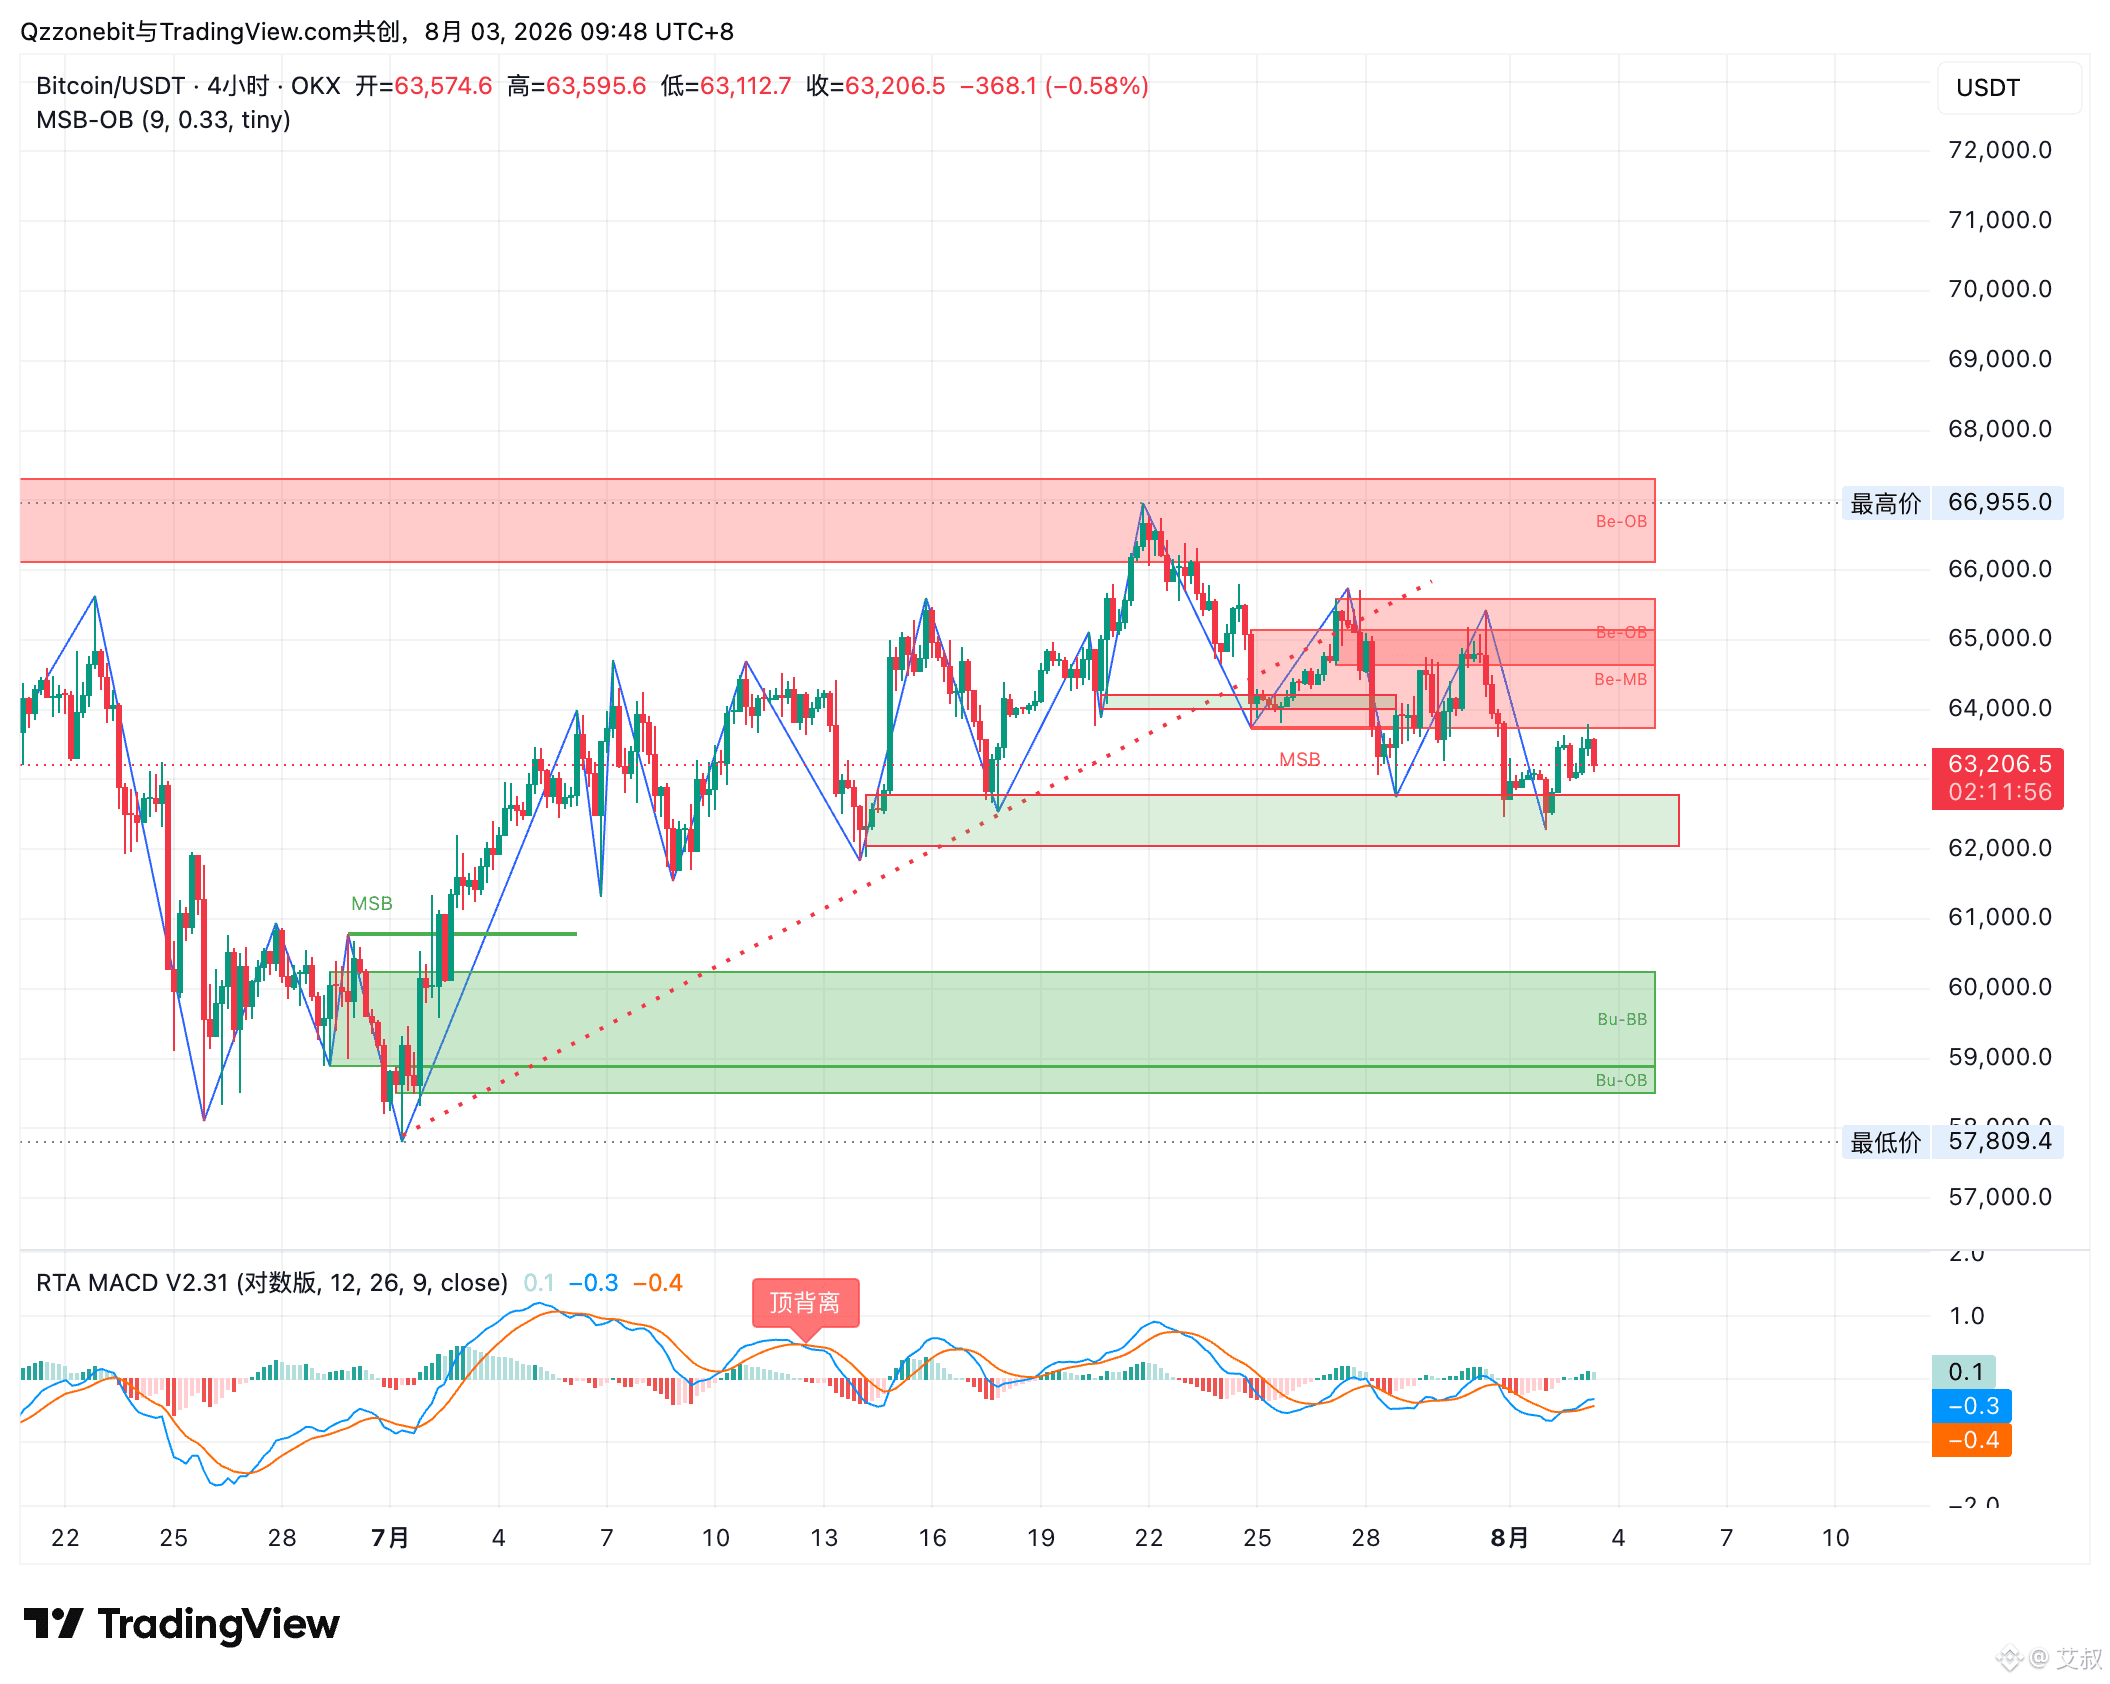
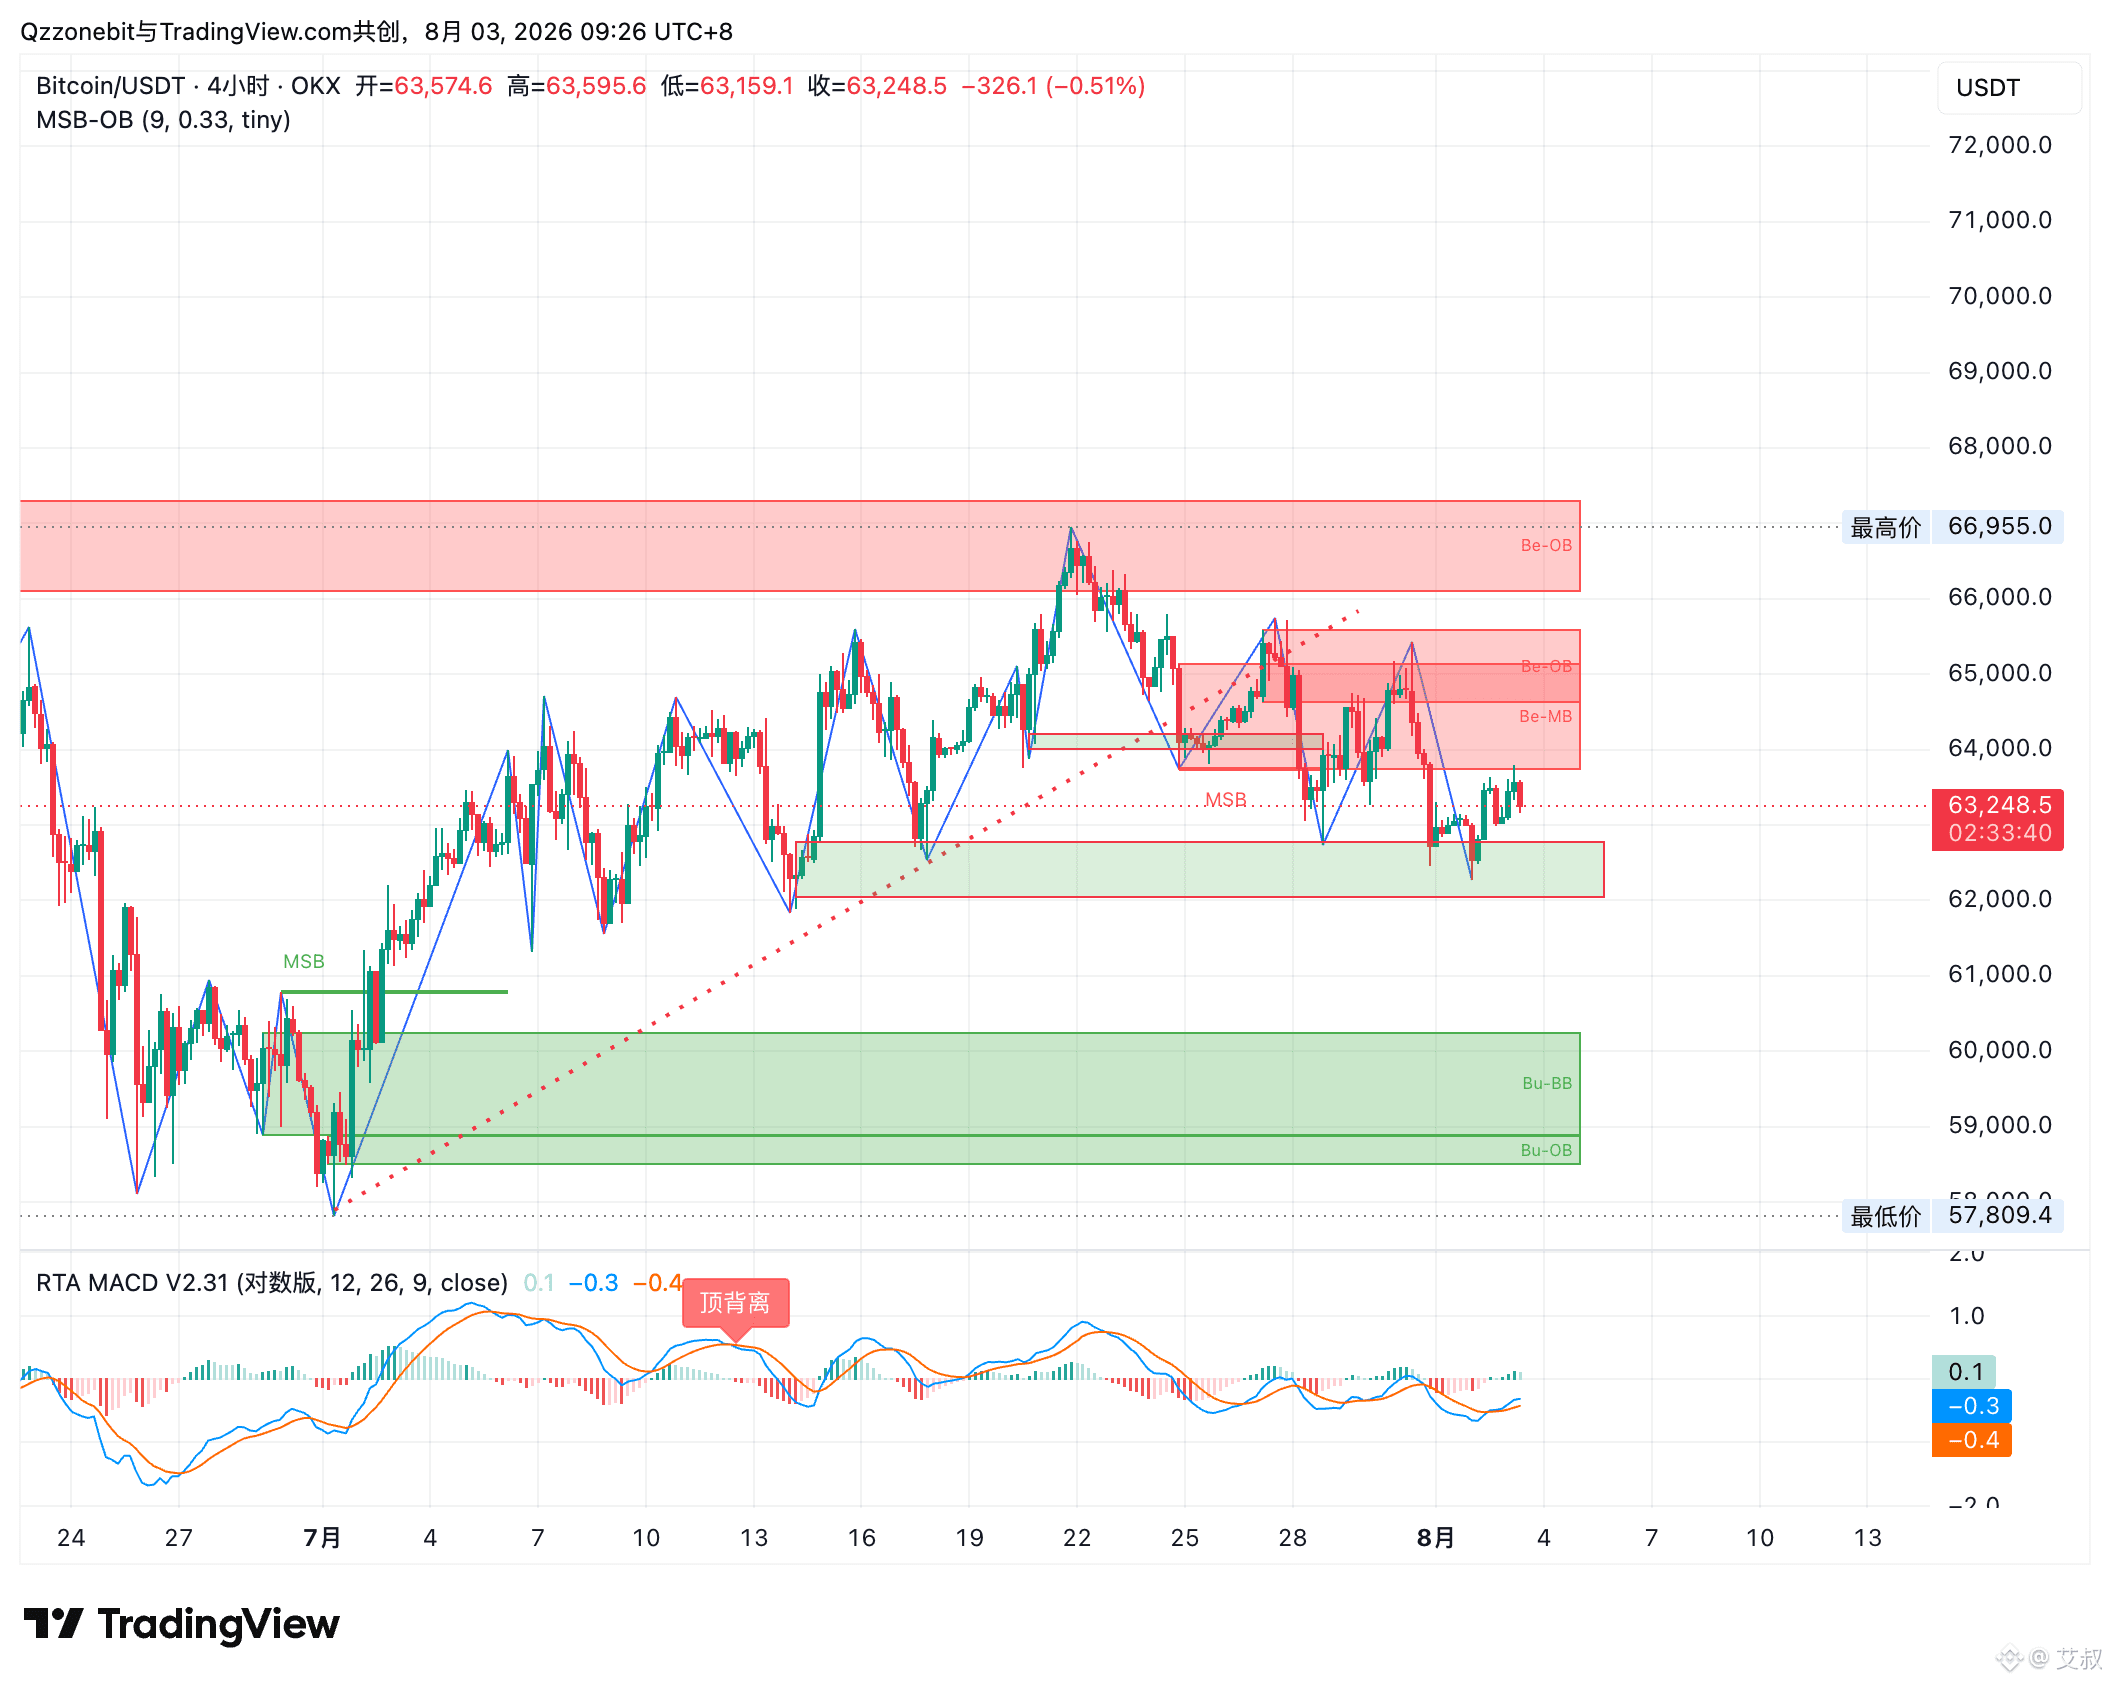
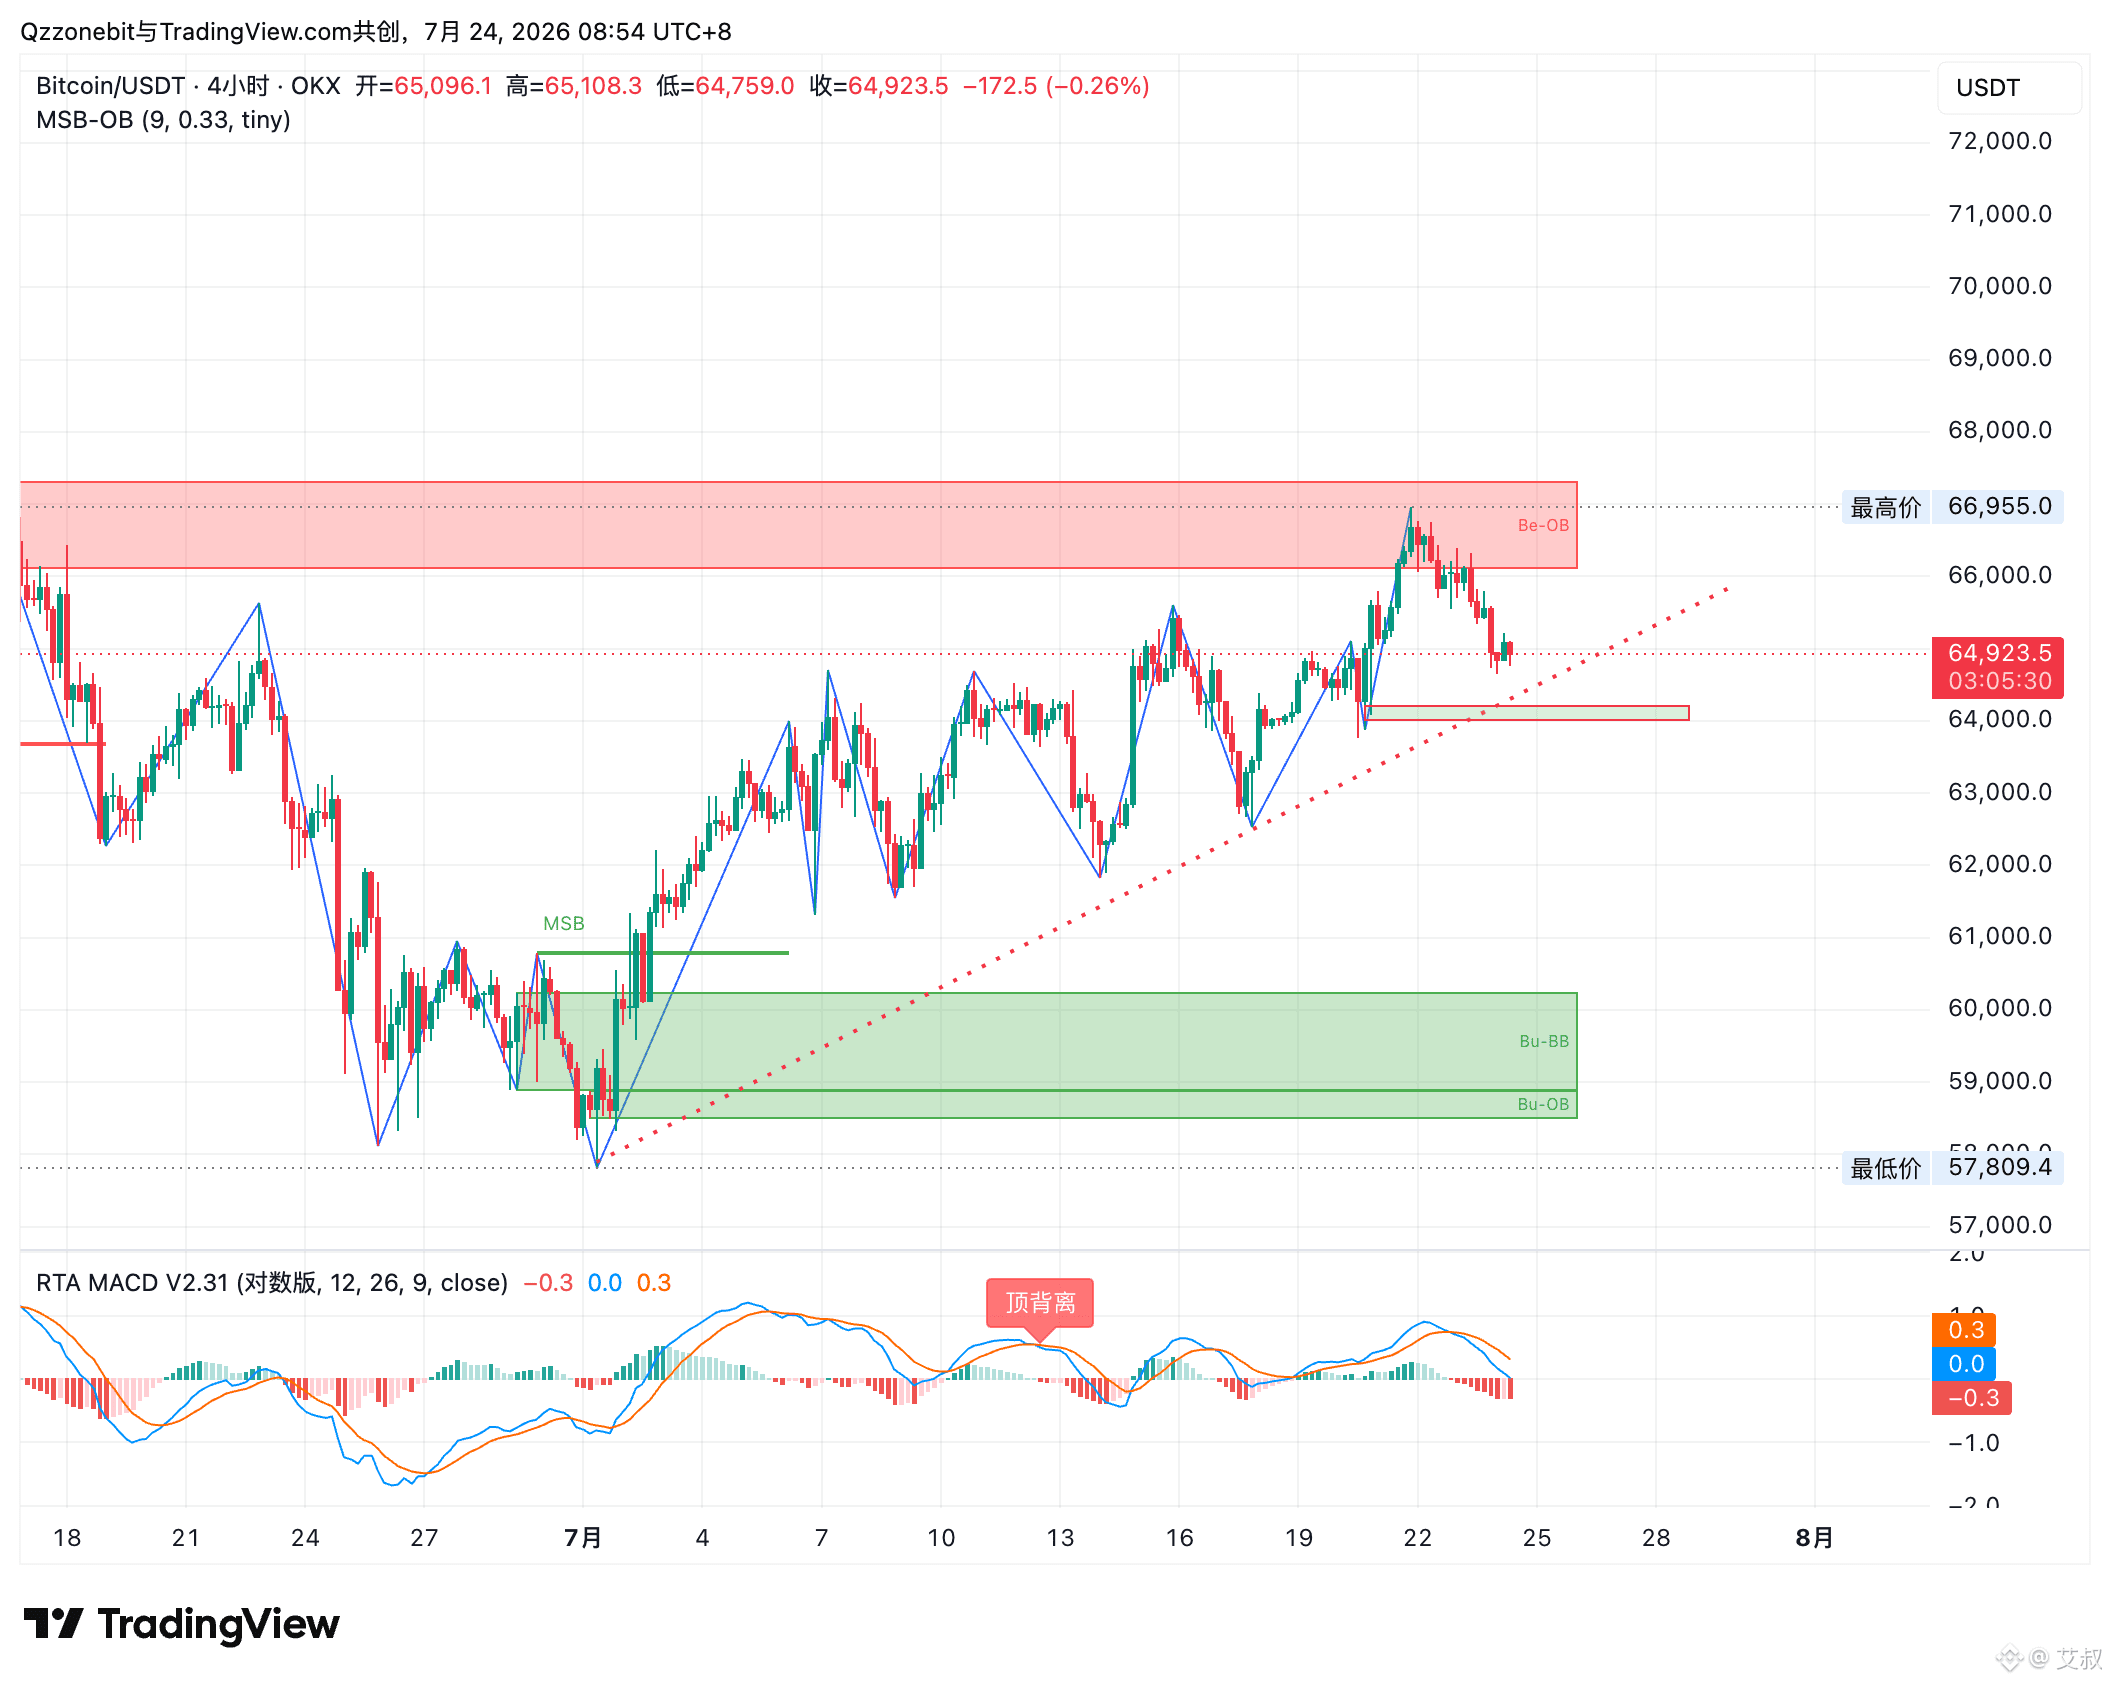
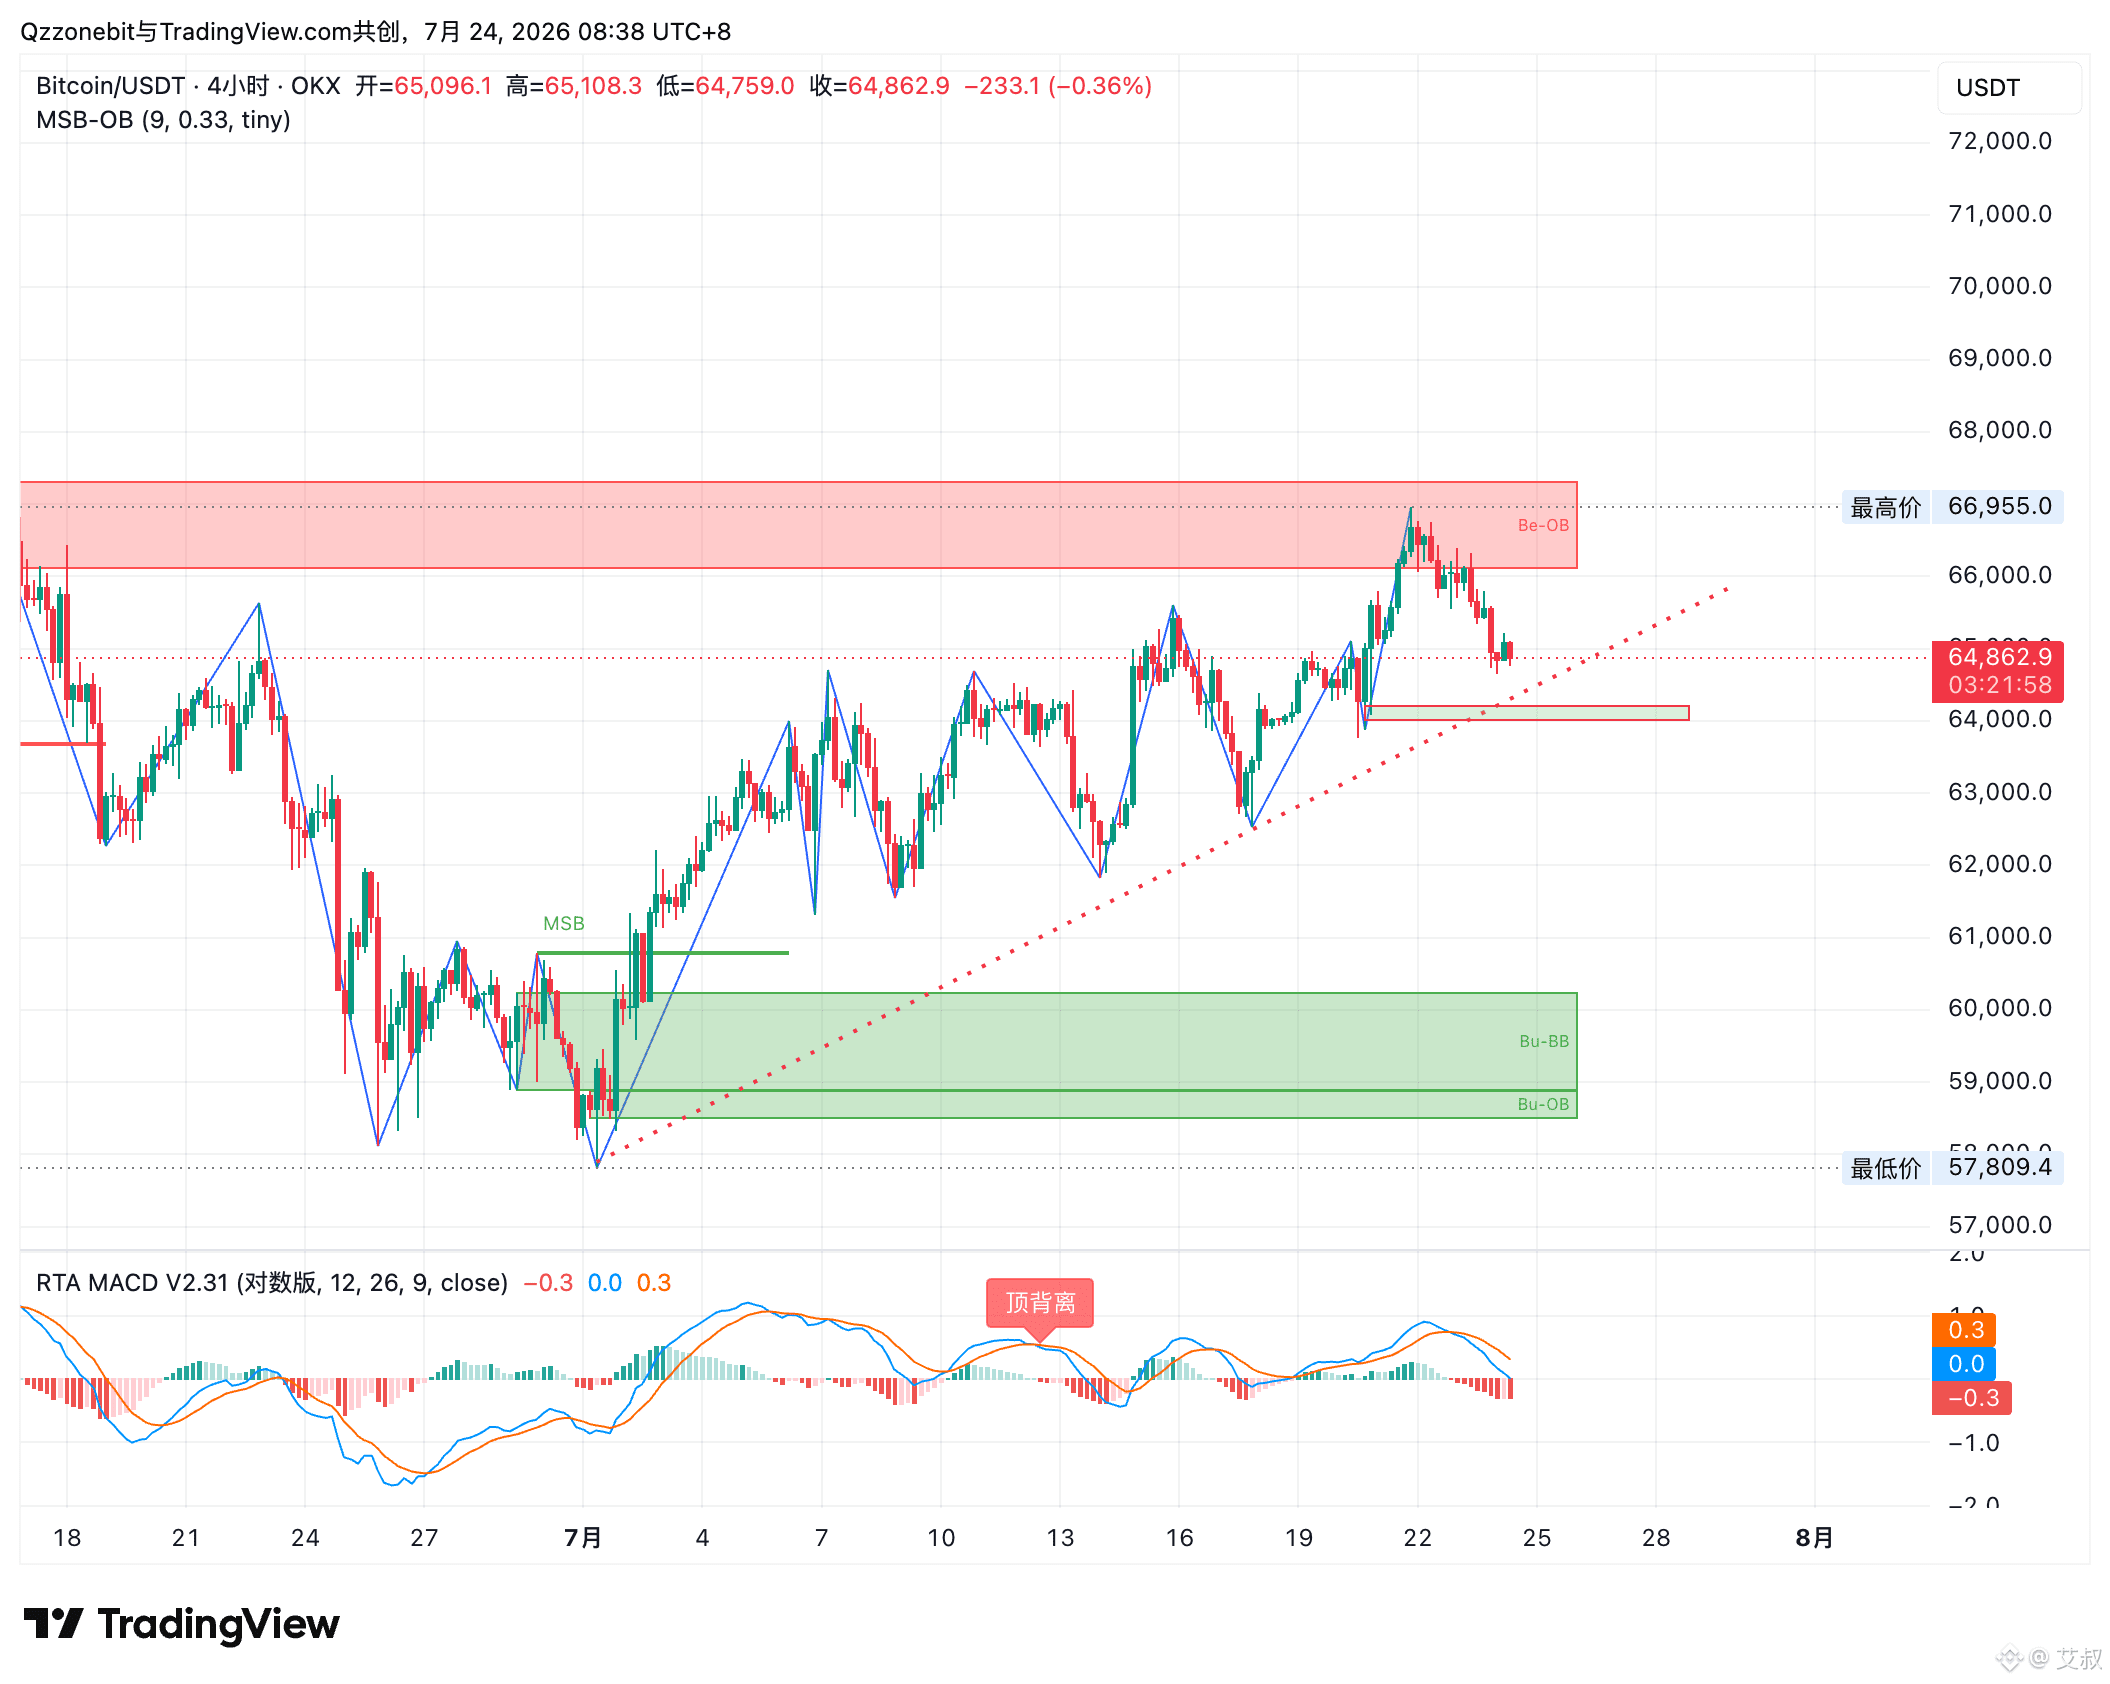
II. 4H timeframe: (Figure 2)
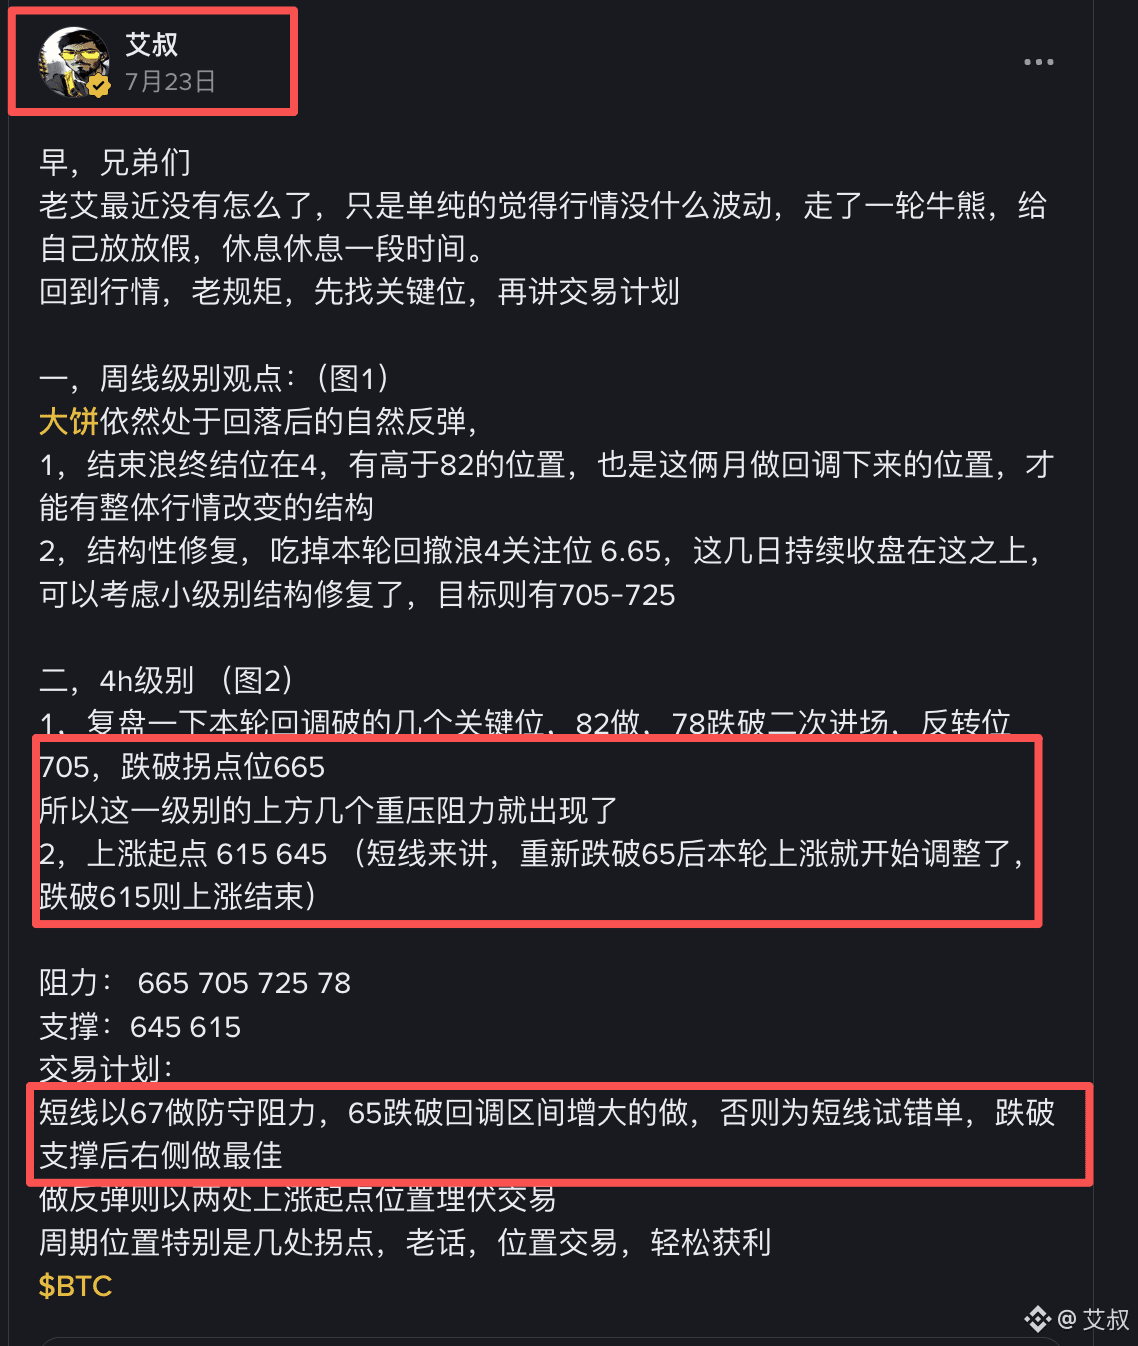
1. Let’s recap the key levels that got broken in this pullback: 82 was used as resistance, 78 was the level that broke down and then provided a second entry, the reversal level is 705, and it broke below the inflection point at 665.
So on this timeframe, the heavy overhead resistance areas appear.
2. Upswing starting points: 615 and 645. (For short-term context: once it falls back and breaks below 65, this current upswing starts turning into a correction; if it breaks below 615, then the upswing is over.)
Resistance: 665 705 725 78
Support: 645 615
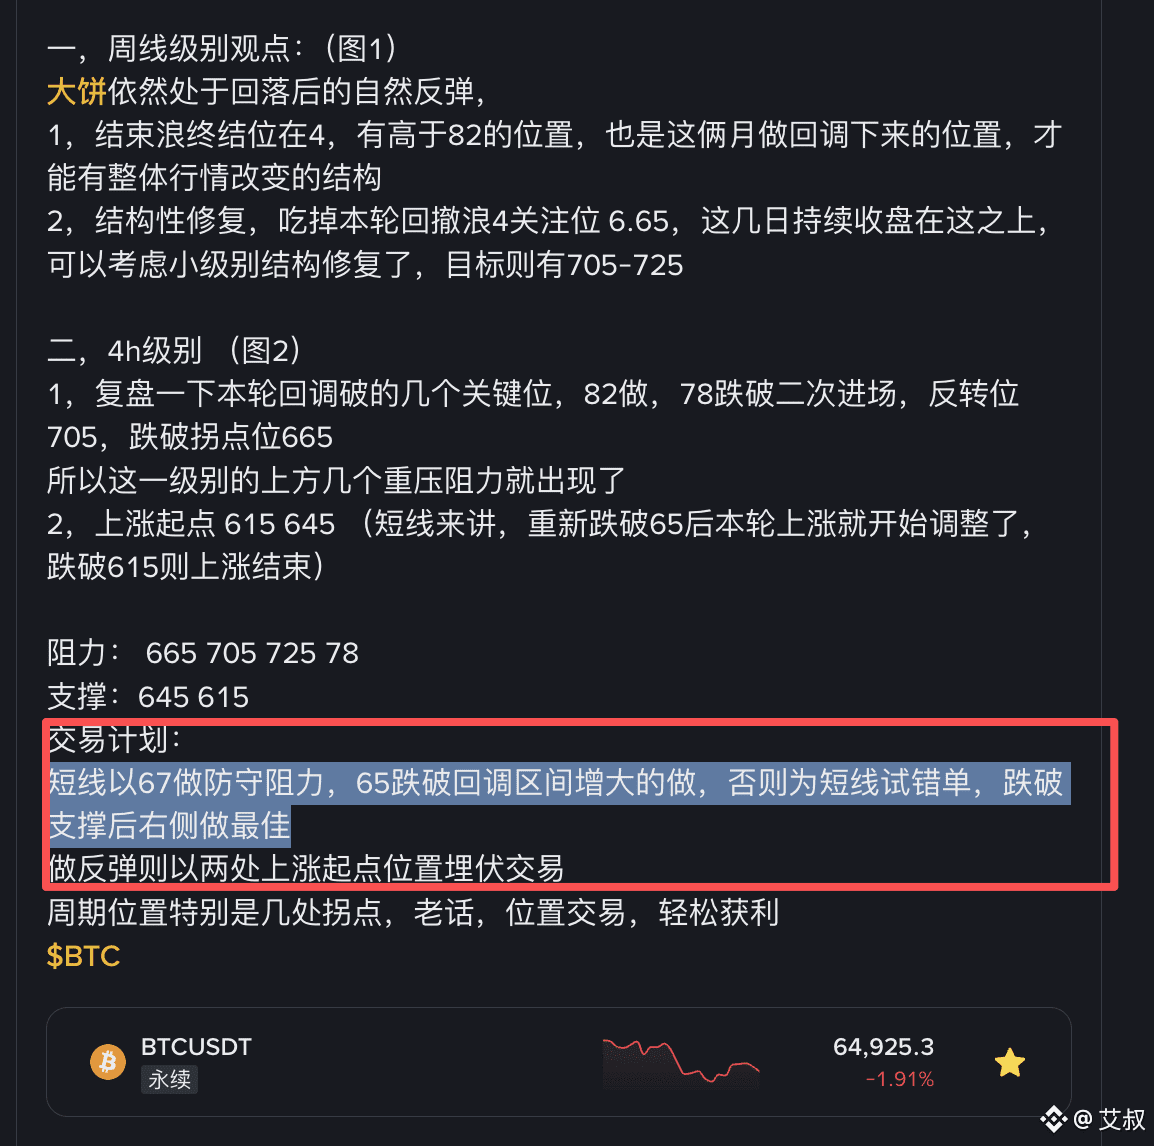
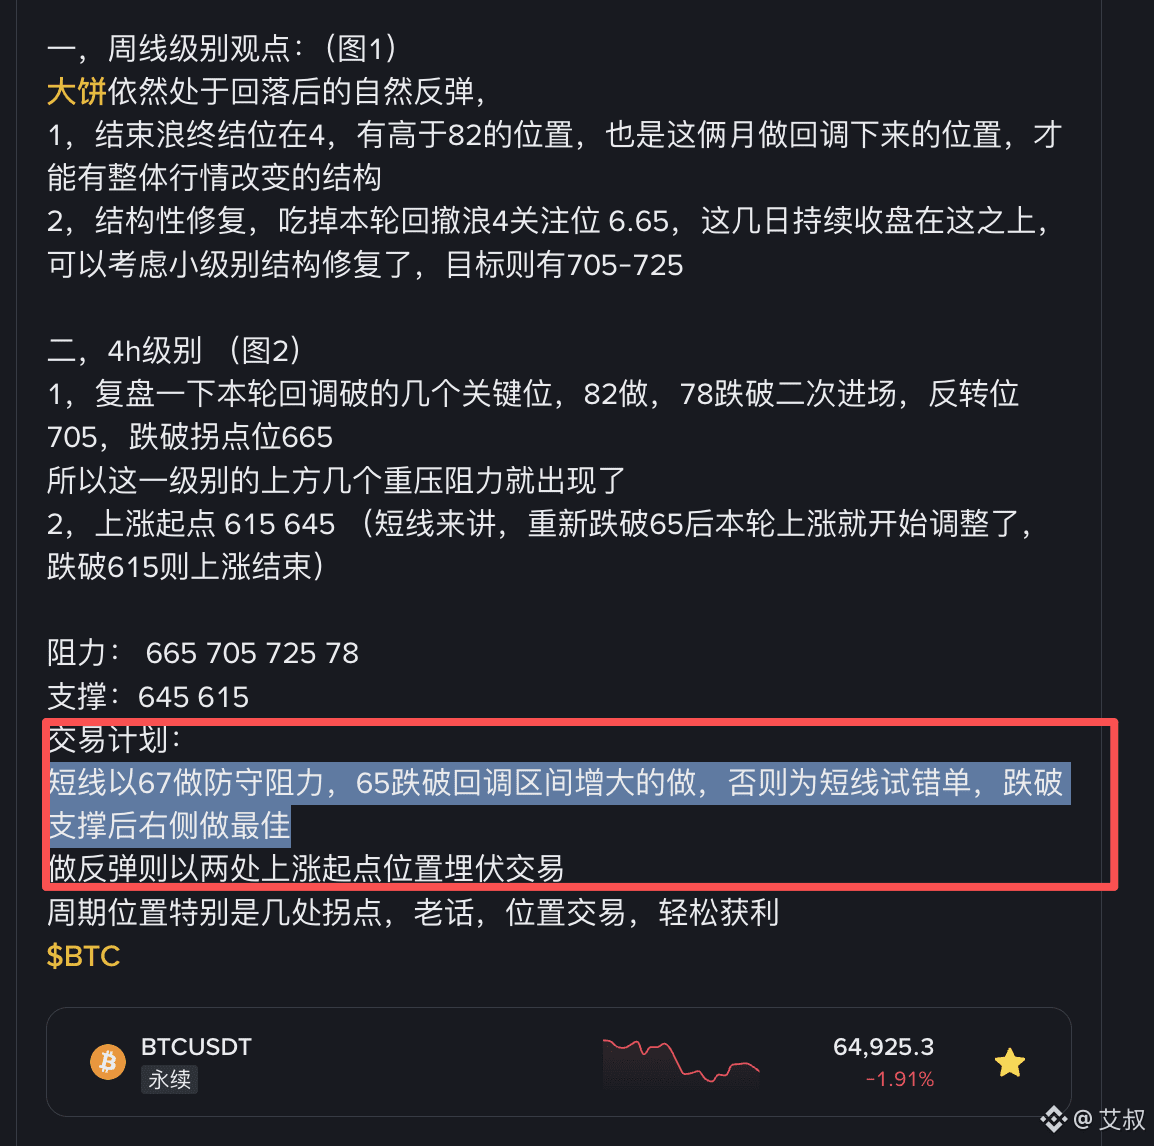
Trading plan:
For the short term, use 67 as the defensive resistance. If 65 breaks, the pullback zone becomes larger—then you do it; otherwise, use it as a short-term test order. After support is broken, the best is to do it on the right-side.
For a rebound, place orders by laying them at the two upswing start positions.
For cycle positions—especially a few inflection points—old saying: position trades. Easy profits.
$BTC
Lao Ai hasn’t really been doing much lately. He just feels the market isn’t moving much. He went through a cycle of bull and bear and gave himself some time off—taking a break for a while.
Back to the market: same old routine—first find the key levels, then talk about the trading plan.
I. Weekly-level perspective: (Figure 1)
The big BTC is still in a natural rebound after the pullback.
1. The end-of-wave termination level is 4. If it’s above 82, that’s also the level where these past couple of months’ pullbacks ended—only then can the overall market structure change.
2. Structural repair: eat up this current pullback wave 4’s focus level at 6.65. If during these days price keeps closing above it, then on a smaller timeframe you can consider that the structural repair is already underway. The targets are 705–725.
II. 4H timeframe: (Figure 2)
1. Let’s recap the key levels that got broken in this pullback: 82 was used as resistance, 78 was the level that broke down and then provided a second entry, the reversal level is 705, and it broke below the inflection point at 665.
So on this timeframe, the heavy overhead resistance areas appear.
2. Upswing starting points: 615 and 645. (For short-term context: once it falls back and breaks below 65, this current upswing starts turning into a correction; if it breaks below 615, then the upswing is over.)
Resistance: 665 705 725 78
Support: 645 615
Trading plan:
For the short term, use 67 as the defensive resistance. If 65 breaks, the pullback zone becomes larger—then you do it; otherwise, use it as a short-term test order. After support is broken, the best is to do it on the right-side.
For a rebound, place orders by laying them at the two upswing start positions.
For cycle positions—especially a few inflection points—old saying: position trades. Easy profits.
$BTC
艾叔
·
--
⚠️
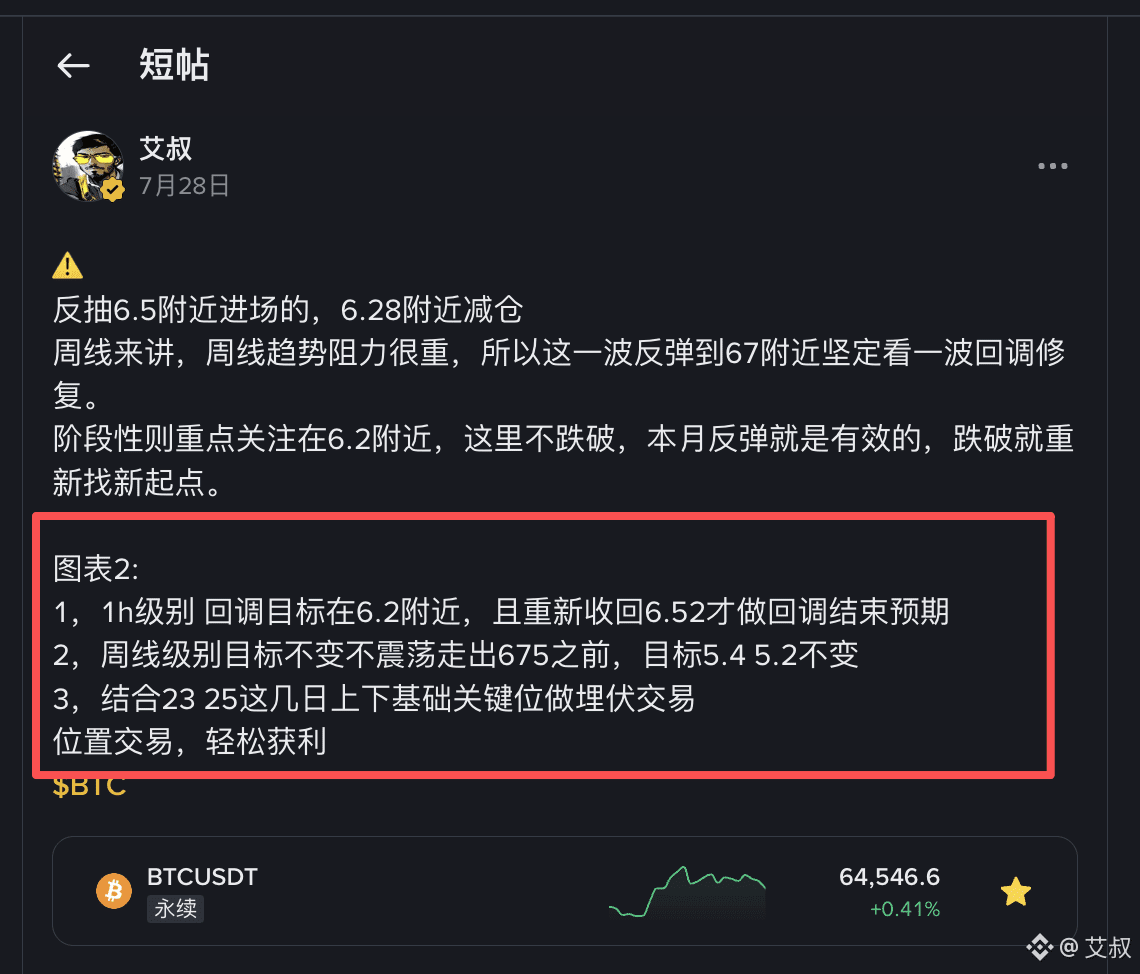
For those entering around the 6.5 rebound—reduce positions around 6.28.
From a weekly perspective, the weekly trend faces heavy resistance, so this rebound is expected to rally firmly toward the 67 area before a pullback and correction.
In the next phase, the key focus is around 6.2. As long as it doesn’t break below 6.2, this month’s rebound remains valid. If it breaks below, then you’ll need to look for a new starting point.
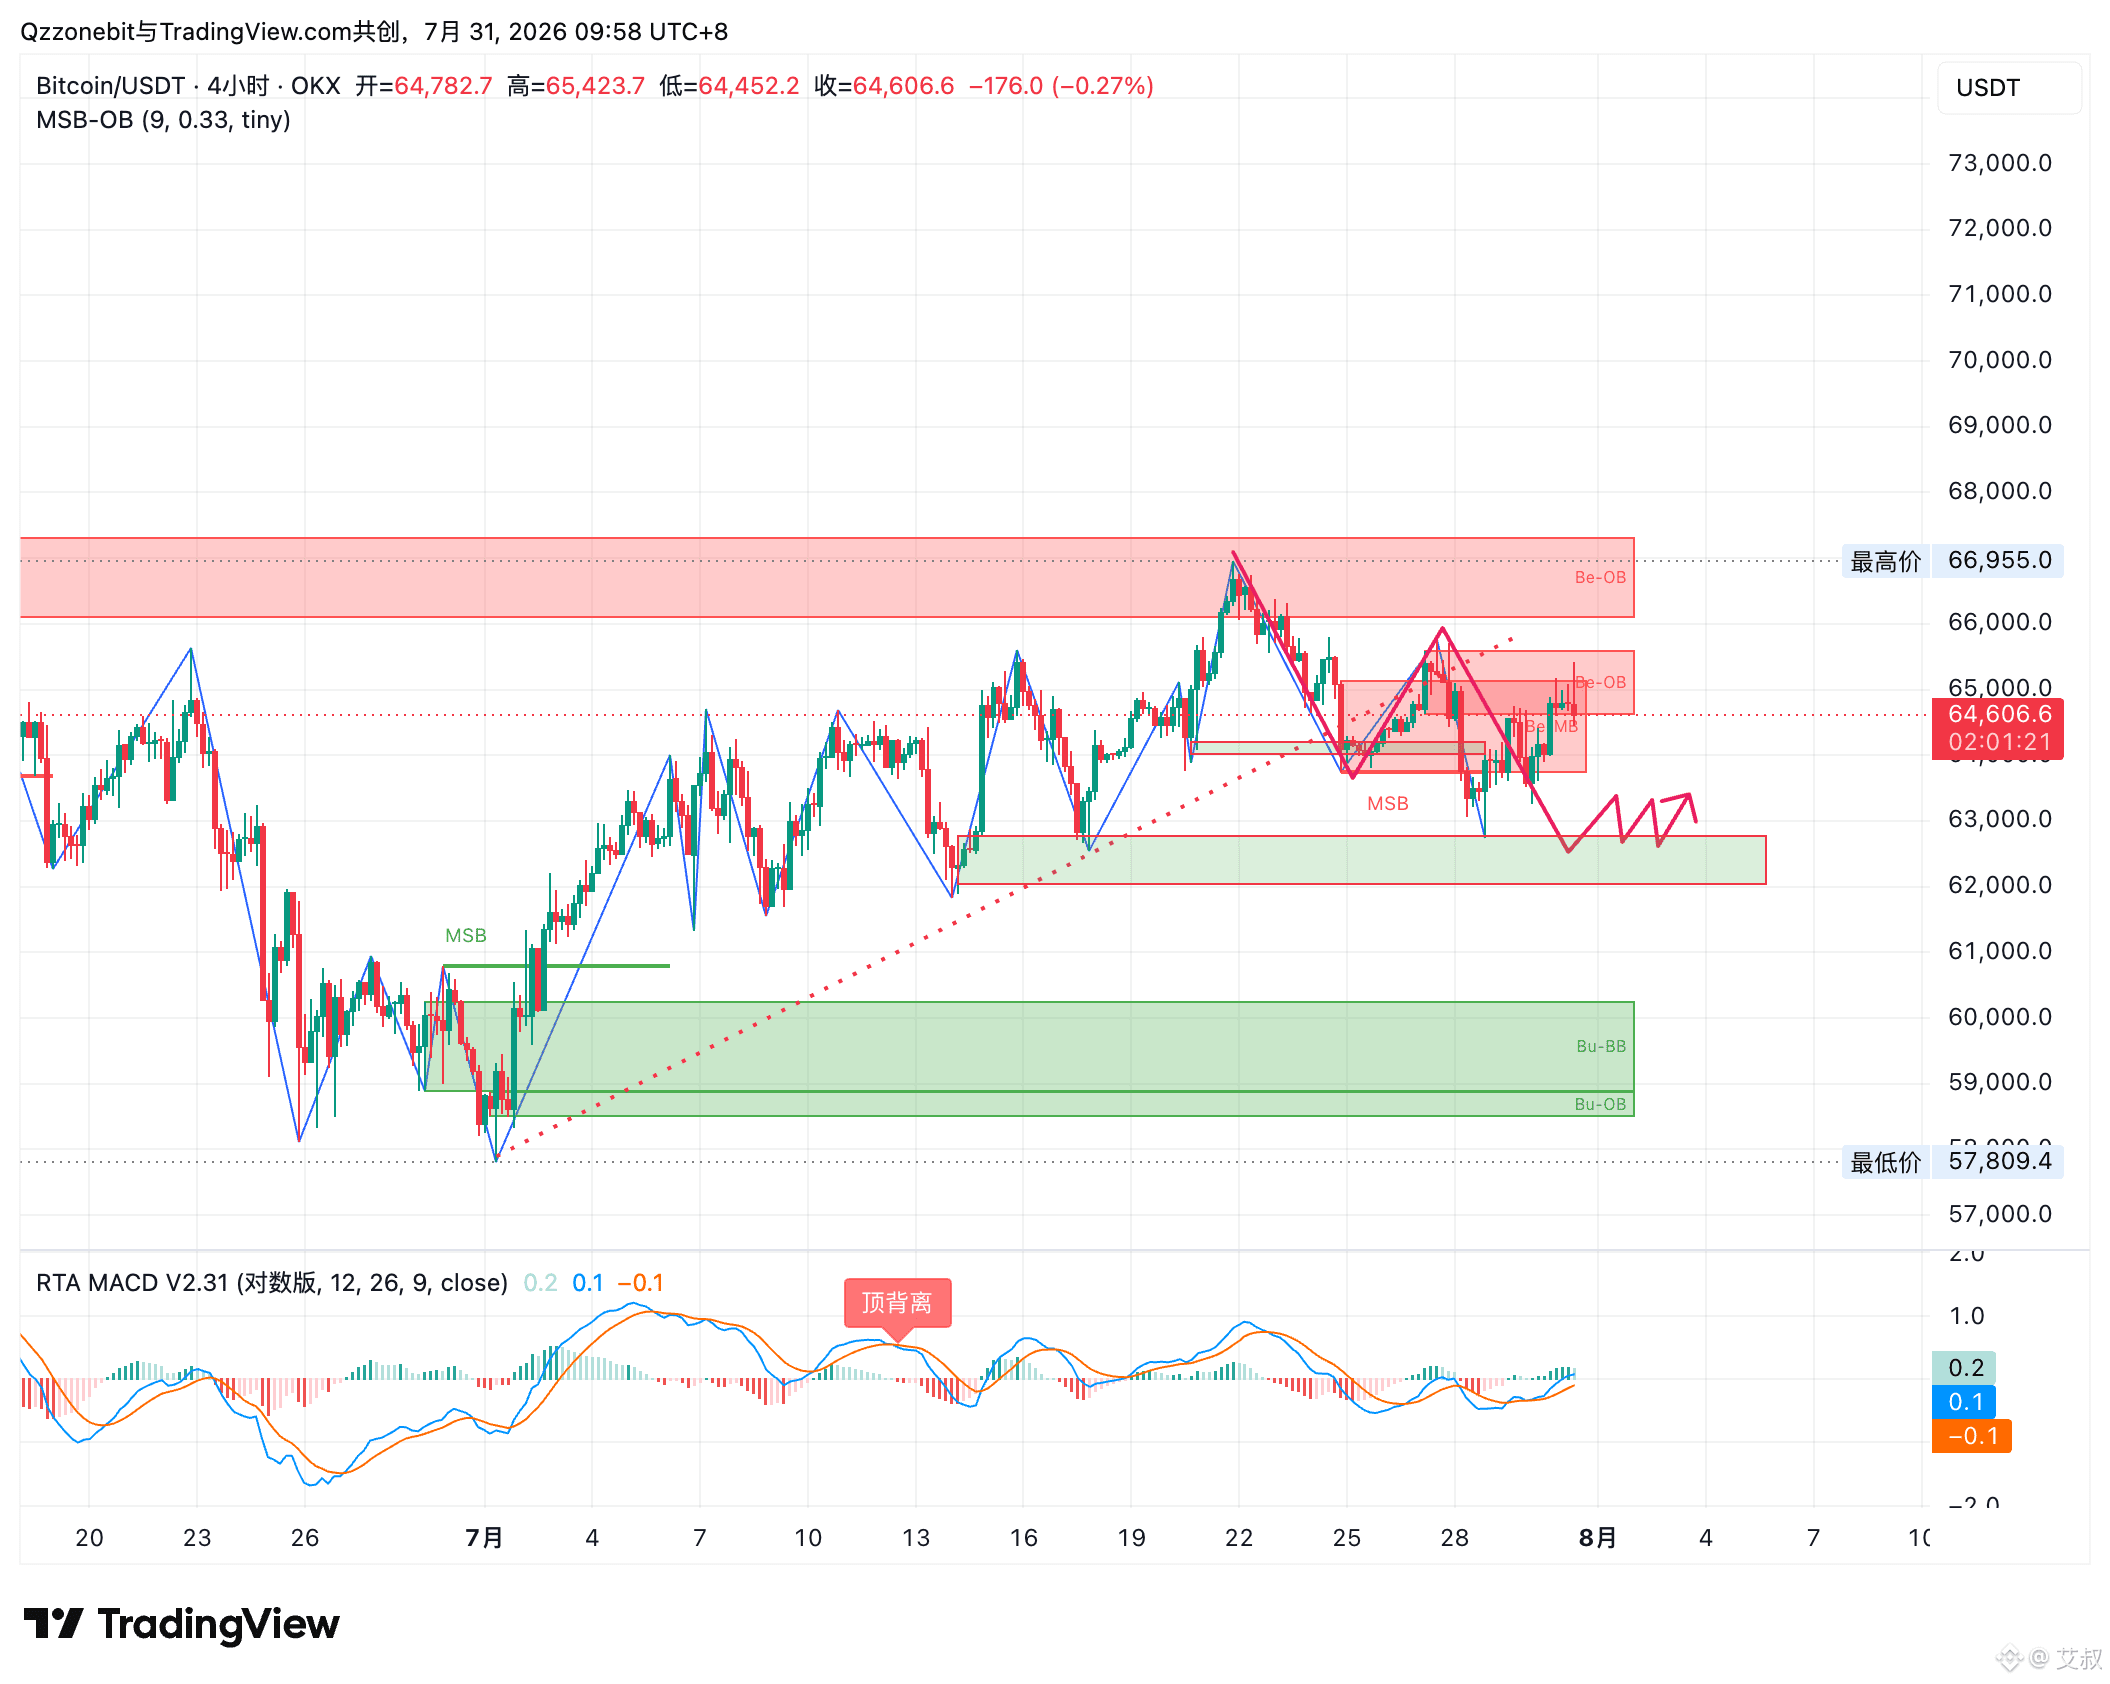
Chart 2:
1. On the 1h timeframe: the pullback target is around 6.2, and only after it reclaims 6.52 can you expect the pullback to be over.
2. On the weekly timeframe: targets remain unchanged. As long as it doesn’t range and move out below 675, the targets at 5.4 and 5.2 remain the same.
3. Set up orders for position trades by using the key support/resistance areas established over the past few days (23–25).
Position trading—easy profits.
$BTC
For those entering around the 6.5 rebound—reduce positions around 6.28.
From a weekly perspective, the weekly trend faces heavy resistance, so this rebound is expected to rally firmly toward the 67 area before a pullback and correction.
In the next phase, the key focus is around 6.2. As long as it doesn’t break below 6.2, this month’s rebound remains valid. If it breaks below, then you’ll need to look for a new starting point.
Chart 2:
1. On the 1h timeframe: the pullback target is around 6.2, and only after it reclaims 6.52 can you expect the pullback to be over.
2. On the weekly timeframe: targets remain unchanged. As long as it doesn’t range and move out below 675, the targets at 5.4 and 5.2 remain the same.
3. Set up orders for position trades by using the key support/resistance areas established over the past few days (23–25).
Position trading—easy profits.
$BTC
艾叔
·
--
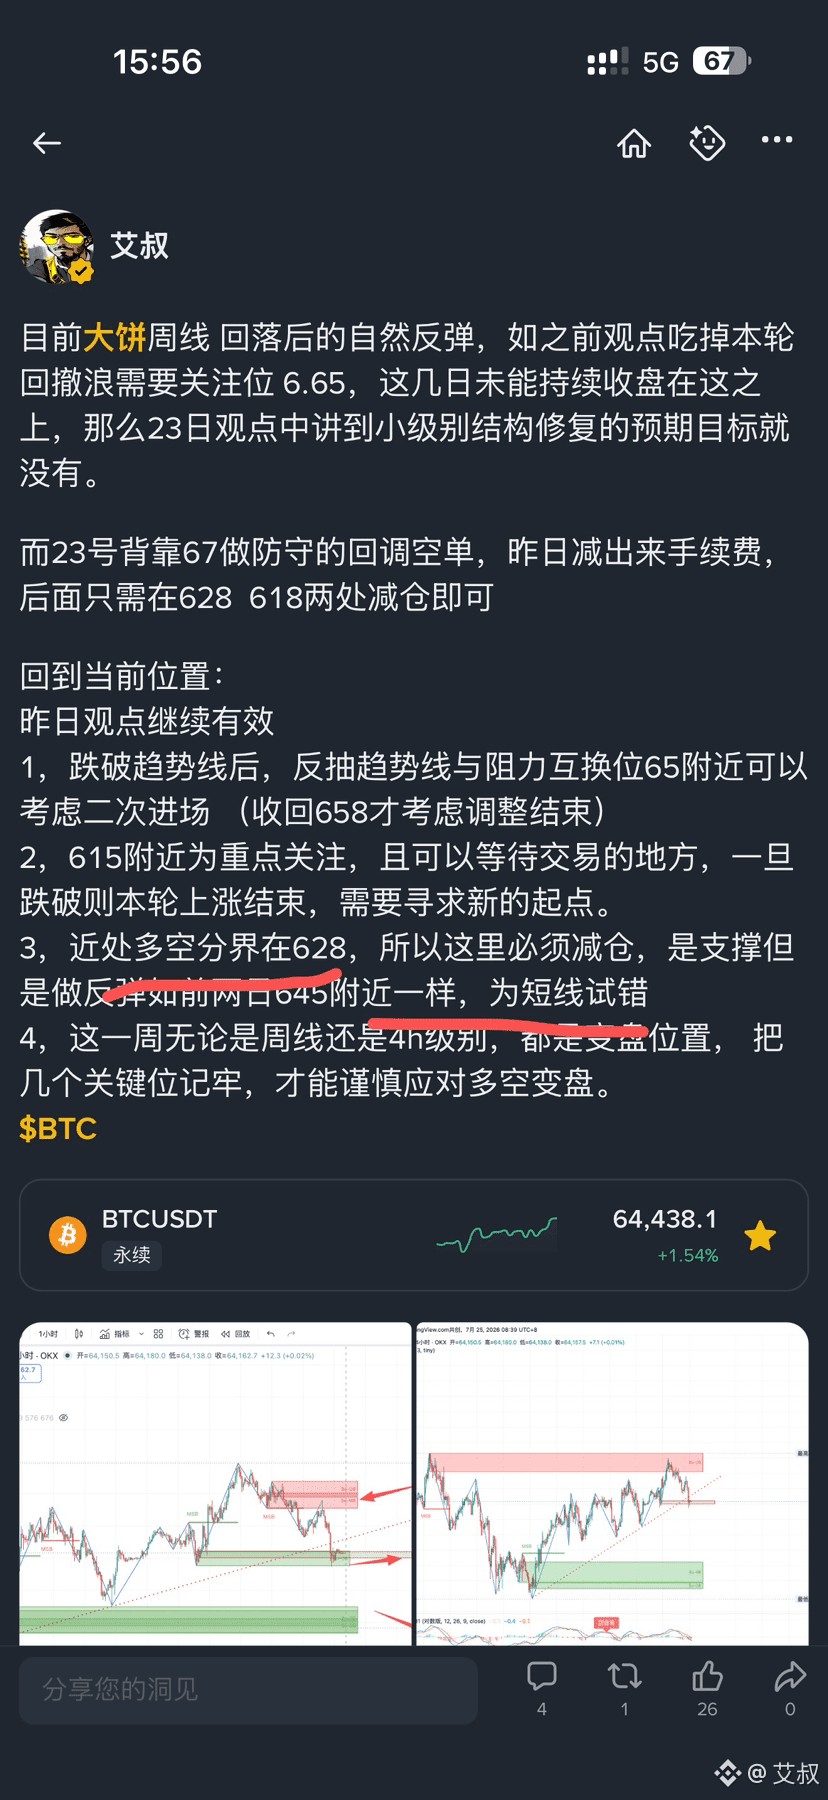
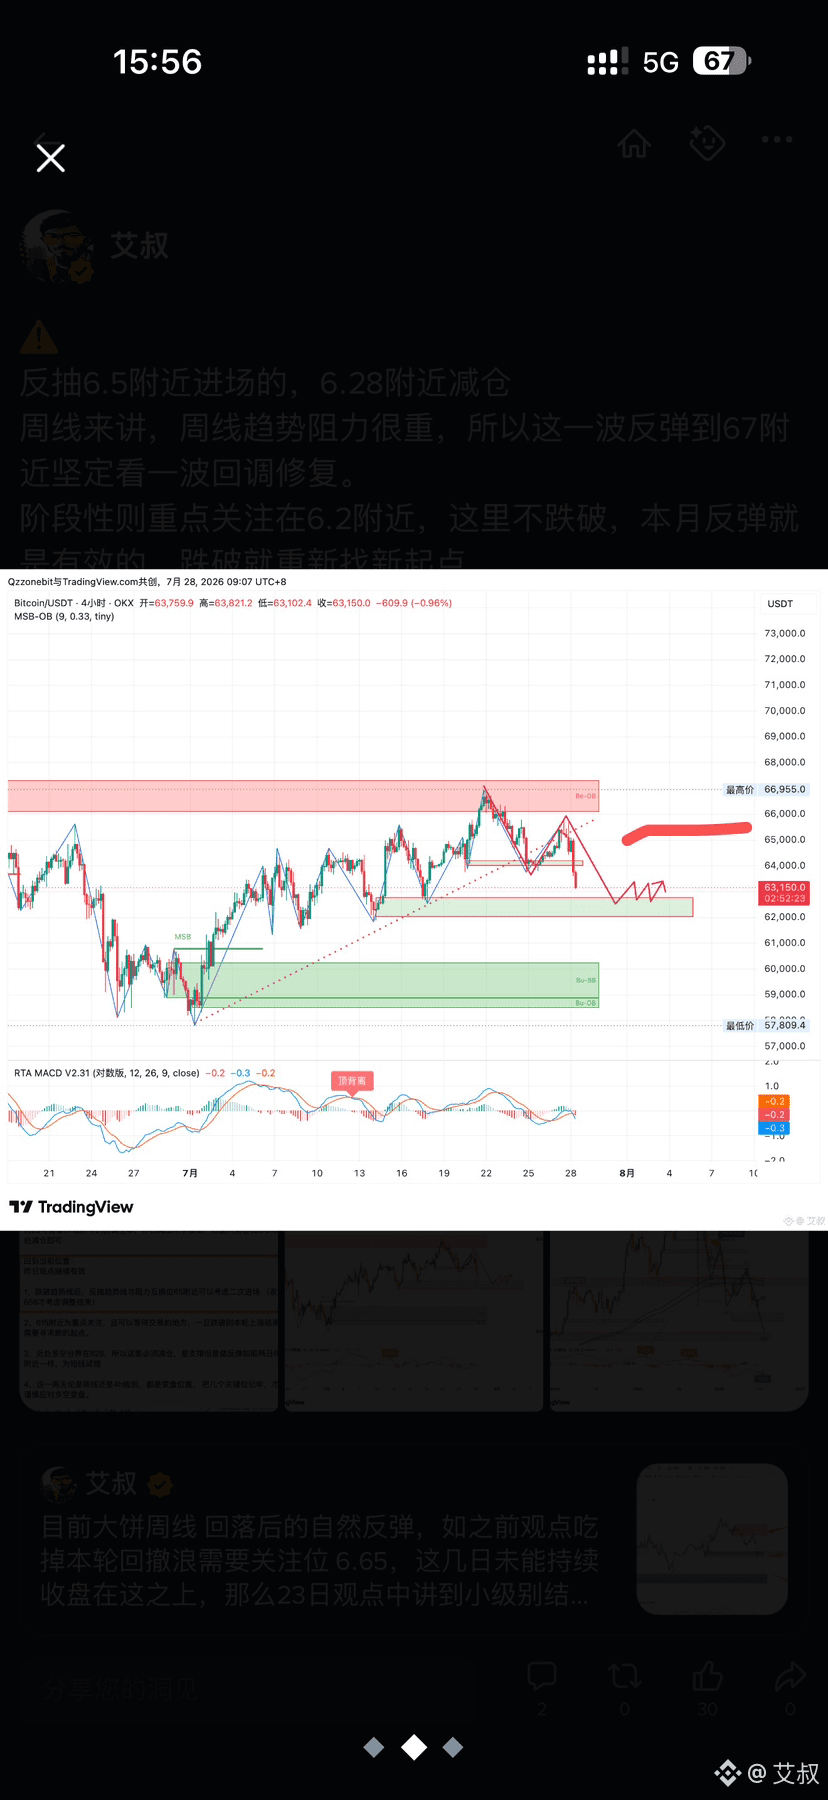
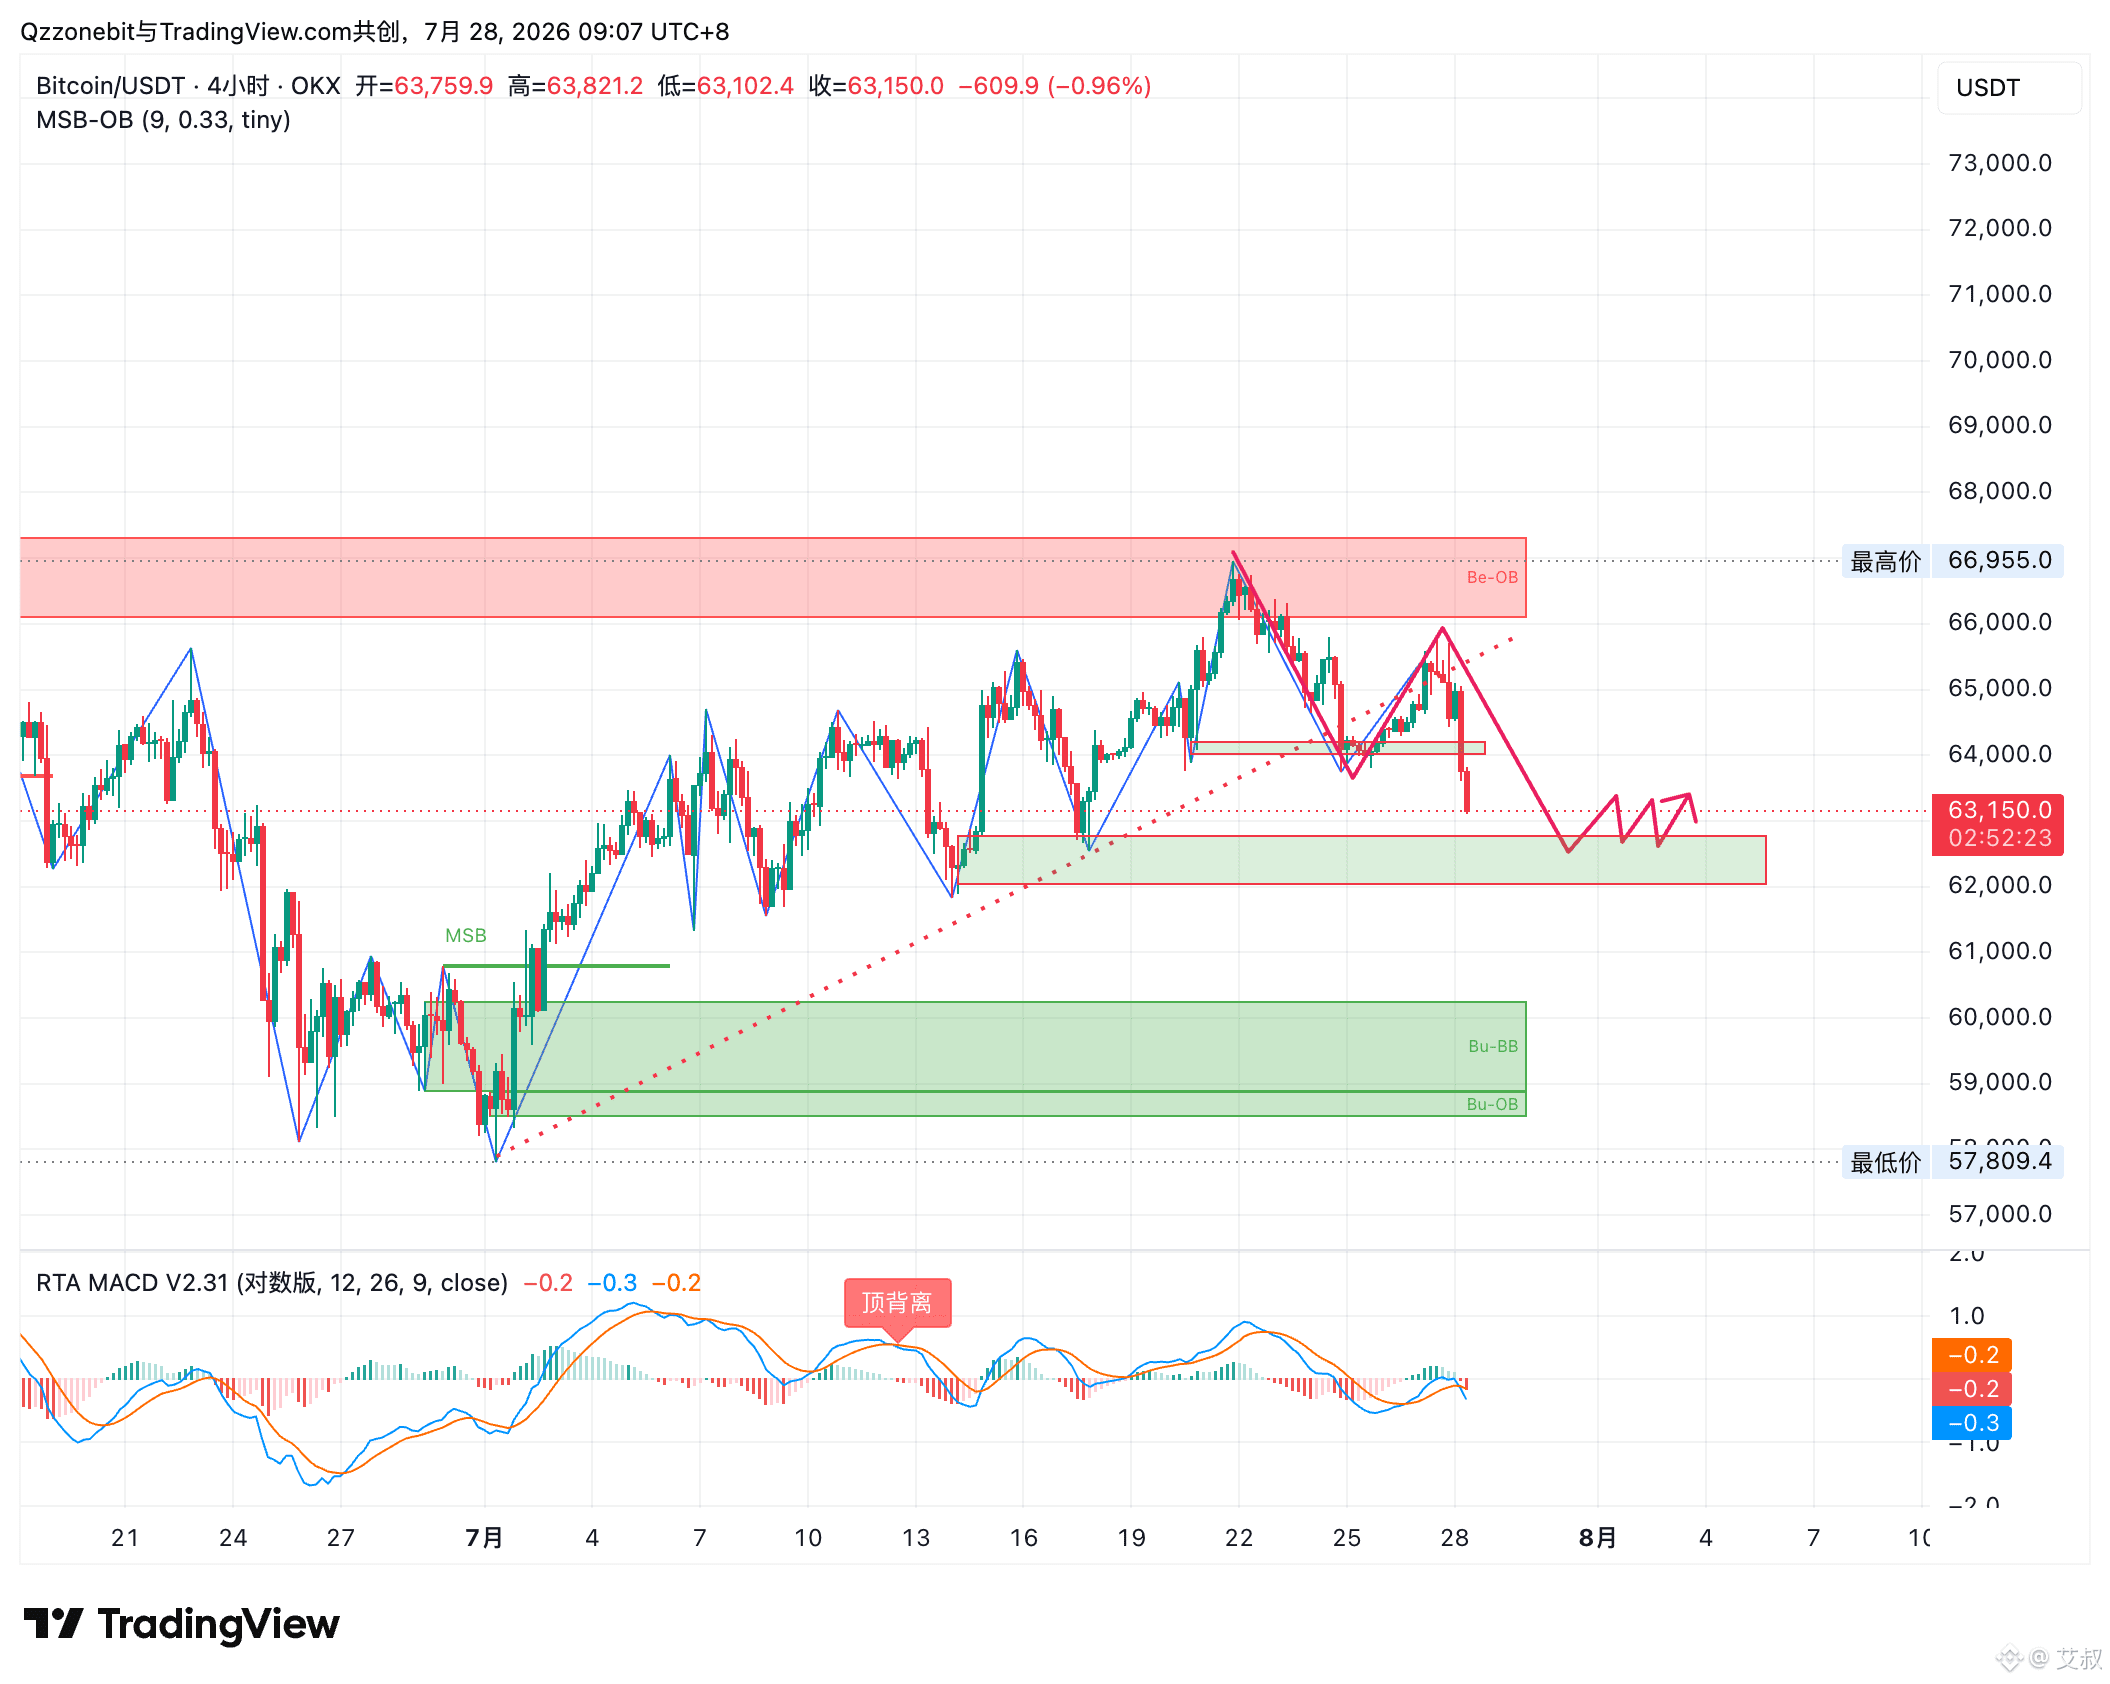
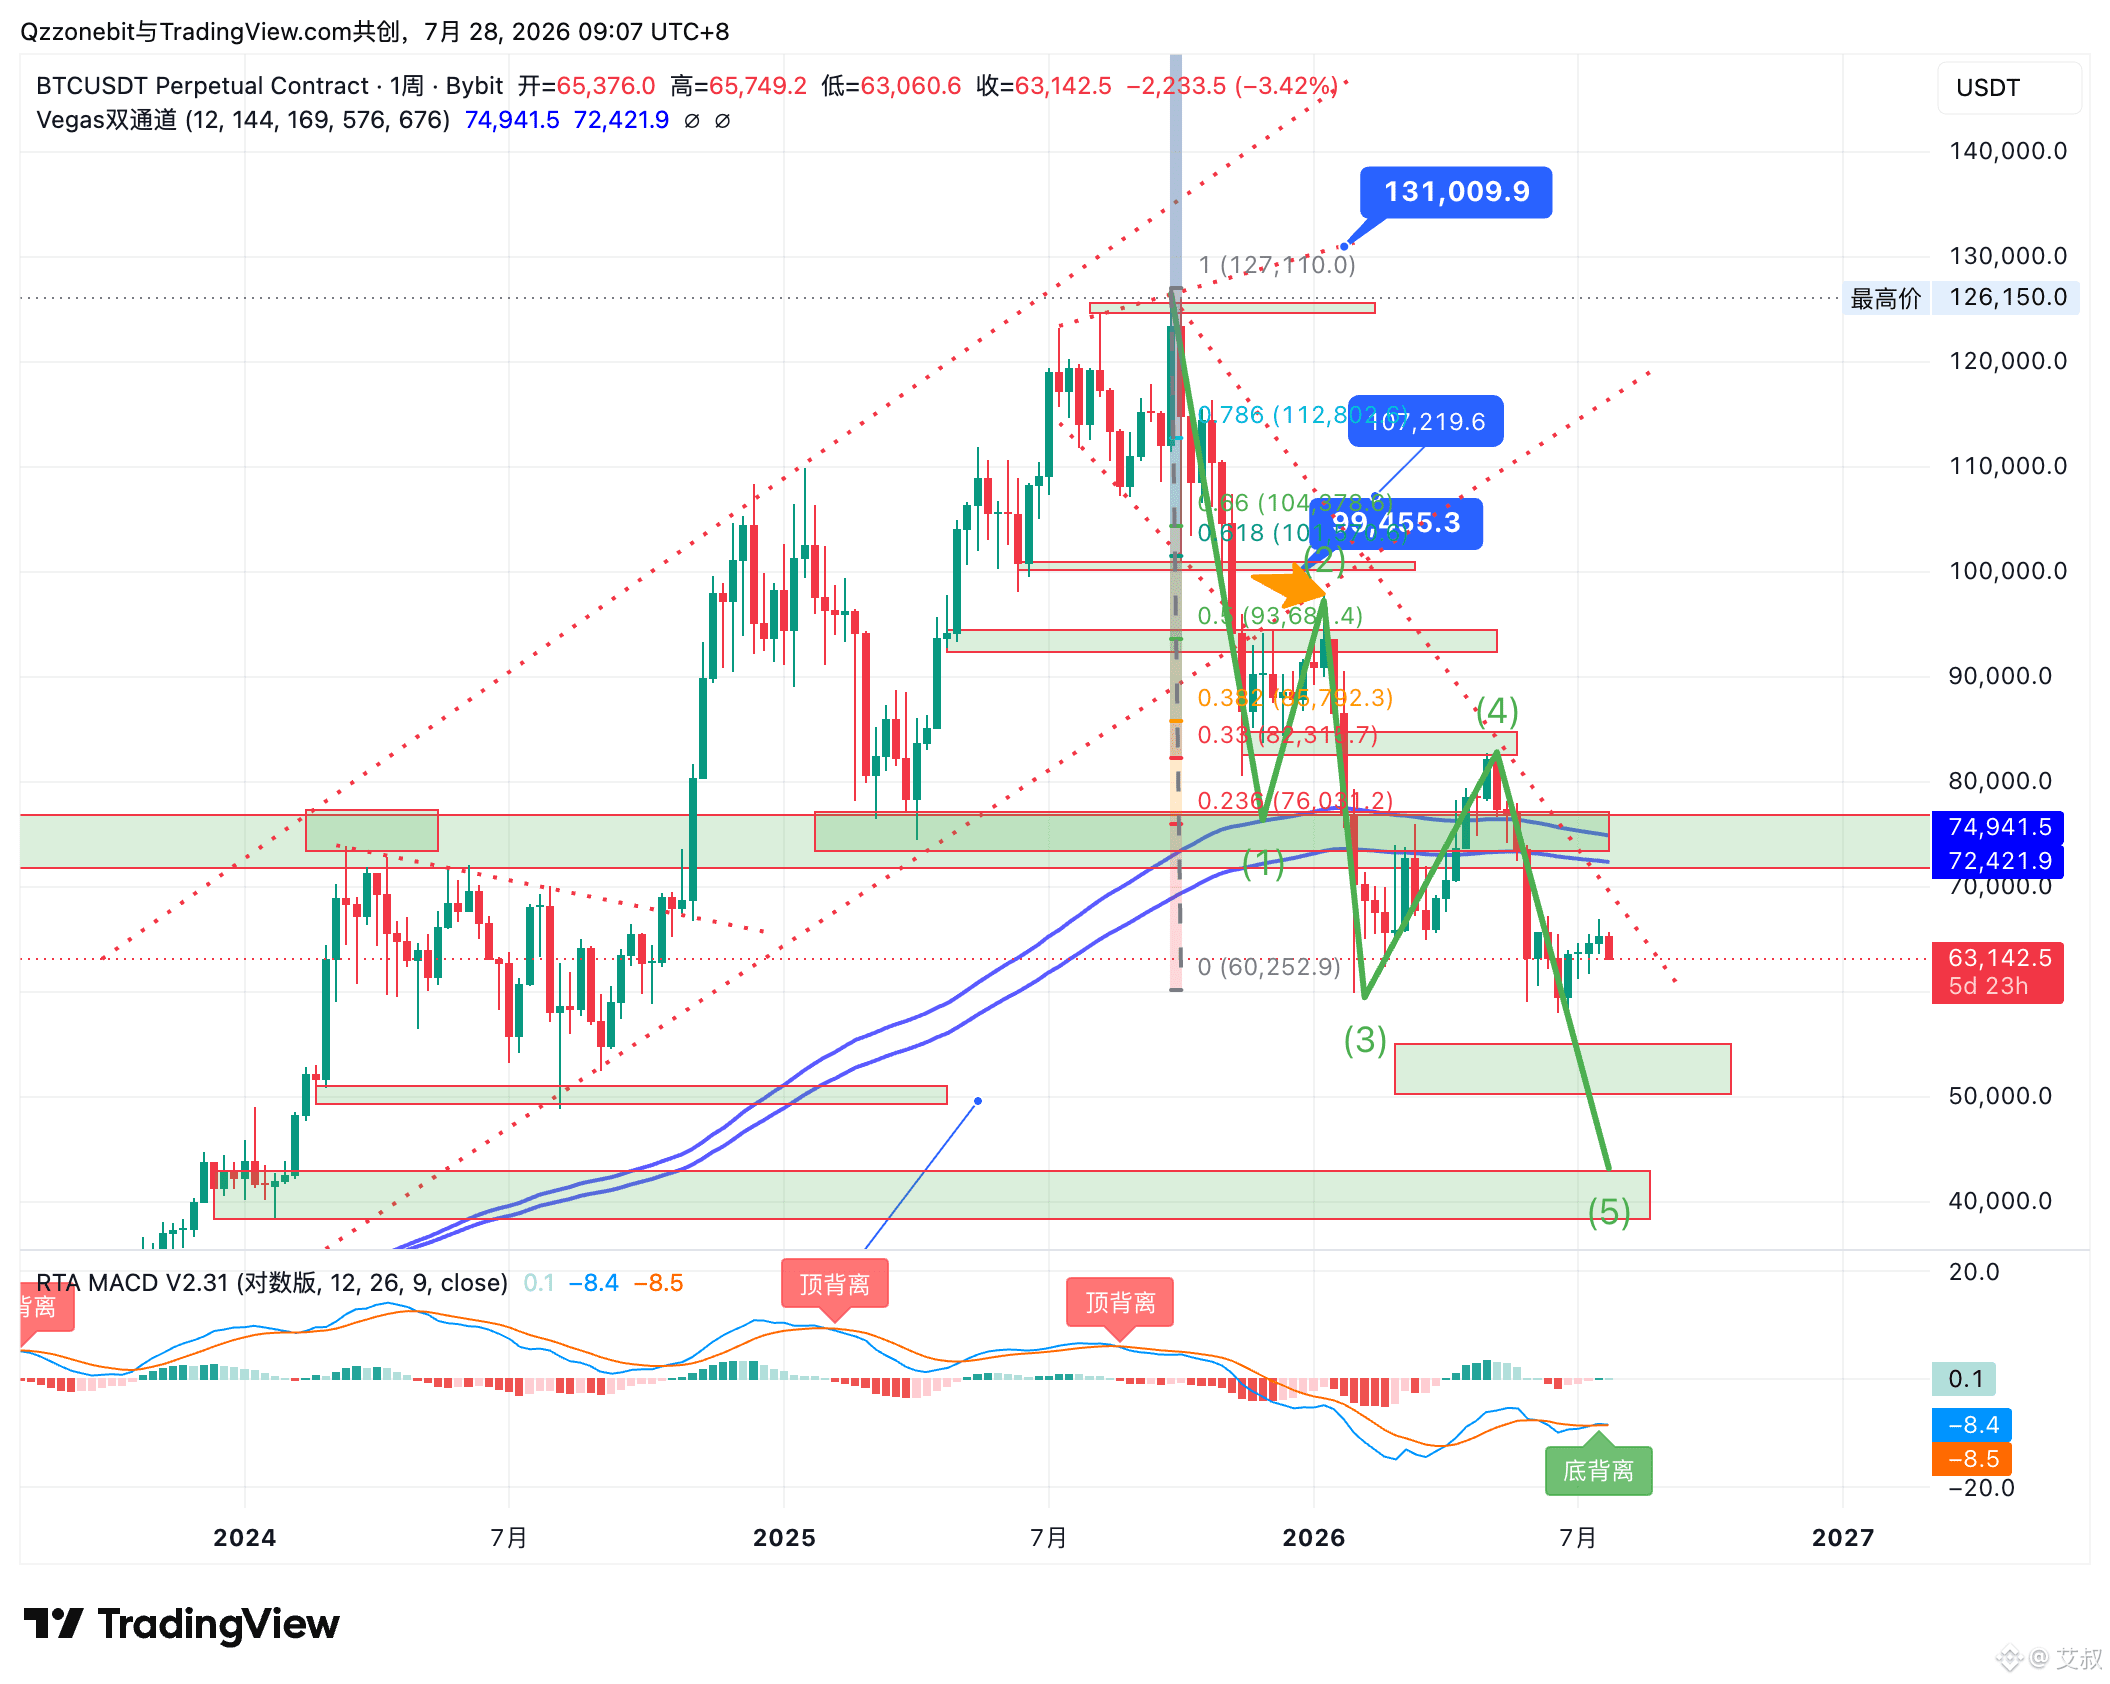
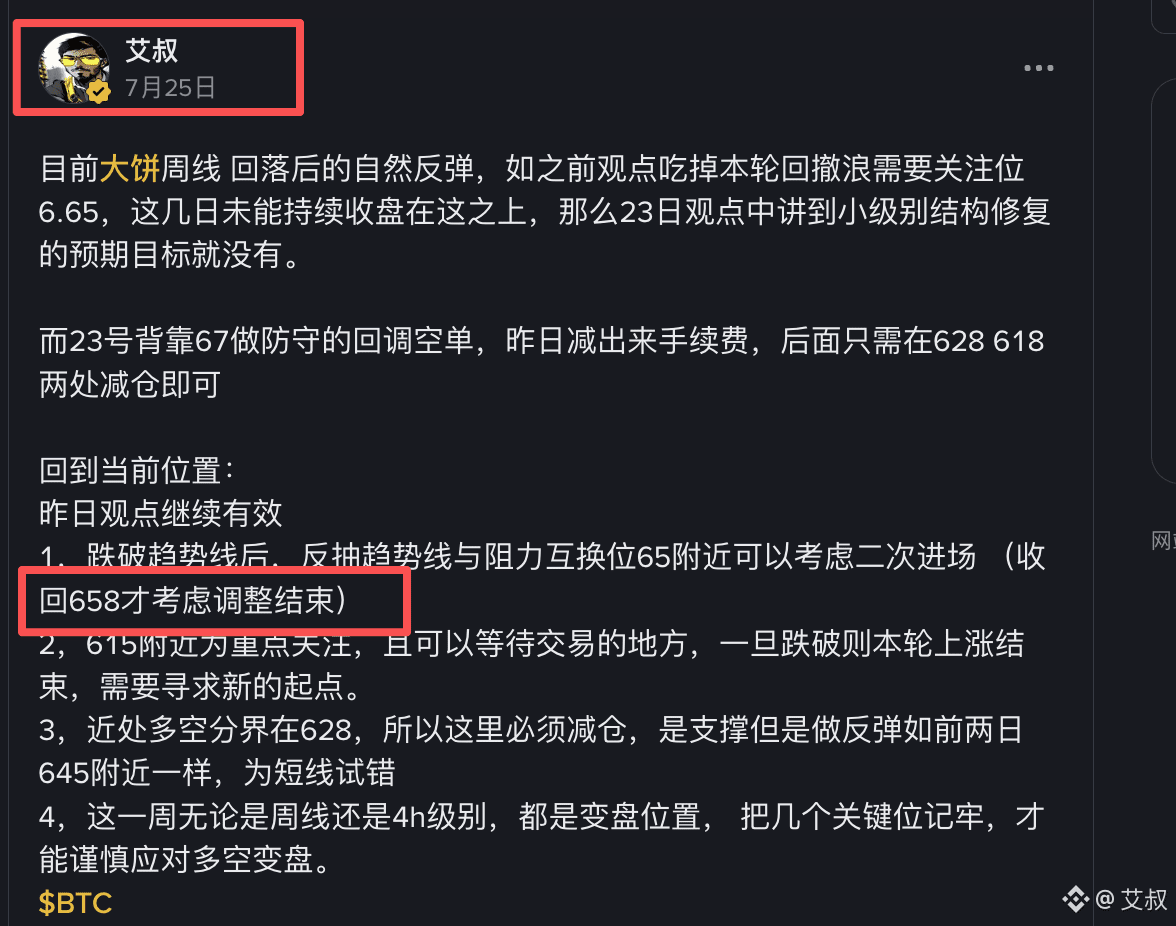
At present, the weekly chart’s big-breadth pullback has been followed by a natural rebound. As previously mentioned, to eat up the decline of this leg, you need to watch the level at 6.65. If, over the past few days, price has not been able to close consistently above it, then the expected target for the repaired small-timeframe structure mentioned in the 23rd’s outlook will not hold.
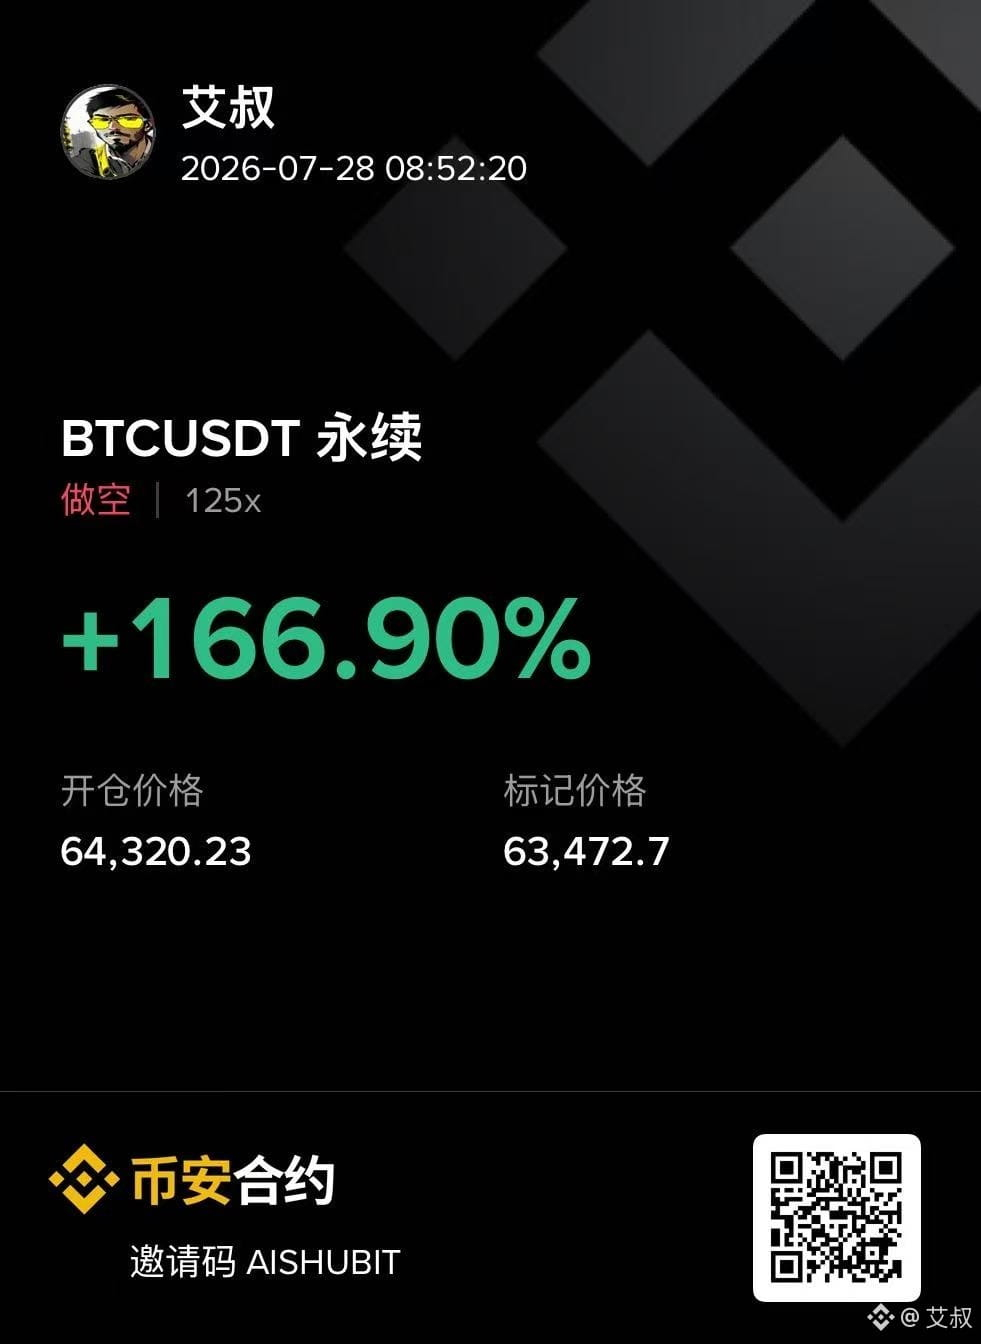
On the 23rd, the pullback short positioned defensively from 67 has already been reduced on the commission yesterday. Going forward, you only need to reduce positions at 628 and 618.
Back to the current location:
Yesterday’s outlook remains valid:
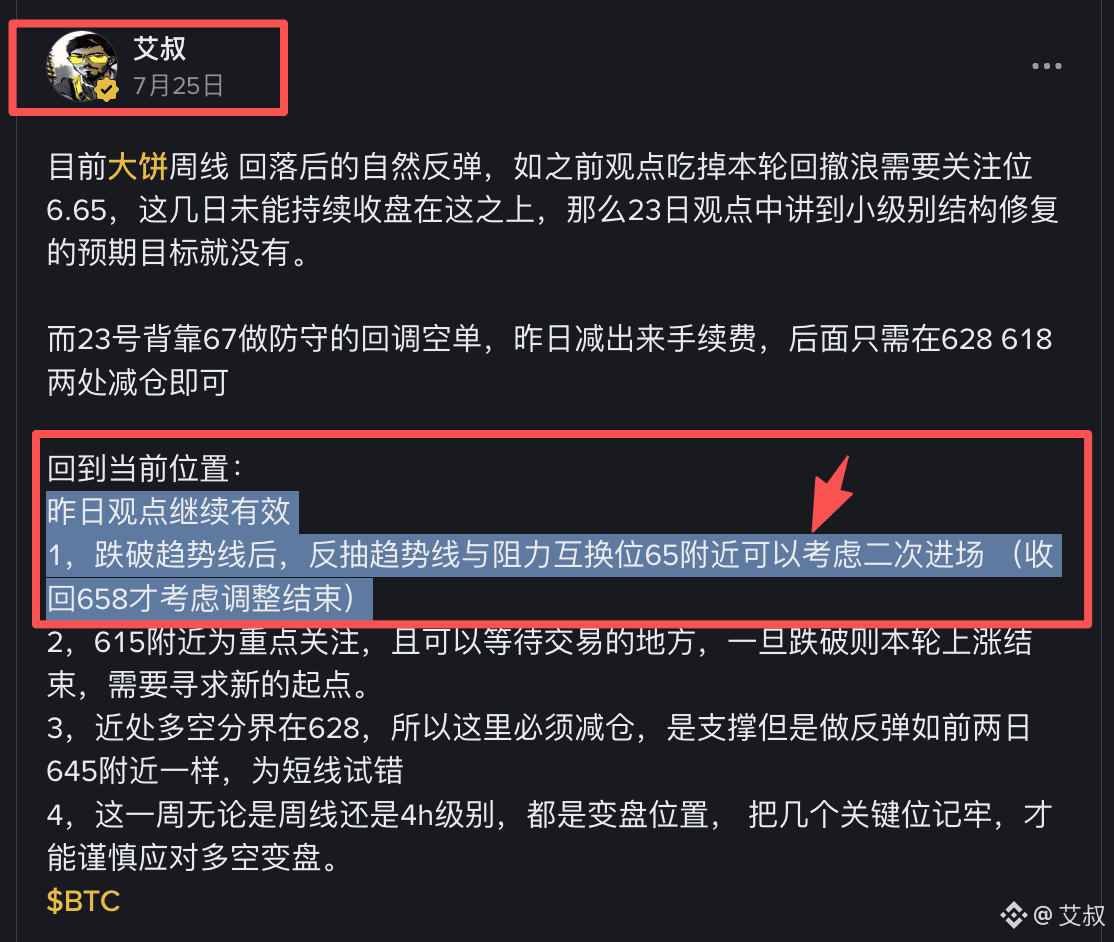
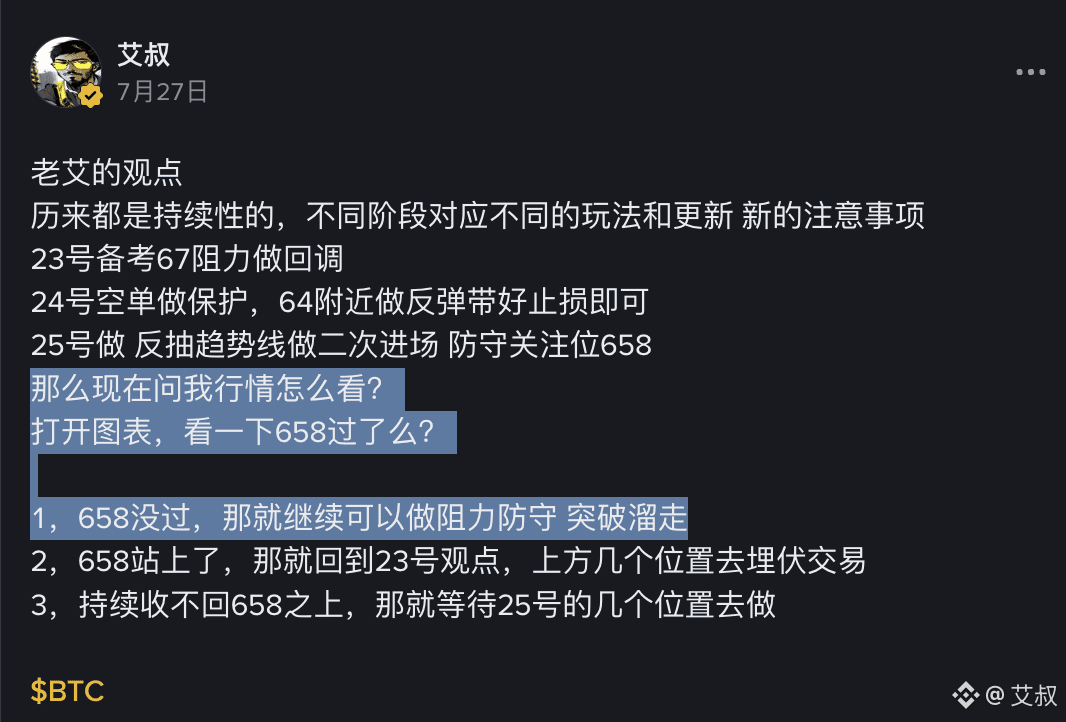
1. After breaking the trendline, consider a second entry when the price re-tests the trendline and the trendline-resistance flip zone around 65 (adjustments are only considered ended once 658 is reclaimed).
2. Around 615 is the key area to watch and also where you can wait for trades. If it breaks, then this round of the upmove ends and you need to look for a new starting point.
3. The near-term long/short boundary is at 628, so positions here must be reduced. Although it is support, for a rebound it’s more like the short-term trial-and-error area—similar to how the previous two days were around 645.
4. This week, whether on the weekly chart or the 4H timeframe, is a turning-point zone. Remember a few key levels so you can respond cautiously to the long/short turn.
$BTC
On the 23rd, the pullback short positioned defensively from 67 has already been reduced on the commission yesterday. Going forward, you only need to reduce positions at 628 and 618.
Back to the current location:
Yesterday’s outlook remains valid:
1. After breaking the trendline, consider a second entry when the price re-tests the trendline and the trendline-resistance flip zone around 65 (adjustments are only considered ended once 658 is reclaimed).
2. Around 615 is the key area to watch and also where you can wait for trades. If it breaks, then this round of the upmove ends and you need to look for a new starting point.
3. The near-term long/short boundary is at 628, so positions here must be reduced. Although it is support, for a rebound it’s more like the short-term trial-and-error area—similar to how the previous two days were around 645.
4. This week, whether on the weekly chart or the 4H timeframe, is a turning-point zone. Remember a few key levels so you can respond cautiously to the long/short turn.
$BTC
艾叔
·
--
At present, the weekly chart’s big-breadth pullback has been followed by a natural rebound. As previously mentioned, to eat up the decline of this leg, you need to watch the level at 6.65. If, over the past few days, price has not been able to close consistently above it, then the expected target for the repaired small-timeframe structure mentioned in the 23rd’s outlook will not hold.
On the 23rd, the pullback short positioned defensively from 67 has already been reduced on the commission yesterday. Going forward, you only need to reduce positions at 628 and 618.
Back to the current location:
Yesterday’s outlook remains valid:
1. After breaking the trendline, consider a second entry when the price re-tests the trendline and the trendline-resistance flip zone around 65 (adjustments are only considered ended once 658 is reclaimed).
2. Around 615 is the key area to watch and also where you can wait for trades. If it breaks, then this round of the upmove ends and you need to look for a new starting point.
3. The near-term long/short boundary is at 628, so positions here must be reduced. Although it is support, for a rebound it’s more like the short-term trial-and-error area—similar to how the previous two days were around 645.
4. This week, whether on the weekly chart or the 4H timeframe, is a turning-point zone. Remember a few key levels so you can respond cautiously to the long/short turn.
$BTC
On the 23rd, the pullback short positioned defensively from 67 has already been reduced on the commission yesterday. Going forward, you only need to reduce positions at 628 and 618.
Back to the current location:
Yesterday’s outlook remains valid:
1. After breaking the trendline, consider a second entry when the price re-tests the trendline and the trendline-resistance flip zone around 65 (adjustments are only considered ended once 658 is reclaimed).
2. Around 615 is the key area to watch and also where you can wait for trades. If it breaks, then this round of the upmove ends and you need to look for a new starting point.
3. The near-term long/short boundary is at 628, so positions here must be reduced. Although it is support, for a rebound it’s more like the short-term trial-and-error area—similar to how the previous two days were around 645.
4. This week, whether on the weekly chart or the 4H timeframe, is a turning-point zone. Remember a few key levels so you can respond cautiously to the long/short turn.
$BTC
艾叔
·
--
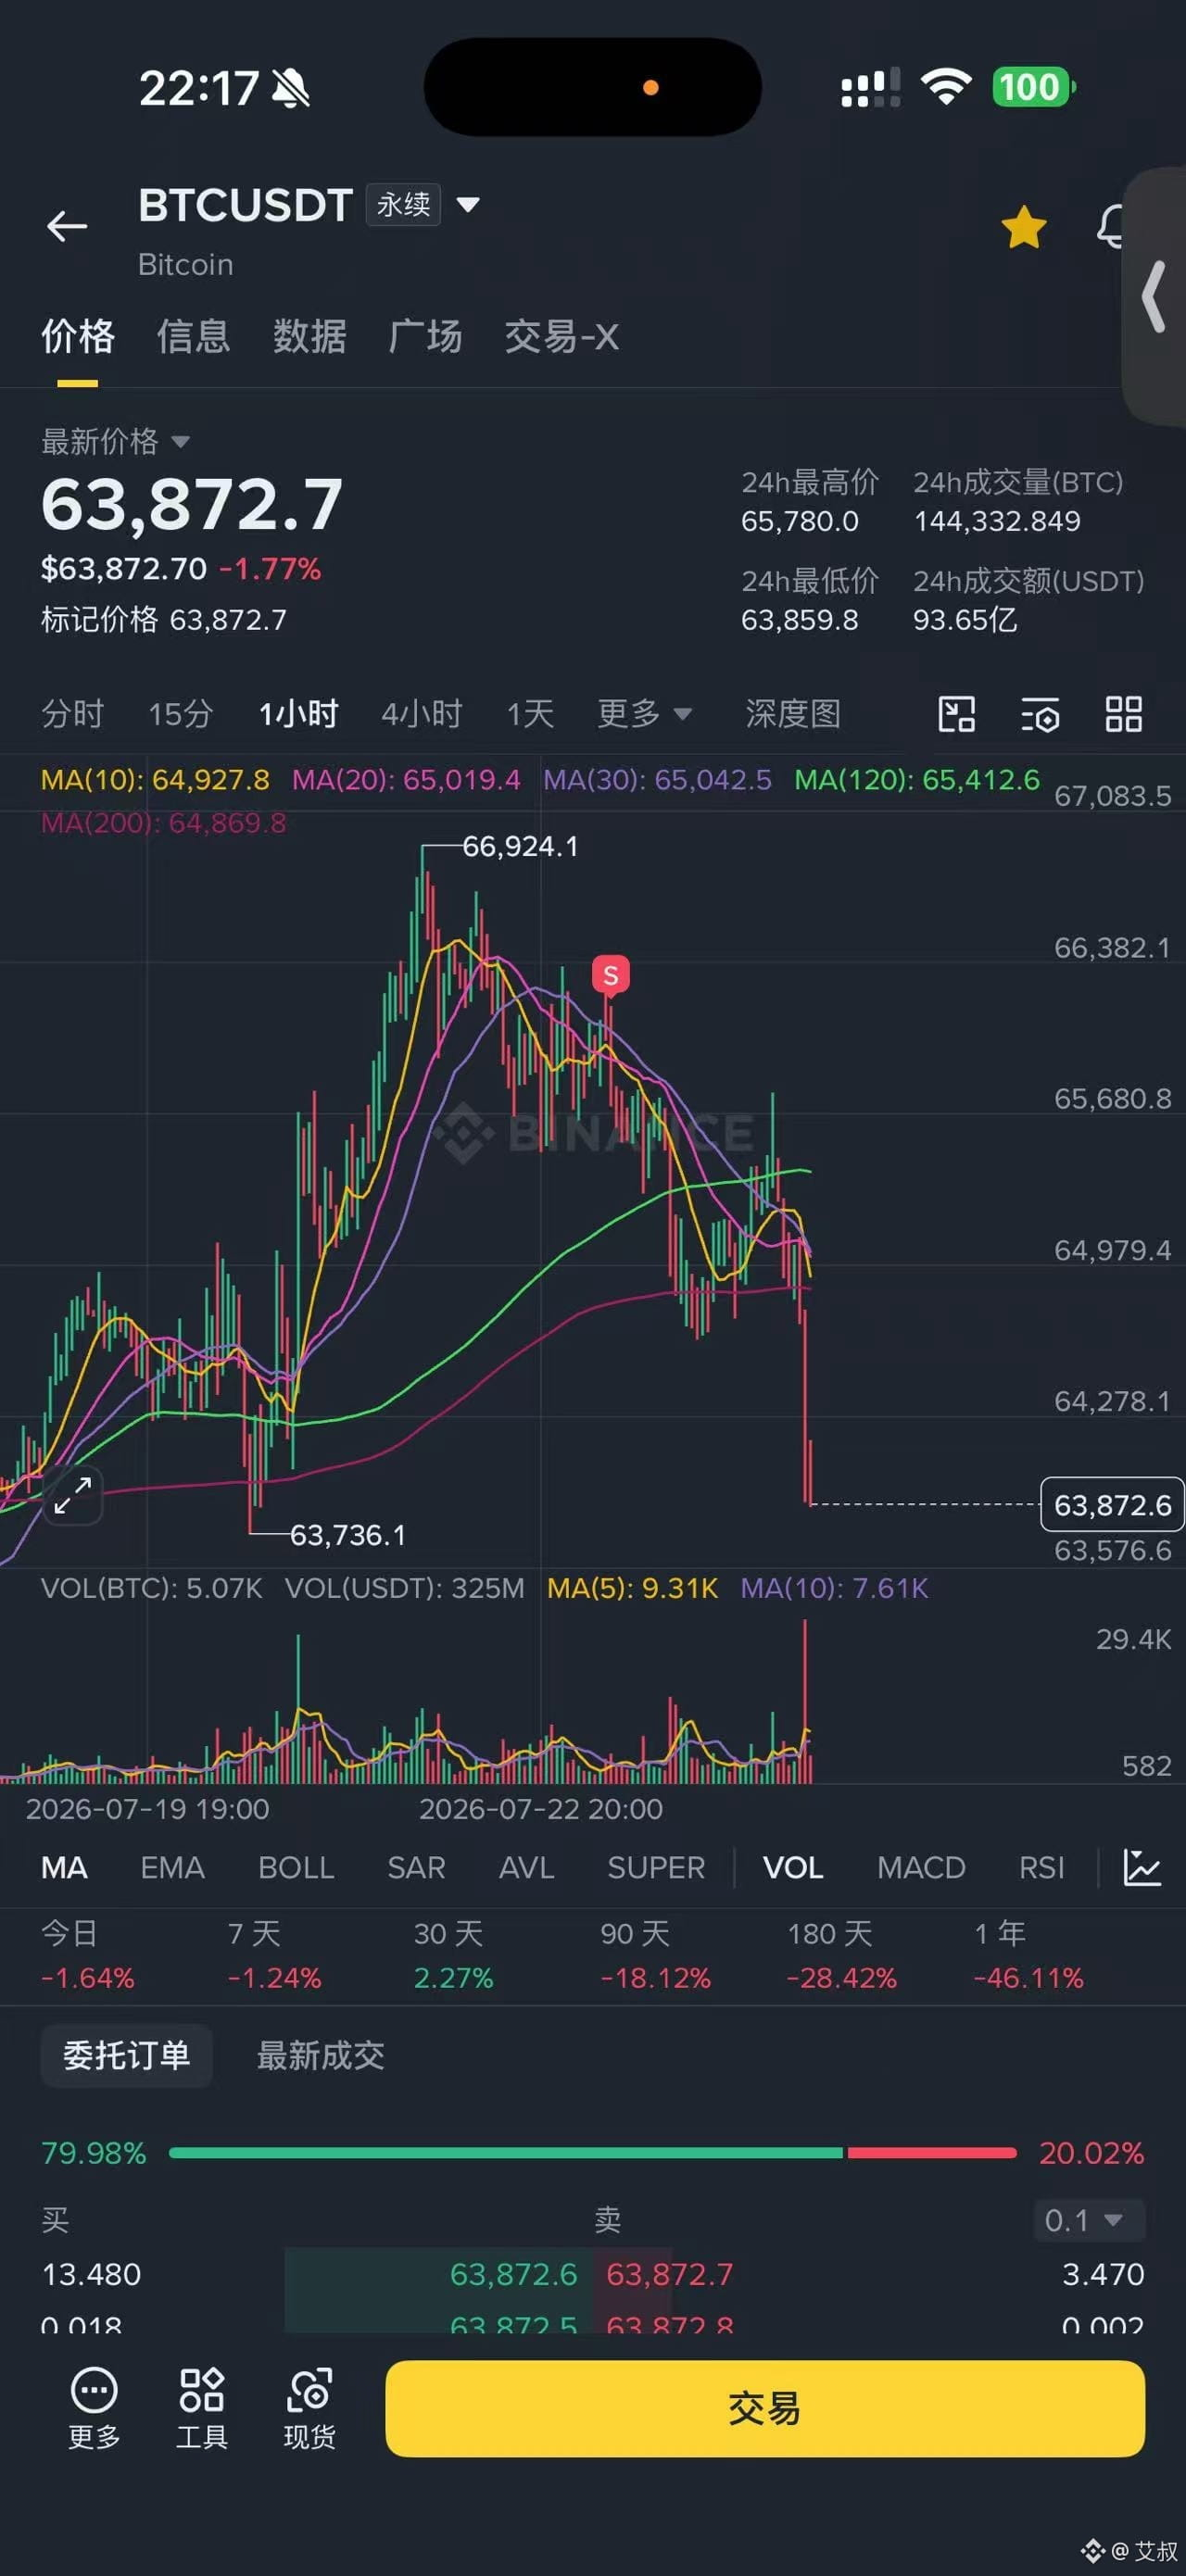
Yesterday, brothers who followed the viewpoint and executed the trading plan—take a look.
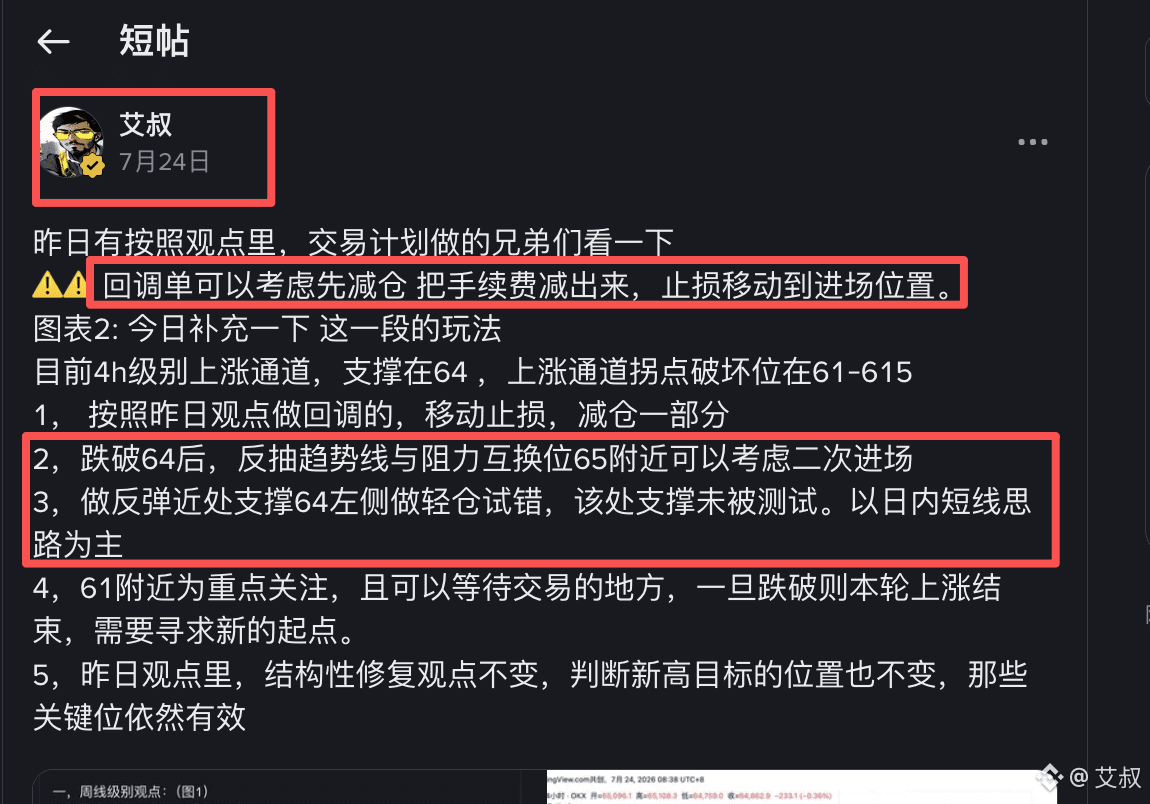
⚠️⚠️ For limit orders during a pullback, you may consider reducing your position first to deduct the trading fees, then move the stop-loss to the entry position.
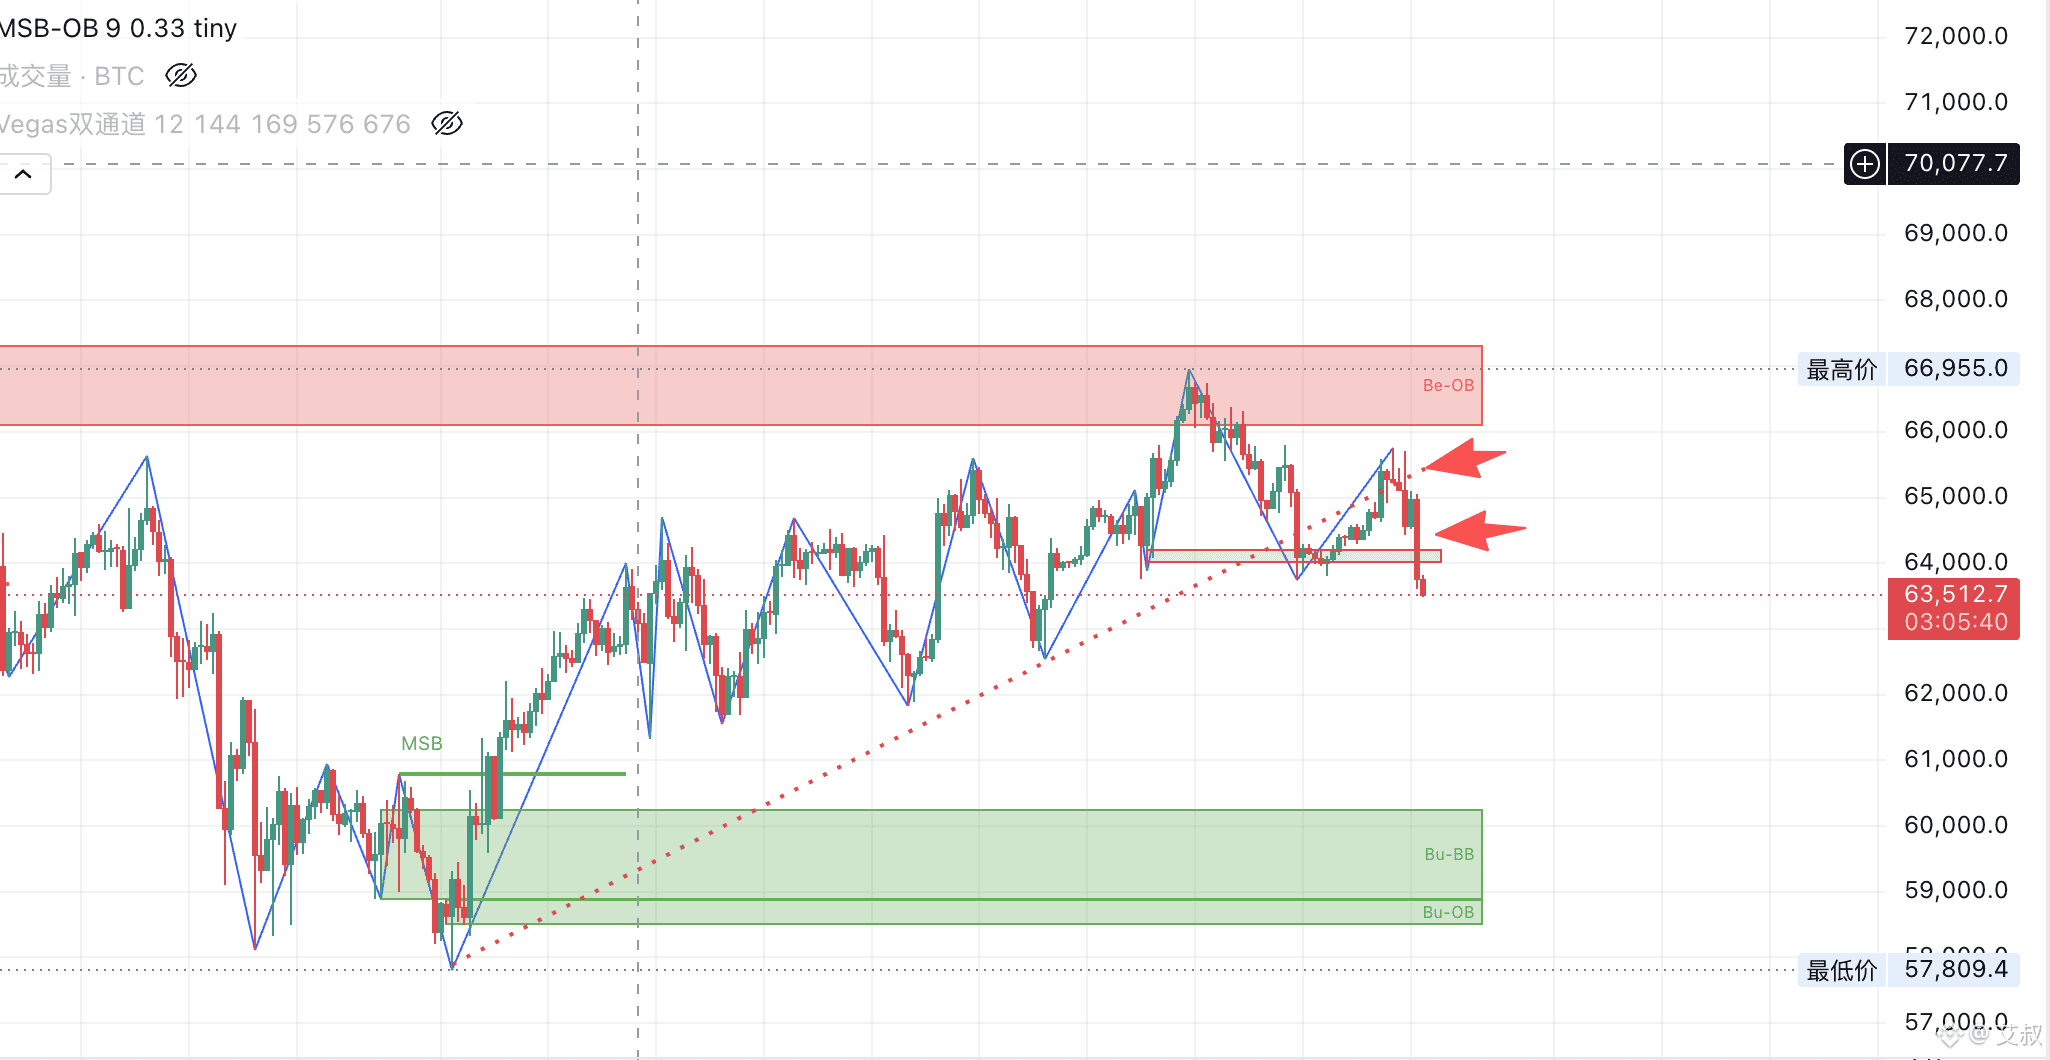
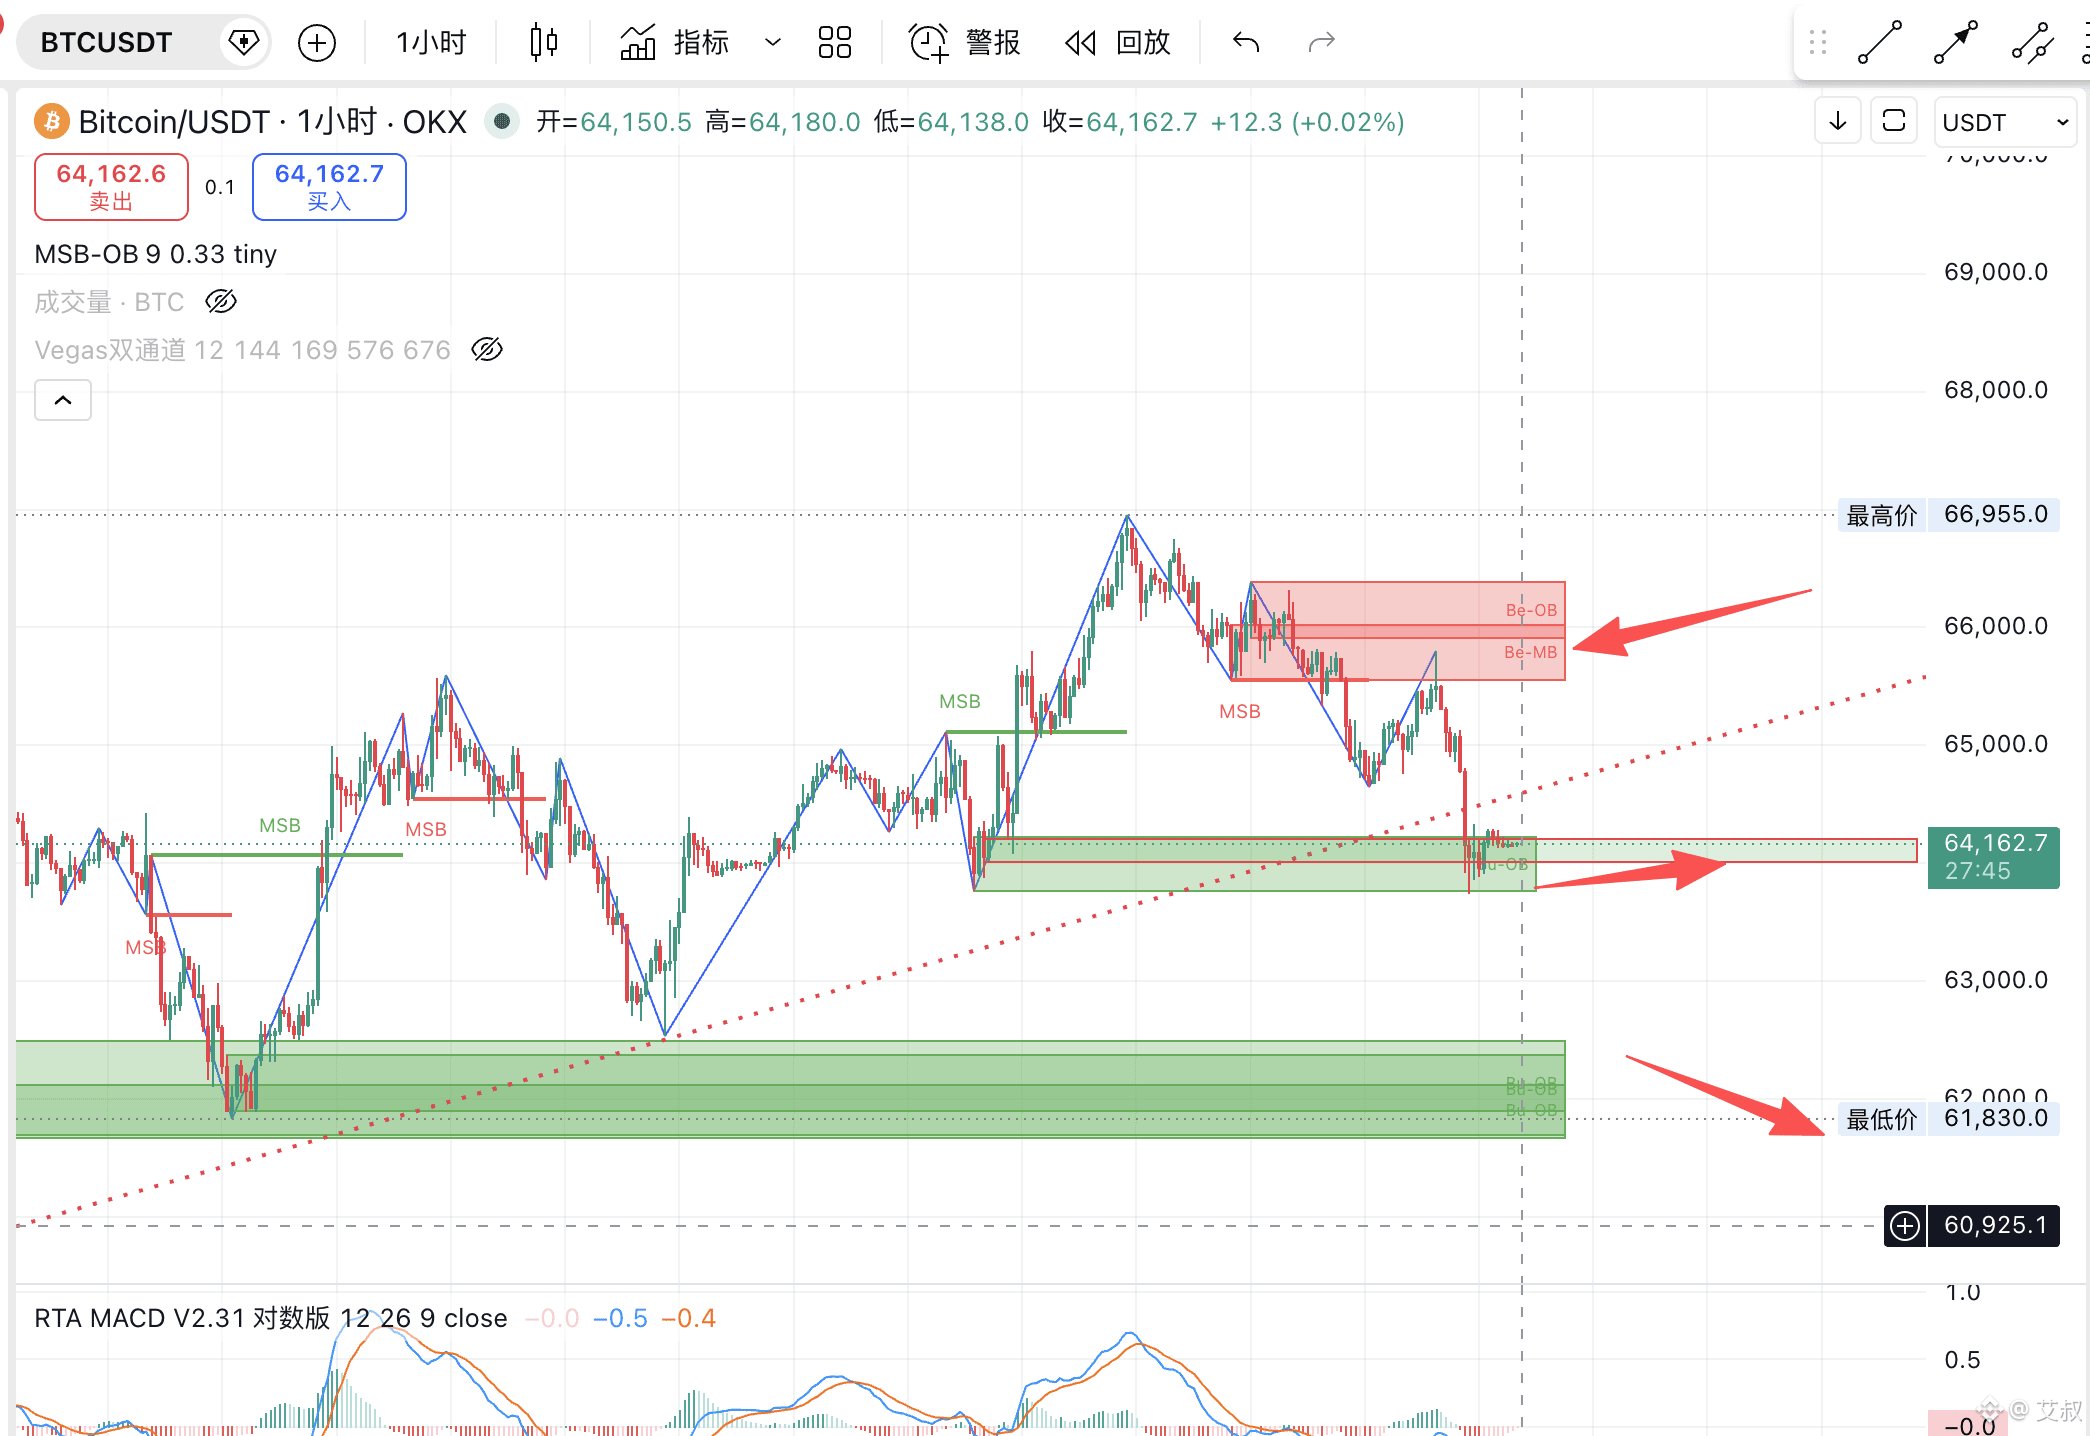
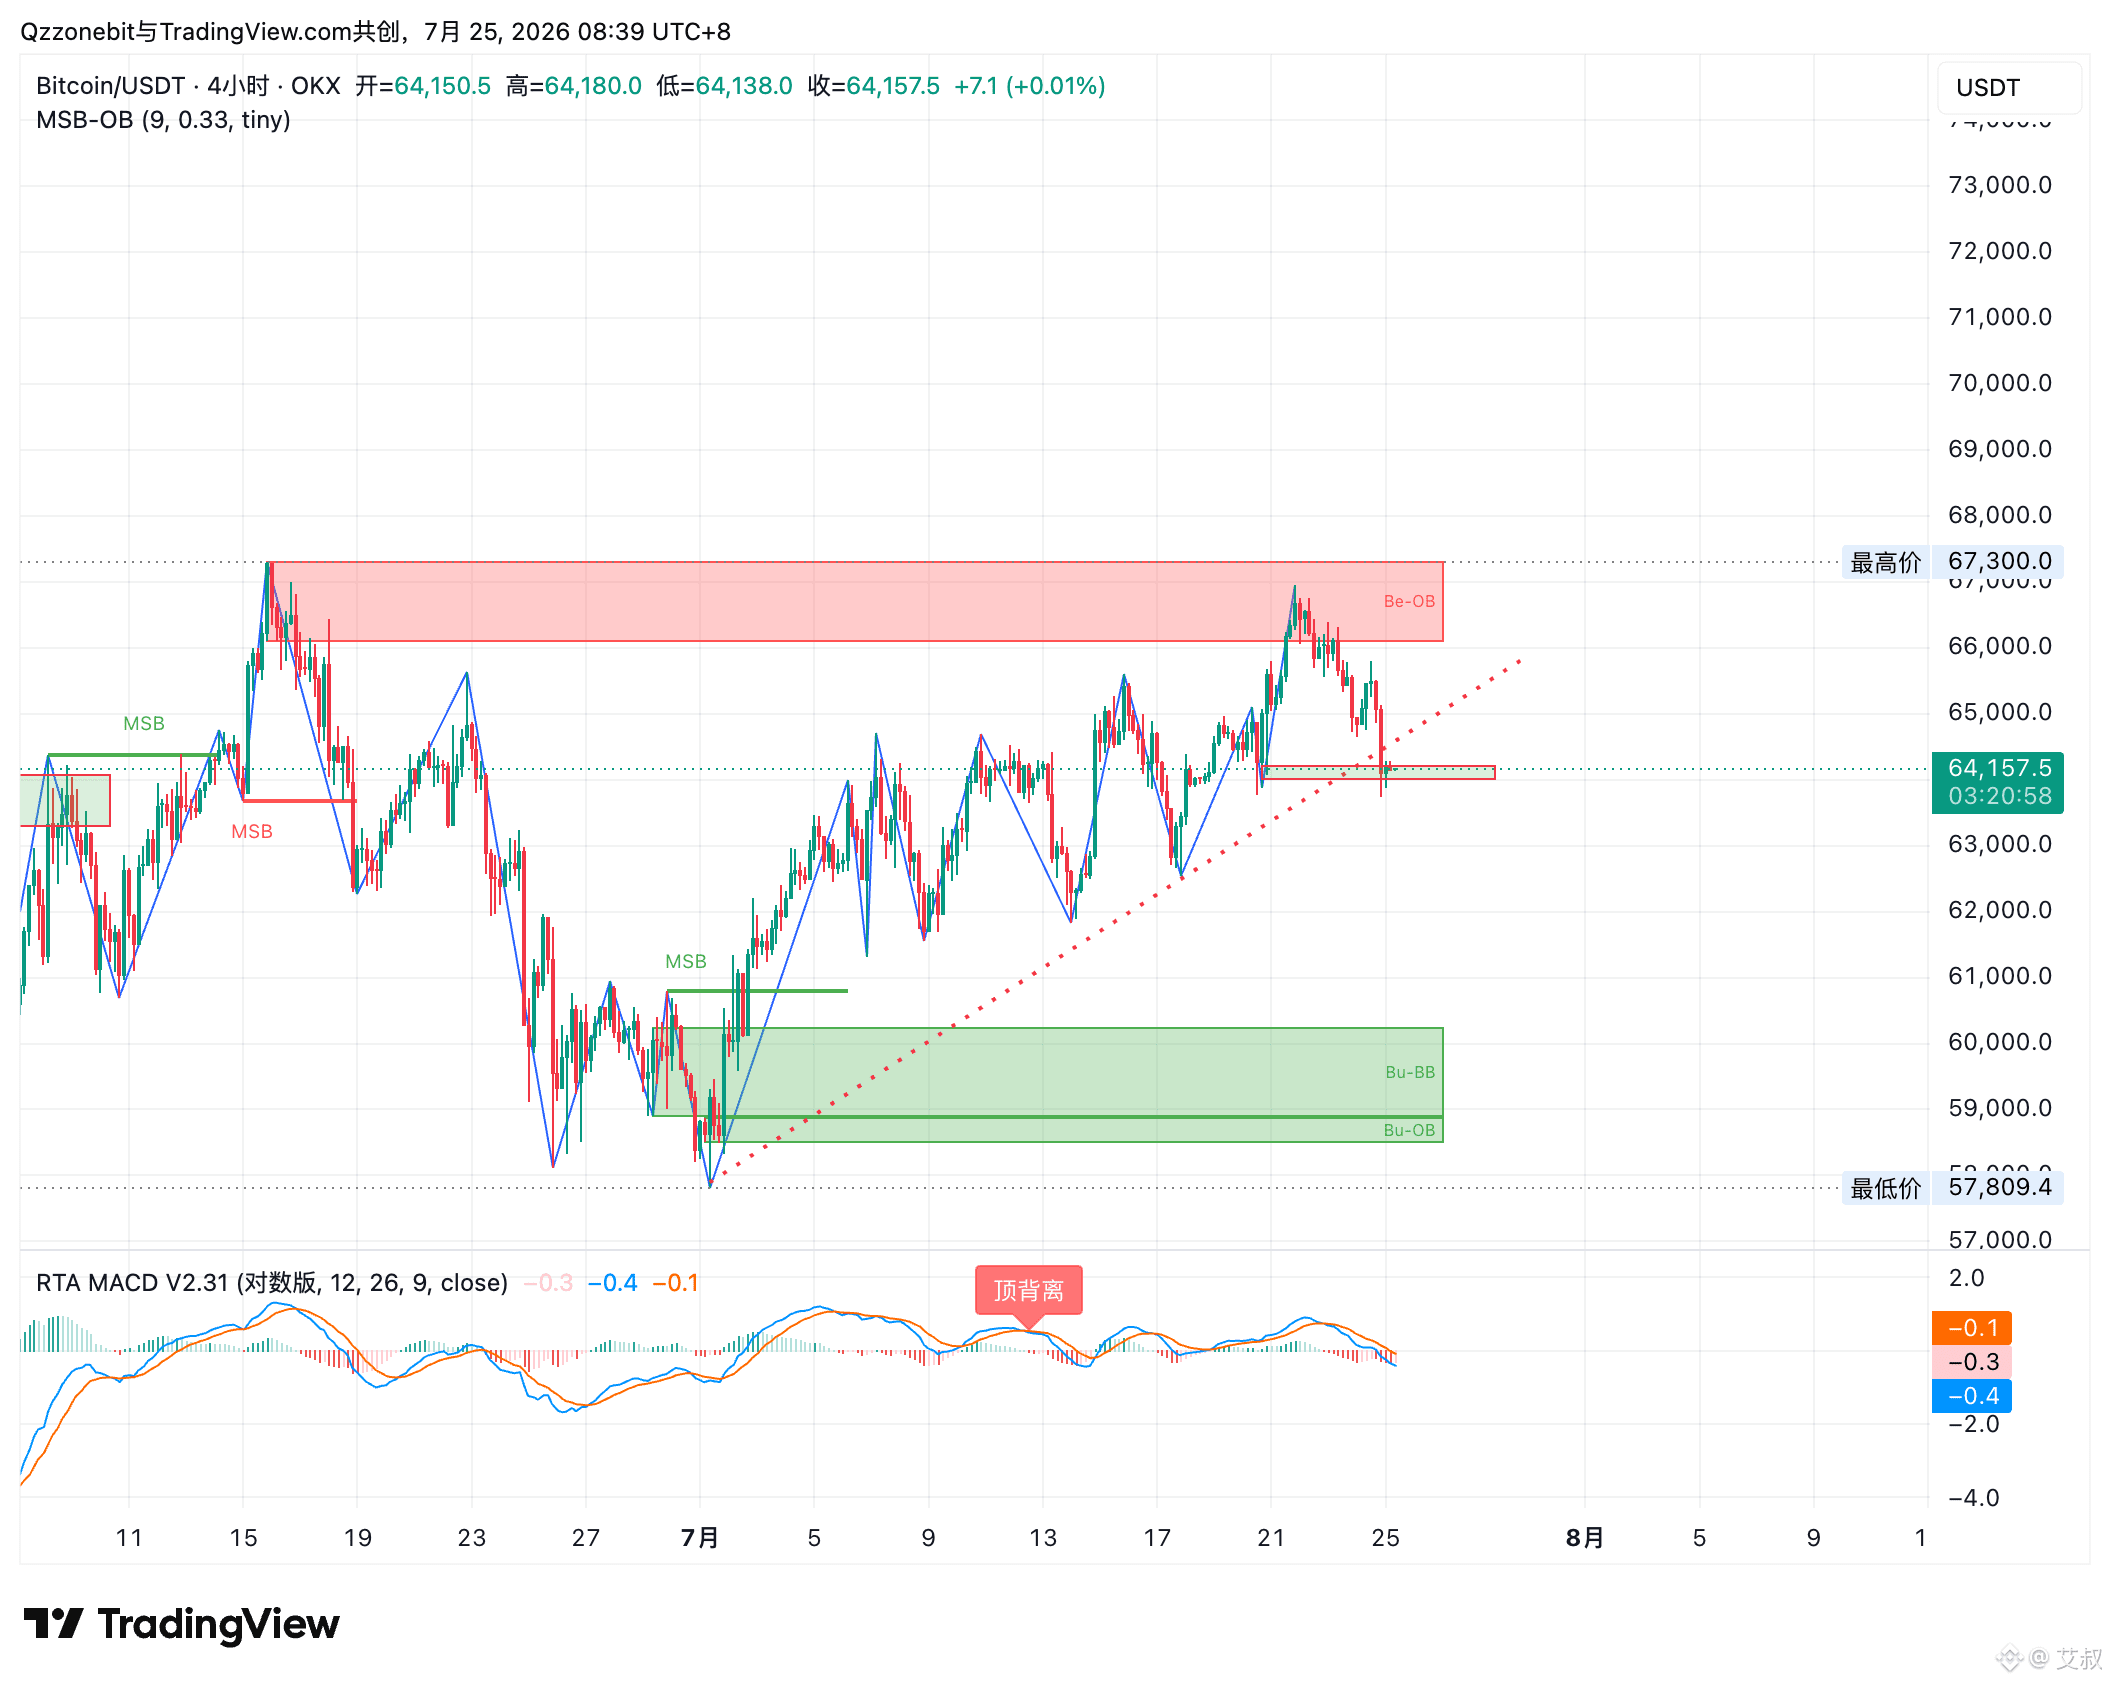
Chart 2: Today, I’ll add more to the play in this section.
Currently, on the 4H timeframe, we have an upward channel. Support is at 64. The point where the upward channel breaks—its breach level—is at 61–61.5.
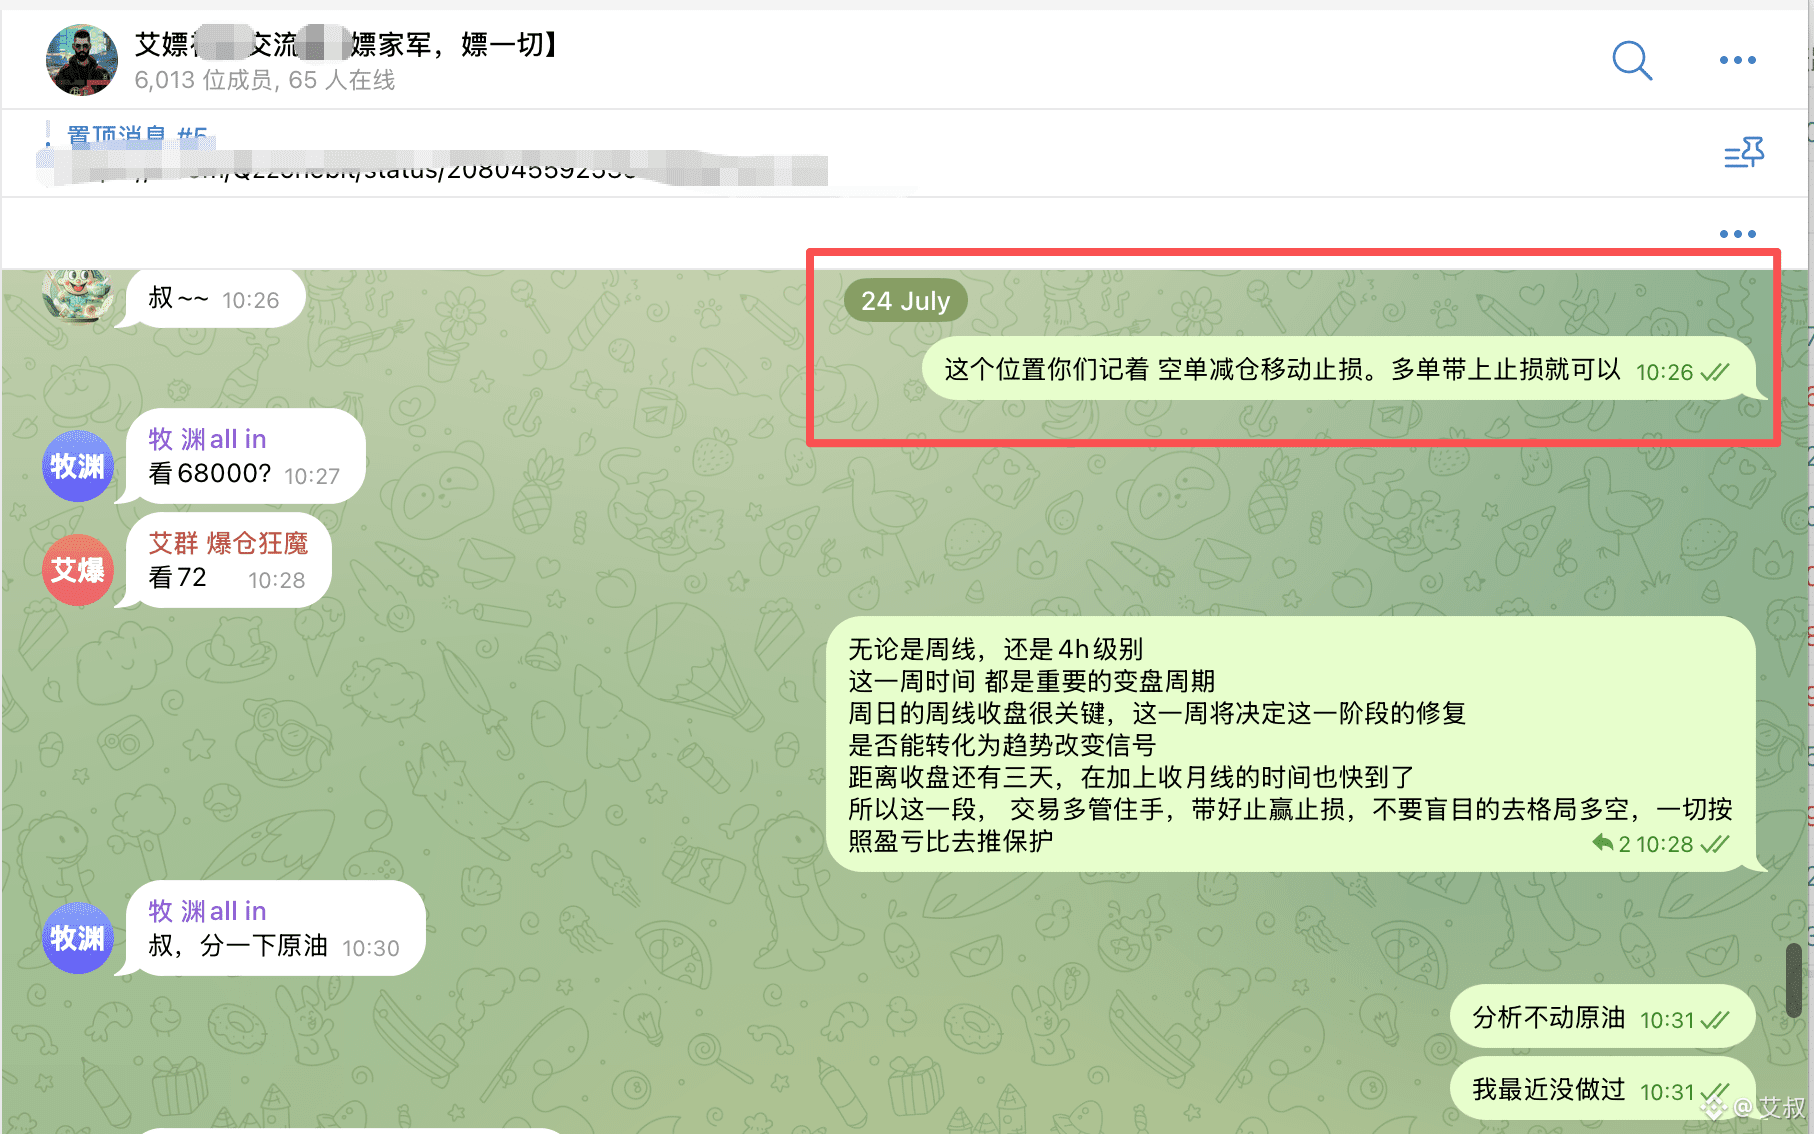
1) If you followed yesterday’s viewpoint and did a pullback entry: move the stop-loss, and reduce part of the position.
2) After a break below 64, when the price retests and the trendline and resistance swap (around 65), you can consider a second entry.
3) For a rebound: use the nearby support on the left side of 64 to open a small test position (light sizing). That support level has not been tested yet. Focus mainly on an intraday short-term trading mindset.
4) Pay close attention to the area around 61, and this is also a place where you can wait for a trade. Once it breaks, this round of the upward move is over, and you’ll need to find a new starting point.
5) In yesterday’s viewpoint: the structural repair outlook remains unchanged, and the target area for making new highs also remains the same. Those key levels are still valid.
⚠️⚠️ For limit orders during a pullback, you may consider reducing your position first to deduct the trading fees, then move the stop-loss to the entry position.
Chart 2: Today, I’ll add more to the play in this section.
Currently, on the 4H timeframe, we have an upward channel. Support is at 64. The point where the upward channel breaks—its breach level—is at 61–61.5.
1) If you followed yesterday’s viewpoint and did a pullback entry: move the stop-loss, and reduce part of the position.
2) After a break below 64, when the price retests and the trendline and resistance swap (around 65), you can consider a second entry.
3) For a rebound: use the nearby support on the left side of 64 to open a small test position (light sizing). That support level has not been tested yet. Focus mainly on an intraday short-term trading mindset.
4) Pay close attention to the area around 61, and this is also a place where you can wait for a trade. Once it breaks, this round of the upward move is over, and you’ll need to find a new starting point.
5) In yesterday’s viewpoint: the structural repair outlook remains unchanged, and the target area for making new highs also remains the same. Those key levels are still valid.
艾叔
·
--
Yesterday, brothers who followed the viewpoint and executed the trading plan—take a look.
⚠️⚠️ For limit orders during a pullback, you may consider reducing your position first to deduct the trading fees, then move the stop-loss to the entry position.
Chart 2: Today, I’ll add more to the play in this section.
Currently, on the 4H timeframe, we have an upward channel. Support is at 64. The point where the upward channel breaks—its breach level—is at 61–61.5.
1) If you followed yesterday’s viewpoint and did a pullback entry: move the stop-loss, and reduce part of the position.
2) After a break below 64, when the price retests and the trendline and resistance swap (around 65), you can consider a second entry.
3) For a rebound: use the nearby support on the left side of 64 to open a small test position (light sizing). That support level has not been tested yet. Focus mainly on an intraday short-term trading mindset.
4) Pay close attention to the area around 61, and this is also a place where you can wait for a trade. Once it breaks, this round of the upward move is over, and you’ll need to find a new starting point.
5) In yesterday’s viewpoint: the structural repair outlook remains unchanged, and the target area for making new highs also remains the same. Those key levels are still valid.
⚠️⚠️ For limit orders during a pullback, you may consider reducing your position first to deduct the trading fees, then move the stop-loss to the entry position.
Chart 2: Today, I’ll add more to the play in this section.
Currently, on the 4H timeframe, we have an upward channel. Support is at 64. The point where the upward channel breaks—its breach level—is at 61–61.5.
1) If you followed yesterday’s viewpoint and did a pullback entry: move the stop-loss, and reduce part of the position.
2) After a break below 64, when the price retests and the trendline and resistance swap (around 65), you can consider a second entry.
3) For a rebound: use the nearby support on the left side of 64 to open a small test position (light sizing). That support level has not been tested yet. Focus mainly on an intraday short-term trading mindset.
4) Pay close attention to the area around 61, and this is also a place where you can wait for a trade. Once it breaks, this round of the upward move is over, and you’ll need to find a new starting point.
5) In yesterday’s viewpoint: the structural repair outlook remains unchanged, and the target area for making new highs also remains the same. Those key levels are still valid.
艾叔
·
--
Come on, brothers.
Lao Ai hasn’t really been doing much lately. He just feels the market isn’t moving much. He went through a cycle of bull and bear and gave himself some time off—taking a break for a while.
Back to the market: same old routine—first find the key levels, then talk about the trading plan.
I. Weekly-level perspective: (Figure 1)
The big BTC is still in a natural rebound after the pullback.
1. The end-of-wave termination level is 4. If it’s above 82, that’s also the level where these past couple of months’ pullbacks ended—only then can the overall market structure change.
2. Structural repair: eat up this current pullback wave 4’s focus level at 6.65. If during these days price keeps closing above it, then on a smaller timeframe you can consider that the structural repair is already underway. The targets are 705–725.
II. 4H timeframe: (Figure 2)
1. Let’s recap the key levels that got broken in this pullback: 82 was used as resistance, 78 was the level that broke down and then provided a second entry, the reversal level is 705, and it broke below the inflection point at 665.
So on this timeframe, the heavy overhead resistance areas appear.
2. Upswing starting points: 615 and 645. (For short-term context: once it falls back and breaks below 65, this current upswing starts turning into a correction; if it breaks below 615, then the upswing is over.)
Resistance: 665 705 725 78
Support: 645 615
Trading plan:
For the short term, use 67 as the defensive resistance. If 65 breaks, the pullback zone becomes larger—then you do it; otherwise, use it as a short-term test order. After support is broken, the best is to do it on the right-side.
For a rebound, place orders by laying them at the two upswing start positions.
For cycle positions—especially a few inflection points—old saying: position trades. Easy profits.
$BTC
Lao Ai hasn’t really been doing much lately. He just feels the market isn’t moving much. He went through a cycle of bull and bear and gave himself some time off—taking a break for a while.
Back to the market: same old routine—first find the key levels, then talk about the trading plan.
I. Weekly-level perspective: (Figure 1)
The big BTC is still in a natural rebound after the pullback.
1. The end-of-wave termination level is 4. If it’s above 82, that’s also the level where these past couple of months’ pullbacks ended—only then can the overall market structure change.
2. Structural repair: eat up this current pullback wave 4’s focus level at 6.65. If during these days price keeps closing above it, then on a smaller timeframe you can consider that the structural repair is already underway. The targets are 705–725.
II. 4H timeframe: (Figure 2)
1. Let’s recap the key levels that got broken in this pullback: 82 was used as resistance, 78 was the level that broke down and then provided a second entry, the reversal level is 705, and it broke below the inflection point at 665.
So on this timeframe, the heavy overhead resistance areas appear.
2. Upswing starting points: 615 and 645. (For short-term context: once it falls back and breaks below 65, this current upswing starts turning into a correction; if it breaks below 615, then the upswing is over.)
Resistance: 665 705 725 78
Support: 645 615
Trading plan:
For the short term, use 67 as the defensive resistance. If 65 breaks, the pullback zone becomes larger—then you do it; otherwise, use it as a short-term test order. After support is broken, the best is to do it on the right-side.
For a rebound, place orders by laying them at the two upswing start positions.
For cycle positions—especially a few inflection points—old saying: position trades. Easy profits.
$BTC
艾叔
·
--
Come on, brothers.
Lao Ai hasn’t really been doing much lately. He just feels the market isn’t moving much. He went through a cycle of bull and bear and gave himself some time off—taking a break for a while.
Back to the market: same old routine—first find the key levels, then talk about the trading plan.
I. Weekly-level perspective: (Figure 1)
The big BTC is still in a natural rebound after the pullback.
1. The end-of-wave termination level is 4. If it’s above 82, that’s also the level where these past couple of months’ pullbacks ended—only then can the overall market structure change.
2. Structural repair: eat up this current pullback wave 4’s focus level at 6.65. If during these days price keeps closing above it, then on a smaller timeframe you can consider that the structural repair is already underway. The targets are 705–725.
II. 4H timeframe: (Figure 2)
1. Let’s recap the key levels that got broken in this pullback: 82 was used as resistance, 78 was the level that broke down and then provided a second entry, the reversal level is 705, and it broke below the inflection point at 665.
So on this timeframe, the heavy overhead resistance areas appear.
2. Upswing starting points: 615 and 645. (For short-term context: once it falls back and breaks below 65, this current upswing starts turning into a correction; if it breaks below 615, then the upswing is over.)
Resistance: 665 705 725 78
Support: 645 615
Trading plan:
For the short term, use 67 as the defensive resistance. If 65 breaks, the pullback zone becomes larger—then you do it; otherwise, use it as a short-term test order. After support is broken, the best is to do it on the right-side.
For a rebound, place orders by laying them at the two upswing start positions.
For cycle positions—especially a few inflection points—old saying: position trades. Easy profits.
$BTC
Lao Ai hasn’t really been doing much lately. He just feels the market isn’t moving much. He went through a cycle of bull and bear and gave himself some time off—taking a break for a while.
Back to the market: same old routine—first find the key levels, then talk about the trading plan.
I. Weekly-level perspective: (Figure 1)
The big BTC is still in a natural rebound after the pullback.
1. The end-of-wave termination level is 4. If it’s above 82, that’s also the level where these past couple of months’ pullbacks ended—only then can the overall market structure change.
2. Structural repair: eat up this current pullback wave 4’s focus level at 6.65. If during these days price keeps closing above it, then on a smaller timeframe you can consider that the structural repair is already underway. The targets are 705–725.
II. 4H timeframe: (Figure 2)
1. Let’s recap the key levels that got broken in this pullback: 82 was used as resistance, 78 was the level that broke down and then provided a second entry, the reversal level is 705, and it broke below the inflection point at 665.
So on this timeframe, the heavy overhead resistance areas appear.
2. Upswing starting points: 615 and 645. (For short-term context: once it falls back and breaks below 65, this current upswing starts turning into a correction; if it breaks below 615, then the upswing is over.)
Resistance: 665 705 725 78
Support: 645 615
Trading plan:
For the short term, use 67 as the defensive resistance. If 65 breaks, the pullback zone becomes larger—then you do it; otherwise, use it as a short-term test order. After support is broken, the best is to do it on the right-side.
For a rebound, place orders by laying them at the two upswing start positions.
For cycle positions—especially a few inflection points—old saying: position trades. Easy profits.
$BTC
Log in to explore more content