
加密那点事
17 Posts

加密那点事
Report
Block User
看懂加密那点事:追踪聪明钱,埋伏新叙事,做周期的长期主义者。
Open Trade
Frequent Trader
5.7 Years
0 Following
17 Followers
36 Liked
Posts
Portfolio
·
--
It’s almost 11 and I’m still staring at the 15-minute chart. I’m starting to wonder if the big players just copy-pasted the same script.
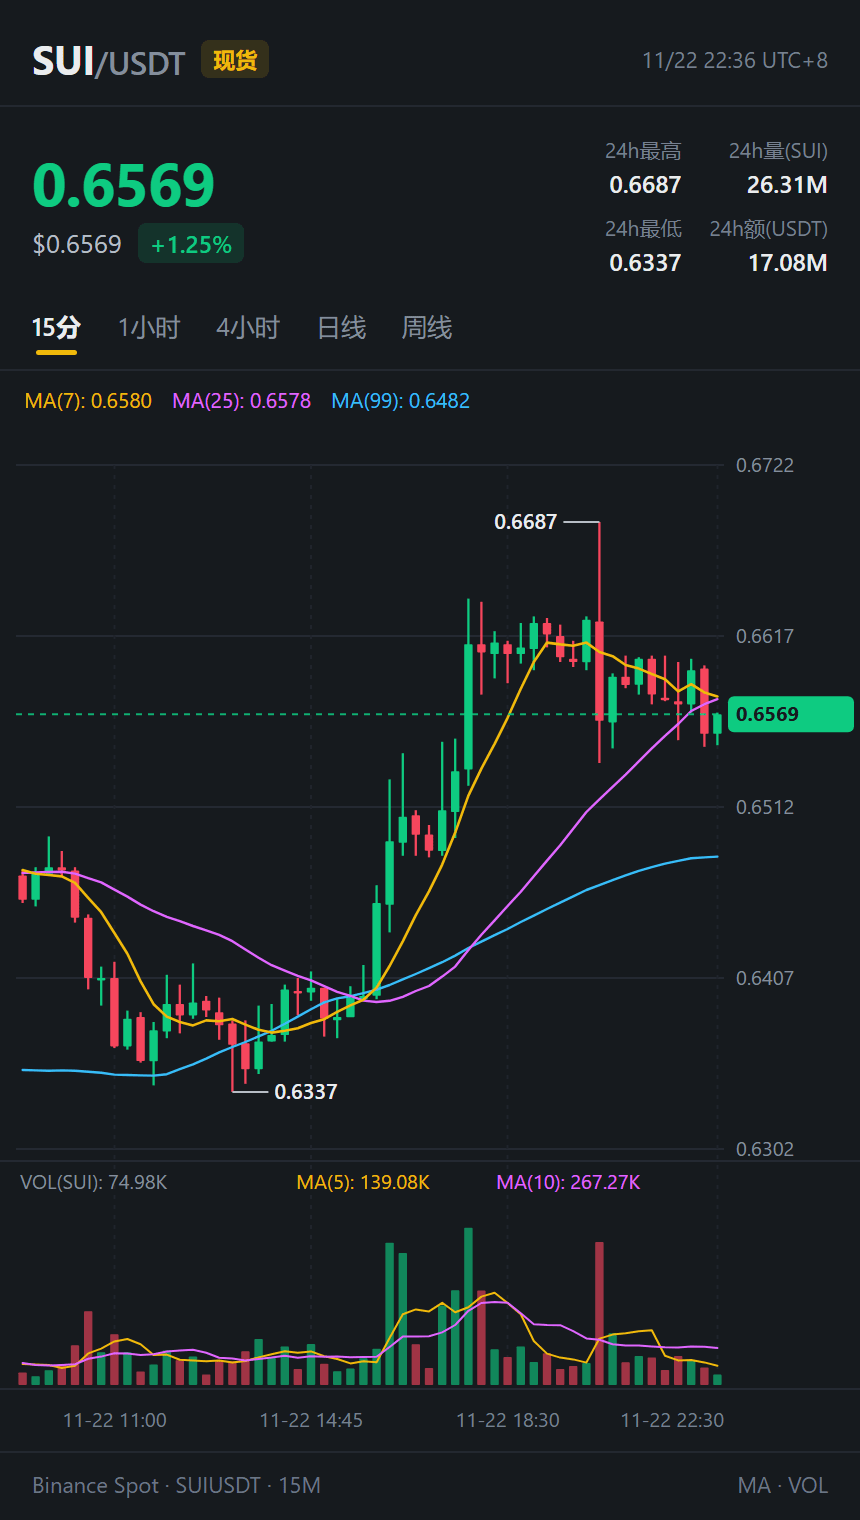
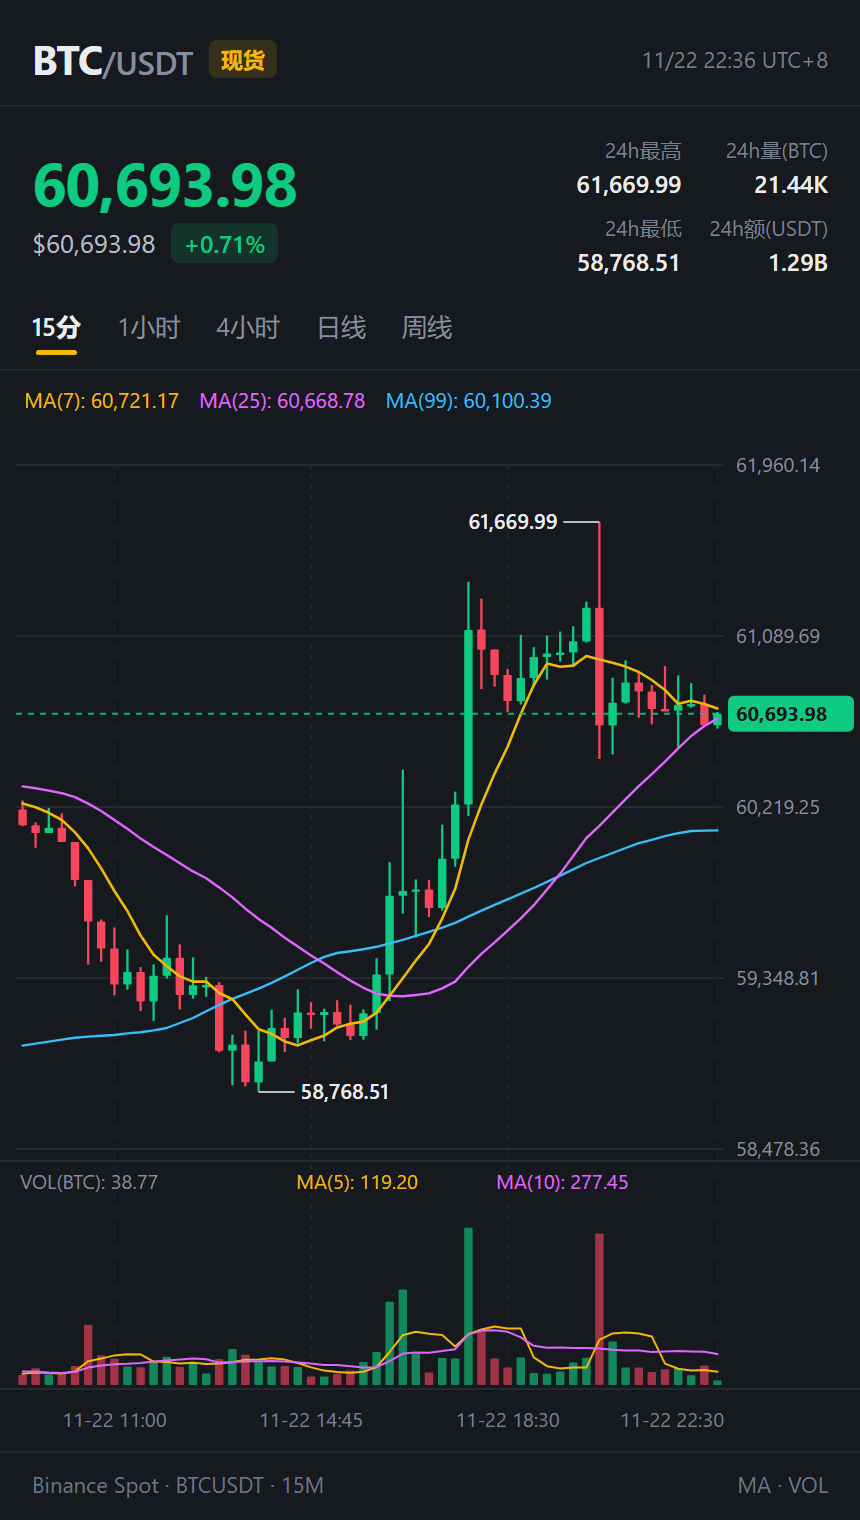
I just flipped between the 15-minute charts for $SUI and $BTC and almost burst out laughing. Their moves look like they came from the exact same mold: during the day, they climbed from 0.6337 and 58,768.51 respectively, then in the evening, just after touching their 24-hour highs of 0.6687 and 61,669.99, a single high-volume bearish candle with a long upper wick sent them straight back down, leaving everyone who chased the rally hanging in midair.
Now $SUI is hovering around 0.6569 (+1.25%), stuck below MA(7) at 0.6580 and MA(25) at 0.6578. Volume on this candle has shrunk to 74.98K—not even a third of the 10-period average volume of 267.27K. Although $BTC has a 24-hour trading volume of $1.29 billion, it’s also now dozing at 60,693, right beside MA(25) at 60,668, with just 38.77 coins traded in the latest candle.
People online are still arguing about whether 60,000 is a major bottom and whether it’ll test 57,500 again, but on the charts, no one seems willing to make the first move. On a Sunday night like this, after a long-wick shakeout followed by low-volume sideways trading, I’d rather stay flat and get to bed early, then wait for Monday’s volume to pick a direction. No way am I going to chase a bull trap in the middle of the night.
#SUI #BTC #CryptoMarket
It’s almost 11 and I’m still staring at the 15-minute chart. I’m starting to wonder if the big players just copy-pasted the same script.
I just flipped between the 15-minute charts for $SUI and $BTC and almost burst out laughing. Their moves look like they came from the exact same mold: during the day, they climbed from 0.6337 and 58,768.51 respectively, then in the evening, just after touching their 24-hour highs of 0.6687 and 61,669.99, a single high-volume bearish candle with a long upper wick sent them straight back down, leaving everyone who chased the rally hanging in midair.
Now $SUI is hovering around 0.6569 (+1.25%), stuck below MA(7) at 0.6580 and MA(25) at 0.6578. Volume on this candle has shrunk to 74.98K—not even a third of the 10-period average volume of 267.27K. Although $BTC has a 24-hour trading volume of $1.29 billion, it’s also now dozing at 60,693, right beside MA(25) at 60,668, with just 38.77 coins traded in the latest candle.
People online are still arguing about whether 60,000 is a major bottom and whether it’ll test 57,500 again, but on the charts, no one seems willing to make the first move. On a Sunday night like this, after a long-wick shakeout followed by low-volume sideways trading, I’d rather stay flat and get to bed early, then wait for Monday’s volume to pick a direction. No way am I going to chase a bull trap in the middle of the night.
#SUI #BTC #CryptoMarket
I just flipped between the 15-minute charts for $SUI and $BTC and almost burst out laughing. Their moves look like they came from the exact same mold: during the day, they climbed from 0.6337 and 58,768.51 respectively, then in the evening, just after touching their 24-hour highs of 0.6687 and 61,669.99, a single high-volume bearish candle with a long upper wick sent them straight back down, leaving everyone who chased the rally hanging in midair.
Now $SUI is hovering around 0.6569 (+1.25%), stuck below MA(7) at 0.6580 and MA(25) at 0.6578. Volume on this candle has shrunk to 74.98K—not even a third of the 10-period average volume of 267.27K. Although $BTC has a 24-hour trading volume of $1.29 billion, it’s also now dozing at 60,693, right beside MA(25) at 60,668, with just 38.77 coins traded in the latest candle.
People online are still arguing about whether 60,000 is a major bottom and whether it’ll test 57,500 again, but on the charts, no one seems willing to make the first move. On a Sunday night like this, after a long-wick shakeout followed by low-volume sideways trading, I’d rather stay flat and get to bed early, then wait for Monday’s volume to pick a direction. No way am I going to chase a bull trap in the middle of the night.
#SUI #BTC #CryptoMarket
118
·
--
People watching the charts past 10 p.m. on Sunday are probably just like me: the longer they watch, the sleepier they get, but they don't dare just close the app and go to bed.
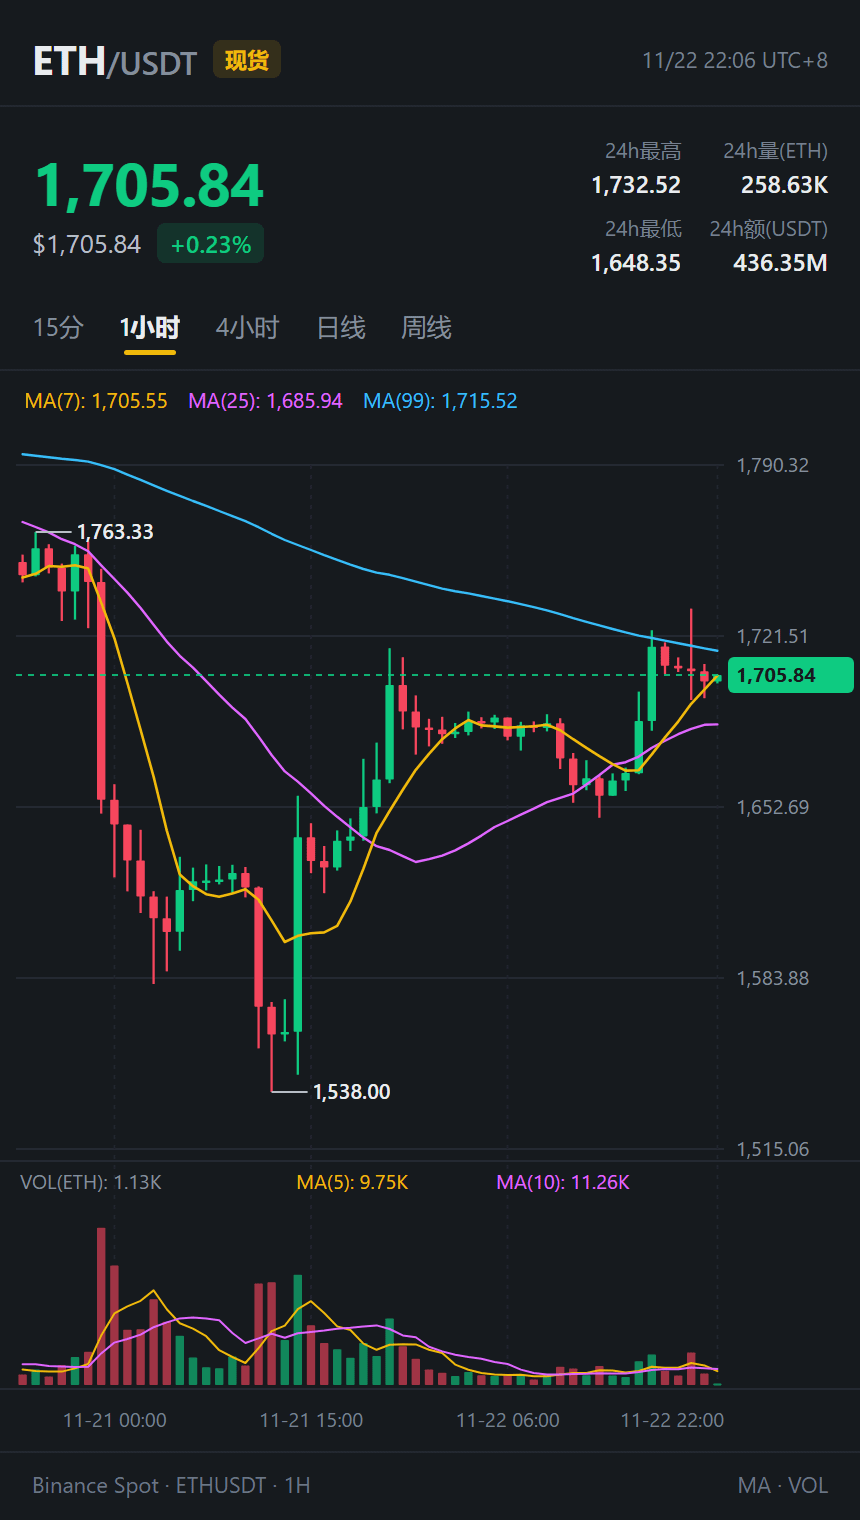
I switched to the $ETH one-hour chart, and this volume is honestly unbelievable. The volume on the latest hourly candle was only 1.13K—compared with yesterday's drop to 1,538, it feels like the internet went out. There's been no shortage of bearish news overseas these past few days: CoinShares is rumored to be liquidating its ETH treasury, and ETFs have seen outflows of more than 120,000 coins over seven days. Yet the price has stubbornly held at 1,705.84 without dropping any further. The latest spike to 1,732.52 was pushed back by the one-hour MA99 (1,715.52). The 24-hour trading volume is now $436 million, and the second half of the night has been all low-volume trading.
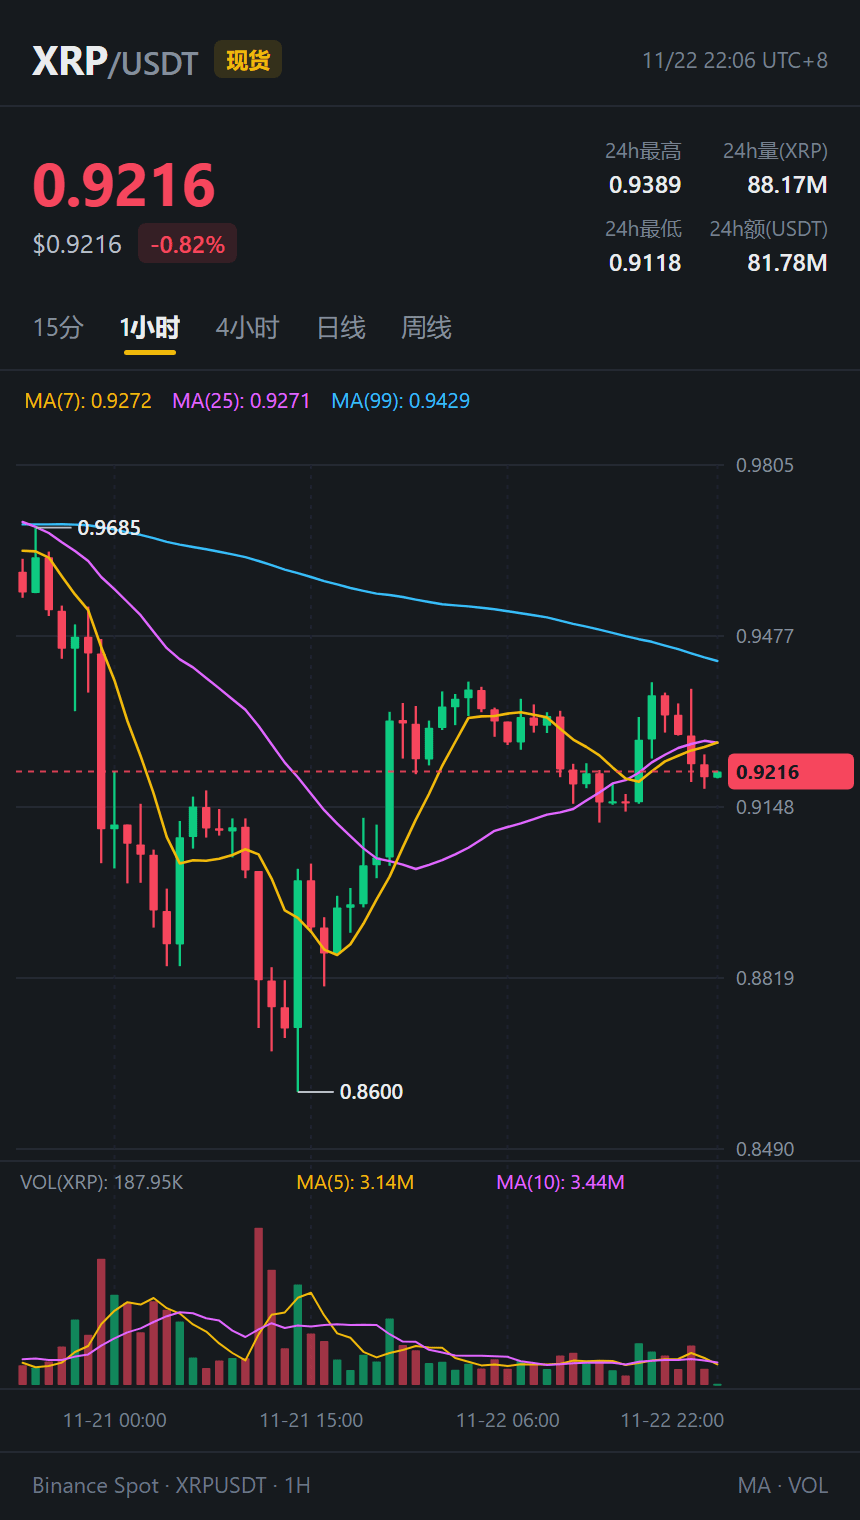
$XRP is even more frustrating. After rebounding from 0.86 to 0.9389, it's now fallen back to 0.9216, below the one-hour MA7 and MA25 (around 0.927). It's down 0.82% over 24 hours and hasn't even touched the MA99 (0.9429) above.
The weekly candle closes tomorrow morning. This kind of low-volume action hugging the moving averages is the most exhausting. I'm calling it a night; I'll wait for volume to pick up and a direction to emerge. Not financial advice.
#ETH #XRP #CryptoMarket
People watching the charts past 10 p.m. on Sunday are probably just like me: the longer they watch, the sleepier they get, but they don't dare just close the app and go to bed.
I switched to the $ETH one-hour chart, and this volume is honestly unbelievable. The volume on the latest hourly candle was only 1.13K—compared with yesterday's drop to 1,538, it feels like the internet went out. There's been no shortage of bearish news overseas these past few days: CoinShares is rumored to be liquidating its ETH treasury, and ETFs have seen outflows of more than 120,000 coins over seven days. Yet the price has stubbornly held at 1,705.84 without dropping any further. The latest spike to 1,732.52 was pushed back by the one-hour MA99 (1,715.52). The 24-hour trading volume is now $436 million, and the second half of the night has been all low-volume trading.
$XRP is even more frustrating. After rebounding from 0.86 to 0.9389, it's now fallen back to 0.9216, below the one-hour MA7 and MA25 (around 0.927). It's down 0.82% over 24 hours and hasn't even touched the MA99 (0.9429) above.
The weekly candle closes tomorrow morning. This kind of low-volume action hugging the moving averages is the most exhausting. I'm calling it a night; I'll wait for volume to pick up and a direction to emerge. Not financial advice.
#ETH #XRP #CryptoMarket
I switched to the $ETH one-hour chart, and this volume is honestly unbelievable. The volume on the latest hourly candle was only 1.13K—compared with yesterday's drop to 1,538, it feels like the internet went out. There's been no shortage of bearish news overseas these past few days: CoinShares is rumored to be liquidating its ETH treasury, and ETFs have seen outflows of more than 120,000 coins over seven days. Yet the price has stubbornly held at 1,705.84 without dropping any further. The latest spike to 1,732.52 was pushed back by the one-hour MA99 (1,715.52). The 24-hour trading volume is now $436 million, and the second half of the night has been all low-volume trading.
$XRP is even more frustrating. After rebounding from 0.86 to 0.9389, it's now fallen back to 0.9216, below the one-hour MA7 and MA25 (around 0.927). It's down 0.82% over 24 hours and hasn't even touched the MA99 (0.9429) above.
The weekly candle closes tomorrow morning. This kind of low-volume action hugging the moving averages is the most exhausting. I'm calling it a night; I'll wait for volume to pick up and a direction to emerge. Not financial advice.
#ETH #XRP #CryptoMarket
221
·
--
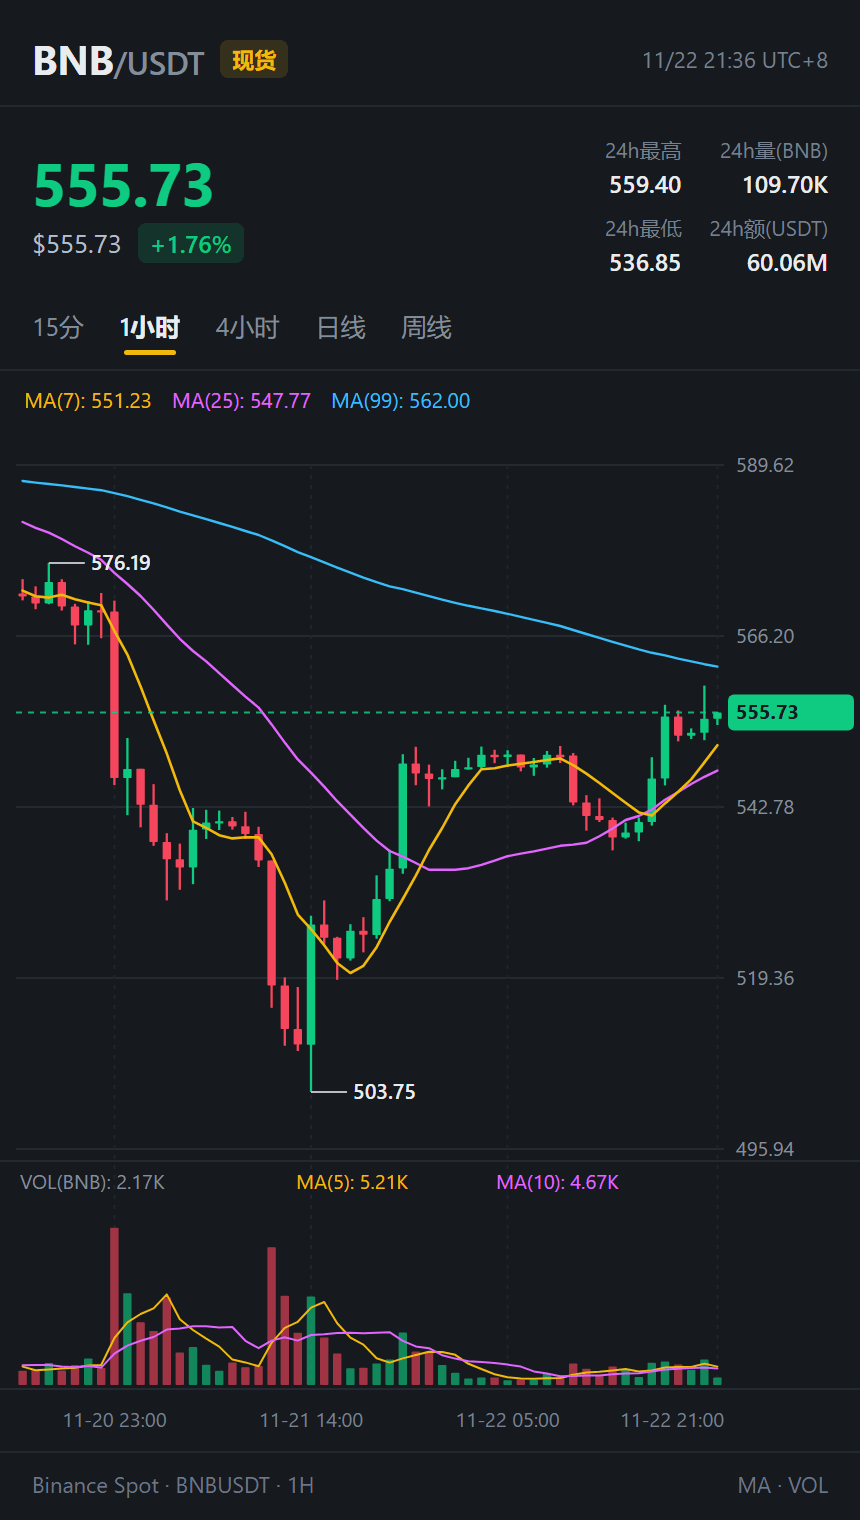
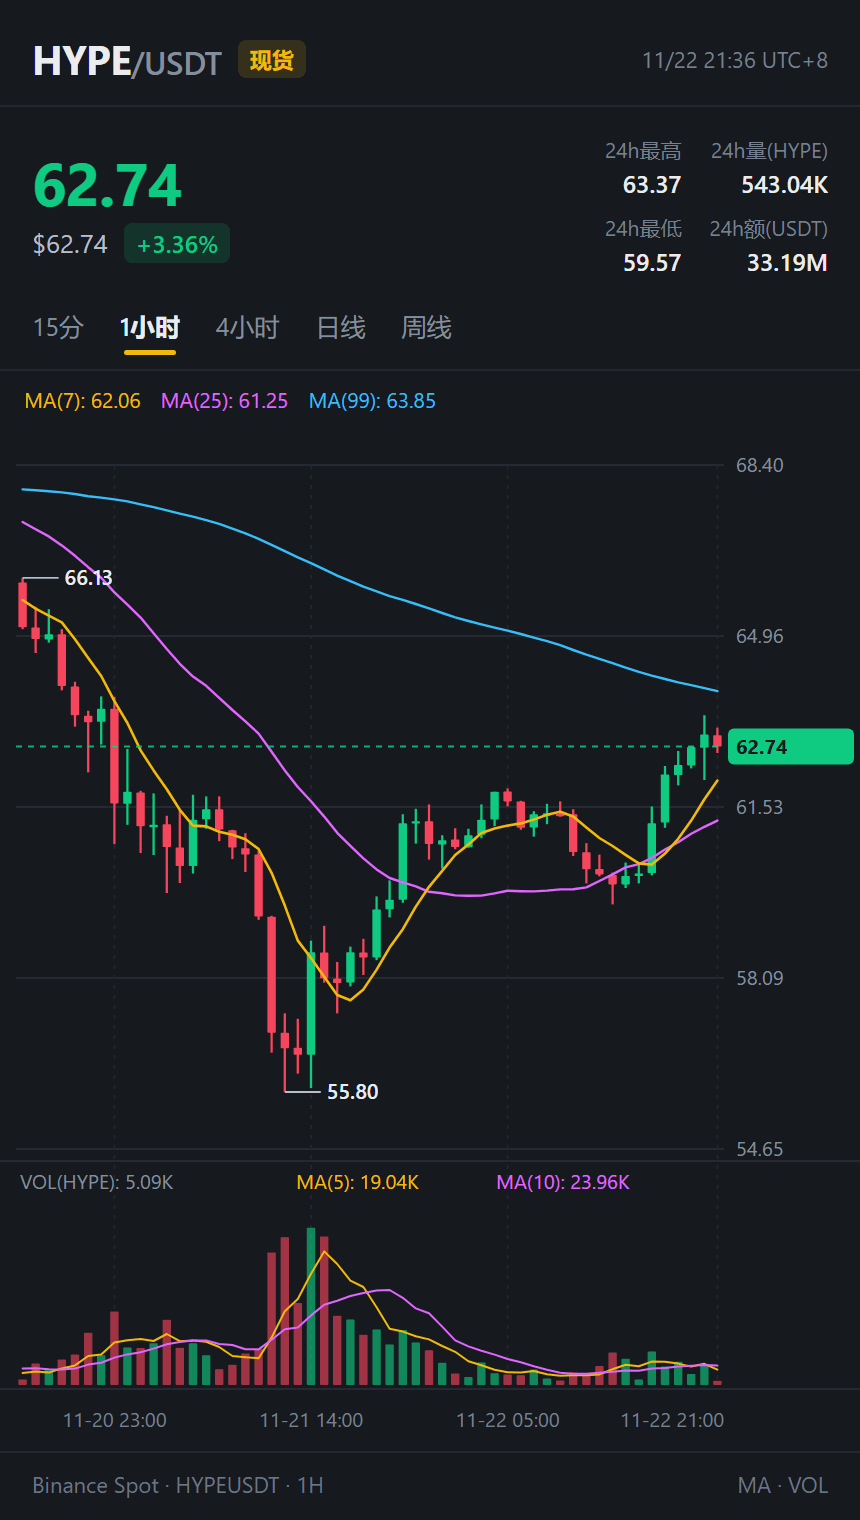
At 9:30 on Sunday night, I took a quick look at my watchlist, thinking the day would just drag on until bedtime. But that rebound from $BNB and $HYPE was enough to wake me right up—the only thing is, their price levels are so frustratingly precise.
$BNB looked pretty scary yesterday when the 1-hour chart plunged to 503.75. Then this afternoon, a little after 1, it retested 536.85 and lingered there for ages. I’d pretty much stopped watching when, after 4, it suddenly started putting up one bullish candle after another. The 8 o’clock candle touched 559.40, and it’s now sitting at 555.73, with just over $60 million in 24-hour trading volume. And yet the MA(99) at 562 is right overhead, taunting it—it’s only a few bucks away, but it just won’t break through in one go.
$HYPE was even more impressive. After finding support at 59.57 this afternoon, it managed to string together five consecutive bullish 1-hour candles and climb to 63.37. It’s now at 62.74, up more than 3.3% over 24 hours, with $33.19 million in trading volume. But look up, and the 1-hour MA(99) is sitting right at 63.85—as if it and BNB had agreed to hit the brakes at the same time.
The most nerve-racking thing is testing the waters right at a moving average: chase it and you’re afraid of buying into resistance; sit on your hands and watch, and you’re afraid it might really turn bullish. I’ll hold off for now and see if it can break through this barrier.
#BNB #HYPE #Binance Square
At 9:30 on Sunday night, I took a quick look at my watchlist, thinking the day would just drag on until bedtime. But that rebound from $BNB and $HYPE was enough to wake me right up—the only thing is, their price levels are so frustratingly precise.
$BNB looked pretty scary yesterday when the 1-hour chart plunged to 503.75. Then this afternoon, a little after 1, it retested 536.85 and lingered there for ages. I’d pretty much stopped watching when, after 4, it suddenly started putting up one bullish candle after another. The 8 o’clock candle touched 559.40, and it’s now sitting at 555.73, with just over $60 million in 24-hour trading volume. And yet the MA(99) at 562 is right overhead, taunting it—it’s only a few bucks away, but it just won’t break through in one go.
$HYPE was even more impressive. After finding support at 59.57 this afternoon, it managed to string together five consecutive bullish 1-hour candles and climb to 63.37. It’s now at 62.74, up more than 3.3% over 24 hours, with $33.19 million in trading volume. But look up, and the 1-hour MA(99) is sitting right at 63.85—as if it and BNB had agreed to hit the brakes at the same time.
The most nerve-racking thing is testing the waters right at a moving average: chase it and you’re afraid of buying into resistance; sit on your hands and watch, and you’re afraid it might really turn bullish. I’ll hold off for now and see if it can break through this barrier.
#BNB #HYPE #Binance Square
$BNB looked pretty scary yesterday when the 1-hour chart plunged to 503.75. Then this afternoon, a little after 1, it retested 536.85 and lingered there for ages. I’d pretty much stopped watching when, after 4, it suddenly started putting up one bullish candle after another. The 8 o’clock candle touched 559.40, and it’s now sitting at 555.73, with just over $60 million in 24-hour trading volume. And yet the MA(99) at 562 is right overhead, taunting it—it’s only a few bucks away, but it just won’t break through in one go.
$HYPE was even more impressive. After finding support at 59.57 this afternoon, it managed to string together five consecutive bullish 1-hour candles and climb to 63.37. It’s now at 62.74, up more than 3.3% over 24 hours, with $33.19 million in trading volume. But look up, and the 1-hour MA(99) is sitting right at 63.85—as if it and BNB had agreed to hit the brakes at the same time.
The most nerve-racking thing is testing the waters right at a moving average: chase it and you’re afraid of buying into resistance; sit on your hands and watch, and you’re afraid it might really turn bullish. I’ll hold off for now and see if it can break through this barrier.
#BNB #HYPE #Binance Square
113
·
--
Watching the charts after 9 p.m. on Sunday had me cracking up. This rebound is basically a contest to see who can look more pathetic.
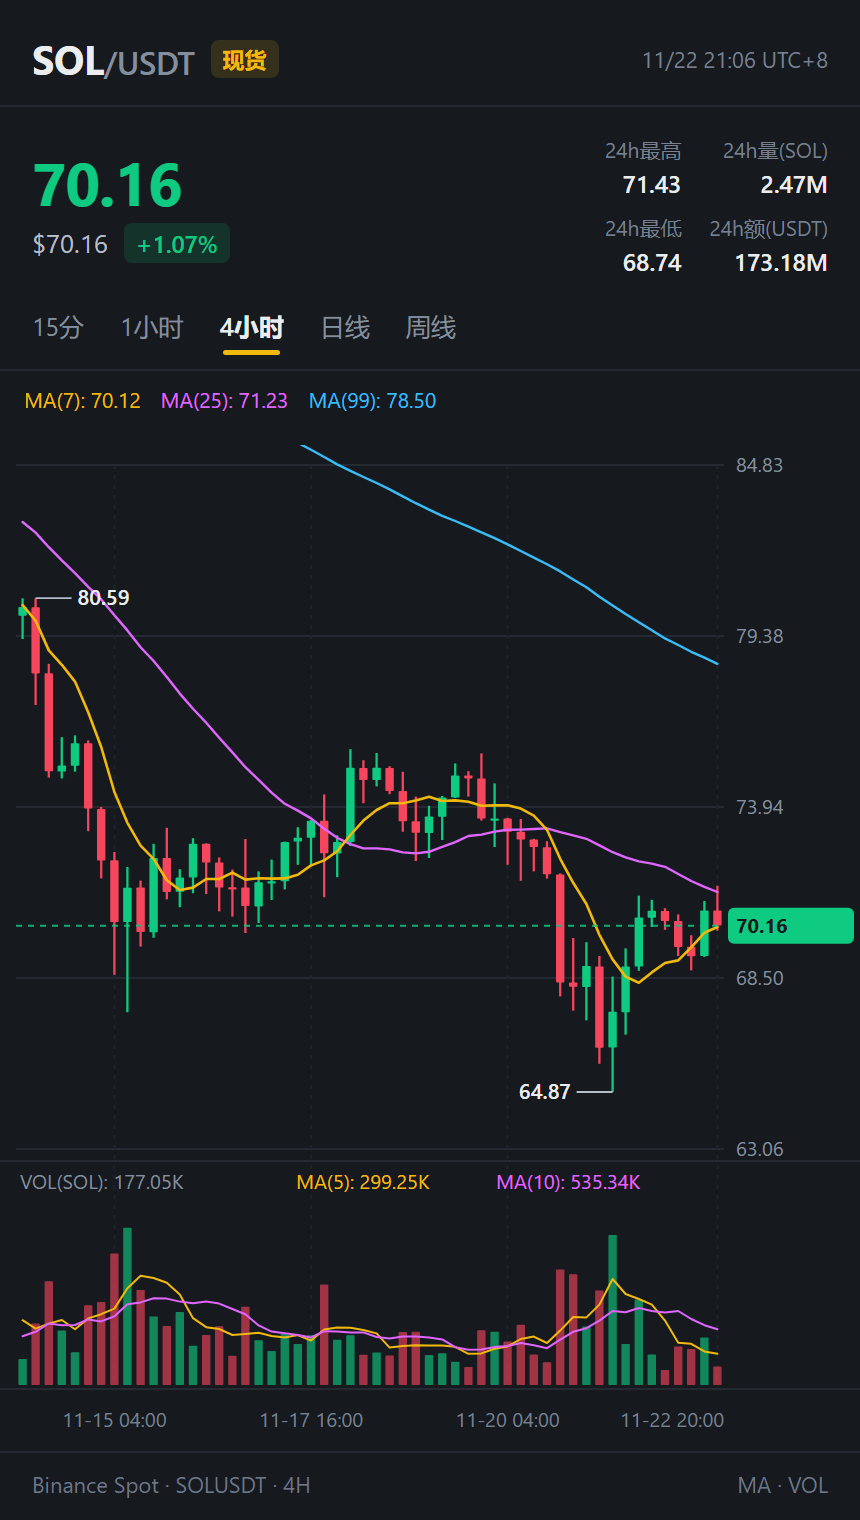
I just switched over to the 4-hour chart for $SOL , and I have to hand it to it for dragging its feet. Its 24-hour trading volume hit $173 million, putting it in the top three across the whole market, yet the price only crawled from 68.74 to 70.16—a gain of barely over 1%. It finally managed to shove its way up a bit just now, touched 71.43 and tapped the 4-hour MA25 (71.23), then promptly got shoved back down to the $70 mark to catch its breath. $BTC at least managed to rally nearly 3% today and get back above 60,600, but this one spent all its volume changing hands in place.
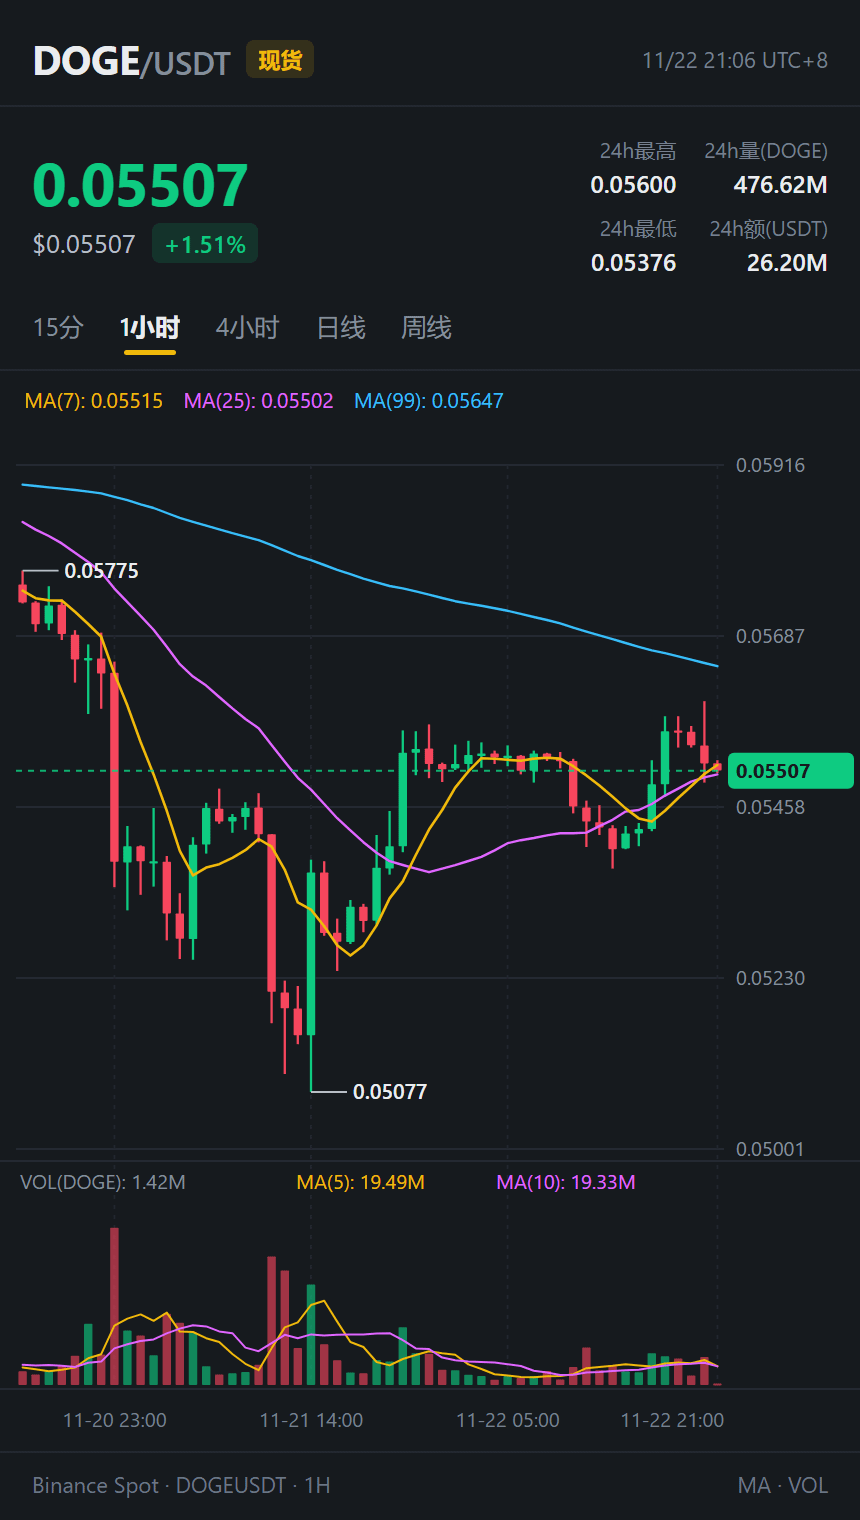
I took a quick look at $DOGE too, and it put on the same show. On the 1-hour chart, after climbing back above 0.055 from 0.05077, it just touched the 0.05600 round-number level at 8 p.m. before getting dumped back to 0.05507. The MA99 is still hanging overhead at 0.05647, keeping an eye on it, and volume has dried up like nobody’s working this weekend.
Bitcoin took a step forward, while these two old pals are just standing still below resistance. I’m not daring to chase until they get past those hurdles at 71.4 and 0.056. I’ll wait patiently for a clear direction. Not investment advice.
#SOL #DOGE #CryptoMarket
Watching the charts after 9 p.m. on Sunday had me cracking up. This rebound is basically a contest to see who can look more pathetic.
I just switched over to the 4-hour chart for $SOL , and I have to hand it to it for dragging its feet. Its 24-hour trading volume hit $173 million, putting it in the top three across the whole market, yet the price only crawled from 68.74 to 70.16—a gain of barely over 1%. It finally managed to shove its way up a bit just now, touched 71.43 and tapped the 4-hour MA25 (71.23), then promptly got shoved back down to the $70 mark to catch its breath. $BTC at least managed to rally nearly 3% today and get back above 60,600, but this one spent all its volume changing hands in place.
I took a quick look at $DOGE too, and it put on the same show. On the 1-hour chart, after climbing back above 0.055 from 0.05077, it just touched the 0.05600 round-number level at 8 p.m. before getting dumped back to 0.05507. The MA99 is still hanging overhead at 0.05647, keeping an eye on it, and volume has dried up like nobody’s working this weekend.
Bitcoin took a step forward, while these two old pals are just standing still below resistance. I’m not daring to chase until they get past those hurdles at 71.4 and 0.056. I’ll wait patiently for a clear direction. Not investment advice.
#SOL #DOGE #CryptoMarket
I just switched over to the 4-hour chart for $SOL , and I have to hand it to it for dragging its feet. Its 24-hour trading volume hit $173 million, putting it in the top three across the whole market, yet the price only crawled from 68.74 to 70.16—a gain of barely over 1%. It finally managed to shove its way up a bit just now, touched 71.43 and tapped the 4-hour MA25 (71.23), then promptly got shoved back down to the $70 mark to catch its breath. $BTC at least managed to rally nearly 3% today and get back above 60,600, but this one spent all its volume changing hands in place.
I took a quick look at $DOGE too, and it put on the same show. On the 1-hour chart, after climbing back above 0.055 from 0.05077, it just touched the 0.05600 round-number level at 8 p.m. before getting dumped back to 0.05507. The MA99 is still hanging overhead at 0.05647, keeping an eye on it, and volume has dried up like nobody’s working this weekend.
Bitcoin took a step forward, while these two old pals are just standing still below resistance. I’m not daring to chase until they get past those hurdles at 71.4 and 0.056. I’ll wait patiently for a clear direction. Not investment advice.
#SOL #DOGE #CryptoMarket
235
·
--
On Sunday, a little after 8 p.m., I couldn't resist chasing a breakout and nearly got left holding the bag at the top.
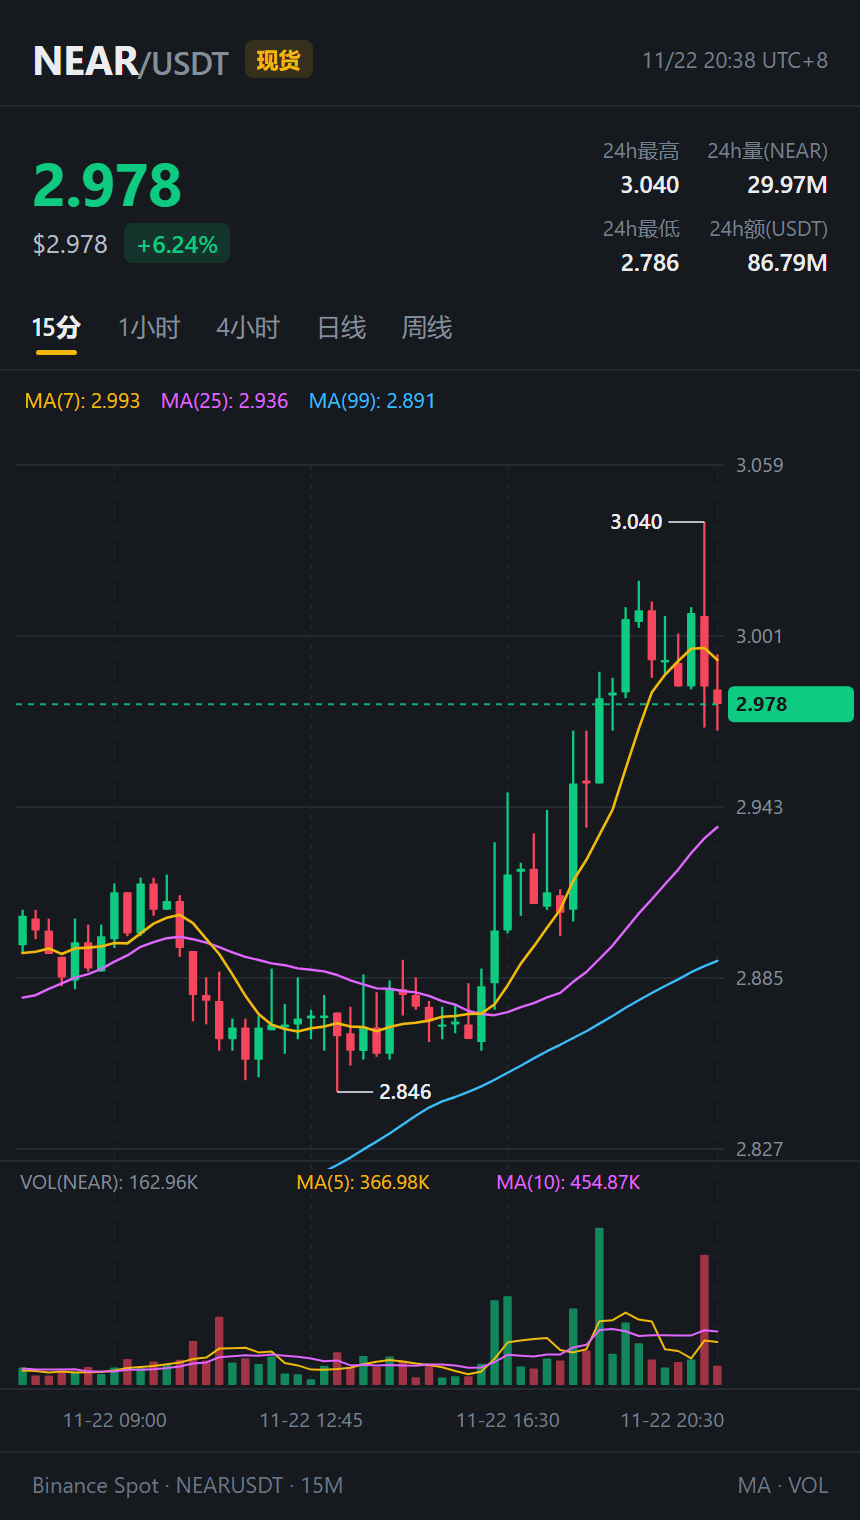
$NEAR put on quite a show with its 15-minute candle tonight: in the evening, it climbed steadily on heavy volume from 2.846. Around 7, it broke above 3.00, and I thought it was in the clear. But at 8:15, just after hitting a new 24-hour high of 3.040, a high-volume bearish candle with a long upper wick sent the price crashing back to 2.978. 24-hour trading volume hit $86.79 million. That +6.24% gain looked exciting, but chasing it nearly gave me a heart attack.
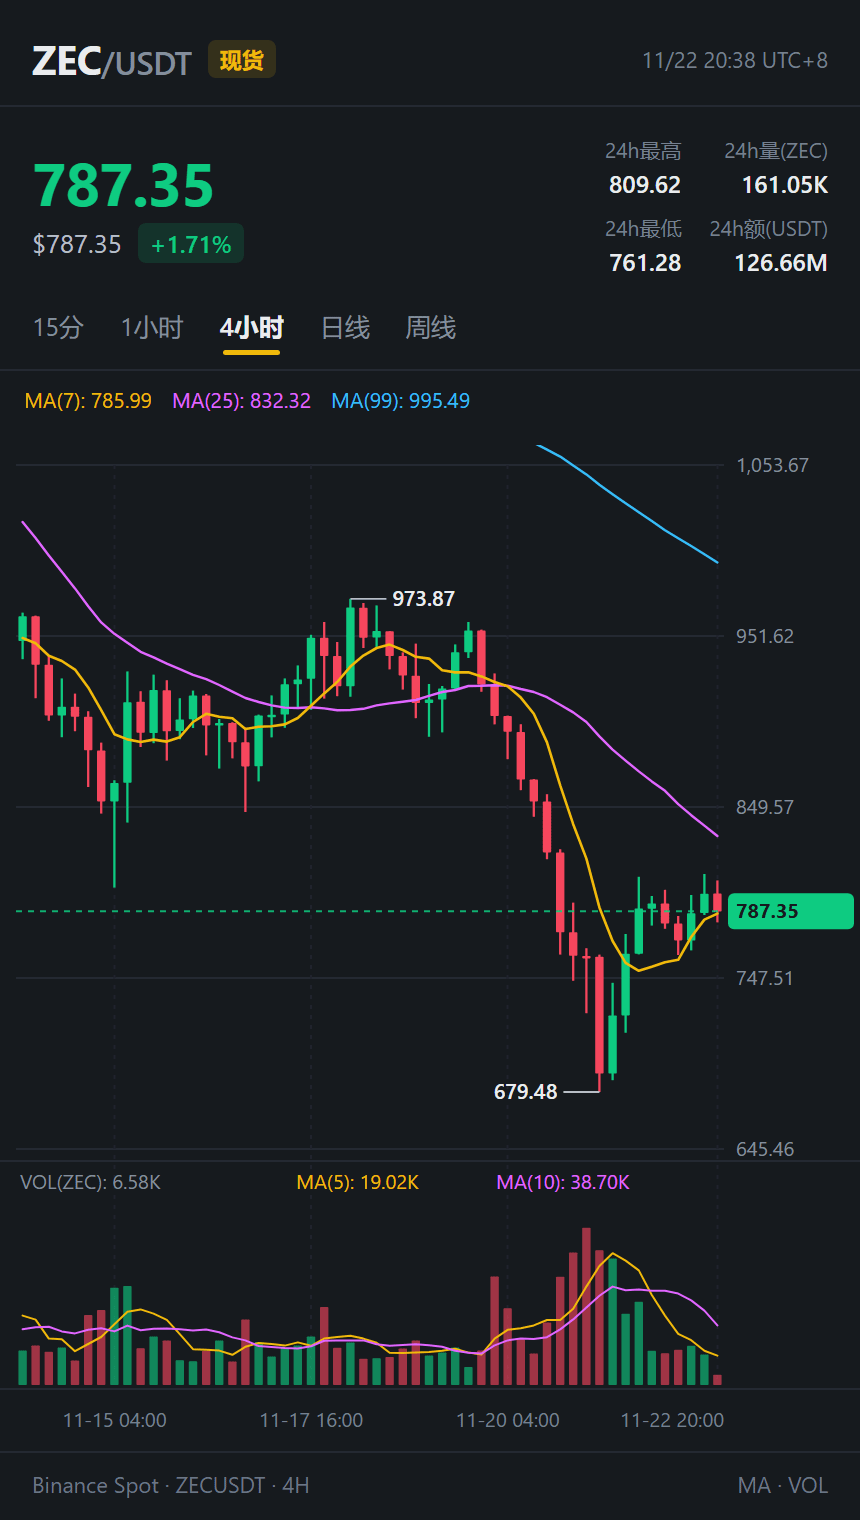
I took a look at the 4-hour chart for $ZEC , and it was the same story. People are still bringing up yesterday's spike to $679.48 and dragging out those posts that called for $1,600, but spot trading quietly turned over $126 million in the past 24 hours, and it even touched $809.62 tonight. It just keeps retreating whenever it hits the round-number $800 level. Now it's stuck at 787.35, catching its breath right at the edge of MA(7) at 785.99, while MA(25) at 832.32 is still looming well above.
When it comes to round-number levels, I really don't dare catch a falling knife before the price holds firm. I've pulled my orders for now and will wait to see if the 2.95 and 780 areas hold. No blindly chasing highs.
#NEAR #ZEC #Crypto Market
On Sunday, a little after 8 p.m., I couldn't resist chasing a breakout and nearly got left holding the bag at the top.
$NEAR put on quite a show with its 15-minute candle tonight: in the evening, it climbed steadily on heavy volume from 2.846. Around 7, it broke above 3.00, and I thought it was in the clear. But at 8:15, just after hitting a new 24-hour high of 3.040, a high-volume bearish candle with a long upper wick sent the price crashing back to 2.978. 24-hour trading volume hit $86.79 million. That +6.24% gain looked exciting, but chasing it nearly gave me a heart attack.
I took a look at the 4-hour chart for $ZEC , and it was the same story. People are still bringing up yesterday's spike to $679.48 and dragging out those posts that called for $1,600, but spot trading quietly turned over $126 million in the past 24 hours, and it even touched $809.62 tonight. It just keeps retreating whenever it hits the round-number $800 level. Now it's stuck at 787.35, catching its breath right at the edge of MA(7) at 785.99, while MA(25) at 832.32 is still looming well above.
When it comes to round-number levels, I really don't dare catch a falling knife before the price holds firm. I've pulled my orders for now and will wait to see if the 2.95 and 780 areas hold. No blindly chasing highs.
#NEAR #ZEC #Crypto Market
$NEAR put on quite a show with its 15-minute candle tonight: in the evening, it climbed steadily on heavy volume from 2.846. Around 7, it broke above 3.00, and I thought it was in the clear. But at 8:15, just after hitting a new 24-hour high of 3.040, a high-volume bearish candle with a long upper wick sent the price crashing back to 2.978. 24-hour trading volume hit $86.79 million. That +6.24% gain looked exciting, but chasing it nearly gave me a heart attack.
I took a look at the 4-hour chart for $ZEC , and it was the same story. People are still bringing up yesterday's spike to $679.48 and dragging out those posts that called for $1,600, but spot trading quietly turned over $126 million in the past 24 hours, and it even touched $809.62 tonight. It just keeps retreating whenever it hits the round-number $800 level. Now it's stuck at 787.35, catching its breath right at the edge of MA(7) at 785.99, while MA(25) at 832.32 is still looming well above.
When it comes to round-number levels, I really don't dare catch a falling knife before the price holds firm. I've pulled my orders for now and will wait to see if the 2.95 and 780 areas hold. No blindly chasing highs.
#NEAR #ZEC #Crypto Market
·
--
Article
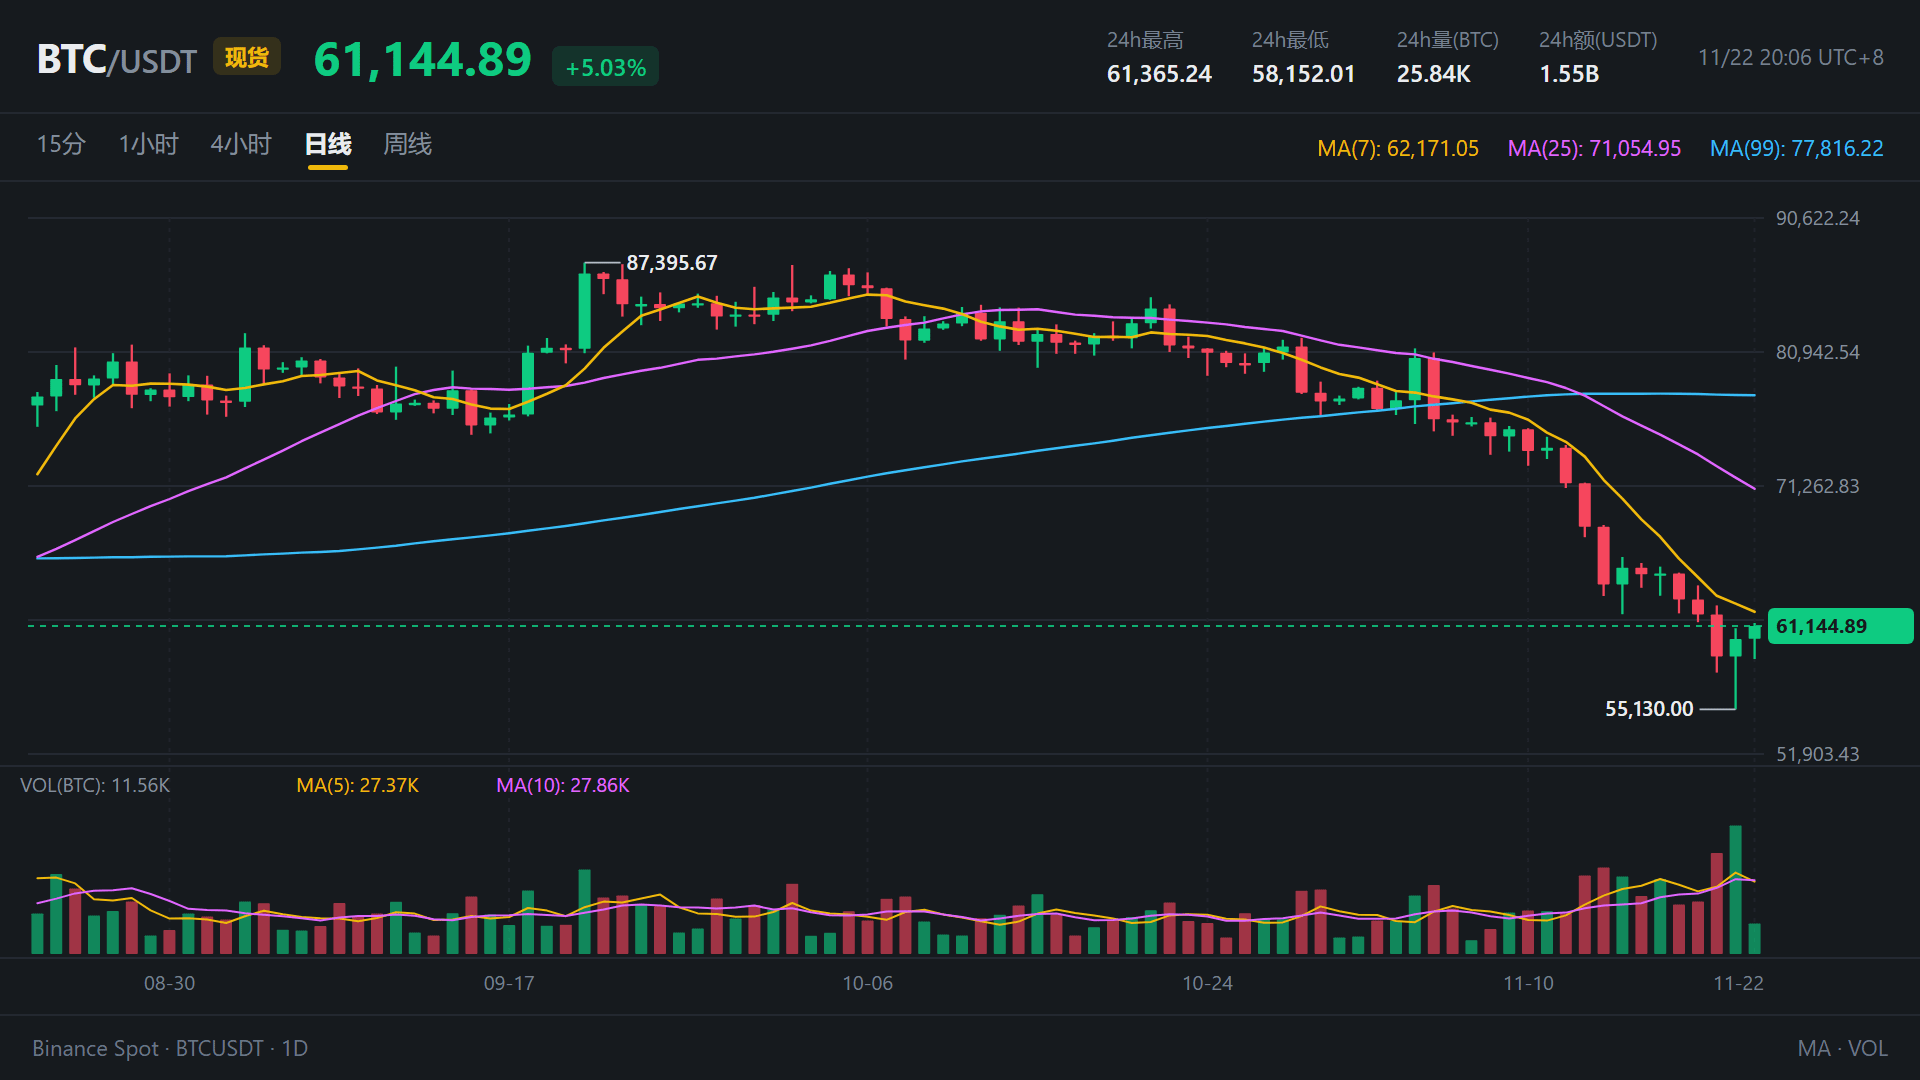
It plunged to 55,130 last night and bounced back to 61,100 tonight. After staring at the BTC daily chart, I’m actually in no rush to buy the dipA little after eight on Sunday night, I was about to shut down my computer and get ready for bed. Then, just before turning in, I couldn’t resist dragging the $BTC daily chart to the left. I looked at the high of 87,395.67 in the upper-left corner, then at the 55,130.00 it had plunged to yesterday, and for a moment I really didn’t know whether to laugh or sigh.
It’s been a painfully relentless slide over the past couple of weeks. In early November, $BTC was still hovering around 75,000. After breaking down on November 12, it was almost nothing but a steady decline that kept picking up speed. Yesterday at noon, it plunged straight through 56,000, hitting 55,130, while spot trading volume for the day surged to a massive $2.82 billion. Back then, the internet was full of wailing. Everyone was poring over the macro picture, with the S&P 500 ETF SPY falling for five straight days and breaking below its 200-day moving average. People argued over whether 57,500 could hold after 63,000 gave way, and even whether 60,000 counted as a bottom turned into a huge debate.
It plunged to 55,130 last night and bounced back to 61,100 tonight. After staring at the BTC daily chart, I’m actually in no rush to buy the dip
A little after eight on Sunday night, I was about to shut down my computer and get ready for bed. Then, just before turning in, I couldn’t resist dragging the $BTC daily chart to the left. I looked at the high of 87,395.67 in the upper-left corner, then at the 55,130.00 it had plunged to yesterday, and for a moment I really didn’t know whether to laugh or sigh.
It’s been a painfully relentless slide over the past couple of weeks. In early November, $BTC was still hovering around 75,000. After breaking down on November 12, it was almost nothing but a steady decline that kept picking up speed. Yesterday at noon, it plunged straight through 56,000, hitting 55,130, while spot trading volume for the day surged to a massive $2.82 billion. Back then, the internet was full of wailing. Everyone was poring over the macro picture, with the S&P 500 ETF SPY falling for five straight days and breaking below its 200-day moving average. People argued over whether 57,500 could hold after 63,000 gave way, and even whether 60,000 counted as a bottom turned into a huge debate.
It’s been a painfully relentless slide over the past couple of weeks. In early November, $BTC was still hovering around 75,000. After breaking down on November 12, it was almost nothing but a steady decline that kept picking up speed. Yesterday at noon, it plunged straight through 56,000, hitting 55,130, while spot trading volume for the day surged to a massive $2.82 billion. Back then, the internet was full of wailing. Everyone was poring over the macro picture, with the S&P 500 ETF SPY falling for five straight days and breaking below its 200-day moving average. People argued over whether 57,500 could hold after 63,000 gave way, and even whether 60,000 counted as a bottom turned into a huge debate.
170
·
--
Checking the charts again tonight was a bit surprising. I thought we’d be stuck moving sideways until late again this weekend, but that 5 p.m. move jolted the bears awake.
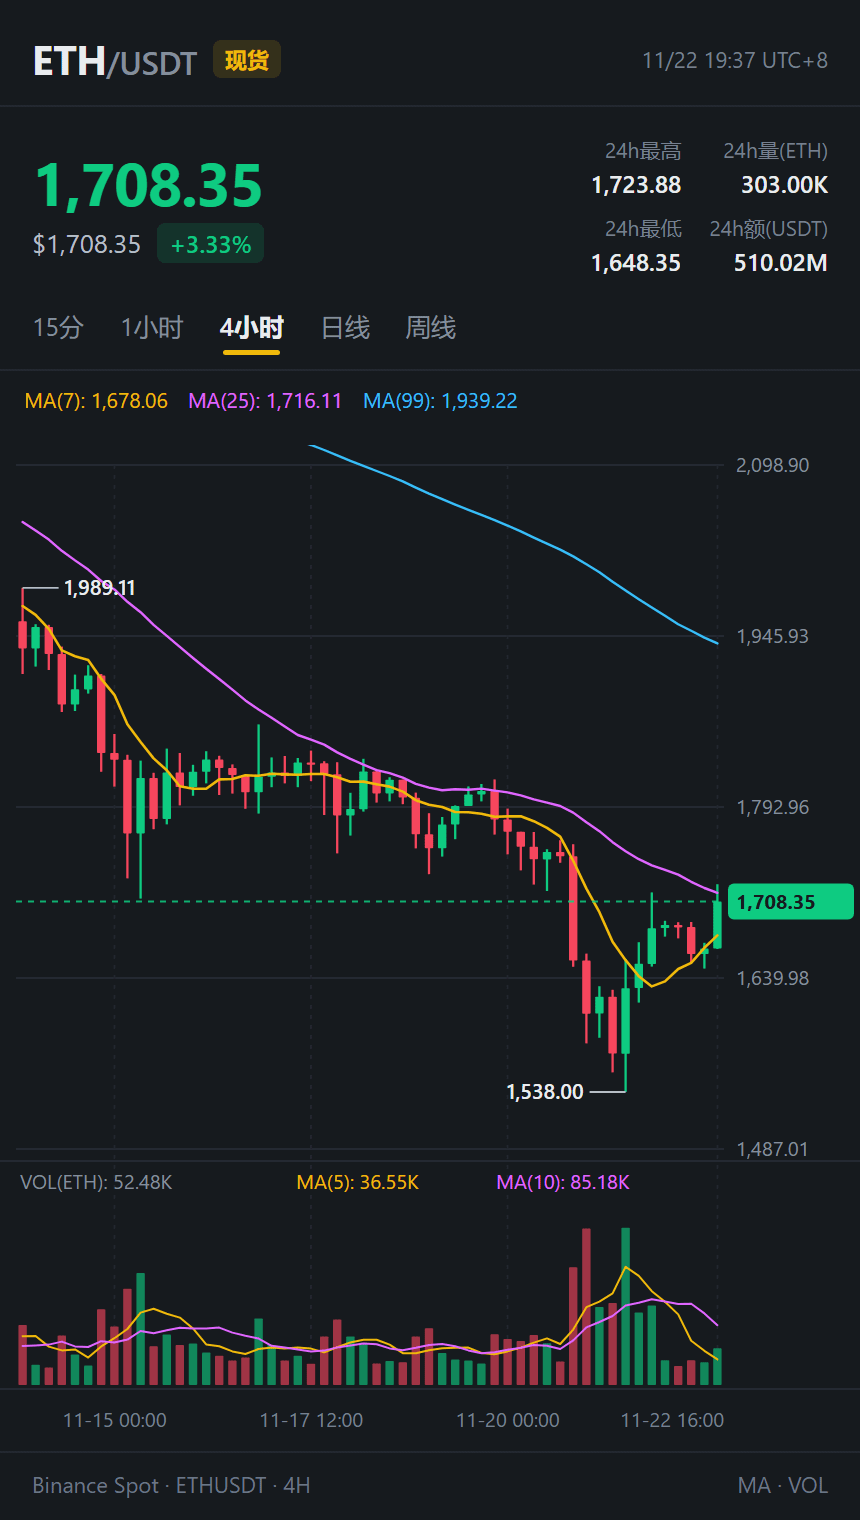
I just checked the overseas feeds, and people are still saying CoinShares liquidated its ETH treasury and spot ETFs saw outflows of over 120,000 coins in seven days. Sentiment looked entirely bearish, but $ETH quietly climbed back above $1,708, with 24-hour trading volume at $510 million. Looking at the 4-hour chart, after yesterday’s dump to $1,538, this candle has just reached the area around the MA25 at $1,716 (high of $1,723.88). The fact that it’s rising on bad news is definitely interesting, but I’m not calling a reversal until it holds above that level.
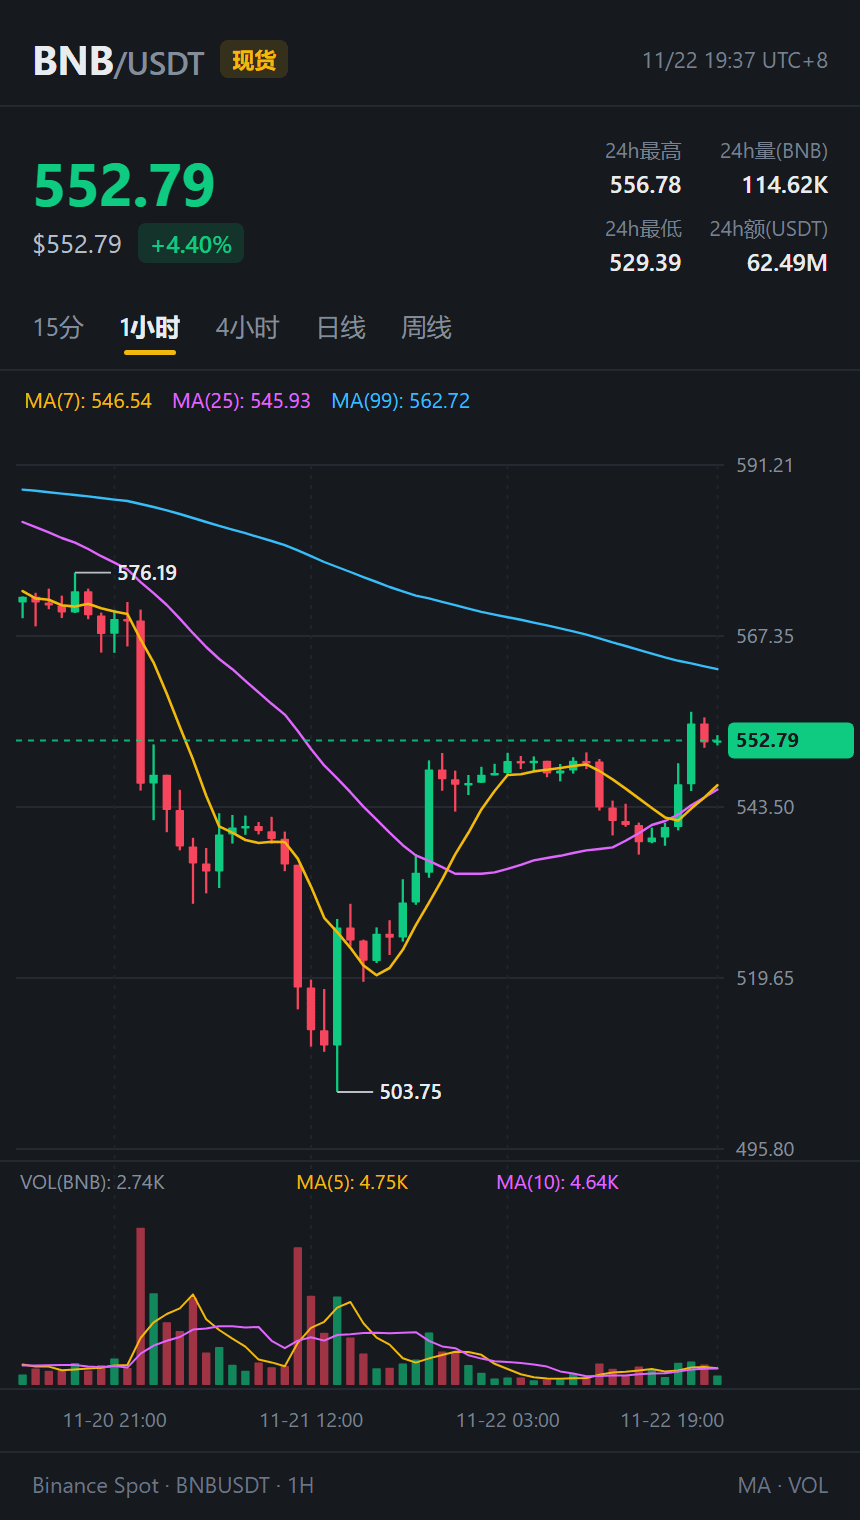
The old bull $BNB has been looking much stronger today. On the 1-hour chart, it climbed from $536 this afternoon to $556.78 and is now holding steady at $552.79 (+4.40%). Both the MA7 and MA25 are supporting it below $546; above, the level to watch is the MA99 at $562.7.
Weekend rebounds are the most nerve-racking: chase the rally and risk getting burned, stay on the sidelines and risk missing out. I’m itching to trade but also a bit wary, so I can only watch from the sidelines with a small position and keep an eye on the $1,716 and $562 levels. Not investment advice.
#BNB #ETH #CryptoMarket
Checking the charts again tonight was a bit surprising. I thought we’d be stuck moving sideways until late again this weekend, but that 5 p.m. move jolted the bears awake.
I just checked the overseas feeds, and people are still saying CoinShares liquidated its ETH treasury and spot ETFs saw outflows of over 120,000 coins in seven days. Sentiment looked entirely bearish, but $ETH quietly climbed back above $1,708, with 24-hour trading volume at $510 million. Looking at the 4-hour chart, after yesterday’s dump to $1,538, this candle has just reached the area around the MA25 at $1,716 (high of $1,723.88). The fact that it’s rising on bad news is definitely interesting, but I’m not calling a reversal until it holds above that level.
The old bull $BNB has been looking much stronger today. On the 1-hour chart, it climbed from $536 this afternoon to $556.78 and is now holding steady at $552.79 (+4.40%). Both the MA7 and MA25 are supporting it below $546; above, the level to watch is the MA99 at $562.7.
Weekend rebounds are the most nerve-racking: chase the rally and risk getting burned, stay on the sidelines and risk missing out. I’m itching to trade but also a bit wary, so I can only watch from the sidelines with a small position and keep an eye on the $1,716 and $562 levels. Not investment advice.
#BNB #ETH #CryptoMarket
I just checked the overseas feeds, and people are still saying CoinShares liquidated its ETH treasury and spot ETFs saw outflows of over 120,000 coins in seven days. Sentiment looked entirely bearish, but $ETH quietly climbed back above $1,708, with 24-hour trading volume at $510 million. Looking at the 4-hour chart, after yesterday’s dump to $1,538, this candle has just reached the area around the MA25 at $1,716 (high of $1,723.88). The fact that it’s rising on bad news is definitely interesting, but I’m not calling a reversal until it holds above that level.
The old bull $BNB has been looking much stronger today. On the 1-hour chart, it climbed from $536 this afternoon to $556.78 and is now holding steady at $552.79 (+4.40%). Both the MA7 and MA25 are supporting it below $546; above, the level to watch is the MA99 at $562.7.
Weekend rebounds are the most nerve-racking: chase the rally and risk getting burned, stay on the sidelines and risk missing out. I’m itching to trade but also a bit wary, so I can only watch from the sidelines with a small position and keep an eye on the $1,716 and $562 levels. Not investment advice.
#BNB #ETH #CryptoMarket
195
·
--
Just caught up on the overseas news—everyone’s talking about $XRP : spot ETFs saw $4.97 million in net outflows, futures liquidations hit $18 million, and even the chart comparing 2021 with today has been dragged out for another beating.
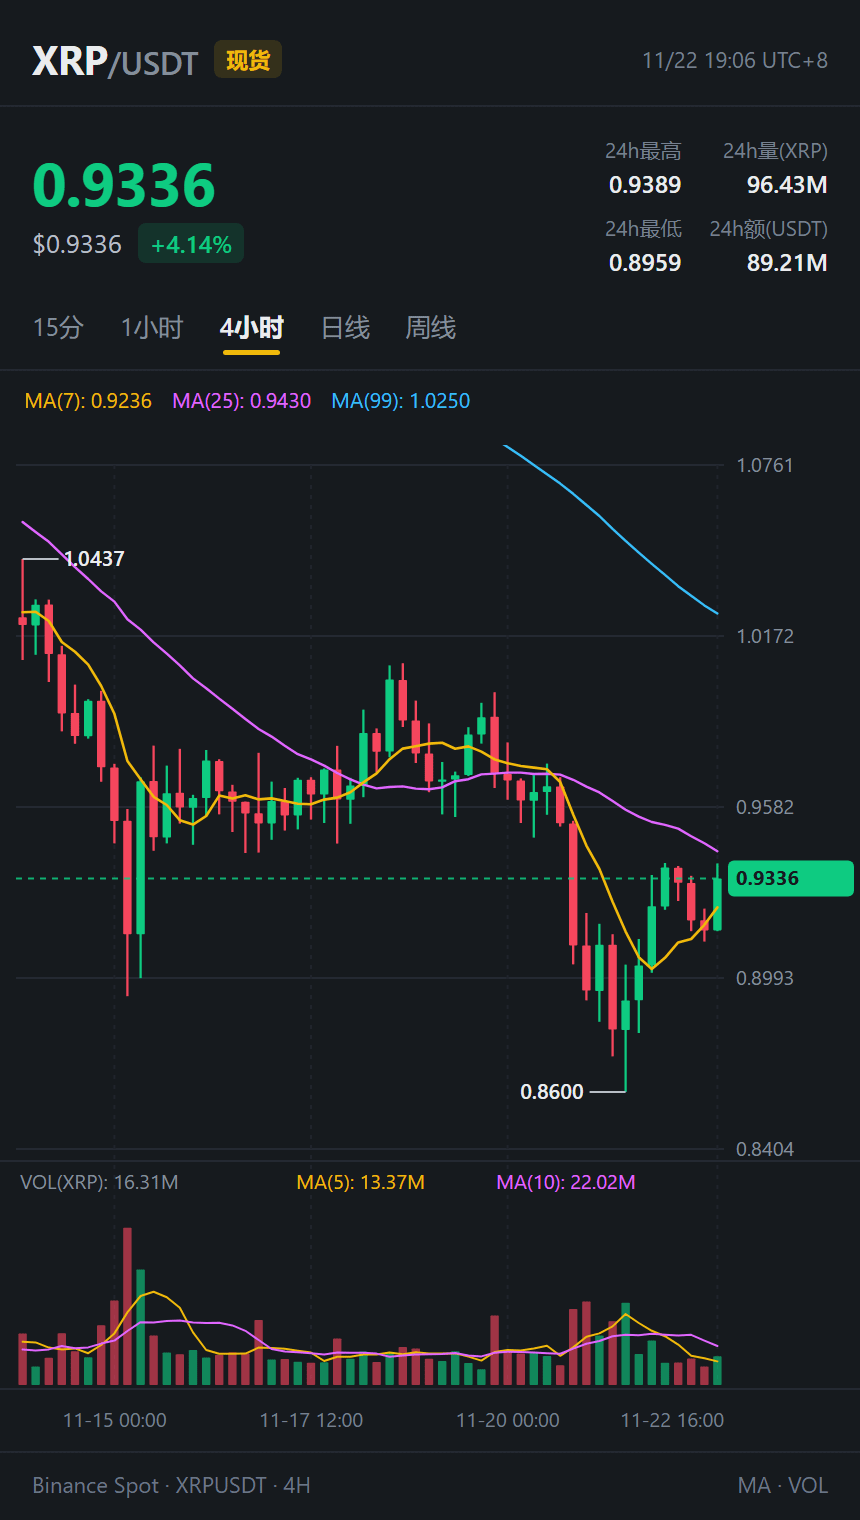
Switched to the 4-hour chart and had to laugh: yesterday it dropped to 0.8600, and when it retested 0.9118 around noon today, I thought this bounce was dead too. But by evening, this 4-hour candle quietly climbed back to 0.9336 (+4.14%). 24-hour trading volume was $89.21 million, and it reclaimed MA7 (0.9236)—just a hair away from the previous high of 0.9389 and MA25 (0.9430).
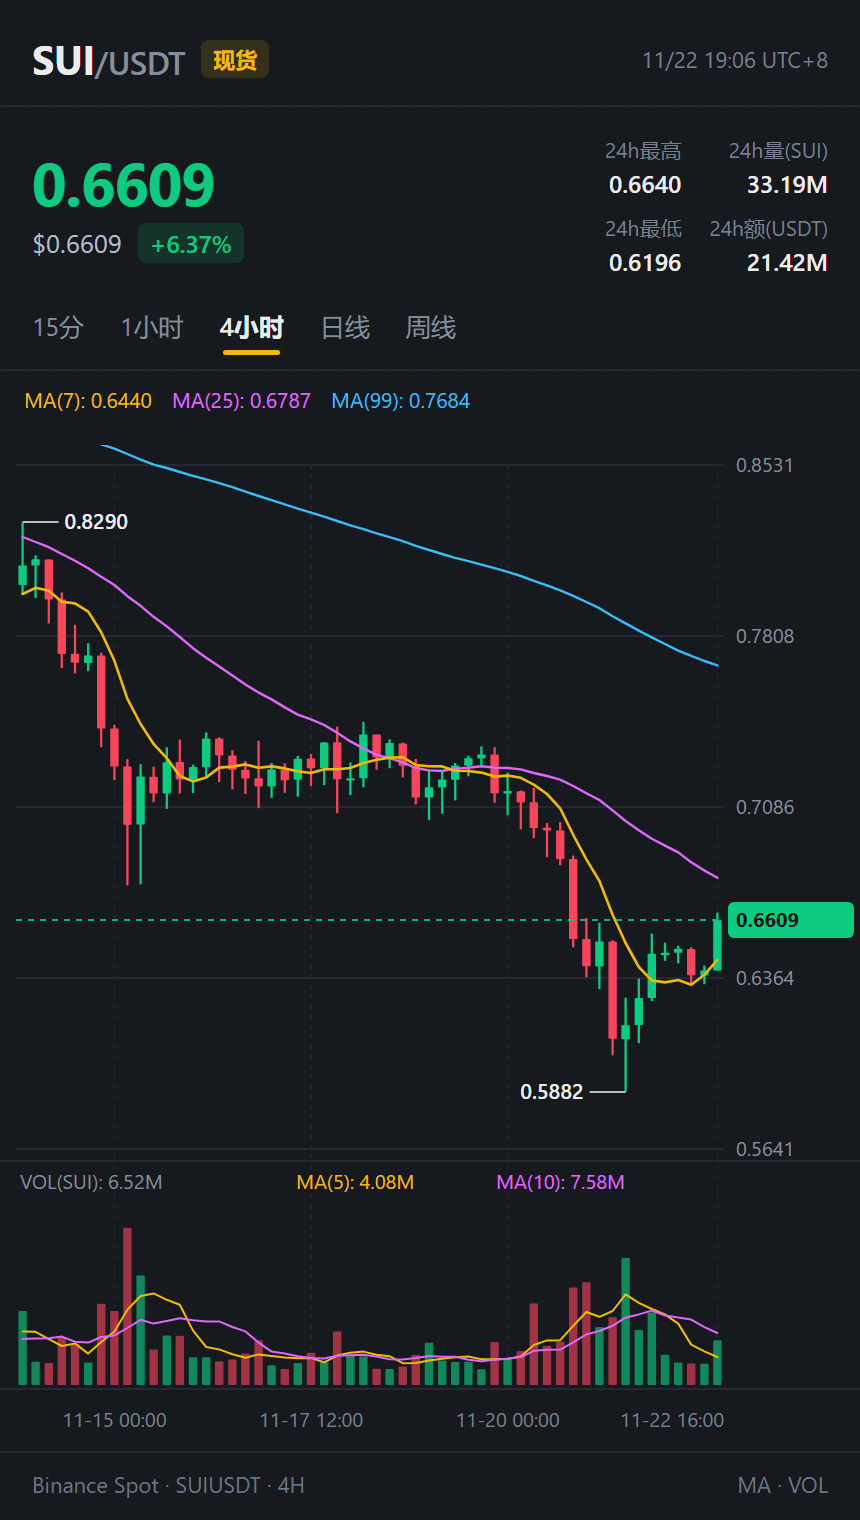
Meanwhile, $SUI was even more unreasonable. It traded sideways on low volume at 0.6337 around noon, looking fast asleep, then suddenly surged on rising volume to 0.6640. It’s now at 0.6609 (+6.37%), having casually taken out last night’s high, and it’s also just one step away from MA25 (0.6787).
People can shout about going short all they want; buyers will still step in when the chart says so. But both are facing resistance from the 4-hour MA25, so we’ll have to watch whether they can break through on strong volume tonight. Don’t get carried away and chase at resistance—DYOR.
#XRP #SUI #CryptoMarket
Just caught up on the overseas news—everyone’s talking about $XRP : spot ETFs saw $4.97 million in net outflows, futures liquidations hit $18 million, and even the chart comparing 2021 with today has been dragged out for another beating.
Switched to the 4-hour chart and had to laugh: yesterday it dropped to 0.8600, and when it retested 0.9118 around noon today, I thought this bounce was dead too. But by evening, this 4-hour candle quietly climbed back to 0.9336 (+4.14%). 24-hour trading volume was $89.21 million, and it reclaimed MA7 (0.9236)—just a hair away from the previous high of 0.9389 and MA25 (0.9430).
Meanwhile, $SUI was even more unreasonable. It traded sideways on low volume at 0.6337 around noon, looking fast asleep, then suddenly surged on rising volume to 0.6640. It’s now at 0.6609 (+6.37%), having casually taken out last night’s high, and it’s also just one step away from MA25 (0.6787).
People can shout about going short all they want; buyers will still step in when the chart says so. But both are facing resistance from the 4-hour MA25, so we’ll have to watch whether they can break through on strong volume tonight. Don’t get carried away and chase at resistance—DYOR.
#XRP #SUI #CryptoMarket
Switched to the 4-hour chart and had to laugh: yesterday it dropped to 0.8600, and when it retested 0.9118 around noon today, I thought this bounce was dead too. But by evening, this 4-hour candle quietly climbed back to 0.9336 (+4.14%). 24-hour trading volume was $89.21 million, and it reclaimed MA7 (0.9236)—just a hair away from the previous high of 0.9389 and MA25 (0.9430).
Meanwhile, $SUI was even more unreasonable. It traded sideways on low volume at 0.6337 around noon, looking fast asleep, then suddenly surged on rising volume to 0.6640. It’s now at 0.6609 (+6.37%), having casually taken out last night’s high, and it’s also just one step away from MA25 (0.6787).
People can shout about going short all they want; buyers will still step in when the chart says so. But both are facing resistance from the 4-hour MA25, so we’ll have to watch whether they can break through on strong volume tonight. Don’t get carried away and chase at resistance—DYOR.
#XRP #SUI #CryptoMarket
156
·
--
I was still staring at the charts in despair at noon, but when I switched back to the 15-minute chart tonight, I was stunned—today, all the money flowed into $HYPE and $UNI .
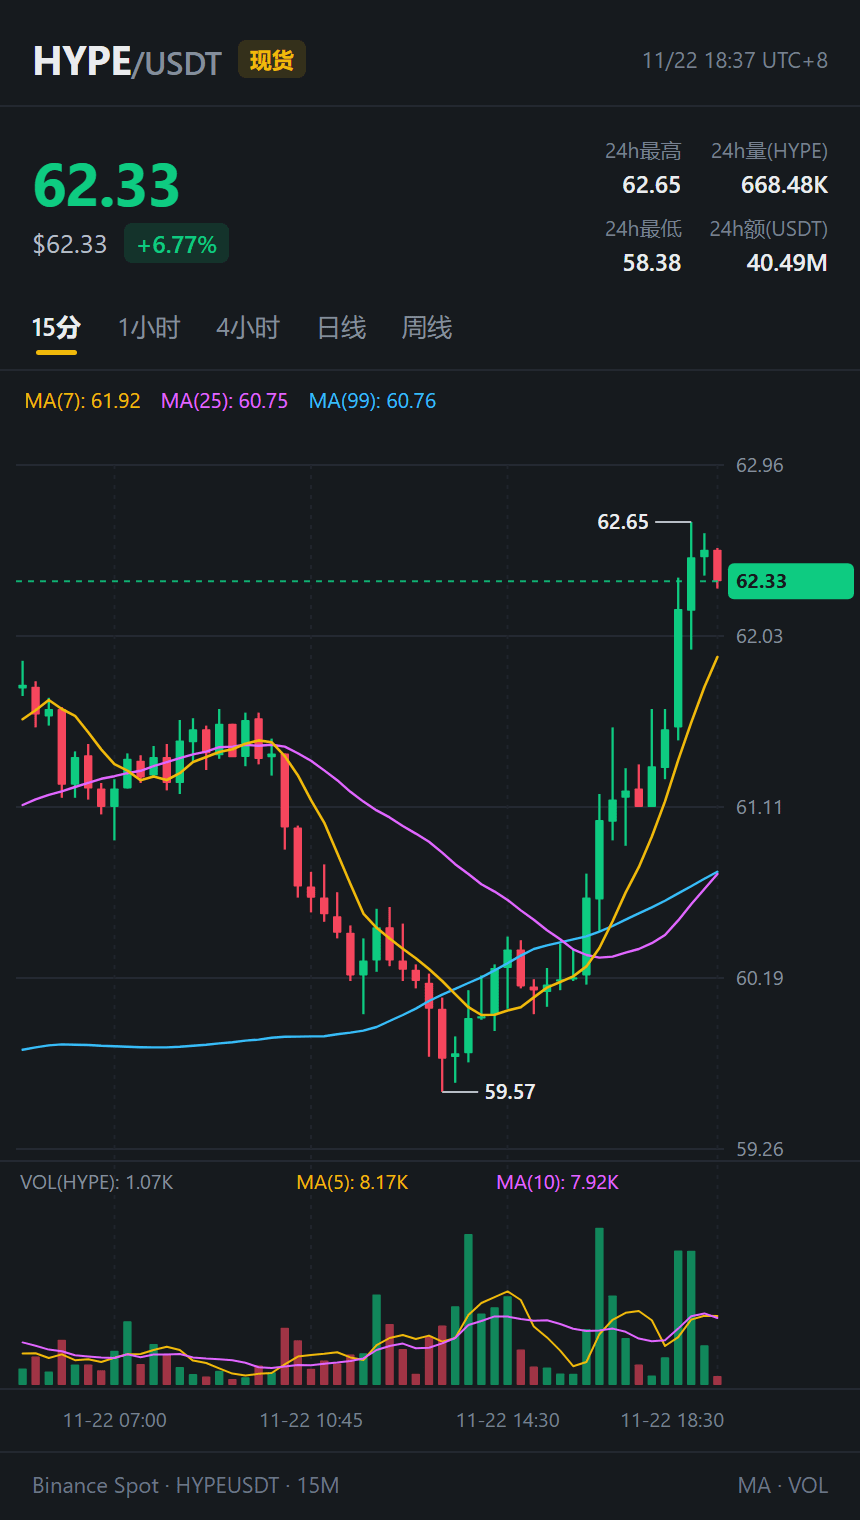
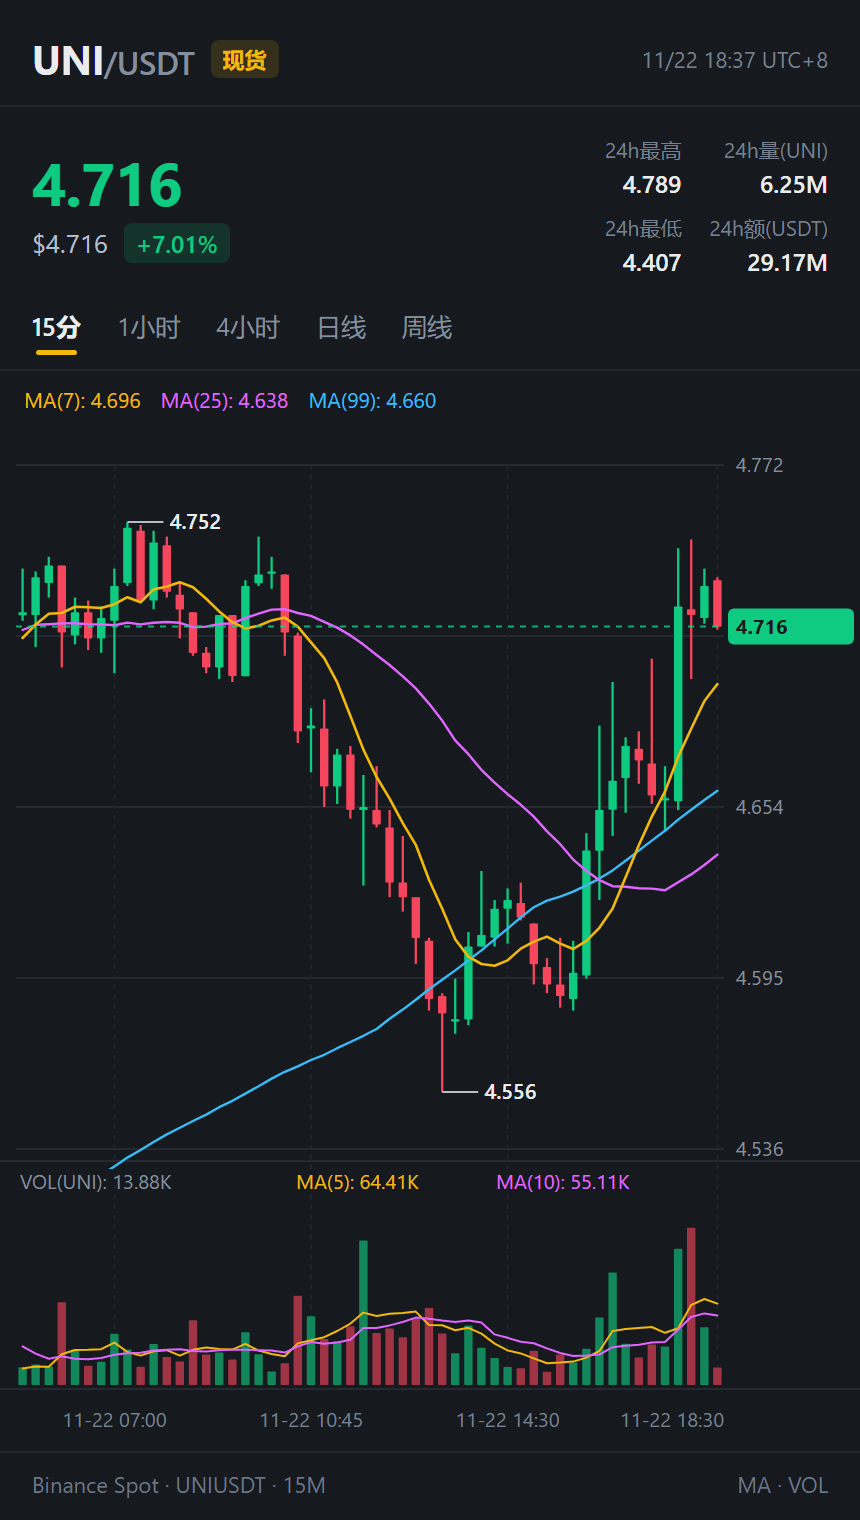
$HYPE slid steadily all afternoon, dropping to 59.57. It looked like it was about to keep sinking, but then, at 5:45 p.m., two 15-minute candles suddenly surged on heavy volume, reaching 62.65 in one go and setting a new 24-hour high. It’s now holding at 62.33 (24h +6.77%, trading volume 40.49 million U)—it’s practically a different coin. $UNI followed a similar pattern: after dipping to 4.556 in the afternoon, it rebounded to 4.716 (24h +7.01%, trading volume 29.17 million U), just shy of its morning high of 4.752.
But honestly, even though I’m tempted at these levels, I really don’t dare chase the rally. The latest 15-minute candle for $HYPE saw its volume shrink sharply after the spike, and the four-hour MA25 is still capping it at 63.81. $UNI also has its 24-hour high of 4.789 overhead. I’ll wait and see whether the 15-minute MA7 (61.92) can hold before deciding. No chasing highs—DYOR.
#HYPE #UNI #CryptoMarket
I was still staring at the charts in despair at noon, but when I switched back to the 15-minute chart tonight, I was stunned—today, all the money flowed into $HYPE and $UNI .
$HYPE slid steadily all afternoon, dropping to 59.57. It looked like it was about to keep sinking, but then, at 5:45 p.m., two 15-minute candles suddenly surged on heavy volume, reaching 62.65 in one go and setting a new 24-hour high. It’s now holding at 62.33 (24h +6.77%, trading volume 40.49 million U)—it’s practically a different coin. $UNI followed a similar pattern: after dipping to 4.556 in the afternoon, it rebounded to 4.716 (24h +7.01%, trading volume 29.17 million U), just shy of its morning high of 4.752.
But honestly, even though I’m tempted at these levels, I really don’t dare chase the rally. The latest 15-minute candle for $HYPE saw its volume shrink sharply after the spike, and the four-hour MA25 is still capping it at 63.81. $UNI also has its 24-hour high of 4.789 overhead. I’ll wait and see whether the 15-minute MA7 (61.92) can hold before deciding. No chasing highs—DYOR.
#HYPE #UNI #CryptoMarket
$HYPE slid steadily all afternoon, dropping to 59.57. It looked like it was about to keep sinking, but then, at 5:45 p.m., two 15-minute candles suddenly surged on heavy volume, reaching 62.65 in one go and setting a new 24-hour high. It’s now holding at 62.33 (24h +6.77%, trading volume 40.49 million U)—it’s practically a different coin. $UNI followed a similar pattern: after dipping to 4.556 in the afternoon, it rebounded to 4.716 (24h +7.01%, trading volume 29.17 million U), just shy of its morning high of 4.752.
But honestly, even though I’m tempted at these levels, I really don’t dare chase the rally. The latest 15-minute candle for $HYPE saw its volume shrink sharply after the spike, and the four-hour MA25 is still capping it at 63.81. $UNI also has its 24-hour high of 4.789 overhead. I’ll wait and see whether the 15-minute MA7 (61.92) can hold before deciding. No chasing highs—DYOR.
#HYPE #UNI #CryptoMarket
480
·
--
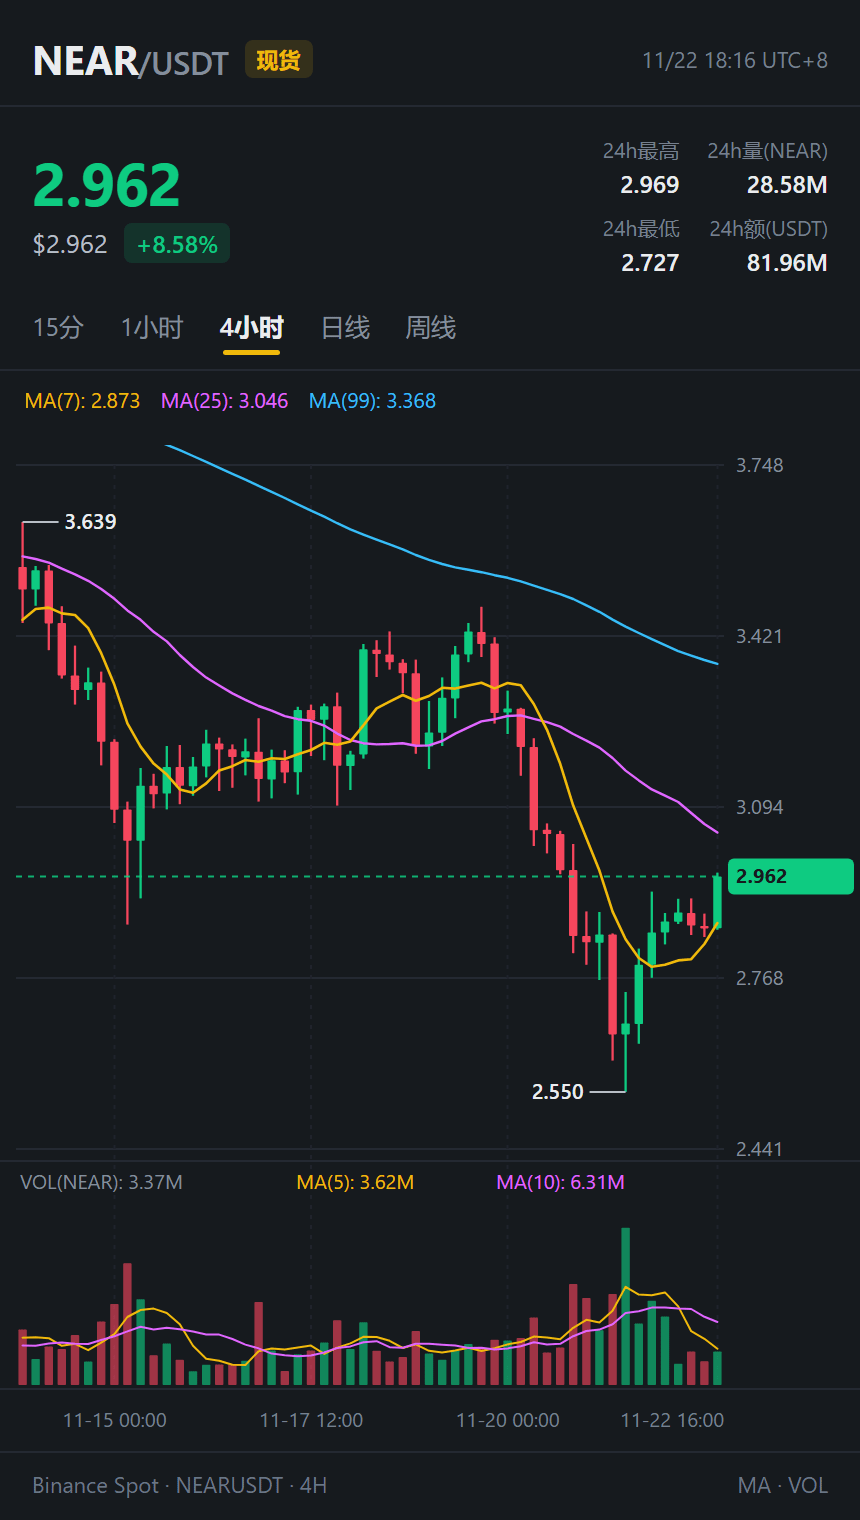
After dinner this evening, I checked the gainers list and nearly thought my eyes were playing tricks on me—the top spot on today’s spot-market leaderboard was $NEAR , up +8.58% in 24 hours to $2.962, with a trading volume of 81.96 million U. Yesterday, that sharp wick plunged to $2.55 and scared off a bunch of people. Just over a day later, the four-hour chart has climbed steadily along MA7, closing in on the $3 mark and MA25 (3.046). It’s showing real strength.
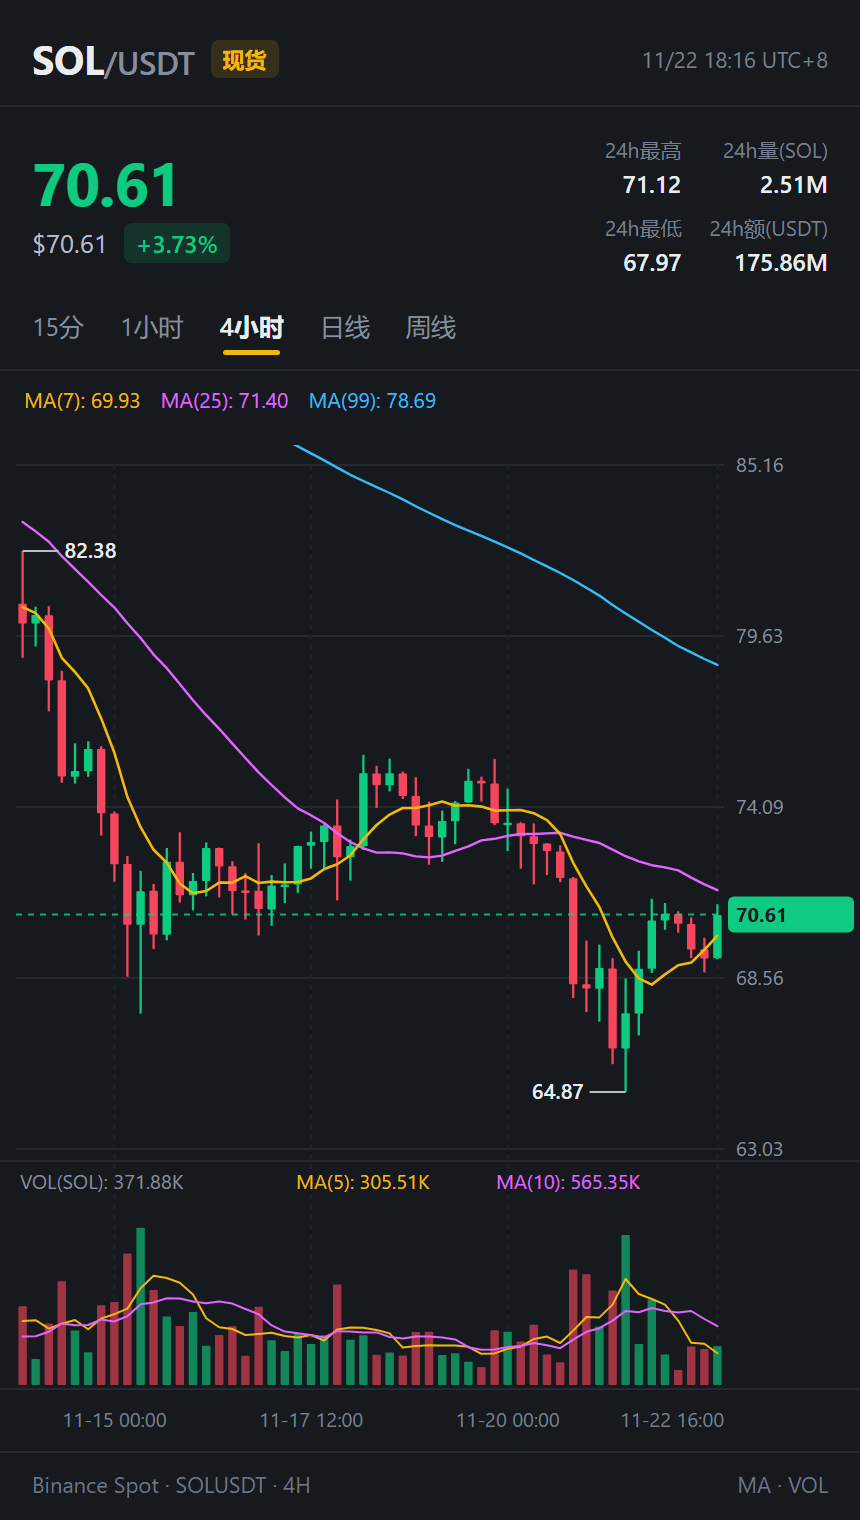
By contrast, $SOL , which I’ve been keeping an eye on, has been painfully sluggish. Its 24-hour trading volume hit 175 million U, putting it among the top three in the whole market, yet it’s up only +3.73%—almost at the bottom among major coins. Even $BTC getting back above $60,950 barely gave it a boost. The four-hour chart tells the story: after bouncing back from $64.87 yesterday, every time it gets near 71, MA25 (71.40) pushes it back down. This afternoon it nearly broke below 69 again. It’s been grinding away so long I feel like closing the app.
This rotation is being incredibly selective. The strong coins are pushing higher along their moving averages, while the weak ones are going nowhere despite heavy trading volume. I really don’t want to chase blindly. I’ll wait and see whether it can break and hold above these two hurdles—$3 and 71.4—with volume. (Not investment advice.)
#加密市场 #NEAR #SOL
After dinner this evening, I checked the gainers list and nearly thought my eyes were playing tricks on me—the top spot on today’s spot-market leaderboard was $NEAR , up +8.58% in 24 hours to $2.962, with a trading volume of 81.96 million U. Yesterday, that sharp wick plunged to $2.55 and scared off a bunch of people. Just over a day later, the four-hour chart has climbed steadily along MA7, closing in on the $3 mark and MA25 (3.046). It’s showing real strength.
By contrast, $SOL , which I’ve been keeping an eye on, has been painfully sluggish. Its 24-hour trading volume hit 175 million U, putting it among the top three in the whole market, yet it’s up only +3.73%—almost at the bottom among major coins. Even $BTC getting back above $60,950 barely gave it a boost. The four-hour chart tells the story: after bouncing back from $64.87 yesterday, every time it gets near 71, MA25 (71.40) pushes it back down. This afternoon it nearly broke below 69 again. It’s been grinding away so long I feel like closing the app.
This rotation is being incredibly selective. The strong coins are pushing higher along their moving averages, while the weak ones are going nowhere despite heavy trading volume. I really don’t want to chase blindly. I’ll wait and see whether it can break and hold above these two hurdles—$3 and 71.4—with volume. (Not investment advice.)
#加密市场 #NEAR #SOL
By contrast, $SOL , which I’ve been keeping an eye on, has been painfully sluggish. Its 24-hour trading volume hit 175 million U, putting it among the top three in the whole market, yet it’s up only +3.73%—almost at the bottom among major coins. Even $BTC getting back above $60,950 barely gave it a boost. The four-hour chart tells the story: after bouncing back from $64.87 yesterday, every time it gets near 71, MA25 (71.40) pushes it back down. This afternoon it nearly broke below 69 again. It’s been grinding away so long I feel like closing the app.
This rotation is being incredibly selective. The strong coins are pushing higher along their moving averages, while the weak ones are going nowhere despite heavy trading volume. I really don’t want to chase blindly. I’ll wait and see whether it can break and hold above these two hurdles—$3 and 71.4—with volume. (Not investment advice.)
#加密市场 #NEAR #SOL
315
·
--
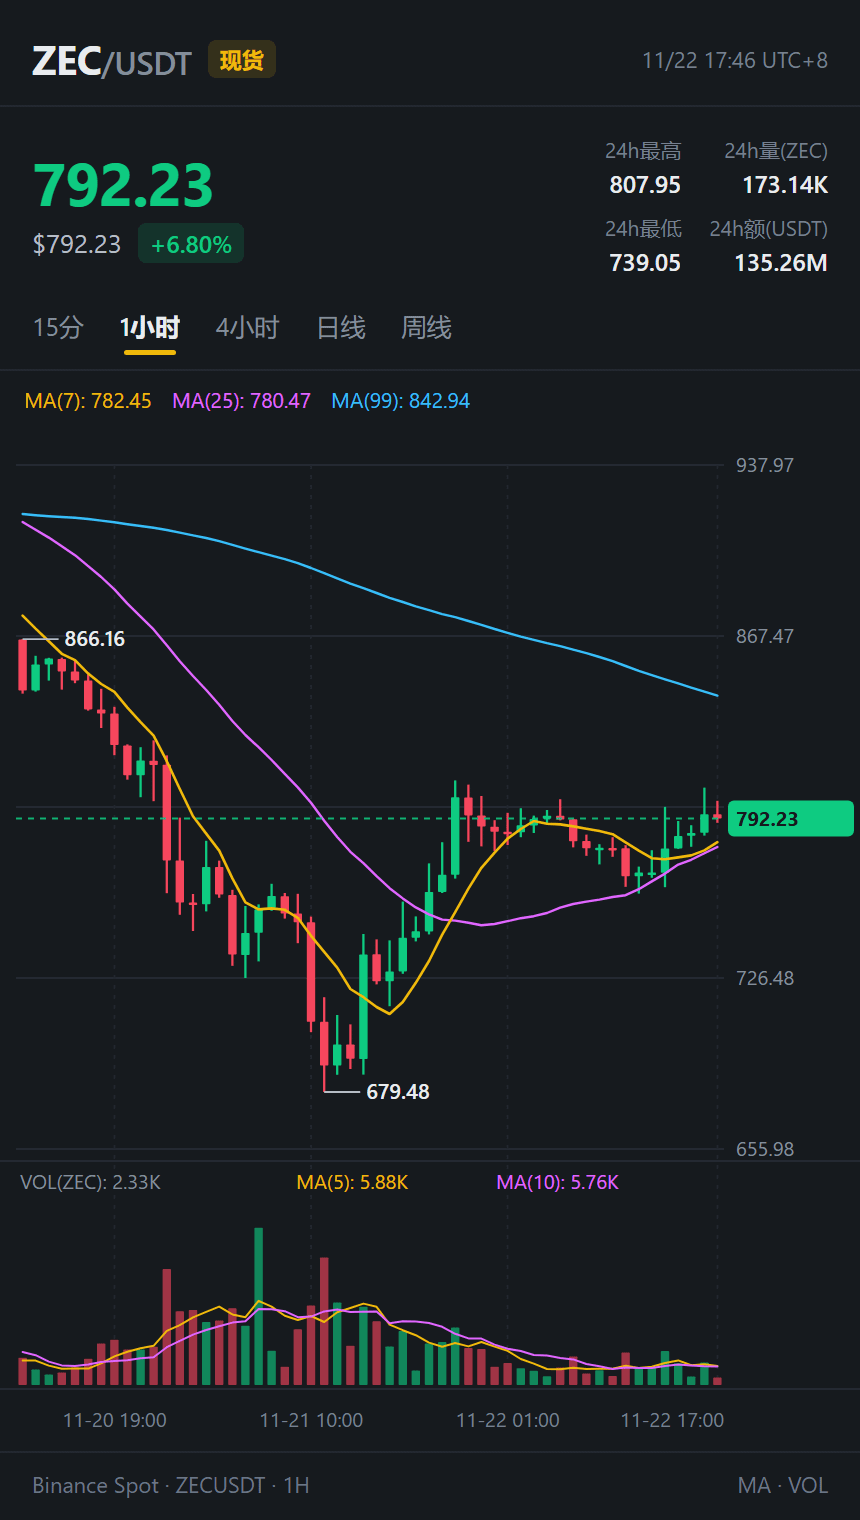
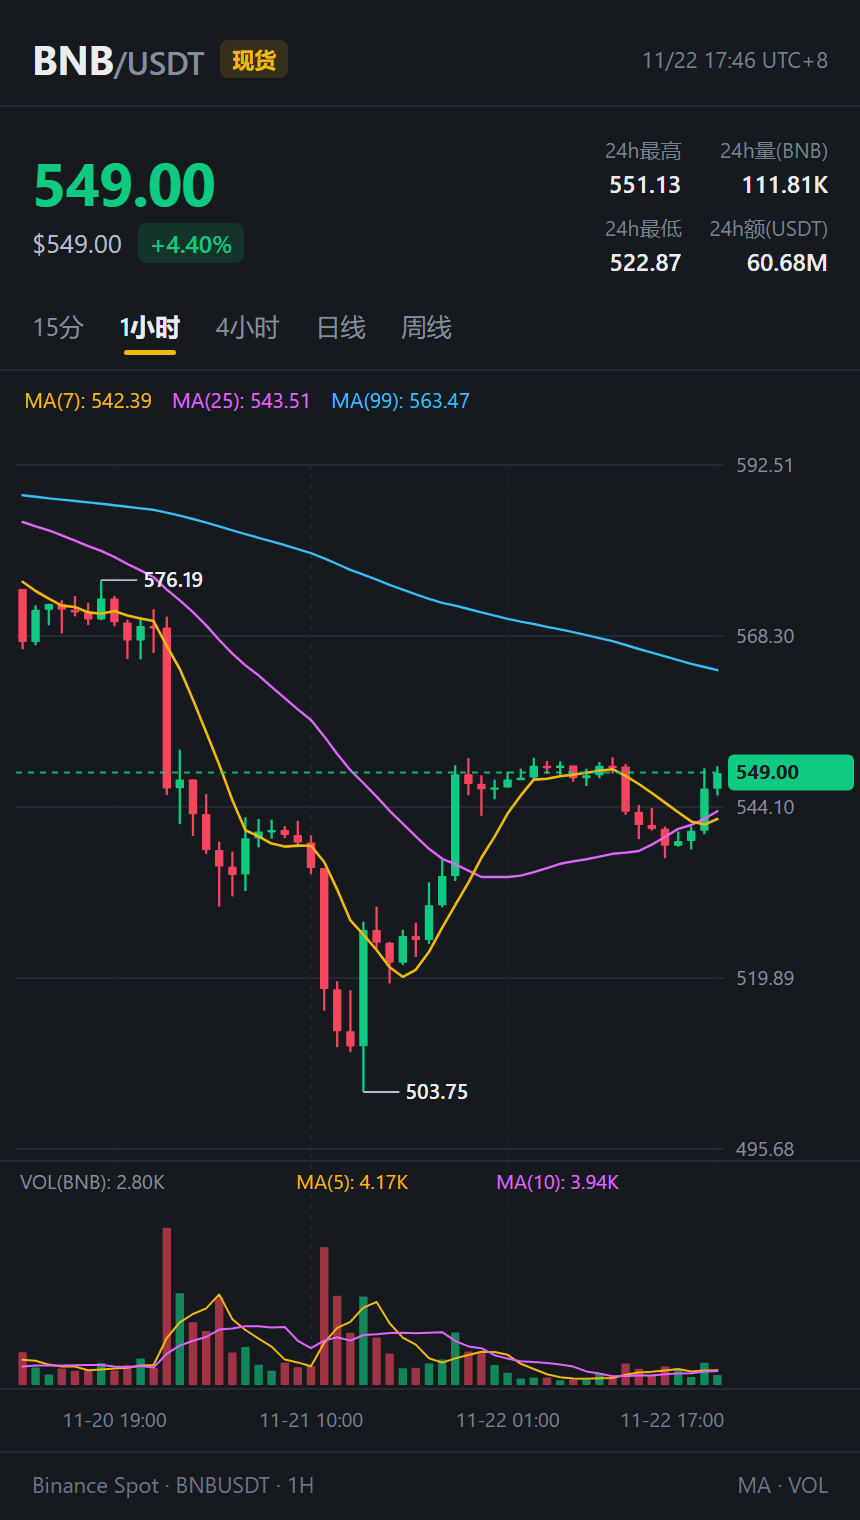
Just skimmed through the discussions, and everyone’s complaining about $ZEC breaking below 700 and digging up old posts to mock the people who previously called for 1600. The mood is colder than an ice cellar. But then I switched back to the 1-hour chart: yesterday it dipped as low as 679.48, and now it’s quietly climbed back to around 792. It’s up nearly 7% in 24 hours, with spot trading volume reaching $135 million, ranking in the site’s top four.
This is the kind of price action that really messes with your head: people can complain all they want, but when it carves out a deep bottom, whoever hesitates ends up kicking themselves. Still, I wouldn’t dare chase it at this level. It hit 807.95 last night and got pushed back down, while the 1-hour MA99 is still overhead around 843. This afternoon’s rebound came on much lower volume than yesterday’s sell-off, so we’ll need to watch a couple more candles to see if it can hold above 800.
Meanwhile, $BNB has been quietly doing its thing too. It plunged to 503.75 the day before yesterday, giving everyone a scare. Today at noon it retested around 536 and shook out some holders; then two bullish candles in the afternoon brought it back up to 549, just a couple of bucks below its 24-hour high of 551.13. Bitcoin is holding steady just above 60,000. These low-volume rebounds are the most agonizing, so keep a close eye on the 800 and 551 hurdles for now. Wait for a high-volume breakout before making a move—don’t force it at resistance. Not investment advice. DYOR.
#ZEC #BNB #CryptoMarket
Just skimmed through the discussions, and everyone’s complaining about $ZEC breaking below 700 and digging up old posts to mock the people who previously called for 1600. The mood is colder than an ice cellar. But then I switched back to the 1-hour chart: yesterday it dipped as low as 679.48, and now it’s quietly climbed back to around 792. It’s up nearly 7% in 24 hours, with spot trading volume reaching $135 million, ranking in the site’s top four.
This is the kind of price action that really messes with your head: people can complain all they want, but when it carves out a deep bottom, whoever hesitates ends up kicking themselves. Still, I wouldn’t dare chase it at this level. It hit 807.95 last night and got pushed back down, while the 1-hour MA99 is still overhead around 843. This afternoon’s rebound came on much lower volume than yesterday’s sell-off, so we’ll need to watch a couple more candles to see if it can hold above 800.
Meanwhile, $BNB has been quietly doing its thing too. It plunged to 503.75 the day before yesterday, giving everyone a scare. Today at noon it retested around 536 and shook out some holders; then two bullish candles in the afternoon brought it back up to 549, just a couple of bucks below its 24-hour high of 551.13. Bitcoin is holding steady just above 60,000. These low-volume rebounds are the most agonizing, so keep a close eye on the 800 and 551 hurdles for now. Wait for a high-volume breakout before making a move—don’t force it at resistance. Not investment advice. DYOR.
#ZEC #BNB #CryptoMarket
This is the kind of price action that really messes with your head: people can complain all they want, but when it carves out a deep bottom, whoever hesitates ends up kicking themselves. Still, I wouldn’t dare chase it at this level. It hit 807.95 last night and got pushed back down, while the 1-hour MA99 is still overhead around 843. This afternoon’s rebound came on much lower volume than yesterday’s sell-off, so we’ll need to watch a couple more candles to see if it can hold above 800.
Meanwhile, $BNB has been quietly doing its thing too. It plunged to 503.75 the day before yesterday, giving everyone a scare. Today at noon it retested around 536 and shook out some holders; then two bullish candles in the afternoon brought it back up to 549, just a couple of bucks below its 24-hour high of 551.13. Bitcoin is holding steady just above 60,000. These low-volume rebounds are the most agonizing, so keep a close eye on the 800 and 551 hurdles for now. Wait for a high-volume breakout before making a move—don’t force it at resistance. Not investment advice. DYOR.
#ZEC #BNB #CryptoMarket
309
·
--
Article
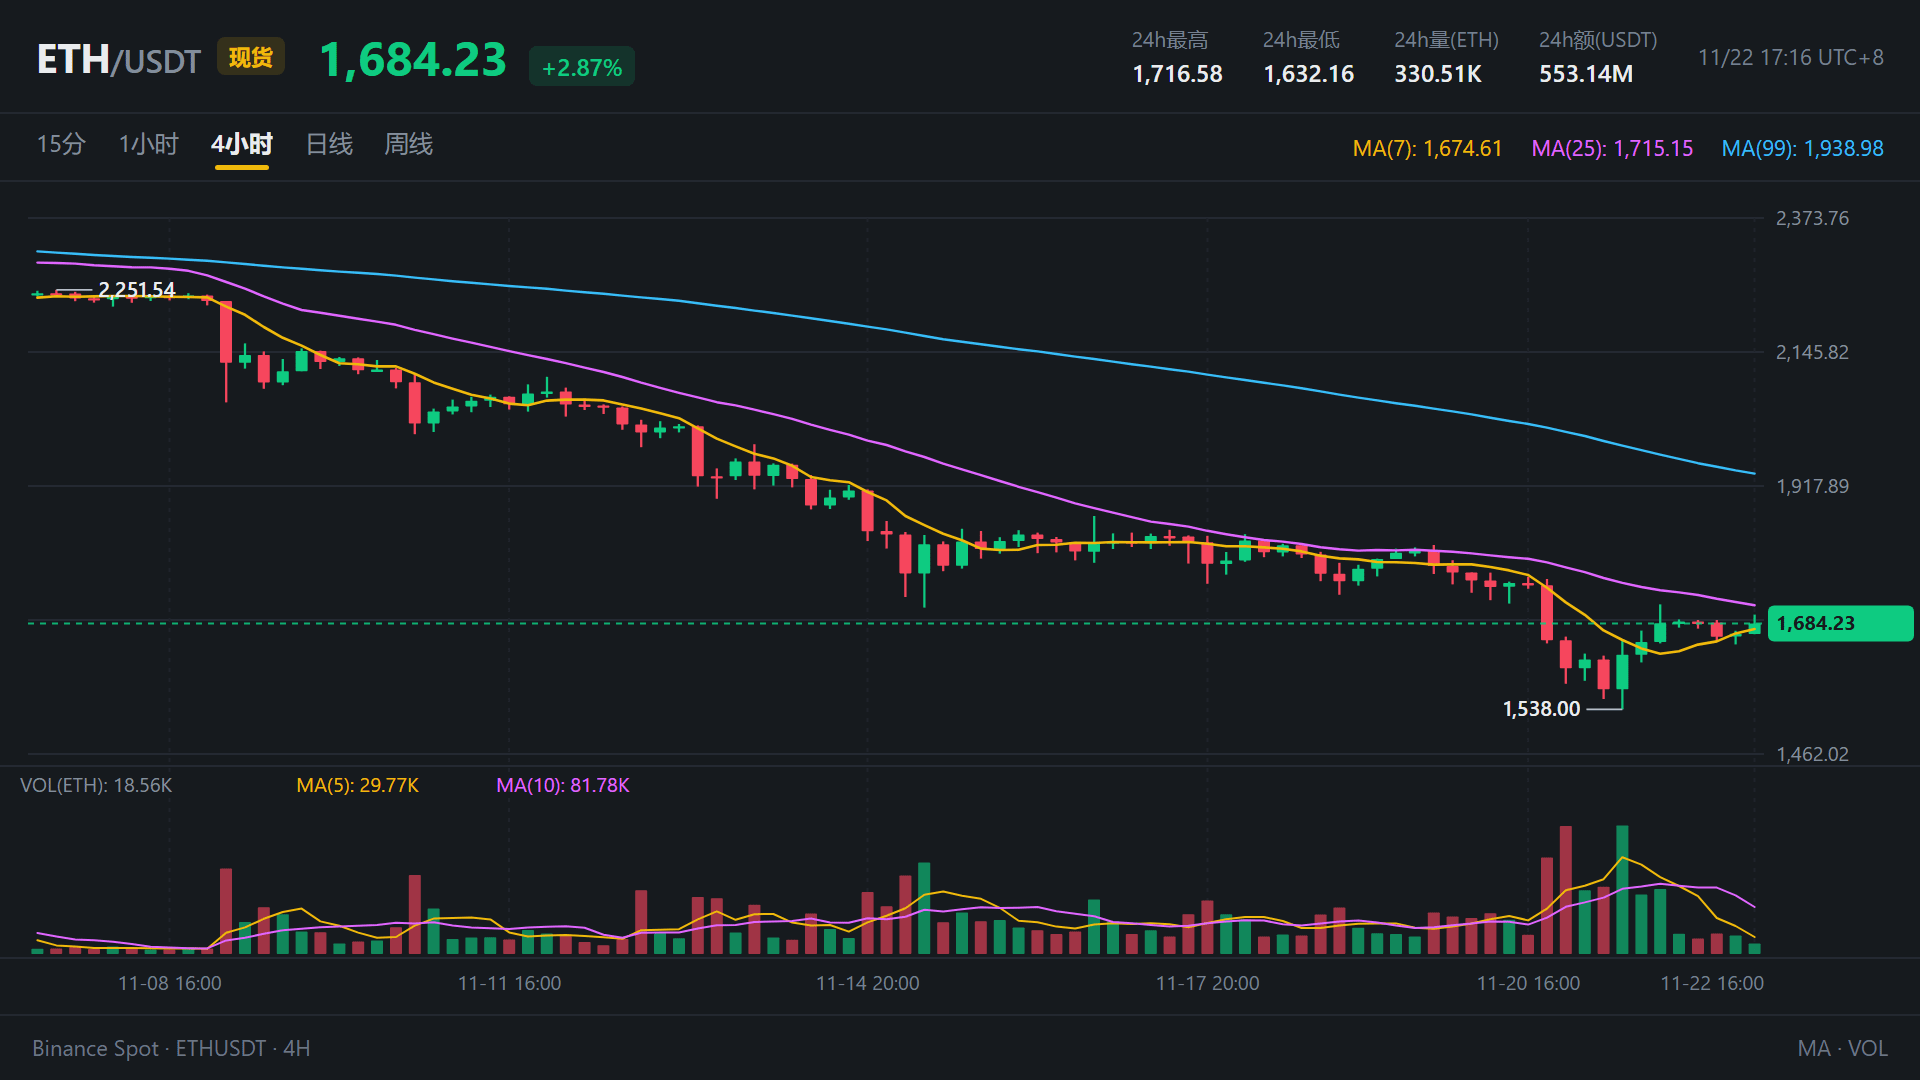
From 2,251 to 1,538 in half a month—looking at ETH’s four-hour chart really stingsI was planning to take it easy and not look at the charts on Sunday afternoon, but I couldn’t help myself—I zoomed out on the $ETH four-hour chart, saw the November 8 high of 2,251.54 in the upper-left corner, then looked at the 1,538.00 it had just plunged to over the past couple of days. It really left a knot in my stomach. It shed more than 700 bucks in just two weeks. A drawdown of over 30% is something very few people can stomach with a smile, even among the major coins.
The most brutal part wasn’t even the steady slide—it was that stretch of “false stability” in the middle. On the 13th and 14th, it plunged straight through 1,730 from 2,021 over two days, and plenty of people had already sold their positions. Then from the 15th to the 19th, it crept back into the 1,730–1,867 range and churned there for five days. The candlesticks hugged the moving averages, looking calm and steady. A lot of people who’d just cut their losses were kicking themselves and buying back in, thinking the worst was finally over. Then on the 20th, a huge bearish candle crashed straight through 1,600 on heavy volume, with daily trading volume hitting $1.11 billion. On the 21st, it took another leg down to 1,538. Just when you think the floor is solid and you can finally relax, it collapses beneath you.
From 2,251 to 1,538 in half a month—looking at ETH’s four-hour chart really stings
I was planning to take it easy and not look at the charts on Sunday afternoon, but I couldn’t help myself—I zoomed out on the $ETH four-hour chart, saw the November 8 high of 2,251.54 in the upper-left corner, then looked at the 1,538.00 it had just plunged to over the past couple of days. It really left a knot in my stomach. It shed more than 700 bucks in just two weeks. A drawdown of over 30% is something very few people can stomach with a smile, even among the major coins.
The most brutal part wasn’t even the steady slide—it was that stretch of “false stability” in the middle. On the 13th and 14th, it plunged straight through 1,730 from 2,021 over two days, and plenty of people had already sold their positions. Then from the 15th to the 19th, it crept back into the 1,730–1,867 range and churned there for five days. The candlesticks hugged the moving averages, looking calm and steady. A lot of people who’d just cut their losses were kicking themselves and buying back in, thinking the worst was finally over. Then on the 20th, a huge bearish candle crashed straight through 1,600 on heavy volume, with daily trading volume hitting $1.11 billion. On the 21st, it took another leg down to 1,538. Just when you think the floor is solid and you can finally relax, it collapses beneath you.
The most brutal part wasn’t even the steady slide—it was that stretch of “false stability” in the middle. On the 13th and 14th, it plunged straight through 1,730 from 2,021 over two days, and plenty of people had already sold their positions. Then from the 15th to the 19th, it crept back into the 1,730–1,867 range and churned there for five days. The candlesticks hugged the moving averages, looking calm and steady. A lot of people who’d just cut their losses were kicking themselves and buying back in, thinking the worst was finally over. Then on the 20th, a huge bearish candle crashed straight through 1,600 on heavy volume, with daily trading volume hitting $1.11 billion. On the 21st, it took another leg down to 1,538. Just when you think the floor is solid and you can finally relax, it collapses beneath you.
262
·
--
I was just complaining that the afternoon market was so dead it felt like a power outage, and then the 15-minute chart pulled a huge move out of nowhere—I nearly spilled the water in my hand.
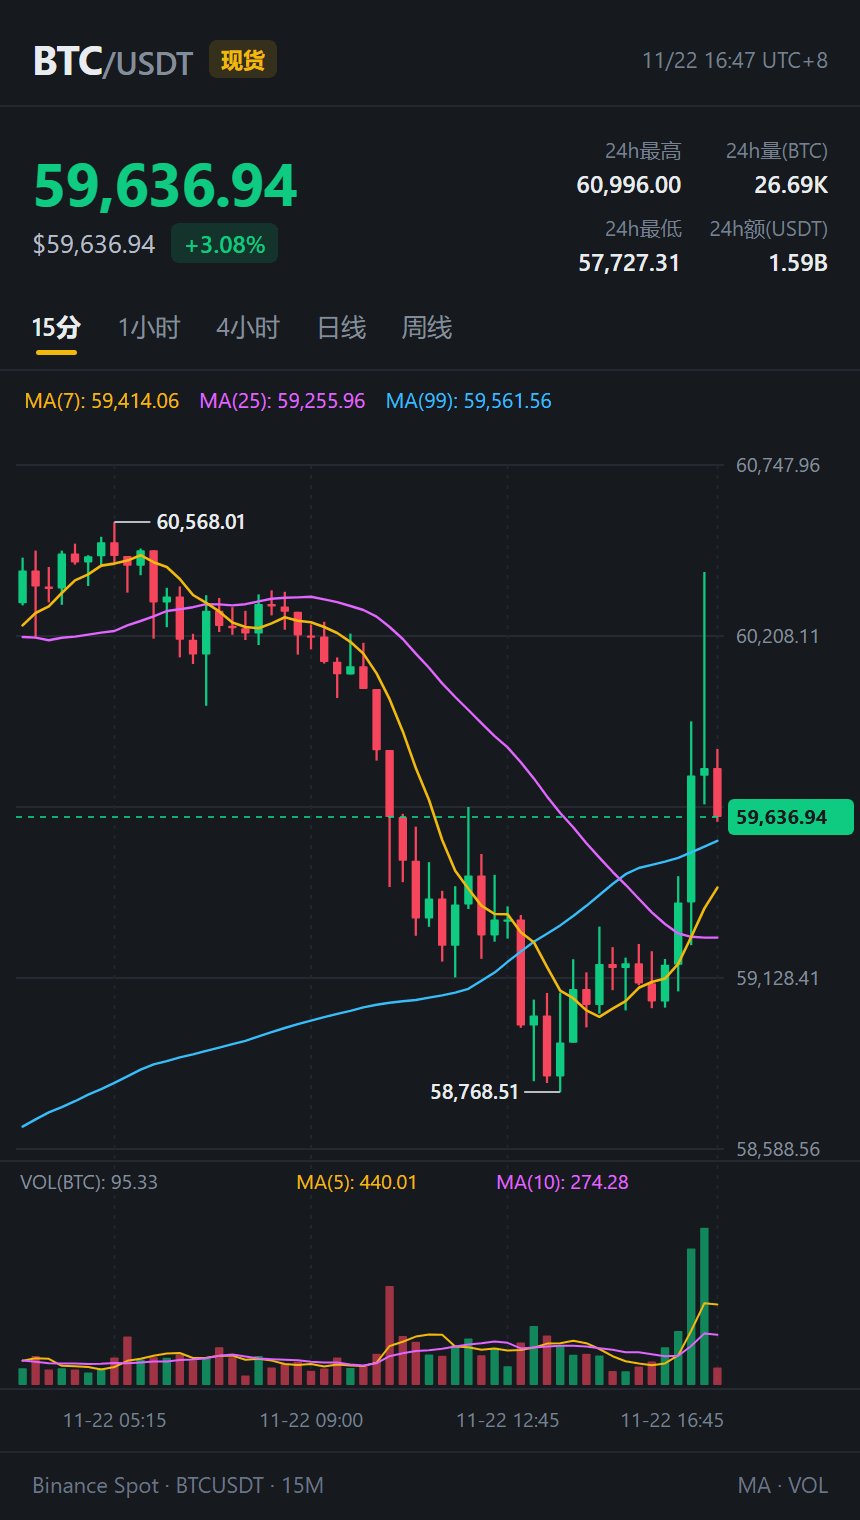
Those two 15-minute candles just after four had my blood pressure through the roof: $BTC suddenly shot straight up from around 59,100, racking up nearly $100 million in volume in half an hour and surging all the way to 60,410! I was wondering if it might finally hold above 60,000, when the very next moment a long upper wick slapped it right back down to 59,636 (24h +3.08%, volume $1.59 billion). Turns out the whole 60,000 level was stacked with short sellers lying in wait and people looking to break even—the price just touched it and got smacked back down. A total bull trap.
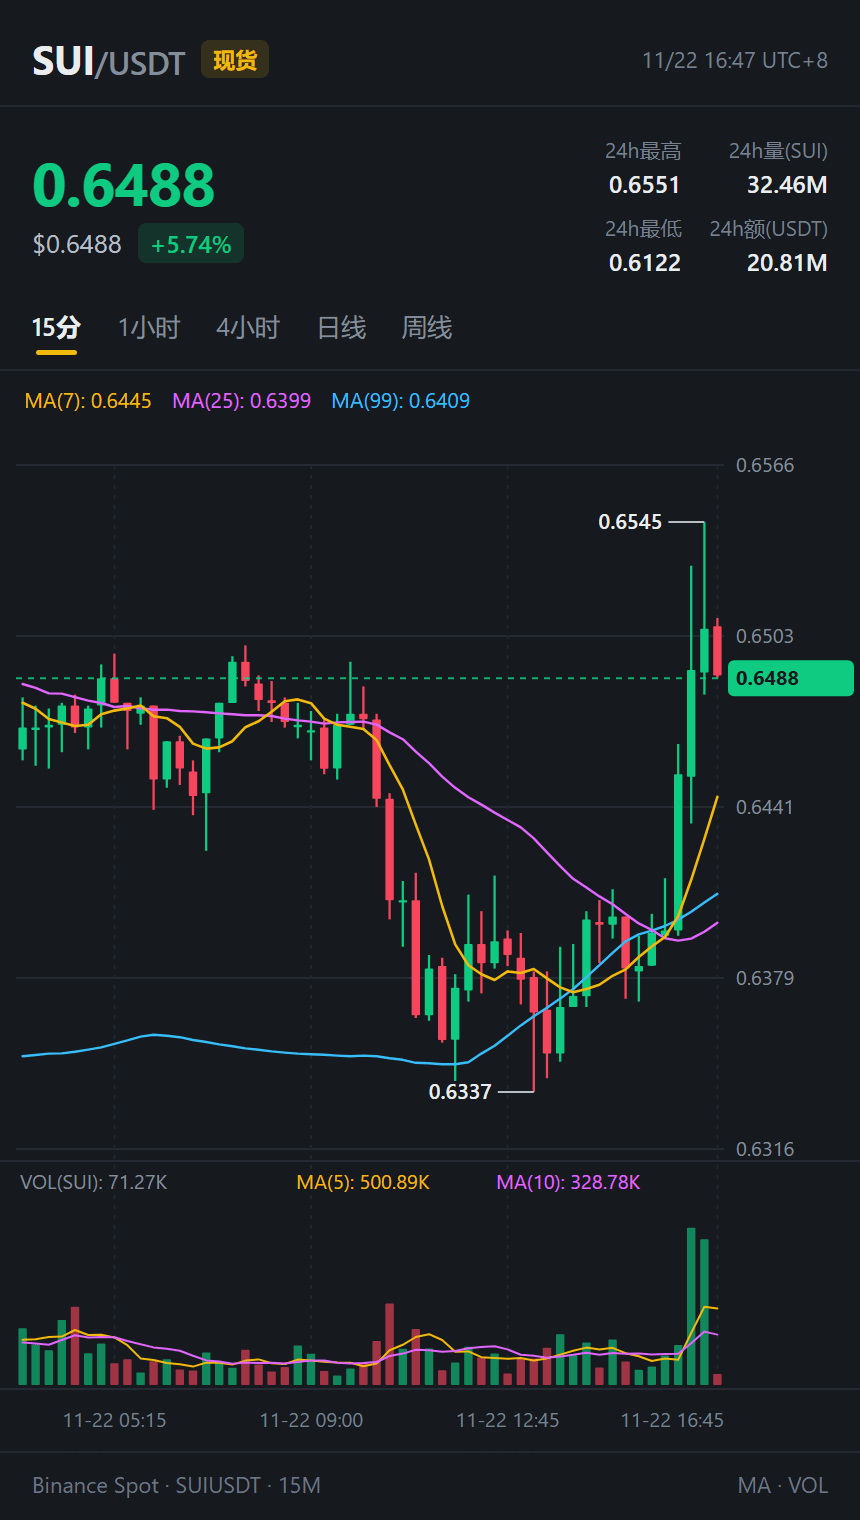
The most aggressive follower was $SUI, which shot up from an afternoon low of 0.6337 to 0.6545, just 0.0006 shy of its 24-hour high of 0.6551. It looked ready to break the high, then lost steam and slipped back to 0.6488 (24h +5.74%, volume $20.81 million). $DOGE was acting wild too, jumping to 0.05521 before sliding back to 0.05485 (24h +3.98%)—it couldn't even hold 0.055 for long.
These sudden 15-minute spikes on heavy volume that quickly reverse are the most treacherous kind of move. Chase them and you can be left hanging on the tip of a lightning rod in no time. Anyway, I don't dare jump into this emotional surge right now. If Bitcoin can't hold 60,000 and drops below the line around 59,560 at MA99 again, it could easily retest lower levels and shake everyone out once more. I'll keep my hands off the keyboard and watch from the sidelines for now.
#BTC #SUI #TradingLife
I was just complaining that the afternoon market was so dead it felt like a power outage, and then the 15-minute chart pulled a huge move out of nowhere—I nearly spilled the water in my hand.
Those two 15-minute candles just after four had my blood pressure through the roof: $BTC suddenly shot straight up from around 59,100, racking up nearly $100 million in volume in half an hour and surging all the way to 60,410! I was wondering if it might finally hold above 60,000, when the very next moment a long upper wick slapped it right back down to 59,636 (24h +3.08%, volume $1.59 billion). Turns out the whole 60,000 level was stacked with short sellers lying in wait and people looking to break even—the price just touched it and got smacked back down. A total bull trap.
The most aggressive follower was $SUI , which shot up from an afternoon low of 0.6337 to 0.6545, just 0.0006 shy of its 24-hour high of 0.6551. It looked ready to break the high, then lost steam and slipped back to 0.6488 (24h +5.74%, volume $20.81 million). $DOGE was acting wild too, jumping to 0.05521 before sliding back to 0.05485 (24h +3.98%)—it couldn't even hold 0.055 for long.
These sudden 15-minute spikes on heavy volume that quickly reverse are the most treacherous kind of move. Chase them and you can be left hanging on the tip of a lightning rod in no time. Anyway, I don't dare jump into this emotional surge right now. If Bitcoin can't hold 60,000 and drops below the line around 59,560 at MA99 again, it could easily retest lower levels and shake everyone out once more. I'll keep my hands off the keyboard and watch from the sidelines for now.
#BTC #SUI #TradingLife
Those two 15-minute candles just after four had my blood pressure through the roof: $BTC suddenly shot straight up from around 59,100, racking up nearly $100 million in volume in half an hour and surging all the way to 60,410! I was wondering if it might finally hold above 60,000, when the very next moment a long upper wick slapped it right back down to 59,636 (24h +3.08%, volume $1.59 billion). Turns out the whole 60,000 level was stacked with short sellers lying in wait and people looking to break even—the price just touched it and got smacked back down. A total bull trap.
The most aggressive follower was $SUI , which shot up from an afternoon low of 0.6337 to 0.6545, just 0.0006 shy of its 24-hour high of 0.6551. It looked ready to break the high, then lost steam and slipped back to 0.6488 (24h +5.74%, volume $20.81 million). $DOGE was acting wild too, jumping to 0.05521 before sliding back to 0.05485 (24h +3.98%)—it couldn't even hold 0.055 for long.
These sudden 15-minute spikes on heavy volume that quickly reverse are the most treacherous kind of move. Chase them and you can be left hanging on the tip of a lightning rod in no time. Anyway, I don't dare jump into this emotional surge right now. If Bitcoin can't hold 60,000 and drops below the line around 59,560 at MA99 again, it could easily retest lower levels and shake everyone out once more. I'll keep my hands off the keyboard and watch from the sidelines for now.
#BTC #SUI #TradingLife
443
·
--
It wasn’t until I switched to the daily chart for a review that I realized the most painful part of this move wasn’t Bitcoin at all—it was a few familiar names in my portfolio.
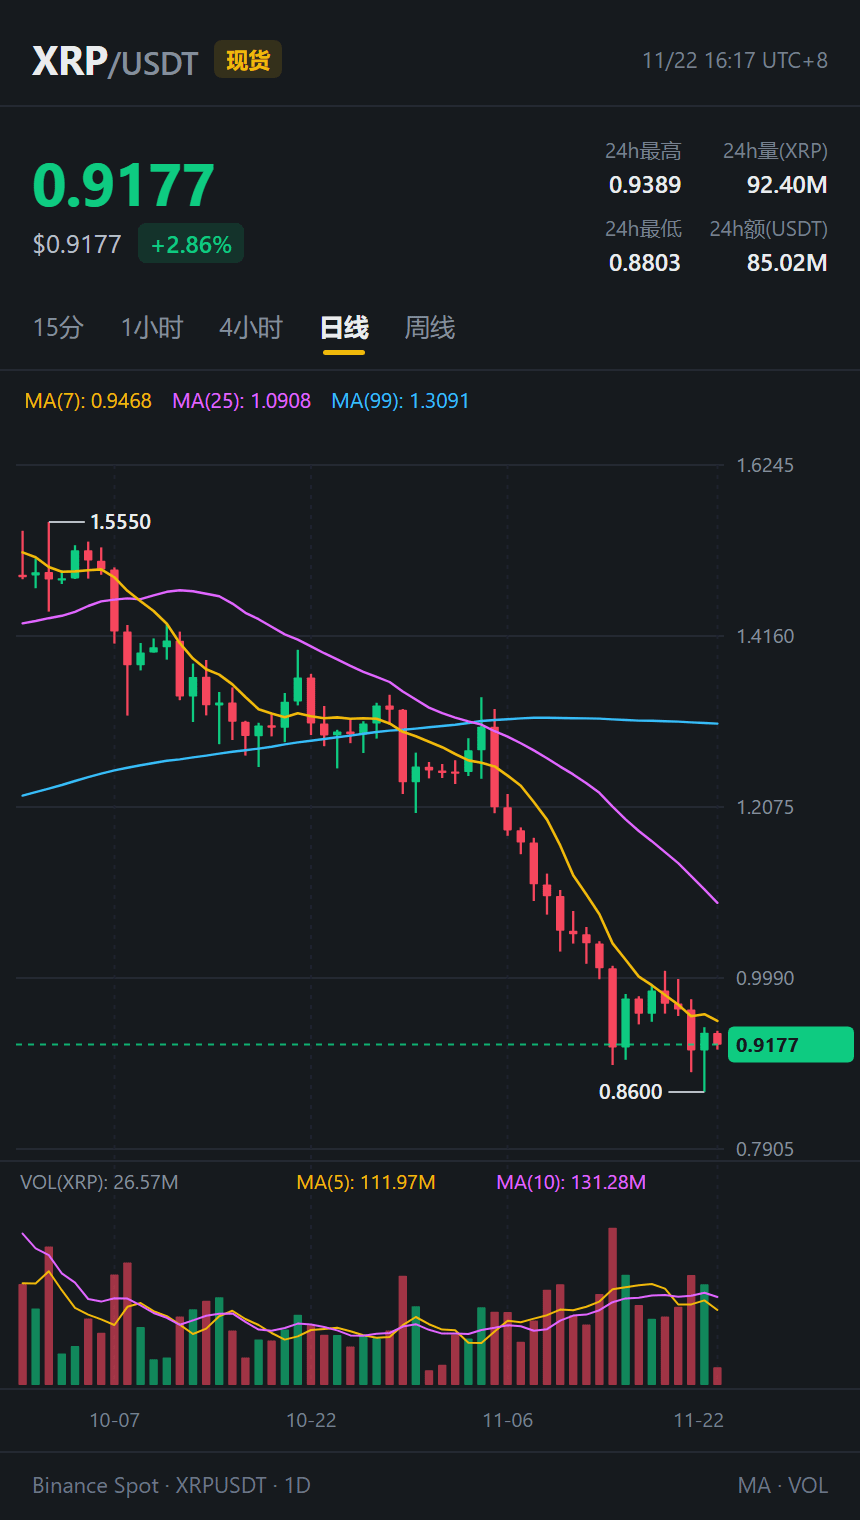
Just looking at $XRP makes me mad. It was still hovering around 1.555 last month, then steadily slid lower. A few days ago, it finally managed to touch 1.0078, only to plunge straight to 0.8600 yesterday. It’s bounced back to 0.9177 now (24h +2.86%, trading volume $85 million), but the 7-day moving average on the daily chart is still overhead at 0.9468. It may look like it’s just a few cents away from $1, but once it really rallies, there’ll be plenty of people selling to break even.
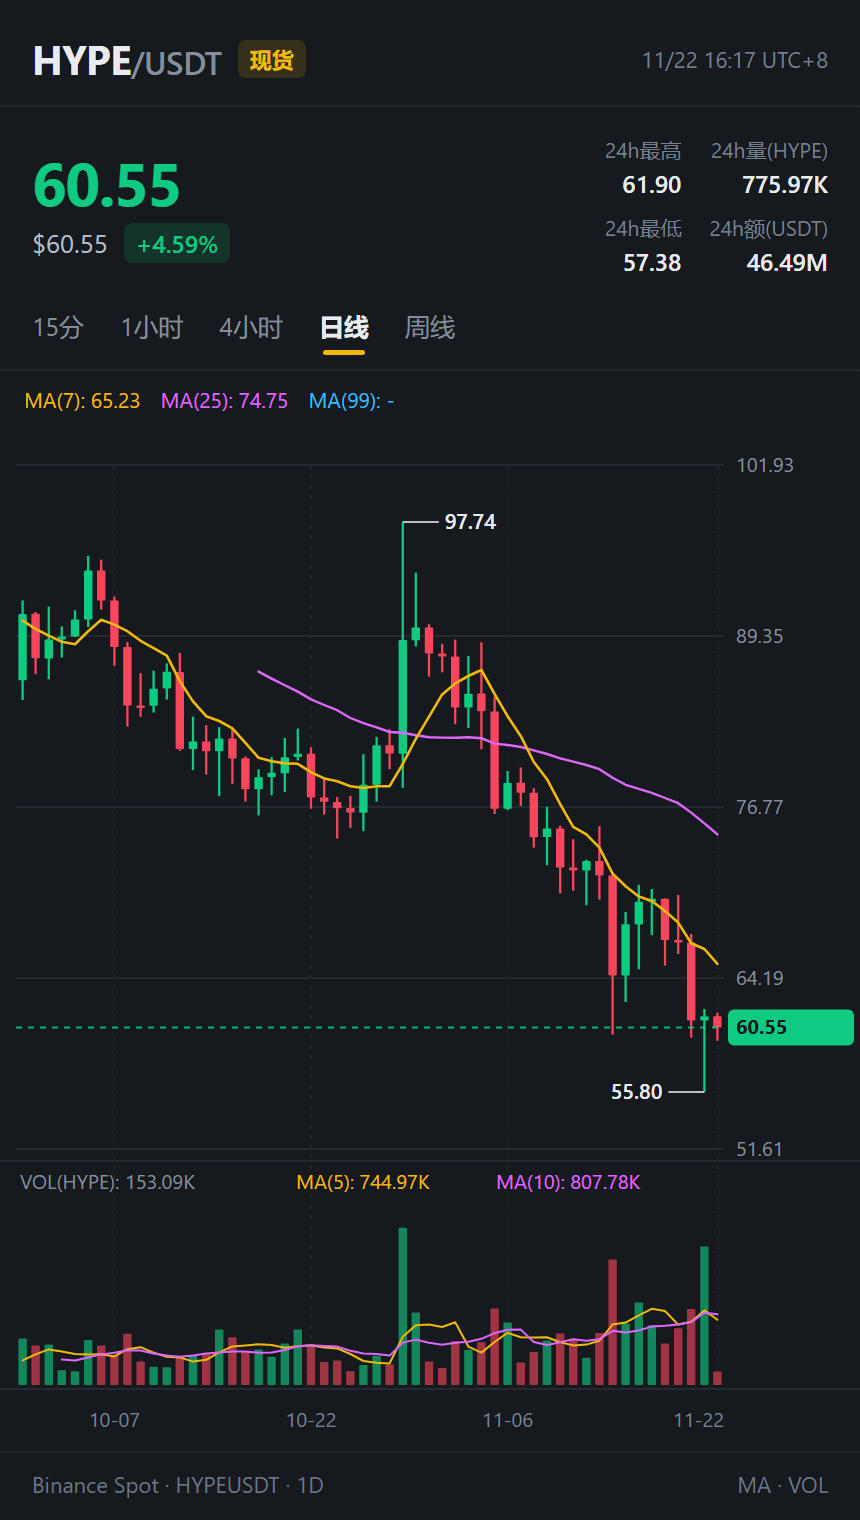
On the other hand, $HYPE is showing some promise. After getting slammed from 97.74, breaking below 60, and plunging to 55.80, a huge $92.8 million buy order appeared at the bottom of the daily chart and yanked it back above 60. It’s holding steady at 60.55 today (24h +4.59%). Meanwhile, $UNI has also climbed back from 4.188 to 4.62 (up over 6% in 24h).
When you see a long lower wick on the daily chart with heavy volume and a recovery, it at least proves there are people down there willing to catch the falling knife—much better than lying on the floor playing dead. Still, the 7-day moving average for $HYPE is hanging overhead at 65.23. Until it can hold above that level, I’ll just keep a small position and watch. I really wouldn’t dare use leverage recklessly.
#XRP #HYPE #CryptoDaily
It wasn’t until I switched to the daily chart for a review that I realized the most painful part of this move wasn’t Bitcoin at all—it was a few familiar names in my portfolio.
Just looking at $XRP makes me mad. It was still hovering around 1.555 last month, then steadily slid lower. A few days ago, it finally managed to touch 1.0078, only to plunge straight to 0.8600 yesterday. It’s bounced back to 0.9177 now (24h +2.86%, trading volume $85 million), but the 7-day moving average on the daily chart is still overhead at 0.9468. It may look like it’s just a few cents away from $1, but once it really rallies, there’ll be plenty of people selling to break even.
On the other hand, $HYPE is showing some promise. After getting slammed from 97.74, breaking below 60, and plunging to 55.80, a huge $92.8 million buy order appeared at the bottom of the daily chart and yanked it back above 60. It’s holding steady at 60.55 today (24h +4.59%). Meanwhile, $UNI has also climbed back from 4.188 to 4.62 (up over 6% in 24h).
When you see a long lower wick on the daily chart with heavy volume and a recovery, it at least proves there are people down there willing to catch the falling knife—much better than lying on the floor playing dead. Still, the 7-day moving average for $HYPE is hanging overhead at 65.23. Until it can hold above that level, I’ll just keep a small position and watch. I really wouldn’t dare use leverage recklessly.
#XRP #HYPE #CryptoDaily
Just looking at $XRP makes me mad. It was still hovering around 1.555 last month, then steadily slid lower. A few days ago, it finally managed to touch 1.0078, only to plunge straight to 0.8600 yesterday. It’s bounced back to 0.9177 now (24h +2.86%, trading volume $85 million), but the 7-day moving average on the daily chart is still overhead at 0.9468. It may look like it’s just a few cents away from $1, but once it really rallies, there’ll be plenty of people selling to break even.
On the other hand, $HYPE is showing some promise. After getting slammed from 97.74, breaking below 60, and plunging to 55.80, a huge $92.8 million buy order appeared at the bottom of the daily chart and yanked it back above 60. It’s holding steady at 60.55 today (24h +4.59%). Meanwhile, $UNI has also climbed back from 4.188 to 4.62 (up over 6% in 24h).
When you see a long lower wick on the daily chart with heavy volume and a recovery, it at least proves there are people down there willing to catch the falling knife—much better than lying on the floor playing dead. Still, the 7-day moving average for $HYPE is hanging overhead at 65.23. Until it can hold above that level, I’ll just keep a small position and watch. I really wouldn’t dare use leverage recklessly.
#XRP #HYPE #CryptoDaily
265
·
--
This afternoon’s price action is so sleepy, and volume has shrunk like the power’s gone out.
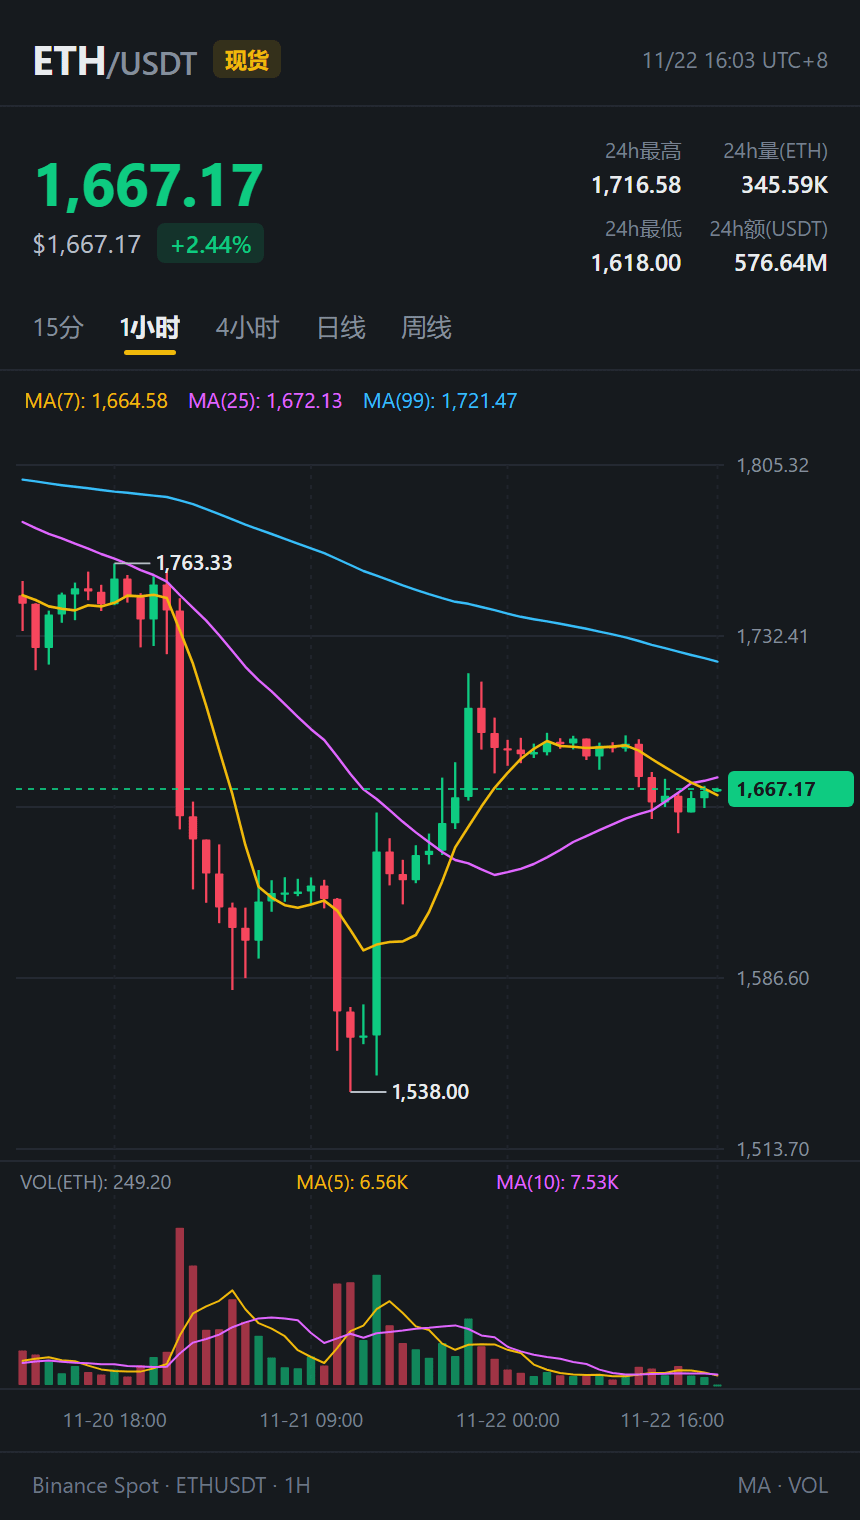
Just look at the 1-hour chart to see how tedious it’s been: $ETH plunged to 1,538 the day before yesterday, then finally managed a rebound to 1,716. Now it’s stuck around 1,667, barely moving (24h +2.4%, trading volume $577 million). The candles are glued to the moving averages, going sideways, and the volume bars below have nearly shrunk to a thin line. It can’t even bring itself to decisively reclaim 1,700.
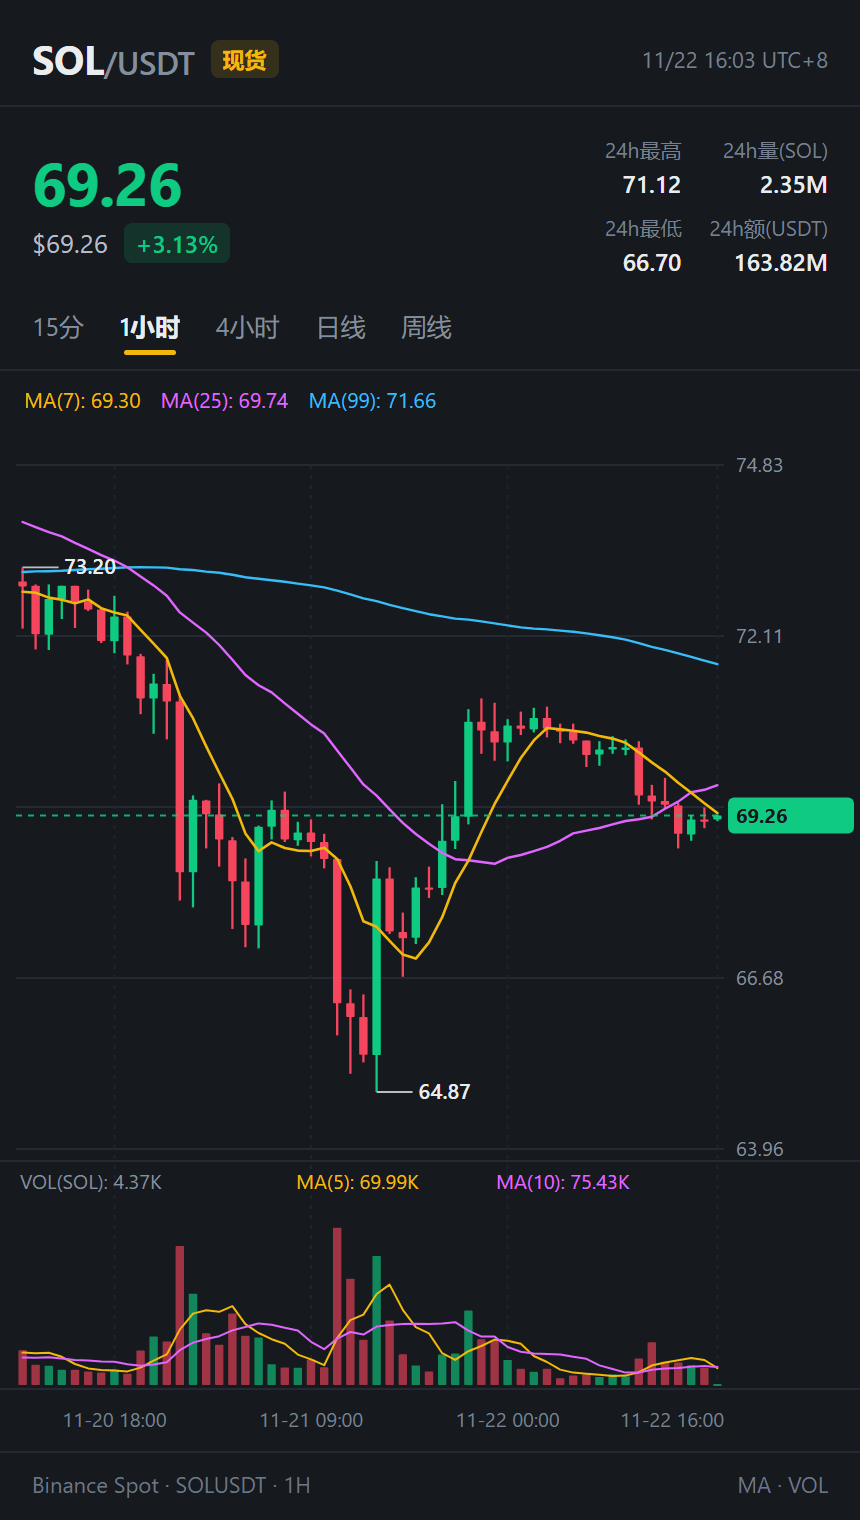
$SOL is exactly the same. After bouncing from 64.87 to 71.12, it’s now grinding around 69.26 (24h +3.1%, trading volume $164 million). It’s just a few cents short, yet it still won’t push past 70. It can neither break higher nor drop—just slowly wearing down everyone’s patience. $BNB , on the other hand, has been the steadiest. It’s quietly climbed back from 519 to around 540 (24h +3.3%); whenever the broader market gets choppy, it holds up better than ETH.
This kind of extremely low-volume sideways trading is often the calm before a big move: either volume surges and picks a direction before the U.S. session tonight, or it keeps faking breakouts to shake out leveraged traders. If you’re holding $ETH or $SOL , it really is a tough spot—hard to make a move. Sell and you’re afraid it’ll take off; add to your position and you’re afraid of a sudden wick down.
#ETH #SOL #BNB
This afternoon’s price action is so sleepy, and volume has shrunk like the power’s gone out.
Just look at the 1-hour chart to see how tedious it’s been: $ETH plunged to 1,538 the day before yesterday, then finally managed a rebound to 1,716. Now it’s stuck around 1,667, barely moving (24h +2.4%, trading volume $577 million). The candles are glued to the moving averages, going sideways, and the volume bars below have nearly shrunk to a thin line. It can’t even bring itself to decisively reclaim 1,700.
$SOL is exactly the same. After bouncing from 64.87 to 71.12, it’s now grinding around 69.26 (24h +3.1%, trading volume $164 million). It’s just a few cents short, yet it still won’t push past 70. It can neither break higher nor drop—just slowly wearing down everyone’s patience. $BNB , on the other hand, has been the steadiest. It’s quietly climbed back from 519 to around 540 (24h +3.3%); whenever the broader market gets choppy, it holds up better than ETH.
This kind of extremely low-volume sideways trading is often the calm before a big move: either volume surges and picks a direction before the U.S. session tonight, or it keeps faking breakouts to shake out leveraged traders. If you’re holding $ETH or $SOL , it really is a tough spot—hard to make a move. Sell and you’re afraid it’ll take off; add to your position and you’re afraid of a sudden wick down.
#ETH #SOL #BNB
Just look at the 1-hour chart to see how tedious it’s been: $ETH plunged to 1,538 the day before yesterday, then finally managed a rebound to 1,716. Now it’s stuck around 1,667, barely moving (24h +2.4%, trading volume $577 million). The candles are glued to the moving averages, going sideways, and the volume bars below have nearly shrunk to a thin line. It can’t even bring itself to decisively reclaim 1,700.
$SOL is exactly the same. After bouncing from 64.87 to 71.12, it’s now grinding around 69.26 (24h +3.1%, trading volume $164 million). It’s just a few cents short, yet it still won’t push past 70. It can neither break higher nor drop—just slowly wearing down everyone’s patience. $BNB , on the other hand, has been the steadiest. It’s quietly climbed back from 519 to around 540 (24h +3.3%); whenever the broader market gets choppy, it holds up better than ETH.
This kind of extremely low-volume sideways trading is often the calm before a big move: either volume surges and picks a direction before the U.S. session tonight, or it keeps faking breakouts to shake out leveraged traders. If you’re holding $ETH or $SOL , it really is a tough spot—hard to make a move. Sell and you’re afraid it’ll take off; add to your position and you’re afraid of a sudden wick down.
#ETH #SOL #BNB
362
·
--
This market is really wearing both the bulls and bears down.
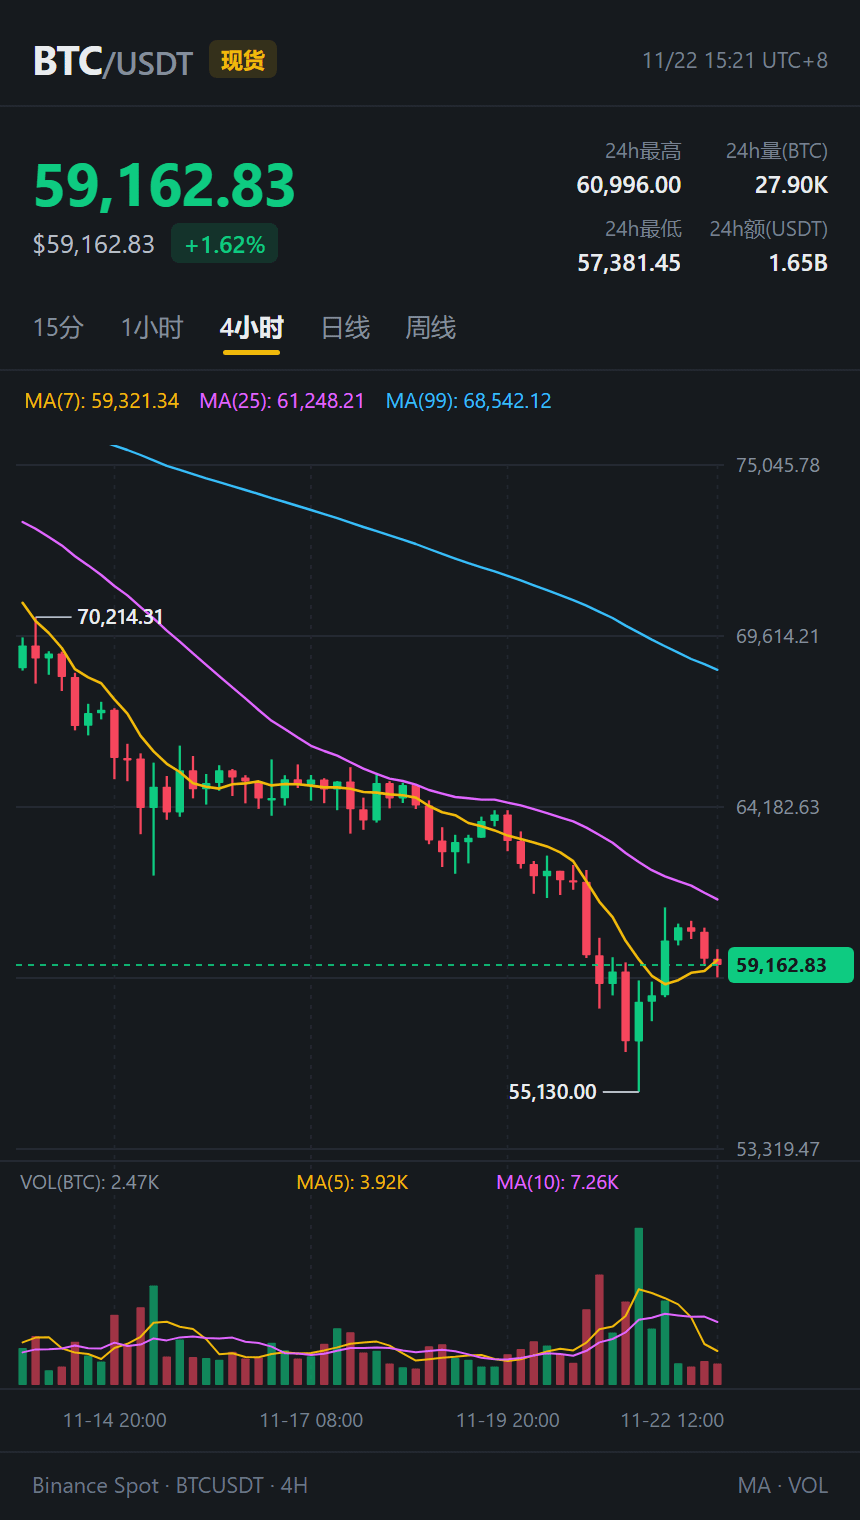
While everyone’s still yelling “crash” all over the place, $BTC dipped to 57,381 yesterday, then turned around and blasted straight up to 60,996 on a surge in volume. It saw $580 million in trading volume in just four hours. The bears had barely finished kicking themselves when this morning it slowly drifted back to 59,100, with volume shrinking to just over $140 million. Call it a dump? There’s hardly any volume. Call it a rally? It’s stuck just below 60K and going nowhere. It’s enough to drive you crazy.
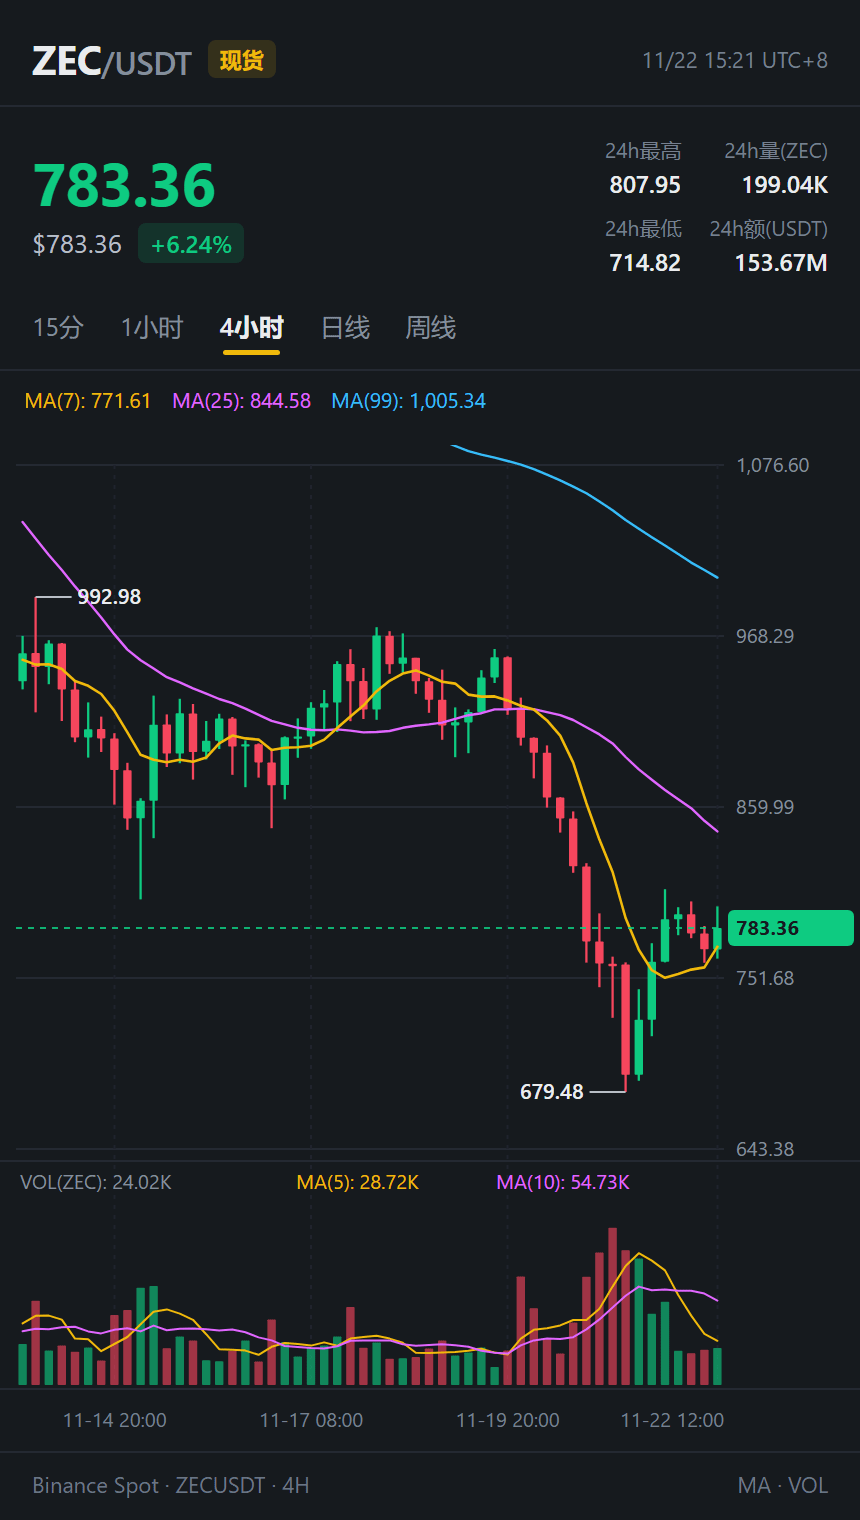
Even more ridiculous is $ZEC. A while back, it fell below 700 and got slammed by everyone. Today it turned around and shot up to 783 (it even touched 807.95 just now, up 6.2% in 24h), with spot trading volume topping $150 million and ranking fourth across the whole platform… I honestly didn’t expect money to still be so stubbornly piling into an old coin like this. Meanwhile, $NEAR quietly climbed to 2.87 (+5.99%, with $90 million in volume), while a bunch of coins that usually get hyped to the skies are just lying there, completely motionless.
Anyway, I get it now: chase the highs and you’ll get burned; sell at a loss and you’ll miss the rebound. At $BTC 59,000, I’m just going to hold my spot and play dead for now. I’ll think about it if it really drops back to 57,500. I honestly don’t dare scratch that itch and chase something as volatile as $ZEC .
#BTC #Market Analysis
This market is really wearing both the bulls and bears down.
While everyone’s still yelling “crash” all over the place, $BTC dipped to 57,381 yesterday, then turned around and blasted straight up to 60,996 on a surge in volume. It saw $580 million in trading volume in just four hours. The bears had barely finished kicking themselves when this morning it slowly drifted back to 59,100, with volume shrinking to just over $140 million. Call it a dump? There’s hardly any volume. Call it a rally? It’s stuck just below 60K and going nowhere. It’s enough to drive you crazy.
Even more ridiculous is $ZEC . A while back, it fell below 700 and got slammed by everyone. Today it turned around and shot up to 783 (it even touched 807.95 just now, up 6.2% in 24h), with spot trading volume topping $150 million and ranking fourth across the whole platform… I honestly didn’t expect money to still be so stubbornly piling into an old coin like this. Meanwhile, $NEAR quietly climbed to 2.87 (+5.99%, with $90 million in volume), while a bunch of coins that usually get hyped to the skies are just lying there, completely motionless.
Anyway, I get it now: chase the highs and you’ll get burned; sell at a loss and you’ll miss the rebound. At $BTC 59,000, I’m just going to hold my spot and play dead for now. I’ll think about it if it really drops back to 57,500. I honestly don’t dare scratch that itch and chase something as volatile as $ZEC .
#BTC #Market Analysis
While everyone’s still yelling “crash” all over the place, $BTC dipped to 57,381 yesterday, then turned around and blasted straight up to 60,996 on a surge in volume. It saw $580 million in trading volume in just four hours. The bears had barely finished kicking themselves when this morning it slowly drifted back to 59,100, with volume shrinking to just over $140 million. Call it a dump? There’s hardly any volume. Call it a rally? It’s stuck just below 60K and going nowhere. It’s enough to drive you crazy.
Even more ridiculous is $ZEC . A while back, it fell below 700 and got slammed by everyone. Today it turned around and shot up to 783 (it even touched 807.95 just now, up 6.2% in 24h), with spot trading volume topping $150 million and ranking fourth across the whole platform… I honestly didn’t expect money to still be so stubbornly piling into an old coin like this. Meanwhile, $NEAR quietly climbed to 2.87 (+5.99%, with $90 million in volume), while a bunch of coins that usually get hyped to the skies are just lying there, completely motionless.
Anyway, I get it now: chase the highs and you’ll get burned; sell at a loss and you’ll miss the rebound. At $BTC 59,000, I’m just going to hold my spot and play dead for now. I’ll think about it if it really drops back to 57,500. I honestly don’t dare scratch that itch and chase something as volatile as $ZEC .
#BTC #Market Analysis
749
Log in to explore more content
Join global crypto users on Binance Square
⚡️ Get latest and useful information about crypto.
💬 Trusted by the world’s largest crypto exchange.
👍 Discover real insights from verified creators.
Email / Phone number
Trending Topics
BTCReboundsAbove$60KAmidWhaleDipBuying
37,498 views
208 Discussing
Abraxas Capital, Other Whales Buy the BTC Dip as Bitcoin Briefly Reclaims $60,000
Binance News
·31 Likes
·50.6k views
SolanaSets2027RoadmapToDoubleComputeCapacity
21,467 views
515 Discussing
CaliforniaNvidiaProbeExaminesPotentialCriminalViolations
5,725 views
71 Discussing