

Market Pulse Daily
168 Posts

Market Pulse Daily
Report
Block User
Daily crypto levels, setups and market updates. Price action, key support/resistance and fast news for short-term traders. Not financial advice.
1 Following
26 Followers
37 Liked
Posts
$WIF is coiling at the lows while PEPE runs 🐶
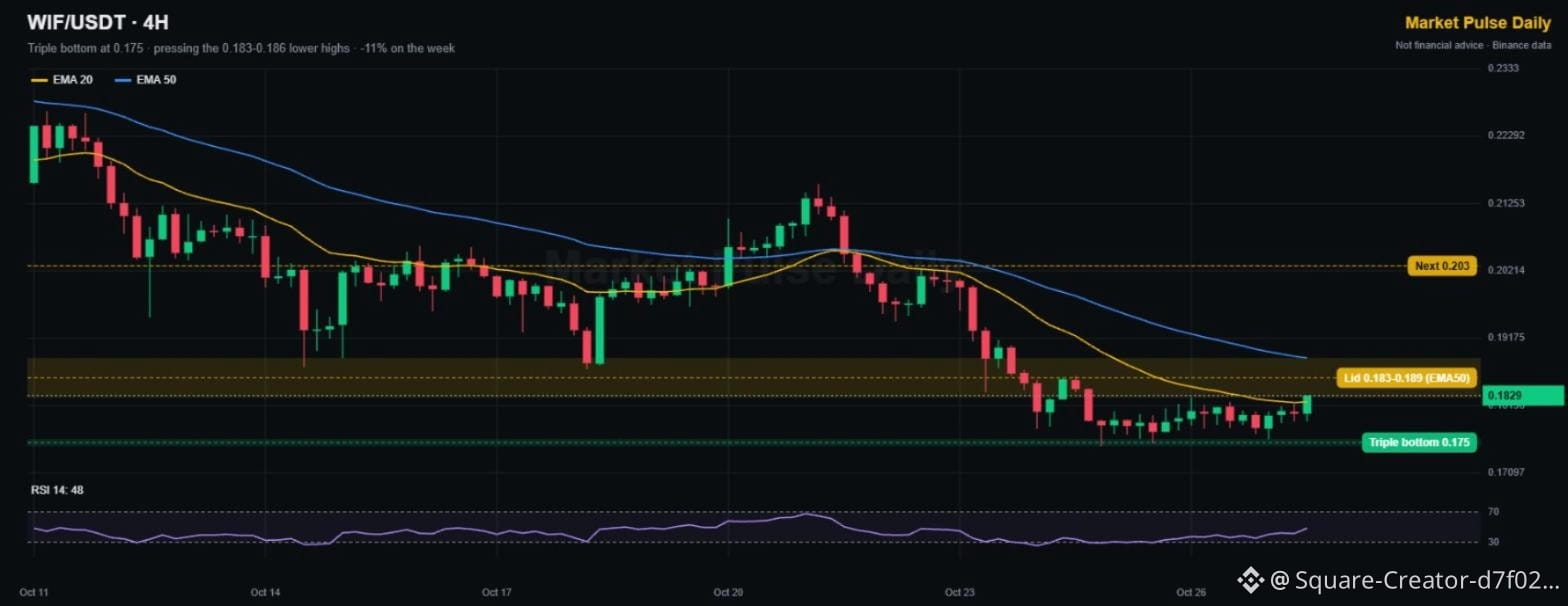
Dogwifhat put in a triple bottom at 0.175 and has gone sideways for four days. The latest 4H candle is pressing the lower-high zone at 0.183. Memecoins are moving today, so this one has a catch-up setup.
🟢 Triple bottom: 0.175
🔴 Lid: 0.183-0.189 (EMA50)
🎯 Next: 0.203
It needs a 4H close above 0.189 to confirm. Lose 0.175 and the base breaks.
👉 Tap $WIF
for the live chart. NFA
Which memecoin catches up next? 👇
#WIF #Memecoins #FOMCWatch
No Binance account yet? Get 20% of your trading fees back 👉 [Sign up on Binance](https://www.binance.com/register?ref=TGCSTKKM)
{spot}(WIFUSDT)
$WIF is coiling at the lows while PEPE runs 🐶
Dogwifhat put in a triple bottom at 0.175 and has gone sideways for four days. The latest 4H candle is pressing the lower-high zone at 0.183. Memecoins are moving today, so this one has a catch-up setup.
🟢 Triple bottom: 0.175
🔴 Lid: 0.183-0.189 (EMA50)
🎯 Next: 0.203
It needs a 4H close above 0.189 to confirm. Lose 0.175 and the base breaks.
👉 Tap $WIF
for the live chart. NFA
Which memecoin catches up next? 👇
#WIF #Memecoins #FOMCWatch
No Binance account yet? Get 20% of your trading fees back 👉 Sign up on Binance
·
--
Bullish
$TAO just broke its downtrend line 🧠
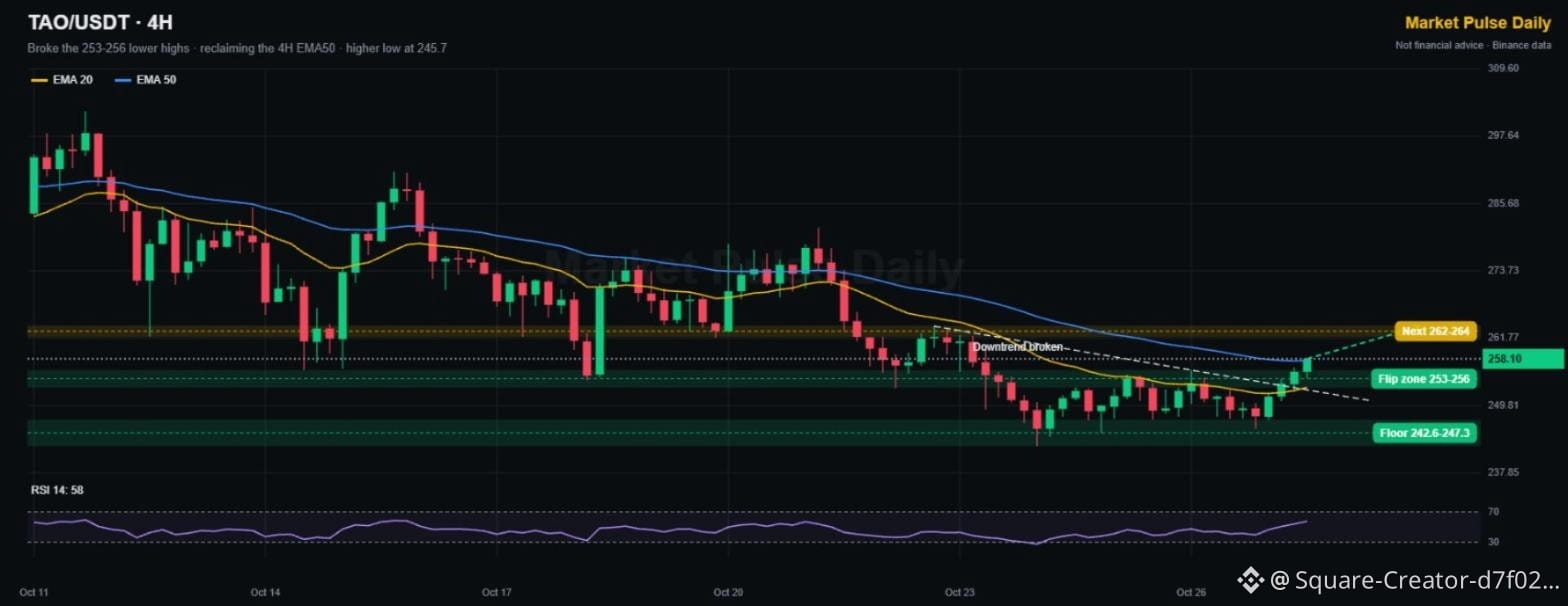
Bittensor made a higher low at 245.7, then pushed through the 253-256 lower highs that capped it since Oct 22. It's now pressing the 4H EMA50 at about 258, with RSI 58 and rising.
🟢 Flip zone: 253-256
🟢 Floor: 242.6-247.3
🎯 Next: 262-264
A 4H close above the EMA50 confirms the turn. Back under 253 and it's a fakeout.
👉 Tap $TAO
for the live chart. NFA
Is decentralized AI the play into earnings week? 👇
#Bittensor #AIcrypto #CanMicrosoftDeliverOnAI
No Binance account yet? Get 20% of your trading fees back 👉 [Sign up on Binance](https://www.binance.com/register?ref=TGCSTKKM)
{spot}(TAOUSDT)
$TAO just broke its downtrend line 🧠
Bittensor made a higher low at 245.7, then pushed through the 253-256 lower highs that capped it since Oct 22. It's now pressing the 4H EMA50 at about 258, with RSI 58 and rising.
🟢 Flip zone: 253-256
🟢 Floor: 242.6-247.3
🎯 Next: 262-264
A 4H close above the EMA50 confirms the turn. Back under 253 and it's a fakeout.
👉 Tap $TAO
for the live chart. NFA
Is decentralized AI the play into earnings week? 👇
#Bittensor #AIcrypto #CanMicrosoftDeliverOnAI
No Binance account yet? Get 20% of your trading fees back 👉 Sign up on Binance
$INIT spiked to 0.1987, then gave half of it back ⚡
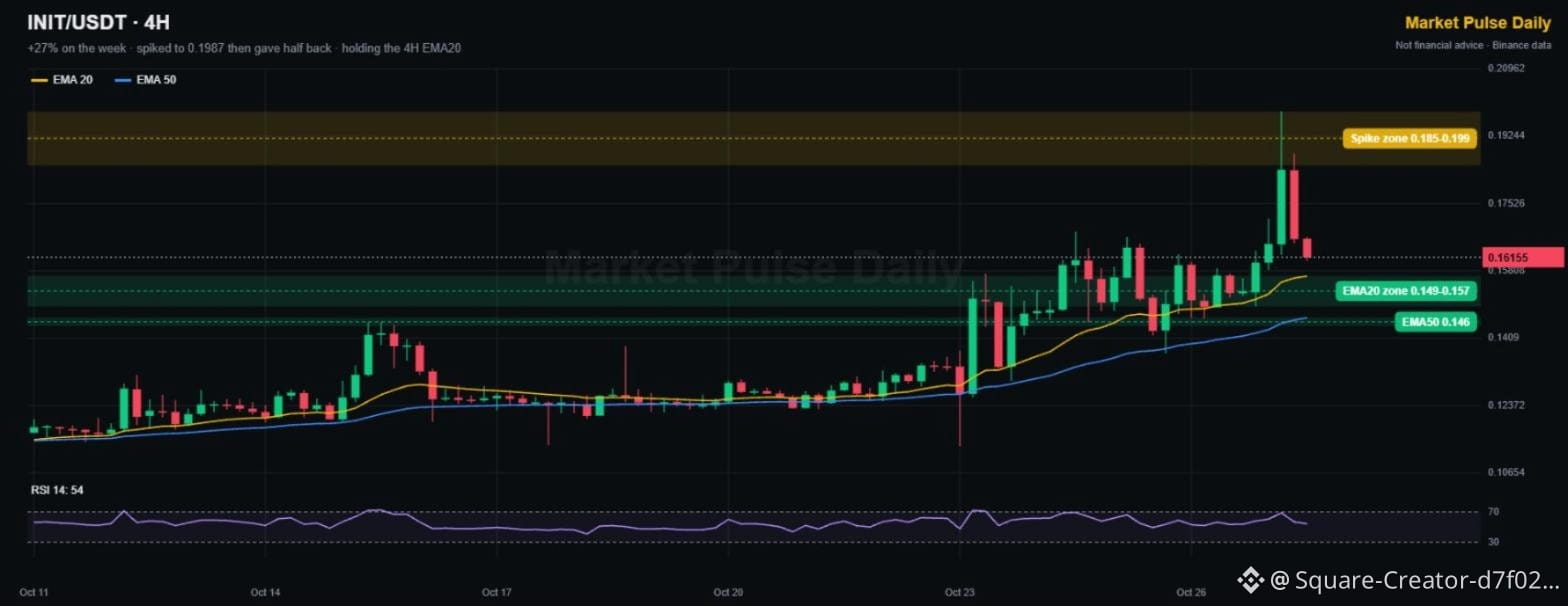
Initia is still +27% on the week, and the structure since Oct 23 is clean higher lows. But that long wick at 0.199 shows heavy selling into the pump, and the last two 4H candles are red.
🔴 Spike zone: 0.185-0.199
🟢 EMA20 zone: 0.149-0.157
🟢 EMA50: 0.146
The trend is intact while price holds the EMA20. A bounce from 0.149-0.157 would be the classic higher low.
👉 Tap $INIT
for the live chart. NFA
Buy the dip or wait it out? 👇
#TopGainers #Altcoins #FOMCWatch
No Binance account yet? Get 20% of your trading fees back 👉 [Sign up on Binance](https://www.binance.com/register?ref=TGCSTKKM)
{spot}(INITUSDT)
$INIT spiked to 0.1987, then gave half of it back ⚡
Initia is still +27% on the week, and the structure since Oct 23 is clean higher lows. But that long wick at 0.199 shows heavy selling into the pump, and the last two 4H candles are red.
🔴 Spike zone: 0.185-0.199
🟢 EMA20 zone: 0.149-0.157
🟢 EMA50: 0.146
The trend is intact while price holds the EMA20. A bounce from 0.149-0.157 would be the classic higher low.
👉 Tap $INIT
for the live chart. NFA
Buy the dip or wait it out? 👇
#TopGainers #Altcoins #FOMCWatch
No Binance account yet? Get 20% of your trading fees back 👉 Sign up on Binance
1
·
--
Bullish
$REZ is +31% on the week and printing higher highs 📈
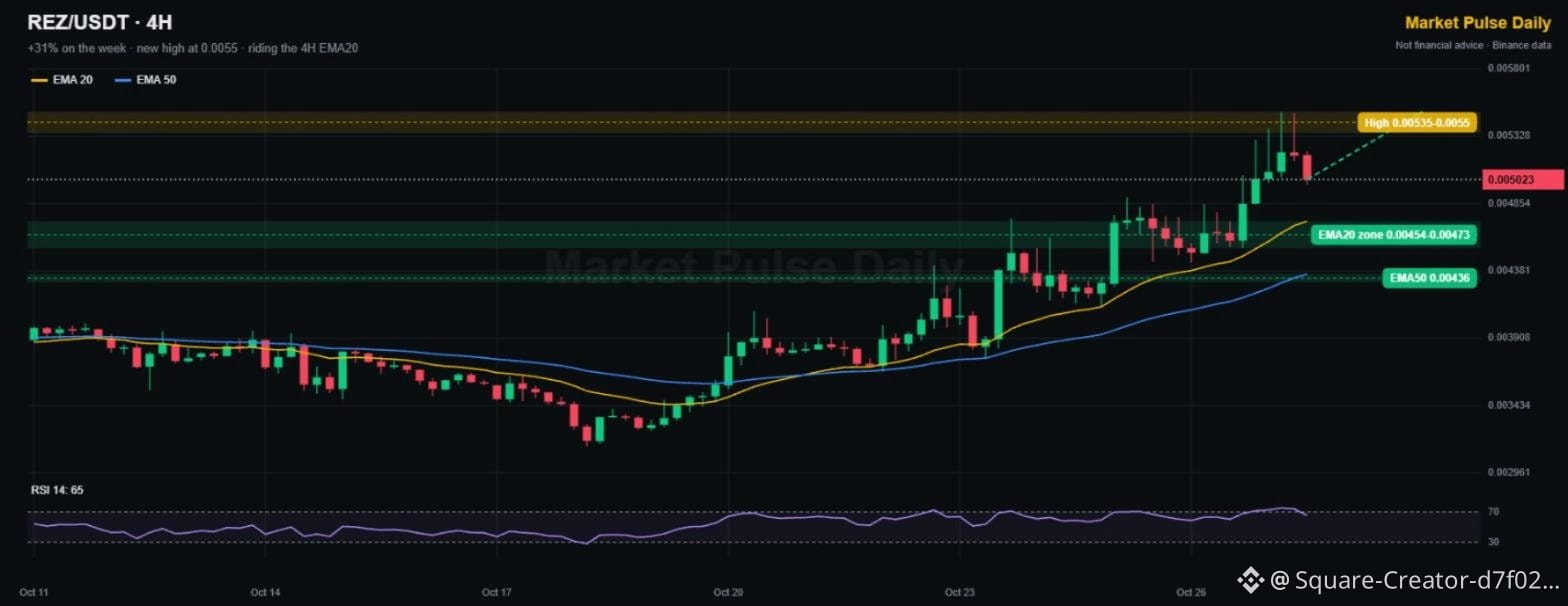
Renzo has been one of the cleanest uptrends on the board since Oct 19: higher highs, higher lows, and price riding the 4H EMA20 the whole way. Today it tagged a new high at 0.0055 and is cooling slightly.
🔴 High: 0.00535-0.0055
🟢 EMA20 zone: 0.00454-0.00473
🟢 EMA50: 0.00436
In a trend like this, dips to the EMA20 have been the buy zone. A close below the EMA50 would end it.
👉 Tap $REZ
for the live chart. NFA
Is restaking making a comeback? 👇
#TopGainers #Altcoins #FOMCWatch
No Binance account yet? Get 20% of your trading fees back 👉 [Sign up on Binance](https://www.binance.com/register?ref=TGCSTKKM)
{spot}(REZUSDT)
$REZ is +31% on the week and printing higher highs 📈
Renzo has been one of the cleanest uptrends on the board since Oct 19: higher highs, higher lows, and price riding the 4H EMA20 the whole way. Today it tagged a new high at 0.0055 and is cooling slightly.
🔴 High: 0.00535-0.0055
🟢 EMA20 zone: 0.00454-0.00473
🟢 EMA50: 0.00436
In a trend like this, dips to the EMA20 have been the buy zone. A close below the EMA50 would end it.
👉 Tap $REZ
for the live chart. NFA
Is restaking making a comeback? 👇
#TopGainers #Altcoins #FOMCWatch
No Binance account yet? Get 20% of your trading fees back 👉 Sign up on Binance
2
·
--
Bullish
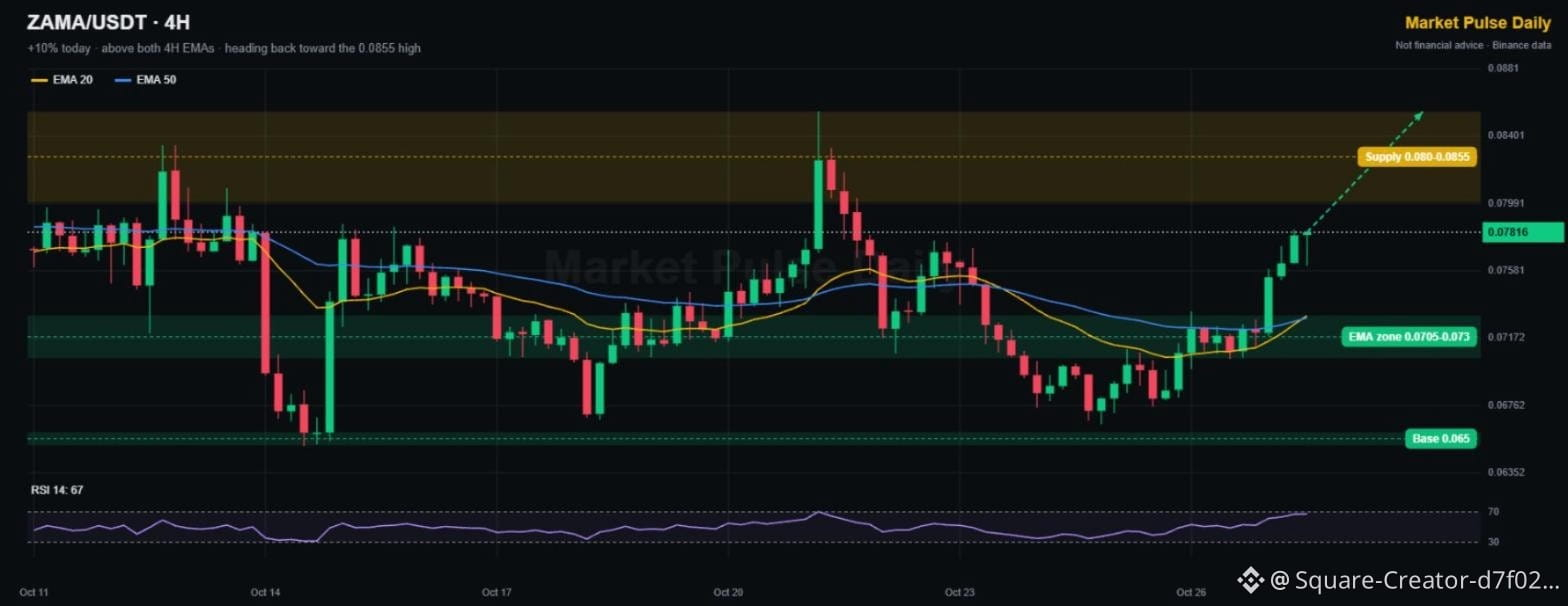
$ZAMA is up 10% today and climbing back toward its October high 🔐
Four straight green 4H candles lifted it off the EMA zone. Both EMAs have now turned up and price sits clearly above them. The test is the 0.080-0.0855 supply zone, where the Oct 21 spike got sold.
🟢 EMA zone: 0.0705-0.073
🟢 Base: 0.065
🔴 Supply: 0.080-0.0855
RSI 67, momentum is strong but getting warm. A flag under 0.080 would be a healthy pause.
👉 Tap $ZAMA
for the live chart. NFA
Who's been watching this one? 👇
#TopGainers #Altcoins #FOMCWatch
No Binance account yet? Get 20% of your trading fees back 👉 [Sign up on Binance](https://www.binance.com/register?ref=TGCSTKKM)
{spot}(ZAMAUSDT)
$ZAMA is up 10% today and climbing back toward its October high 🔐
Four straight green 4H candles lifted it off the EMA zone. Both EMAs have now turned up and price sits clearly above them. The test is the 0.080-0.0855 supply zone, where the Oct 21 spike got sold.
🟢 EMA zone: 0.0705-0.073
🟢 Base: 0.065
🔴 Supply: 0.080-0.0855
RSI 67, momentum is strong but getting warm. A flag under 0.080 would be a healthy pause.
👉 Tap $ZAMA
for the live chart. NFA
Who's been watching this one? 👇
#TopGainers #Altcoins #FOMCWatch
No Binance account yet? Get 20% of your trading fees back 👉 Sign up on Binance
2
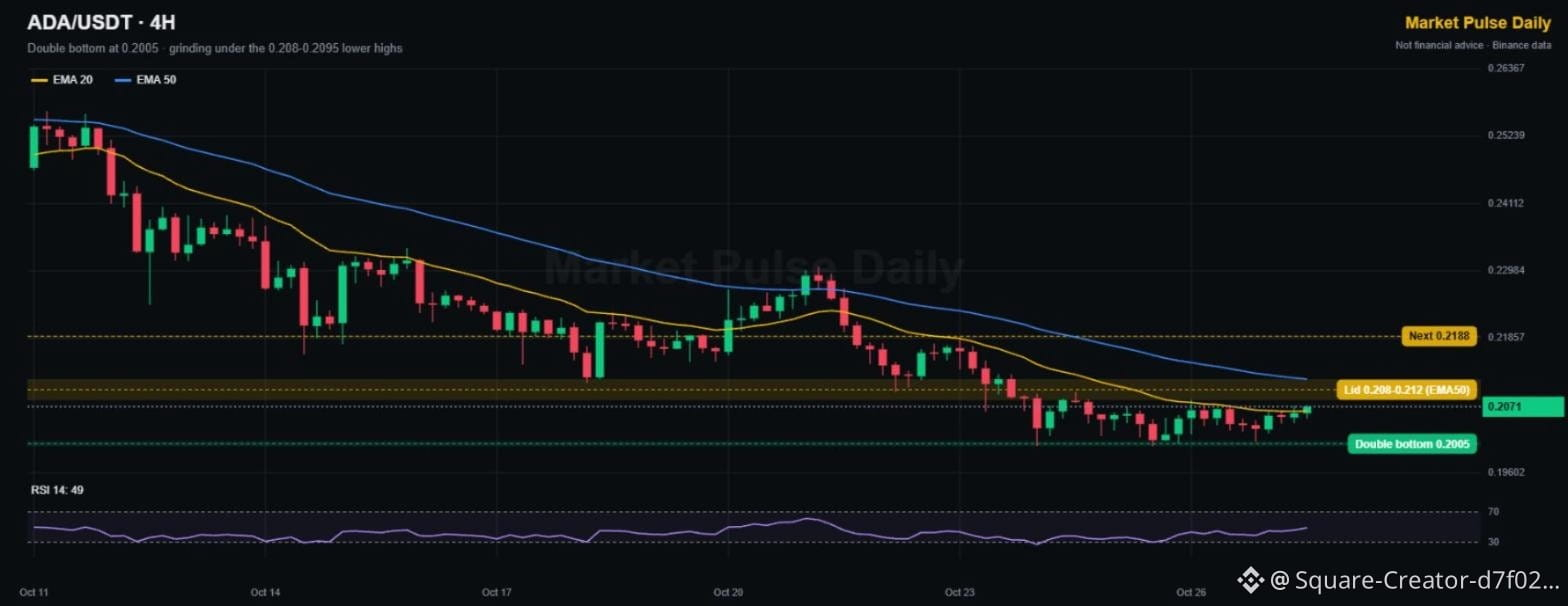
$ADA is building a base at 0.20 🔵
Cardano double-bottomed at 0.2005 and has been grinding sideways for four days. Price is pinned under the 0.208-0.212 zone, where the lower highs and the 4H EMA50 sit. RSI 49: coiled, waiting for a catalyst.
🟢 Double bottom: 0.2005
🔴 Lid: 0.208-0.212
🎯 Next: 0.2188
A close above 0.212 flips the short-term trend. Below 0.2005 there's no clear support until much lower.
👉 Tap $ADA
for the live chart. NFA
Still holding Cardano? 👇
#Cardano #Altcoins #FOMCWatch
No Binance account yet? Get 20% of your trading fees back 👉 [Sign up on Binance](https://www.binance.com/register?ref=TGCSTKKM)
{spot}(ADAUSDT)
$ADA is building a base at 0.20 🔵
Cardano double-bottomed at 0.2005 and has been grinding sideways for four days. Price is pinned under the 0.208-0.212 zone, where the lower highs and the 4H EMA50 sit. RSI 49: coiled, waiting for a catalyst.
🟢 Double bottom: 0.2005
🔴 Lid: 0.208-0.212
🎯 Next: 0.2188
A close above 0.212 flips the short-term trend. Below 0.2005 there's no clear support until much lower.
👉 Tap $ADA
for the live chart. NFA
Still holding Cardano? 👇
#Cardano #Altcoins #FOMCWatch
No Binance account yet? Get 20% of your trading fees back 👉 Sign up on Binance
2
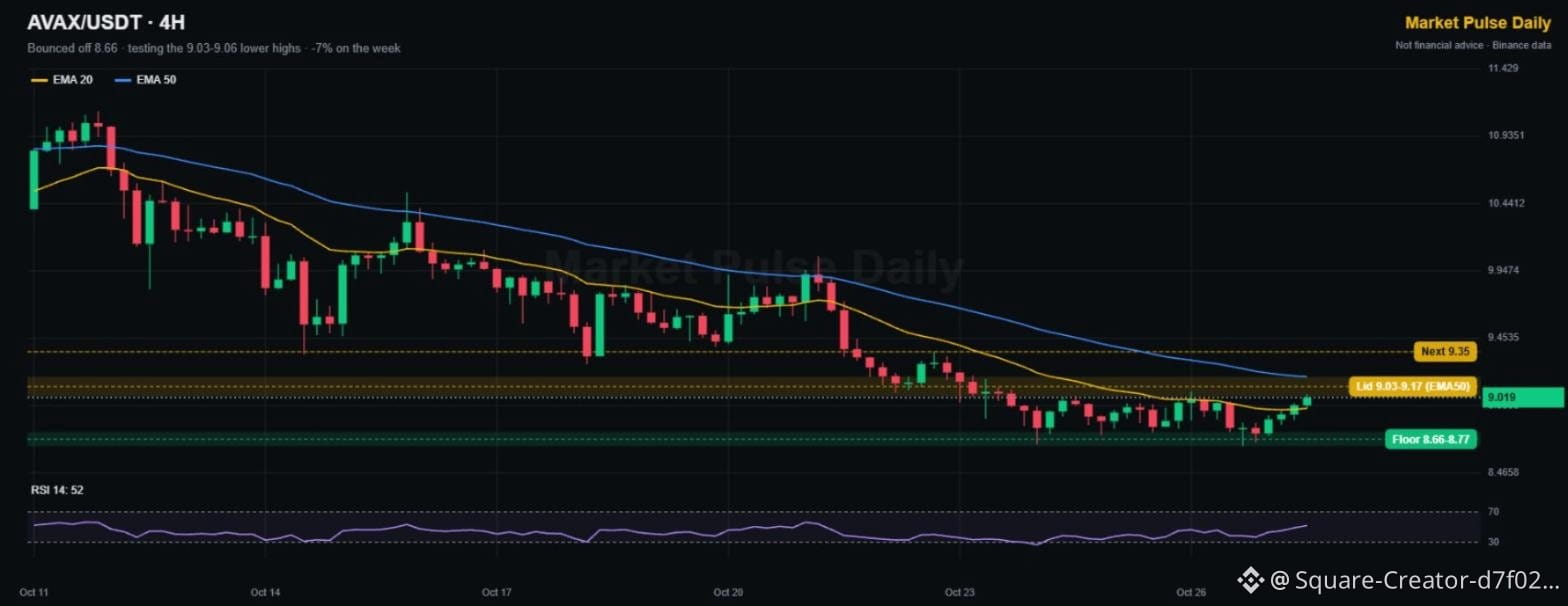
$AVAX bounced off 8.66 and is knocking on the ceiling 🔺
Avalanche is still -7% on the week, but the last three 4H candles are green and price is back above the EMA20. The test now is the 9.03-9.17 zone, where the lower highs and the EMA50 meet.
🔴 Lid: 9.03-9.17
🎯 Next: 9.35
🟢 Floor: 8.66-8.77
Break and hold above 9.17 and the downtrend from Oct 21 is over. Rejection here sends it back to the floor.
👉 Tap $AVAX
for the live chart. NFA
Breakout or rejection? Vote below 👇
#Avalanche #Altcoins #FOMCWatch
No Binance account yet? Get 20% of your trading fees back 👉 [Sign up on Binance](https://www.binance.com/register?ref=TGCSTKKM)
{spot}(AVAXUSDT)
$AVAX bounced off 8.66 and is knocking on the ceiling 🔺
Avalanche is still -7% on the week, but the last three 4H candles are green and price is back above the EMA20. The test now is the 9.03-9.17 zone, where the lower highs and the EMA50 meet.
🔴 Lid: 9.03-9.17
🎯 Next: 9.35
🟢 Floor: 8.66-8.77
Break and hold above 9.17 and the downtrend from Oct 21 is over. Rejection here sends it back to the floor.
👉 Tap $AVAX
for the live chart. NFA
Breakout or rejection? Vote below 👇
#Avalanche #Altcoins #FOMCWatch
No Binance account yet? Get 20% of your trading fees back 👉 Sign up on Binance
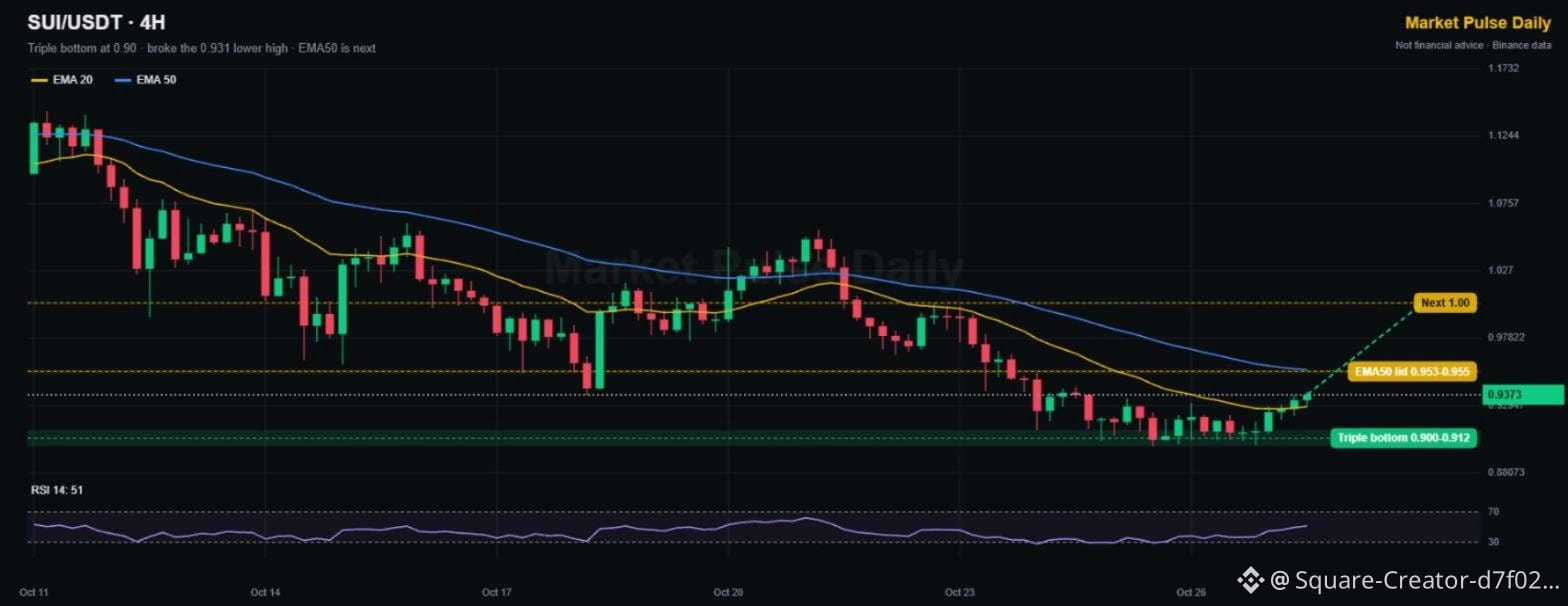
$SUI is defending the 0.90 floor for the third time 🌊
Sui has been flat at the lows since Oct 24, and buyers keep stepping in at 0.900-0.912. Now price has reclaimed the 4H EMA20 and closed above the 0.931 lower high.
🟢 Triple bottom: 0.900-0.912
🔴 EMA50 lid: 0.953-0.955
🎯 Next: 1.00
A 4H close over 0.955 would turn this into a real reversal. Lose 0.90 and it's a breakdown.
👉 Tap $SUI
for the live chart. NFA
Back to 1 dollar this week? 👇
#SUI #Altcoins #FOMCWatch
No Binance account yet? Get 20% of your trading fees back 👉 [Sign up on Binance](https://www.binance.com/register?ref=TGCSTKKM)
{spot}(SUIUSDT)
$SUI is defending the 0.90 floor for the third time 🌊
Sui has been flat at the lows since Oct 24, and buyers keep stepping in at 0.900-0.912. Now price has reclaimed the 4H EMA20 and closed above the 0.931 lower high.
🟢 Triple bottom: 0.900-0.912
🔴 EMA50 lid: 0.953-0.955
🎯 Next: 1.00
A 4H close over 0.955 would turn this into a real reversal. Lose 0.90 and it's a breakdown.
👉 Tap $SUI
for the live chart. NFA
Back to 1 dollar this week? 👇
#SUI #Altcoins #FOMCWatch
No Binance account yet? Get 20% of your trading fees back 👉 Sign up on Binance
4
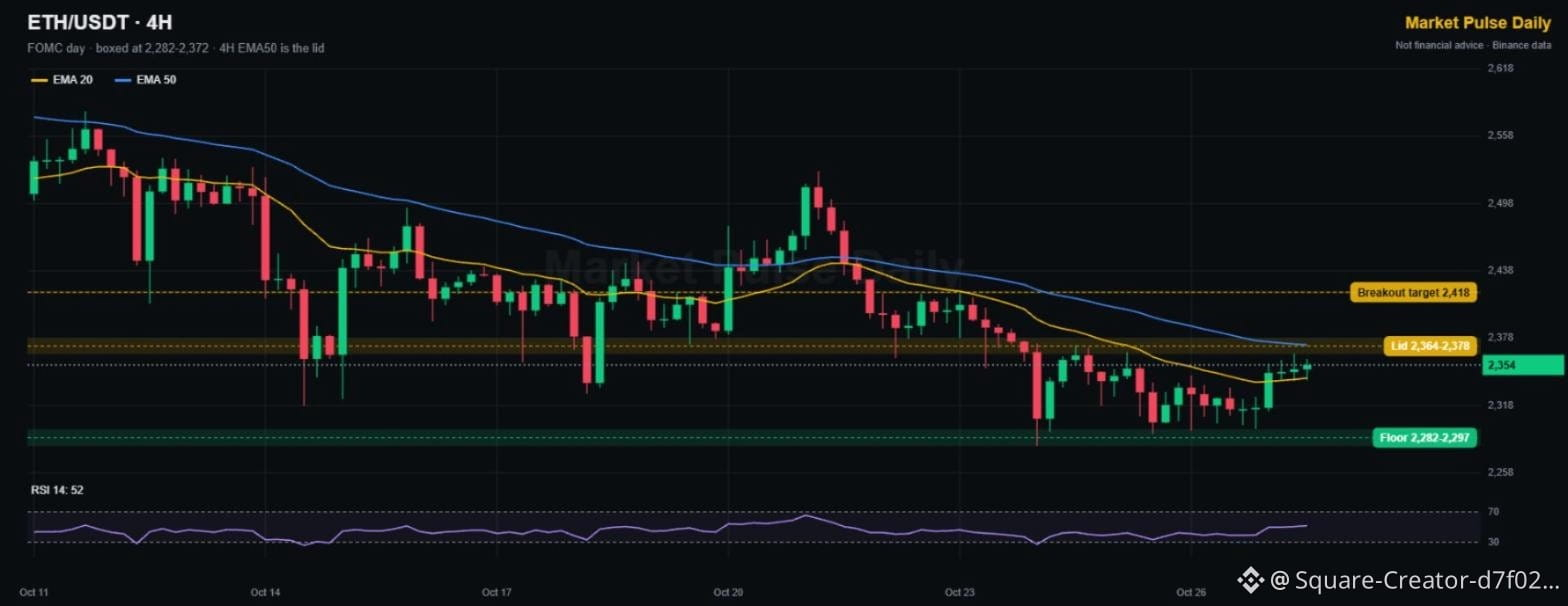
$ETH is stuck in a box on Fed day 📦
Ethereum has traded from 2,282 to 2,372 for five days. It's back above the 4H EMA20, but the EMA50 at about 2,372 has rejected every push since Oct 22. RSI is 52: nobody is in control yet.
🔴 Lid: 2,364-2,378
🎯 Breakout target: 2,418
🟢 Floor: 2,282-2,297
The Fed at 18:00 UTC is the likely trigger. Wait for a 4H close outside the box before picking a side.
👉 Tap $ETH
for the live chart. NFA
2,418 or 2,282 first? 👇
#Ethereum #TechnicalAnalysis #FOMCWatch
No Binance account yet? Get 20% of your trading fees back 👉 [Sign up on Binance](https://www.binance.com/register?ref=TGCSTKKM)
{spot}(ETHUSDT)
$ETH is stuck in a box on Fed day 📦
Ethereum has traded from 2,282 to 2,372 for five days. It's back above the 4H EMA20, but the EMA50 at about 2,372 has rejected every push since Oct 22. RSI is 52: nobody is in control yet.
🔴 Lid: 2,364-2,378
🎯 Breakout target: 2,418
🟢 Floor: 2,282-2,297
The Fed at 18:00 UTC is the likely trigger. Wait for a 4H close outside the box before picking a side.
👉 Tap $ETH
for the live chart. NFA
2,418 or 2,282 first? 👇
#Ethereum #TechnicalAnalysis #FOMCWatch
No Binance account yet? Get 20% of your trading fees back 👉 Sign up on Binance
3
·
--
Bullish
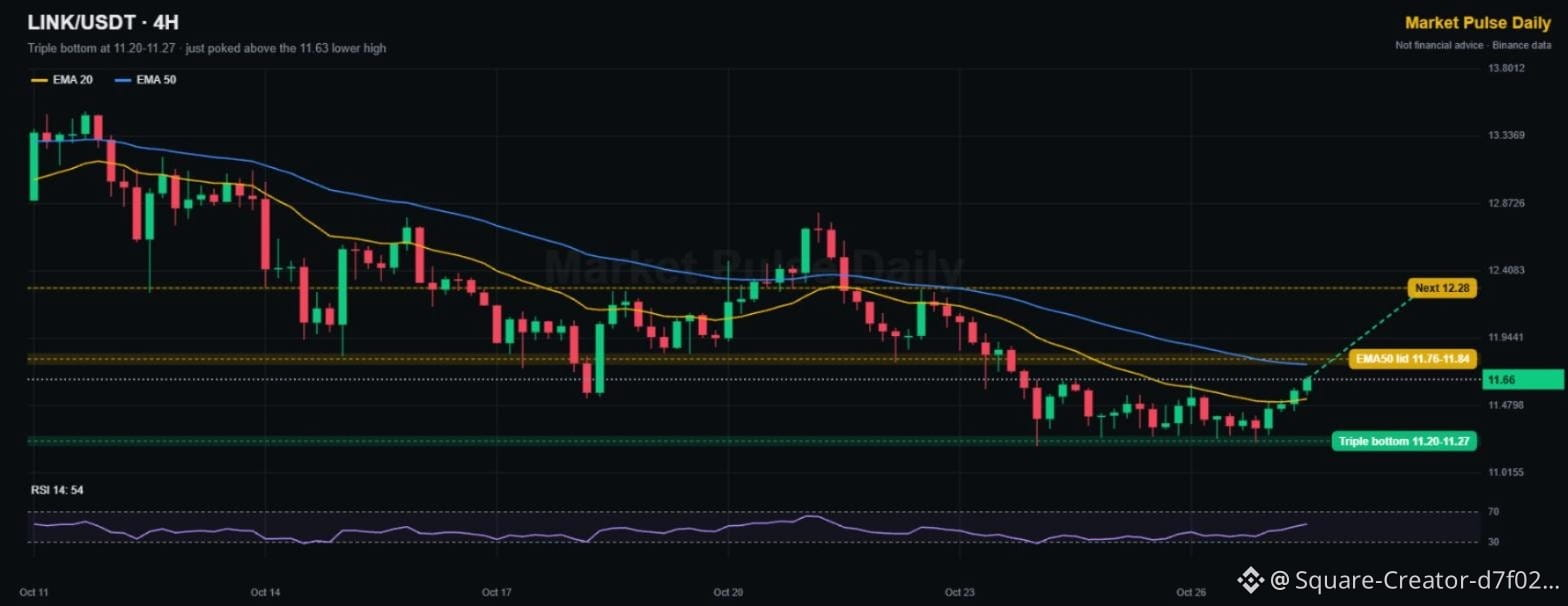
$LINK printed a triple bottom and is trying to turn 🔗
Chainlink tested 11.20-11.27 three times since Oct 23 and buyers held it every time. The latest 4H candle just closed above the 11.63 lower high, the first sign of strength in a week.
🟢 Triple bottom: 11.20-11.27
🔴 EMA50 lid: 11.76-11.84
🎯 Next: 12.28
Clear 11.84 and the downtrend is broken. Lose 11.20 and the triple bottom fails.
👉 Tap $LINK
for the live chart. NFA
Accumulating here or waiting for confirmation? 👇
#Chainlink #Altcoins #FOMCWatch
No Binance account yet? Get 20% of your trading fees back 👉 [Sign up on Binance](https://www.binance.com/register?ref=TGCSTKKM)
{spot}(LINKUSDT)
$LINK printed a triple bottom and is trying to turn 🔗
Chainlink tested 11.20-11.27 three times since Oct 23 and buyers held it every time. The latest 4H candle just closed above the 11.63 lower high, the first sign of strength in a week.
🟢 Triple bottom: 11.20-11.27
🔴 EMA50 lid: 11.76-11.84
🎯 Next: 12.28
Clear 11.84 and the downtrend is broken. Lose 11.20 and the triple bottom fails.
👉 Tap $LINK
for the live chart. NFA
Accumulating here or waiting for confirmation? 👇
#Chainlink #Altcoins #FOMCWatch
No Binance account yet? Get 20% of your trading fees back 👉 Sign up on Binance
6
·
--
Bullish
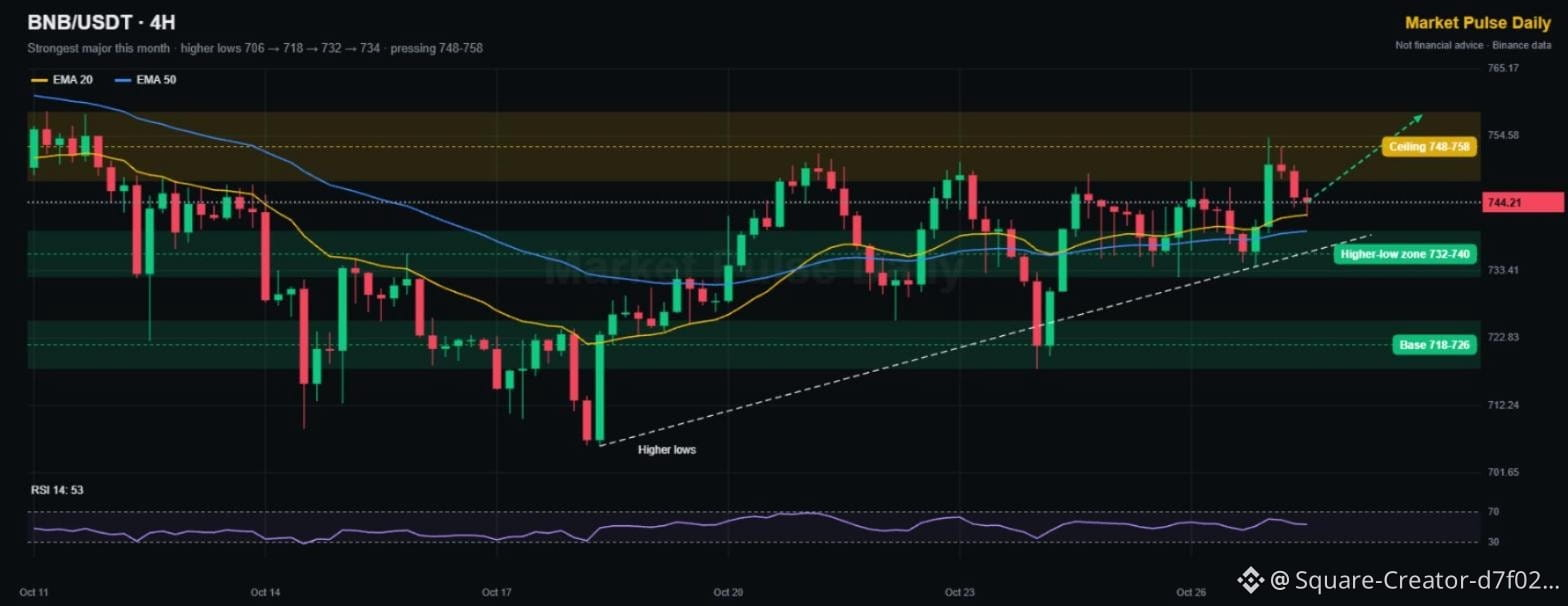
$BNB has quietly been the strongest major this month 🟡
While Bitcoin, Ethereum and Solana are all red on the week, BNB is green. Look at the lows: 706, then 718, then 732, then 734. Every dip gets bought higher, and price sits above both 4H EMAs.
🔴 Ceiling: 748-758
🟢 Higher-low zone: 732-740
🟢 Base: 718-726
A 4H close above 758 would be a fresh monthly breakout. Holding 732 keeps the staircase intact.
👉 Tap $BNB
for the live chart. NFA
Will BNB lead the next leg? 👇
#BNB #BNBChain #FOMCWatch
No Binance account yet? Get 20% of your trading fees back 👉 [Sign up on Binance](https://www.binance.com/register?ref=TGCSTKKM)
{spot}(BNBUSDT)
$BNB has quietly been the strongest major this month 🟡
While Bitcoin, Ethereum and Solana are all red on the week, BNB is green. Look at the lows: 706, then 718, then 732, then 734. Every dip gets bought higher, and price sits above both 4H EMAs.
🔴 Ceiling: 748-758
🟢 Higher-low zone: 732-740
🟢 Base: 718-726
A 4H close above 758 would be a fresh monthly breakout. Holding 732 keeps the staircase intact.
👉 Tap $BNB
for the live chart. NFA
Will BNB lead the next leg? 👇
#BNB #BNBChain #FOMCWatch
No Binance account yet? Get 20% of your trading fees back 👉 Sign up on Binance
1
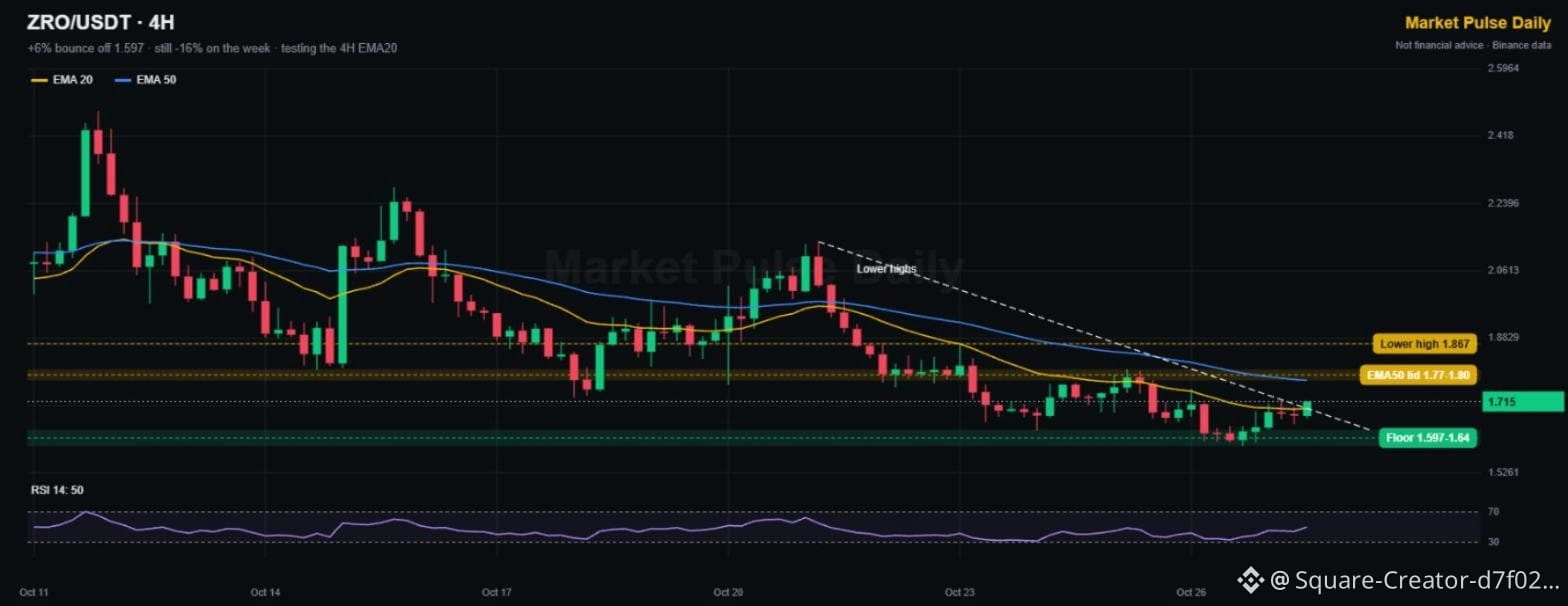
$ZRO is trying to end a two-week slide 🔗
LayerZero bounced +6% off the 1.597 low and is pressing the downtrend line from Oct 21. Still -16% on the week, so this is an early reversal attempt, not a confirmed one.
🟢 Floor: 1.597-1.64
🔴 EMA50 lid: 1.77-1.80
🎯 Lower high to beat: 1.867
Closing above 1.80 would be the first higher high in two weeks. Lose 1.597 and the slide resumes.
👉 Tap $ZRO
for the live chart. NFA
Bottom in or dead-cat bounce? 👇
#LayerZero #Altcoins #FOMCWatch
No Binance account yet? Get 20% of your trading fees back 👉 [Sign up on Binance](https://www.binance.com/register?ref=TGCSTKKM)
{spot}(ZROUSDT)
$ZRO is trying to end a two-week slide 🔗
LayerZero bounced +6% off the 1.597 low and is pressing the downtrend line from Oct 21. Still -16% on the week, so this is an early reversal attempt, not a confirmed one.
🟢 Floor: 1.597-1.64
🔴 EMA50 lid: 1.77-1.80
🎯 Lower high to beat: 1.867
Closing above 1.80 would be the first higher high in two weeks. Lose 1.597 and the slide resumes.
👉 Tap $ZRO
for the live chart. NFA
Bottom in or dead-cat bounce? 👇
#LayerZero #Altcoins #FOMCWatch
No Binance account yet? Get 20% of your trading fees back 👉 Sign up on Binance
2
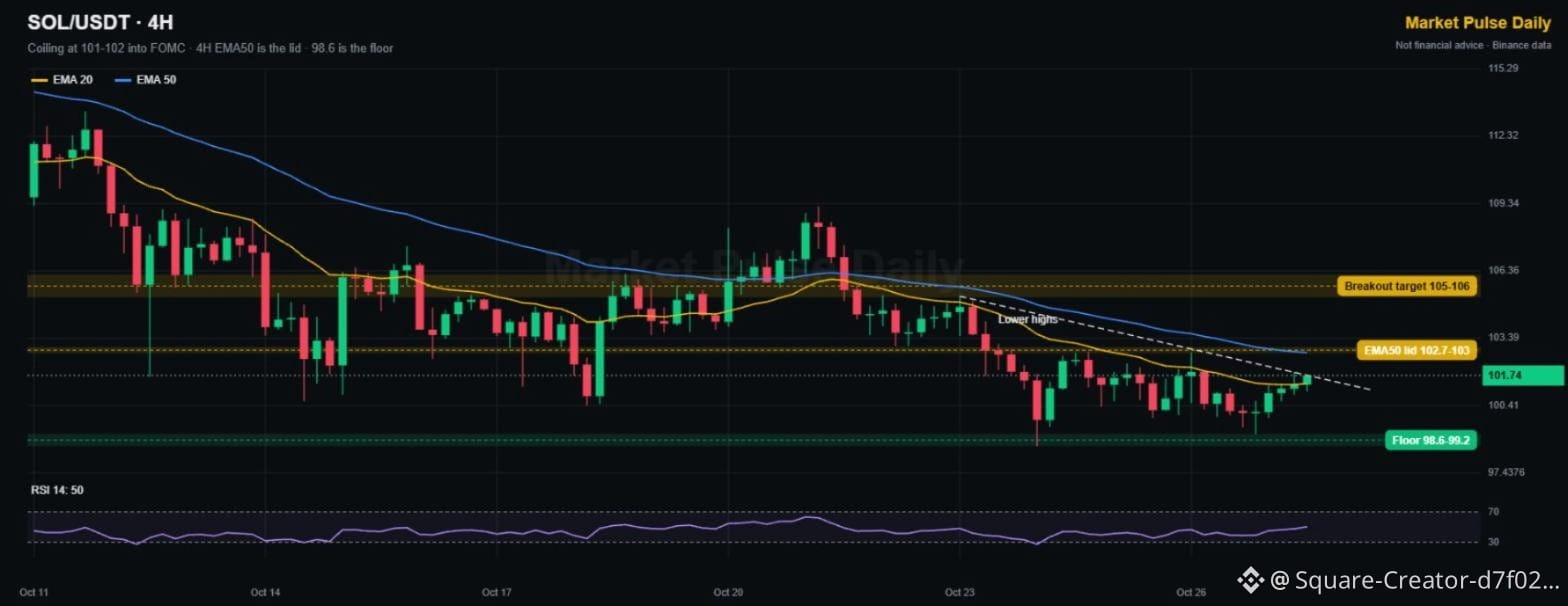
$SOL is coiled tight going into the Fed ⏳
Solana has spent five days squeezed from 98.6 to 103. Lower highs from above, a solid floor below, and RSI sitting at a perfectly neutral 50. Something has to give.
🔴 Lid: 102.7-103 (4H EMA50)
🎯 Breakout target: 105-106
🟢 Floor: 98.6-99.2
Up-break over 103 targets 105-106. Lose 98.6 and the next support is far lower. Tonight's Fed decision is the likely trigger.
👉 Tap $SOL
to watch it live. NFA
Which way does it break: up or down? 👇
#Solana #TechnicalAnalysis #FOMCWatch
No Binance account yet? Get 20% of your trading fees back 👉 [Sign up on Binance](https://www.binance.com/register?ref=TGCSTKKM)
{spot}(SOLUSDT)
$SOL is coiled tight going into the Fed ⏳
Solana has spent five days squeezed from 98.6 to 103. Lower highs from above, a solid floor below, and RSI sitting at a perfectly neutral 50. Something has to give.
🔴 Lid: 102.7-103 (4H EMA50)
🎯 Breakout target: 105-106
🟢 Floor: 98.6-99.2
Up-break over 103 targets 105-106. Lose 98.6 and the next support is far lower. Tonight's Fed decision is the likely trigger.
👉 Tap $SOL
to watch it live. NFA
Which way does it break: up or down? 👇
#Solana #TechnicalAnalysis #FOMCWatch
No Binance account yet? Get 20% of your trading fees back 👉 Sign up on Binance
4
·
--
Bullish
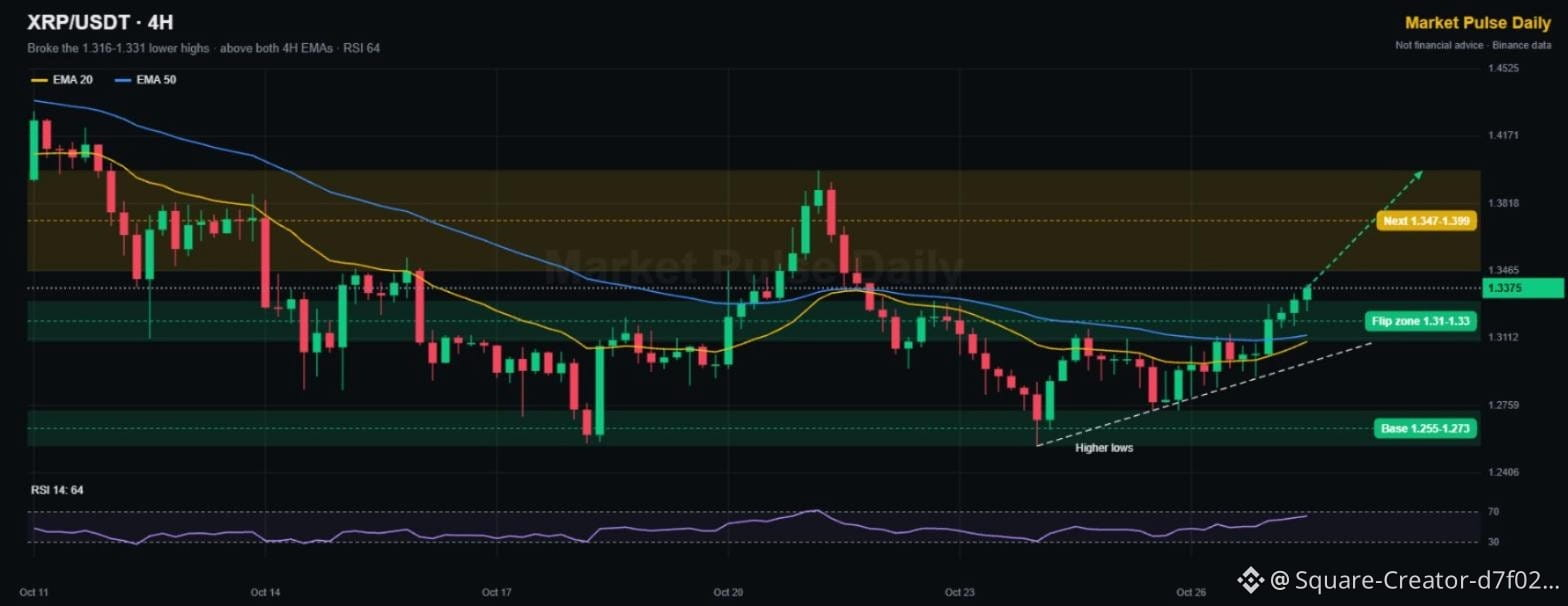
$XRP just broke out of its week-long range 💧
The 1.316-1.331 lower highs that capped every bounce since Oct 22 are now under price. Higher lows since Oct 24, both 4H EMAs turning up, RSI 64 with room to run.
🟢 Flip zone: 1.31-1.33
🟢 Base: 1.255-1.273
🎯 Next: 1.347, then 1.399
A dip that holds 1.31 keeps the breakout clean. Below 1.27, it fails.
👉 Tap $XRP
for the live chart. NFA
XRP army, is 1.40 next? 👇
#XRP #Ripple #FOMCWatch
No Binance account yet? Get 20% of your trading fees back 👉 [Sign up on Binance](https://www.binance.com/register?ref=TGCSTKKM)
{spot}(XRPUSDT)
$XRP just broke out of its week-long range 💧
The 1.316-1.331 lower highs that capped every bounce since Oct 22 are now under price. Higher lows since Oct 24, both 4H EMAs turning up, RSI 64 with room to run.
🟢 Flip zone: 1.31-1.33
🟢 Base: 1.255-1.273
🎯 Next: 1.347, then 1.399
A dip that holds 1.31 keeps the breakout clean. Below 1.27, it fails.
👉 Tap $XRP
for the live chart. NFA
XRP army, is 1.40 next? 👇
#XRP #Ripple #FOMCWatch
No Binance account yet? Get 20% of your trading fees back 👉 Sign up on Binance
8
·
--
Bullish
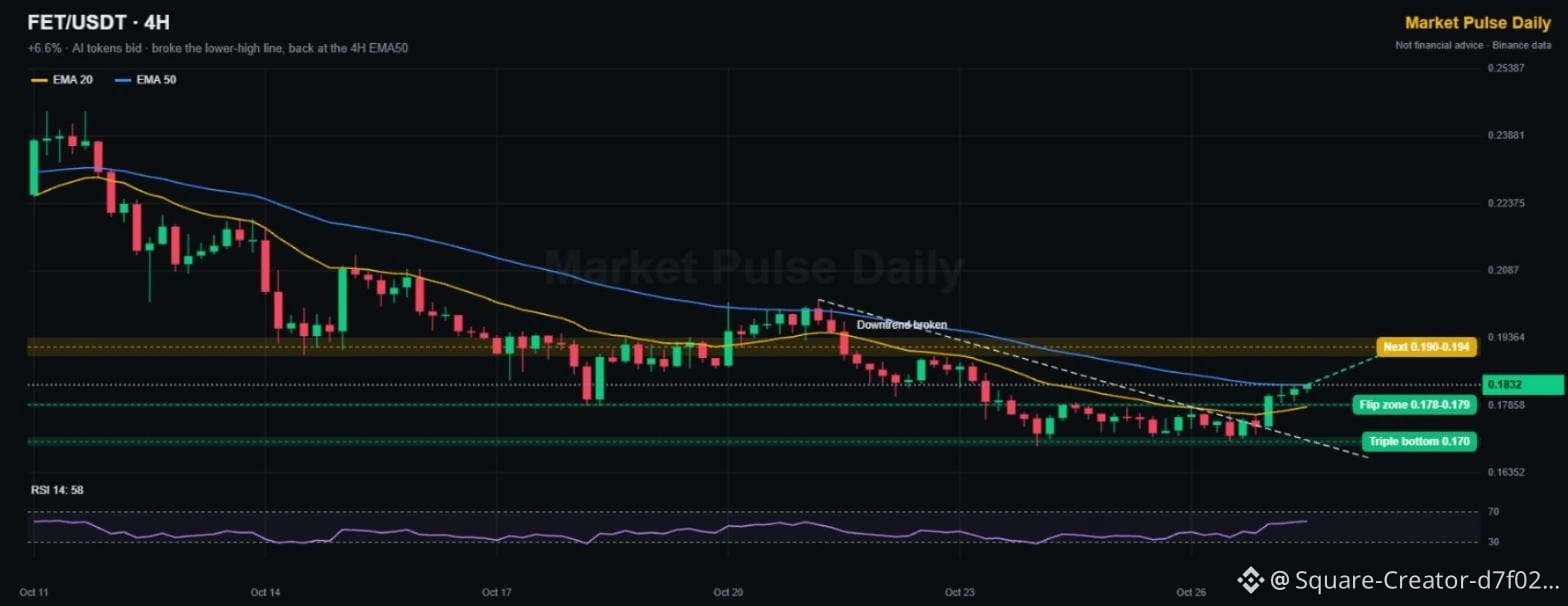
$FET is waking up with the AI coins 🤖
+6.6% today after a triple bottom near 0.170. Price broke the lower-high line from Oct 21 and is now testing the 4H EMA50 around 0.183, the level that rejected every bounce for two weeks.
🟢 Flip zone: 0.178-0.179
🟢 Triple bottom: 0.170
🎯 Next: 0.190-0.194
A 4H close above the EMA50 would confirm the trend change.
👉 Tap $FET
for the live chart. NFA
Which AI coin are you watching this week? 👇
#AIcrypto #Altcoins #CanMicrosoftDeliverOnAI
No Binance account yet? Get 20% of your trading fees back 👉 [Sign up on Binance](https://www.binance.com/register?ref=TGCSTKKM)
{spot}(FETUSDT)
$FET is waking up with the AI coins 🤖
+6.6% today after a triple bottom near 0.170. Price broke the lower-high line from Oct 21 and is now testing the 4H EMA50 around 0.183, the level that rejected every bounce for two weeks.
🟢 Flip zone: 0.178-0.179
🟢 Triple bottom: 0.170
🎯 Next: 0.190-0.194
A 4H close above the EMA50 would confirm the trend change.
👉 Tap $FET
for the live chart. NFA
Which AI coin are you watching this week? 👇
#AIcrypto #Altcoins #CanMicrosoftDeliverOnAI
No Binance account yet? Get 20% of your trading fees back 👉 Sign up on Binance
12
·
--
Bullish
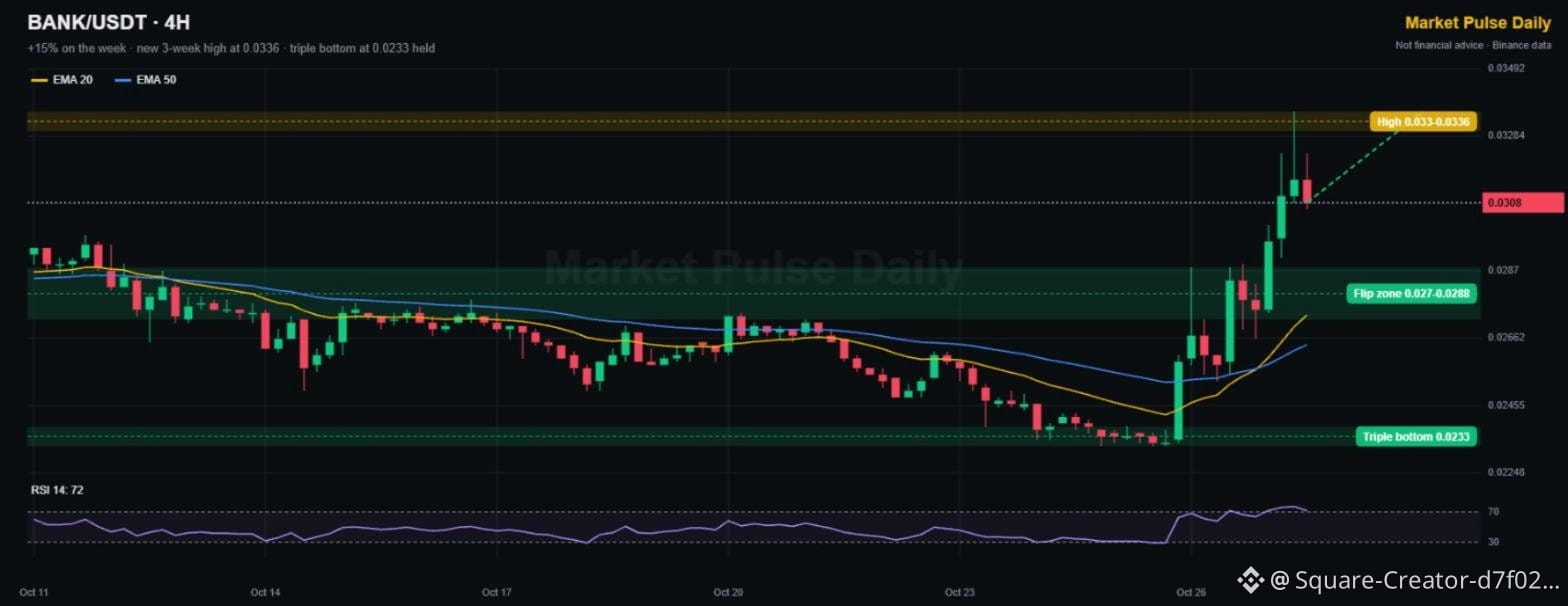
$BANK went from a triple bottom to a 3-week high in two days 🏦
Buyers defended 0.0233 three times, then price ripped through the 0.027-0.0288 ceiling and tagged 0.0336. +15% on the week, and both 4H EMAs are now curling up under price.
🔴 High: 0.033-0.0336
🟢 Flip zone: 0.027-0.0288
🟢 Triple bottom: 0.0233
RSI is 72. A retest of 0.0288 that holds would be the textbook continuation.
👉 Tap $BANK
for the live chart. NFA
New high this week: yes or no? 👇
#TopGainers #Altcoins #FOMCWatch
No Binance account yet? Get 20% of your trading fees back 👉 [Sign up on Binance](https://www.binance.com/register?ref=TGCSTKKM)
{spot}(BANKUSDT)
$BANK went from a triple bottom to a 3-week high in two days 🏦
Buyers defended 0.0233 three times, then price ripped through the 0.027-0.0288 ceiling and tagged 0.0336. +15% on the week, and both 4H EMAs are now curling up under price.
🔴 High: 0.033-0.0336
🟢 Flip zone: 0.027-0.0288
🟢 Triple bottom: 0.0233
RSI is 72. A retest of 0.0288 that holds would be the textbook continuation.
👉 Tap $BANK
for the live chart. NFA
New high this week: yes or no? 👇
#TopGainers #Altcoins #FOMCWatch
No Binance account yet? Get 20% of your trading fees back 👉 Sign up on Binance
57
·
--
Bullish
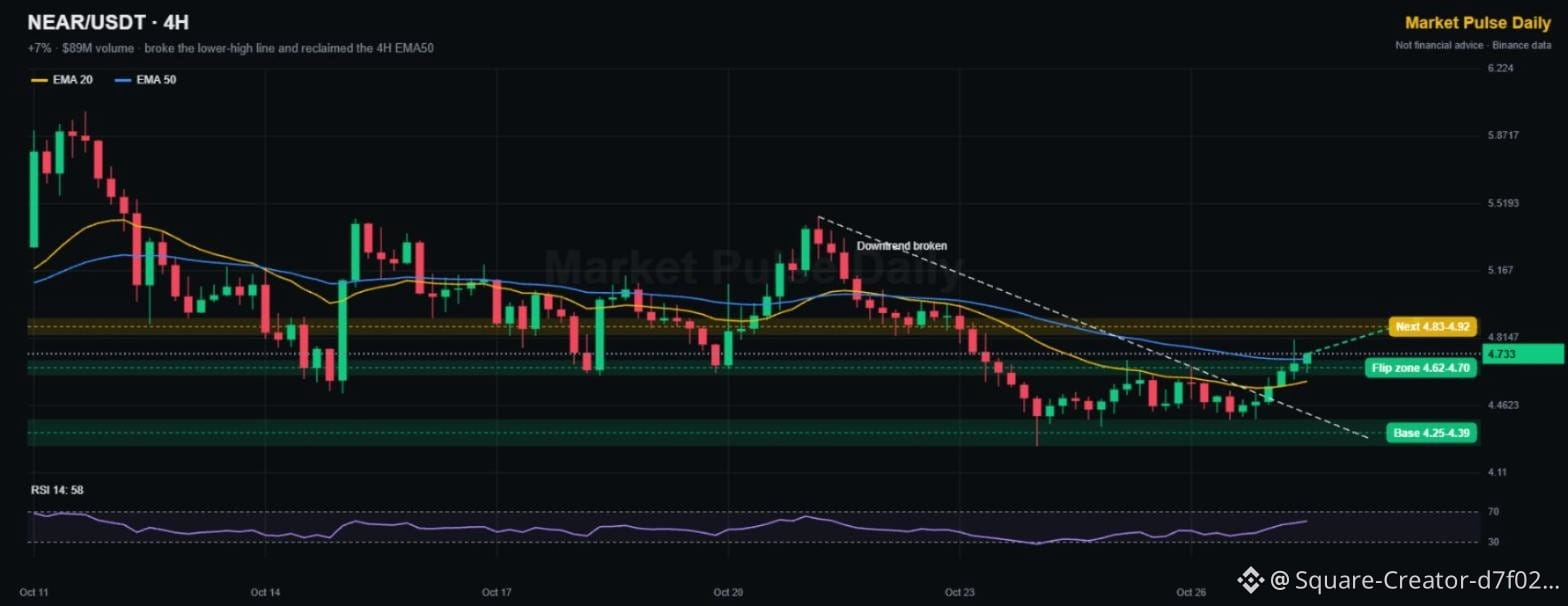
$NEAR just broke its week-long downtrend 📈
+7% today on $89M of volume, one of the busiest large caps on the board. Price punched through the lower-high line from Oct 21 and reclaimed the 4H EMA50 at 4.70.
🟢 Flip zone: 4.62-4.70
🟢 Base: 4.25-4.39
🎯 Next: 4.83-4.92
As long as 4.62 holds on a 4H close, the breakout stays valid.
👉 Tap $NEAR
to check the live chart. NFA
Is AI x crypto waking up again? 👇
#NEAR #Altcoins #FOMCWatch
No Binance account yet? Get 20% of your trading fees back 👉 [Sign up on Binance](https://www.binance.com/register?ref=TGCSTKKM)
{spot}(NEARUSDT)
$NEAR just broke its week-long downtrend 📈
+7% today on $89M of volume, one of the busiest large caps on the board. Price punched through the lower-high line from Oct 21 and reclaimed the 4H EMA50 at 4.70.
🟢 Flip zone: 4.62-4.70
🟢 Base: 4.25-4.39
🎯 Next: 4.83-4.92
As long as 4.62 holds on a 4H close, the breakout stays valid.
👉 Tap $NEAR
to check the live chart. NFA
Is AI x crypto waking up again? 👇
#NEAR #Altcoins #FOMCWatch
No Binance account yet? Get 20% of your trading fees back 👉 Sign up on Binance
25
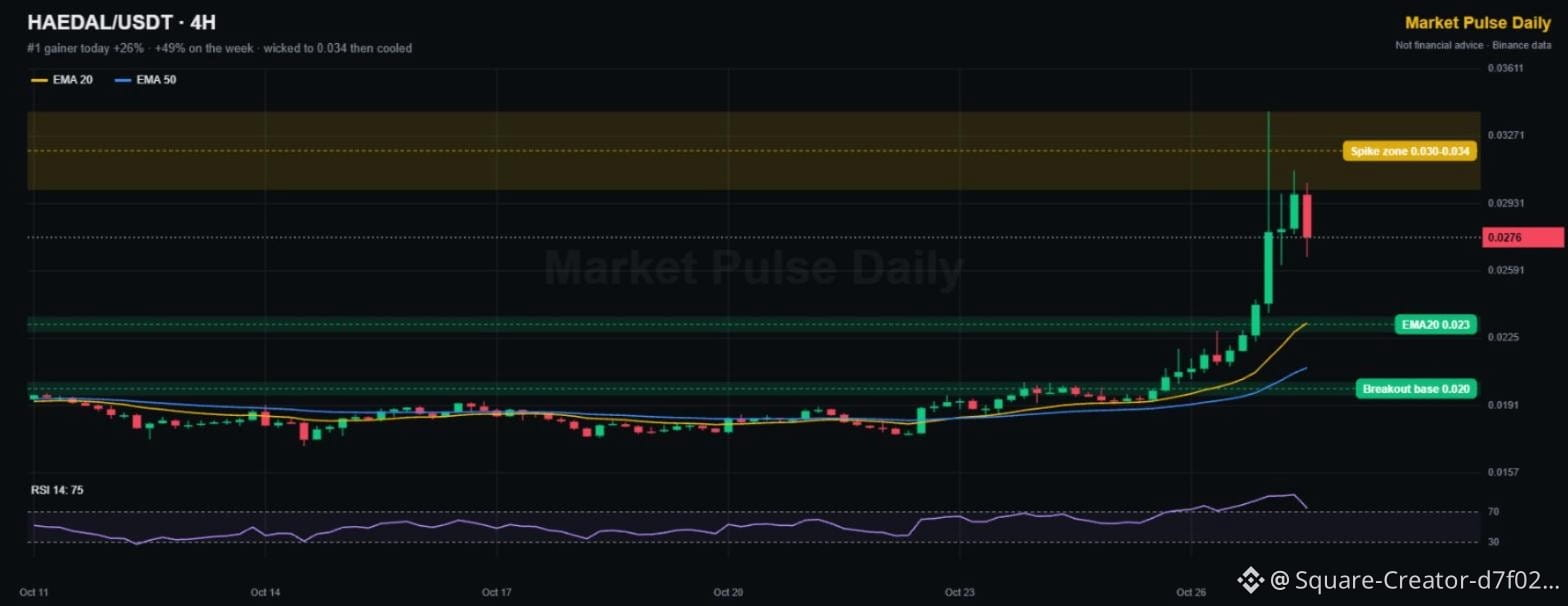
$HAEDAL is the #1 gainer on Binance today, +26% and almost +50% on the week 🚀
After two weeks flat near 0.019, it broke out and wicked all the way to 0.034. Now it's cooling at 0.0276 with RSI near 75. That long upper wick shows sellers are active up there.
🔴 Spike zone: 0.030-0.034
🟢 EMA20: around 0.023
🟢 Breakout base: 0.020
Chasing vertical candles is how people buy tops. A calm pullback that holds 0.023 is the healthier setup.
👉 Tap $HAEDAL
for the live chart. NFA
Would you buy here or wait for the dip? 👇
#TopGainers #Altcoins #FOMCWatch
No Binance account yet? Get 20% of your trading fees back 👉 [Sign up on Binance](https://www.binance.com/register?ref=TGCSTKKM)
{spot}(HAEDALUSDT)
$HAEDAL is the #1 gainer on Binance today, +26% and almost +50% on the week 🚀
After two weeks flat near 0.019, it broke out and wicked all the way to 0.034. Now it's cooling at 0.0276 with RSI near 75. That long upper wick shows sellers are active up there.
🔴 Spike zone: 0.030-0.034
🟢 EMA20: around 0.023
🟢 Breakout base: 0.020
Chasing vertical candles is how people buy tops. A calm pullback that holds 0.023 is the healthier setup.
👉 Tap $HAEDAL
for the live chart. NFA
Would you buy here or wait for the dip? 👇
#TopGainers #Altcoins #FOMCWatch
No Binance account yet? Get 20% of your trading fees back 👉 Sign up on Binance
28
·
--
Bullish
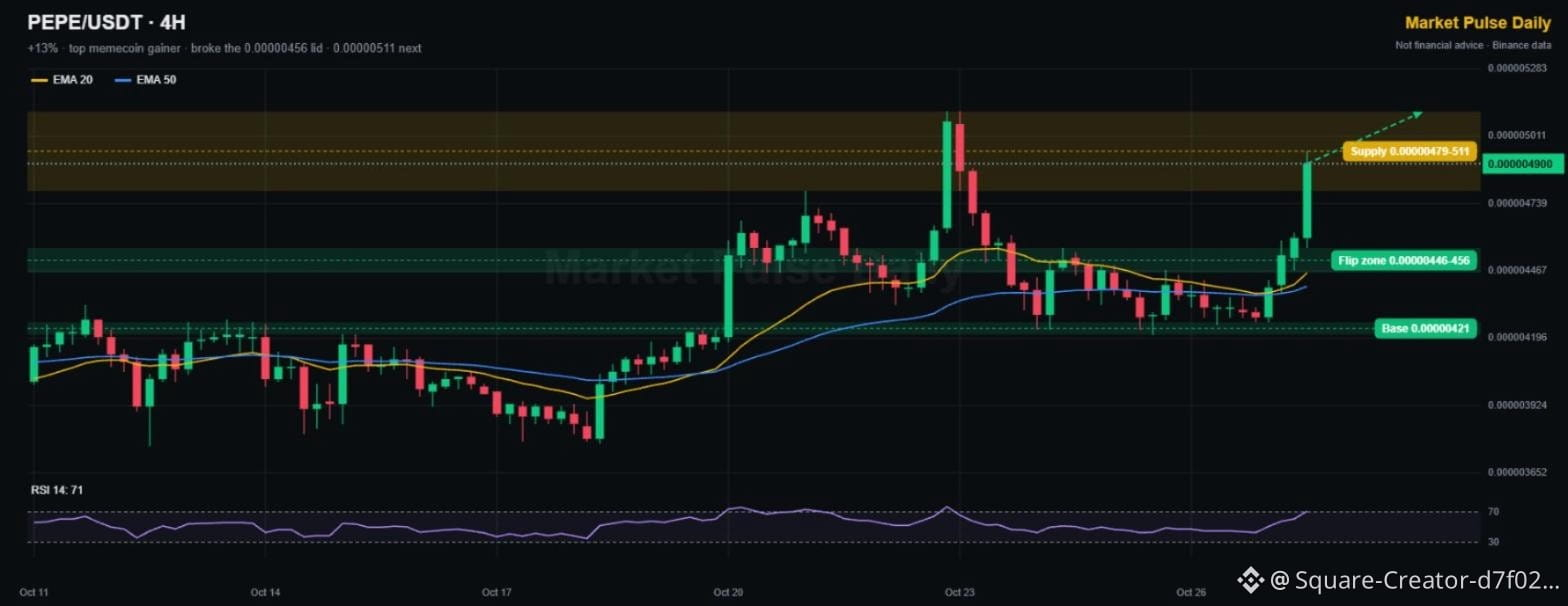
$PEPE is the top memecoin gainer today, +13% 🐸
One big 4H candle cleared the 0.00000456 lid that capped it for four days. Now it's running into the Oct 22 supply zone, where the last rally got sold hard.
🟢 Flip zone: 0.00000446-0.00000456
🟢 Base: 0.00000421
🔴 Supply: 0.00000479-0.00000511
RSI is 71, so expect some chop here. Holding the flip zone keeps 0.00000511 in play.
👉 Tap $PEPE
to watch the live chart. NFA
Frog season back, or one-candle wonder? 👇
#PEPE #Memecoins #FOMCWatch
No Binance account yet? Get 20% of your trading fees back 👉 [Sign up on Binance](https://www.binance.com/register?ref=TGCSTKKM)
{spot}(PEPEUSDT)
$PEPE is the top memecoin gainer today, +13% 🐸
One big 4H candle cleared the 0.00000456 lid that capped it for four days. Now it's running into the Oct 22 supply zone, where the last rally got sold hard.
🟢 Flip zone: 0.00000446-0.00000456
🟢 Base: 0.00000421
🔴 Supply: 0.00000479-0.00000511
RSI is 71, so expect some chop here. Holding the flip zone keeps 0.00000511 in play.
👉 Tap $PEPE
to watch the live chart. NFA
Frog season back, or one-candle wonder? 👇
#PEPE #Memecoins #FOMCWatch
No Binance account yet? Get 20% of your trading fees back 👉 Sign up on Binance
9
Article
Support and Resistance for Beginners: 5 Rules With Real ChartsAlmost every chart post on Square mentions support and resistance. If you're newer to trading, those words can sound like jargon. They're actually the simplest and most useful tools in technical analysis. Here are five rules, explained with charts from this week.
What they mean
Support is a price area where buyers have repeatedly stepped in and stopped a fall. Resistance is an area where sellers have repeatedly stepped in and stopped a rise. They work because traders remember those prices: people who missed a bounce wait to buy there next time, and people stuck at a top wait to sell when price gets back to break-even.
Rule one: think in zones, not lines
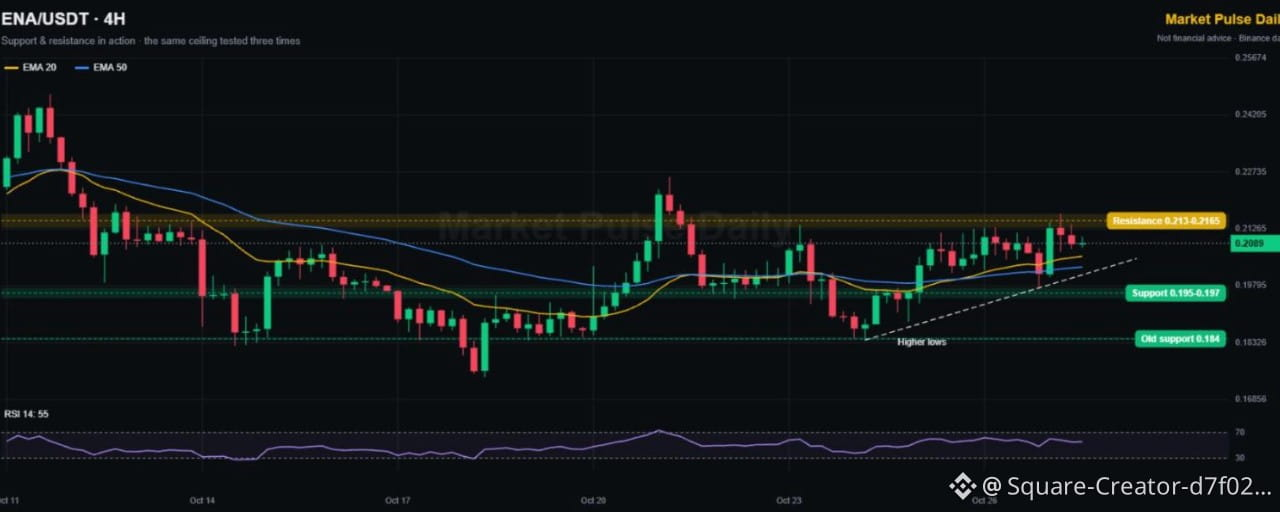
Price rarely turns at an exact number. Look at $ENA in the cover chart: its ceiling isn't one price, it's a band from 0.213 to 0.2165. Drawing zones instead of thin lines stops you from getting faked out by a small wick.
Rule two: more touches means a more important level
Ethena has hit that 0.213-0.2165 band three times since Oct 21 and been rejected each time. That makes it a level the whole market is watching. But there's a twist: every retest also uses up some of the sellers sitting there, so a level tested many times can eventually give way.
Rule three: broken resistance often becomes support
This is called a role reversal, or a flip. When price breaks above a ceiling, the buyers who missed it often wait for a pullback to that same area. Zcash showed this nicely this week: the 1,239-1,268 area capped it for days, then after the breakout it became the first support to watch.
Rule four: watch the lows, not just the levels
When price keeps knocking on the same resistance but each dip stops higher than the last, buyers are getting more aggressive. $DOGE is a good example: lows at 0.0748, then 0.0760, then 0.0767, all under the same 0.0801-0.0807 lid. Rising lows under flat resistance often build toward a breakout. Falling highs over flat support often build toward a breakdown.
Rule five: let the candle close
A wick through resistance is not a breakout. Many traders wait for a full candle to close beyond the zone on their chosen timeframe, for example the 4H, before treating it as real. It costs you a little of the move, but it filters out a lot of fake breakouts, especially around big news like today's Fed decision.
Putting it together
Before you look at any trade, mark three things: the nearest support zone, the nearest resistance zone, and whether the lows or highs are trending. On the cover chart, that reads: resistance 0.213-0.2165, support 0.195-0.197, and higher lows. That's a market leaning up but still capped, and a 4H close above 0.2165 is what would change the picture for $ENA .
Support and resistance won't predict the future, but they tell you where the important decisions happen, and where your idea is proven wrong.
Which coin should I break down next with these rules? Drop it in the comments, and follow Market Pulse Daily for daily charts. Not financial advice (NFA).
#TechnicalAnalysis #TradingTips #FOMCWatch
No Binance account yet? Get 20% of your trading fees back 👉 [Sign up on Binance](https://www.binance.com/register?ref=TGCSTKKM)
{spot}(ENAUSDT)
Support and Resistance for Beginners: 5 Rules With Real Charts
Almost every chart post on Square mentions support and resistance. If you're newer to trading, those words can sound like jargon. They're actually the simplest and most useful tools in technical analysis. Here are five rules, explained with charts from this week.
What they mean
Support is a price area where buyers have repeatedly stepped in and stopped a fall. Resistance is an area where sellers have repeatedly stepped in and stopped a rise. They work because traders remember those prices: people who missed a bounce wait to buy there next time, and people stuck at a top wait to sell when price gets back to break-even.
Rule one: think in zones, not lines
Price rarely turns at an exact number. Look at $ENA in the cover chart: its ceiling isn't one price, it's a band from 0.213 to 0.2165. Drawing zones instead of thin lines stops you from getting faked out by a small wick.
Rule two: more touches means a more important level
Ethena has hit that 0.213-0.2165 band three times since Oct 21 and been rejected each time. That makes it a level the whole market is watching. But there's a twist: every retest also uses up some of the sellers sitting there, so a level tested many times can eventually give way.
Rule three: broken resistance often becomes support
This is called a role reversal, or a flip. When price breaks above a ceiling, the buyers who missed it often wait for a pullback to that same area. Zcash showed this nicely this week: the 1,239-1,268 area capped it for days, then after the breakout it became the first support to watch.
Rule four: watch the lows, not just the levels
When price keeps knocking on the same resistance but each dip stops higher than the last, buyers are getting more aggressive. $DOGE is a good example: lows at 0.0748, then 0.0760, then 0.0767, all under the same 0.0801-0.0807 lid. Rising lows under flat resistance often build toward a breakout. Falling highs over flat support often build toward a breakdown.
Rule five: let the candle close
A wick through resistance is not a breakout. Many traders wait for a full candle to close beyond the zone on their chosen timeframe, for example the 4H, before treating it as real. It costs you a little of the move, but it filters out a lot of fake breakouts, especially around big news like today's Fed decision.
Putting it together
Before you look at any trade, mark three things: the nearest support zone, the nearest resistance zone, and whether the lows or highs are trending. On the cover chart, that reads: resistance 0.213-0.2165, support 0.195-0.197, and higher lows. That's a market leaning up but still capped, and a 4H close above 0.2165 is what would change the picture for $ENA .
Support and resistance won't predict the future, but they tell you where the important decisions happen, and where your idea is proven wrong.
Which coin should I break down next with these rules? Drop it in the comments, and follow Market Pulse Daily for daily charts. Not financial advice (NFA).
#TechnicalAnalysis #TradingTips #FOMCWatch
No Binance account yet? Get 20% of your trading fees back 👉 Sign up on Binance
41
Log in to explore more content
Join global crypto users on Binance Square
⚡️ Get latest and useful information about crypto.
💬 Trusted by the world’s largest crypto exchange.
👍 Discover real insights from verified creators.
Email / Phone number