
嬴政
119 Posts

嬴政
Report
Block User
主要行情分析主流币,钻研精确点位入场。
High-Frequency Trader
6.7 Years
38 Following
39 Followers
45 Liked
Posts
·
--
Ethereum market analysis, Nov. 4: Open the first position at 2360 and add another at 2320. Stop loss at 2300. Hold until 2630. Long-term. The daily indicators are halfway to a golden cross, and a MACD golden cross is forming. If it hits 2630, short it straight down to around 2450, then go long. Hold on tight until it gets above 2800. #ETH
Ethereum market analysis, Nov. 4: Open the first position at 2360 and add another at 2320. Stop loss at 2300. Hold until 2630. Long-term. The daily indicators are halfway to a golden cross, and a MACD golden cross is forming. If it hits 2630, short it straight down to around 2450, then go long. Hold on tight until it gets above 2800. #ETH
1
1
826
·
--
Bullish
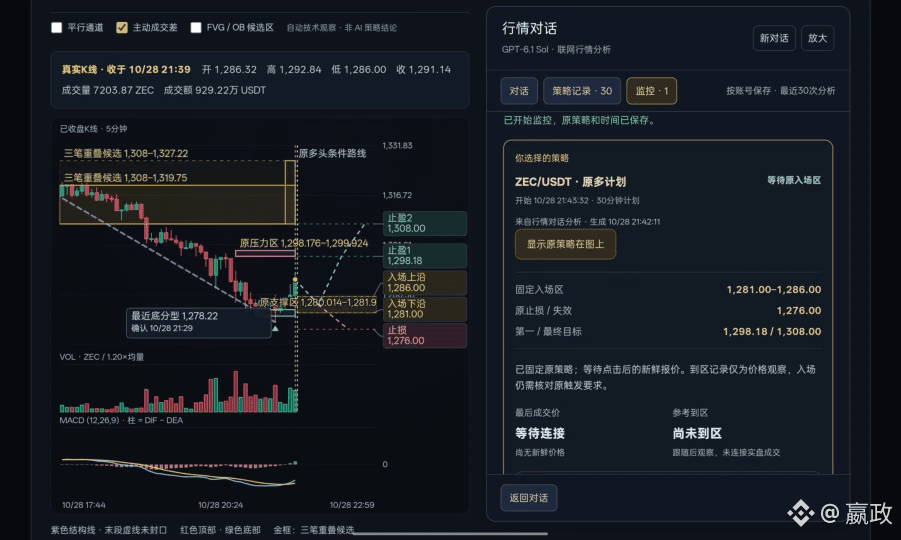
#zec ZEC/USDT · Binance Perpetual · Next 30 minutes
Generated: 2026/10/28 21:42:11; Market close: 2026/10/28 21:39:59
Action at the time: AI conditional plan · Pre-entry check; Directional bias: Slightly bullish
Conditional entry zone: 1,281–1,286
Stop loss / invalidation: 1,276
First target: 1,298.18; Second target: 1,308
Cost-adjusted estimated reward-to-risk ratio: 0.82R / 1.63R
AI independent conditional plan; no calibrated win rate yet
Entry model: Independent AI structural assessment
The entry zone overlaps with the 5-minute support at 1280.014–1281.966 and is close to the latest low at 1278.22 and a candidate bullish OB zone. The stop at 1276 is beyond the latest low and no more than 2 five-minute ATRs away; 1298.18 corresponds to a confirmed resistance zone, while 1308 corresponds to the lower boundary of an observed structural overlap. Neither target exceeds the observable price range. This plan uses a potential 5-minute strengthening signal and a rising 4-hour structure, but is constrained by falling 5-minute highs and lows, a 1-hour break below 1302.07, and net-negative aggressive order flow. A pullback confirmation is required.
Trigger conditions: Wait for price to pull back into the 1281–1286 zone. During the pullback, price must not first close below 1278.22 on a 5-minute candle; it must then close back above 1286.46 on a 5-minute candle before entry. Price is currently above the entry zone; do not chase long. Cancel this plan if 1298.18 is reached first.
Structural references: Entry SUPPORT 1280.0144–1281.9656; Invalidation LOW 1278.22–1278.22.
Price formatting, same-snapshot consistency, structural references, and cost checks are complete; this does not validate directional accuracy.
Latest entry time: 2026-10-28T13:49:59.999Z;
#zec ZEC/USDT · Binance Perpetual · Next 30 minutes
Generated: 2026/10/28 21:42:11; Market close: 2026/10/28 21:39:59
Action at the time: AI conditional plan · Pre-entry check; Directional bias: Slightly bullish
Conditional entry zone: 1,281–1,286
Stop loss / invalidation: 1,276
First target: 1,298.18; Second target: 1,308
Cost-adjusted estimated reward-to-risk ratio: 0.82R / 1.63R
AI independent conditional plan; no calibrated win rate yet
Entry model: Independent AI structural assessment
The entry zone overlaps with the 5-minute support at 1280.014–1281.966 and is close to the latest low at 1278.22 and a candidate bullish OB zone. The stop at 1276 is beyond the latest low and no more than 2 five-minute ATRs away; 1298.18 corresponds to a confirmed resistance zone, while 1308 corresponds to the lower boundary of an observed structural overlap. Neither target exceeds the observable price range. This plan uses a potential 5-minute strengthening signal and a rising 4-hour structure, but is constrained by falling 5-minute highs and lows, a 1-hour break below 1302.07, and net-negative aggressive order flow. A pullback confirmation is required.
Trigger conditions: Wait for price to pull back into the 1281–1286 zone. During the pullback, price must not first close below 1278.22 on a 5-minute candle; it must then close back above 1286.46 on a 5-minute candle before entry. Price is currently above the entry zone; do not chase long. Cancel this plan if 1298.18 is reached first.
Structural references: Entry SUPPORT 1280.0144–1281.9656; Invalidation LOW 1278.22–1278.22.
Price formatting, same-snapshot consistency, structural references, and cost checks are complete; this does not validate directional accuracy.
Latest entry time: 2026-10-28T13:49:59.999Z;
Generated: 2026/10/28 21:42:11; Market close: 2026/10/28 21:39:59
Action at the time: AI conditional plan · Pre-entry check; Directional bias: Slightly bullish
Conditional entry zone: 1,281–1,286
Stop loss / invalidation: 1,276
First target: 1,298.18; Second target: 1,308
Cost-adjusted estimated reward-to-risk ratio: 0.82R / 1.63R
AI independent conditional plan; no calibrated win rate yet
Entry model: Independent AI structural assessment
The entry zone overlaps with the 5-minute support at 1280.014–1281.966 and is close to the latest low at 1278.22 and a candidate bullish OB zone. The stop at 1276 is beyond the latest low and no more than 2 five-minute ATRs away; 1298.18 corresponds to a confirmed resistance zone, while 1308 corresponds to the lower boundary of an observed structural overlap. Neither target exceeds the observable price range. This plan uses a potential 5-minute strengthening signal and a rising 4-hour structure, but is constrained by falling 5-minute highs and lows, a 1-hour break below 1302.07, and net-negative aggressive order flow. A pullback confirmation is required.
Trigger conditions: Wait for price to pull back into the 1281–1286 zone. During the pullback, price must not first close below 1278.22 on a 5-minute candle; it must then close back above 1286.46 on a 5-minute candle before entry. Price is currently above the entry zone; do not chase long. Cancel this plan if 1298.18 is reached first.
Structural references: Entry SUPPORT 1280.0144–1281.9656; Invalidation LOW 1278.22–1278.22.
Price formatting, same-snapshot consistency, structural references, and cost checks are complete; this does not validate directional accuracy.
Latest entry time: 2026-10-28T13:49:59.999Z;
150
·
--
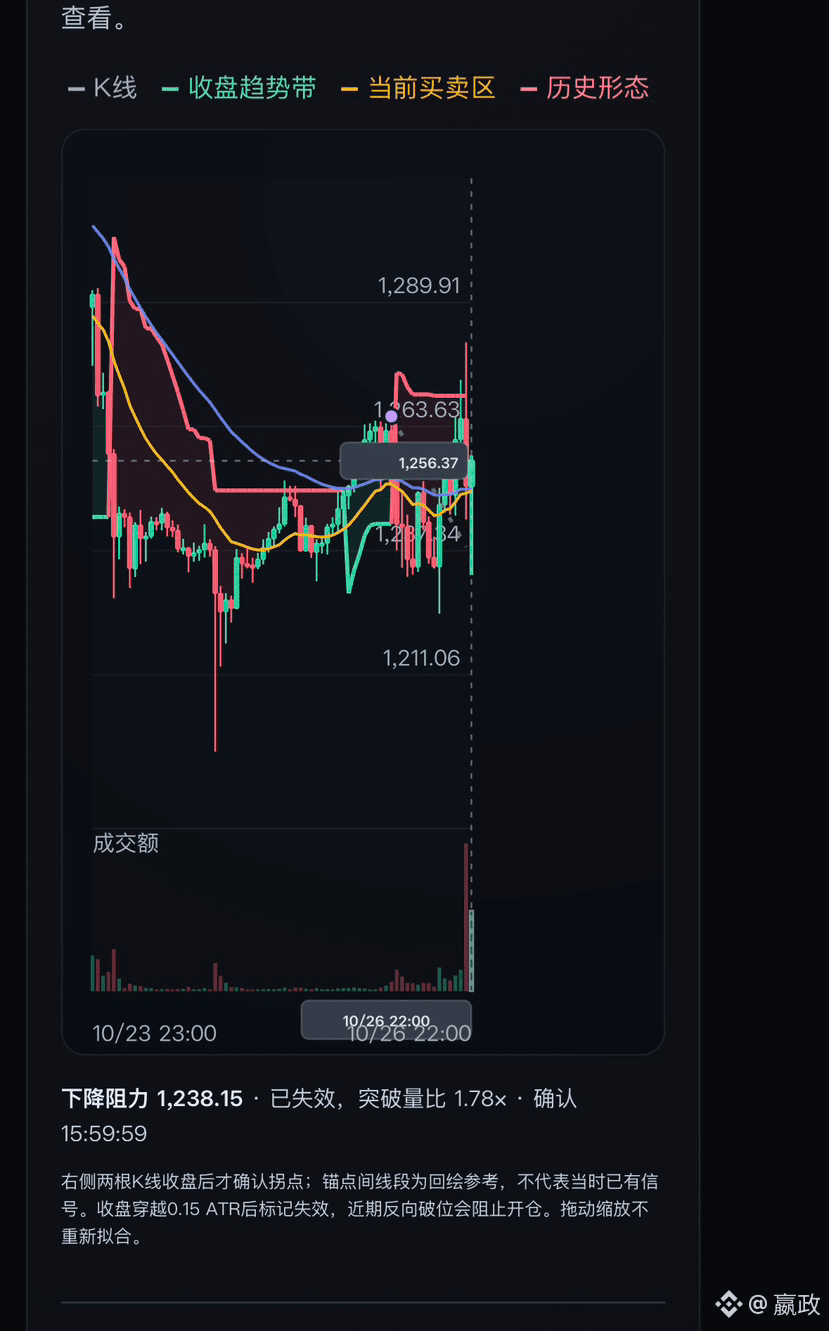
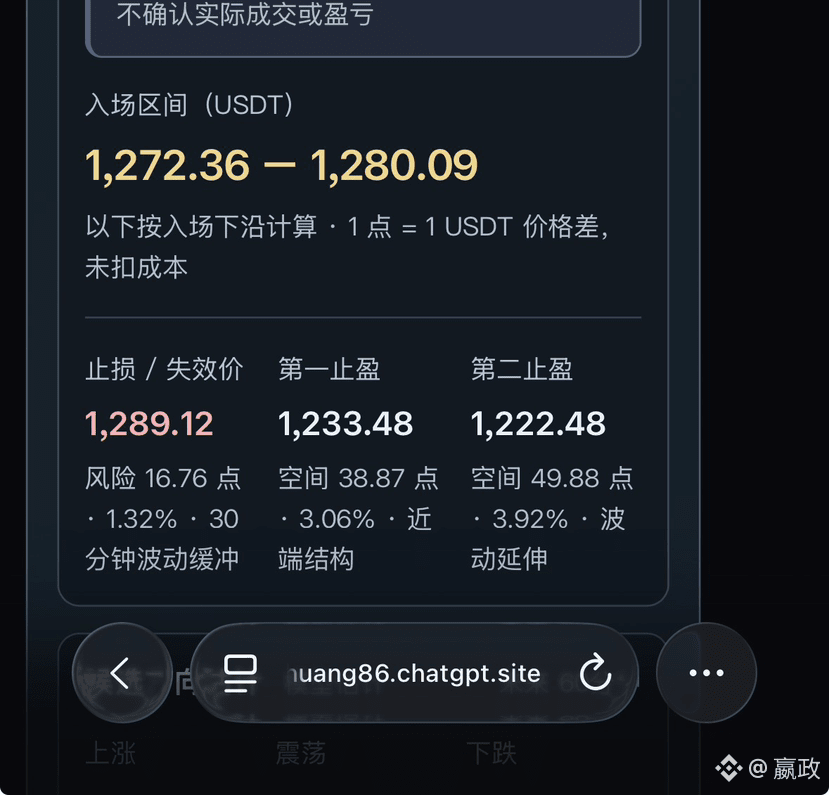
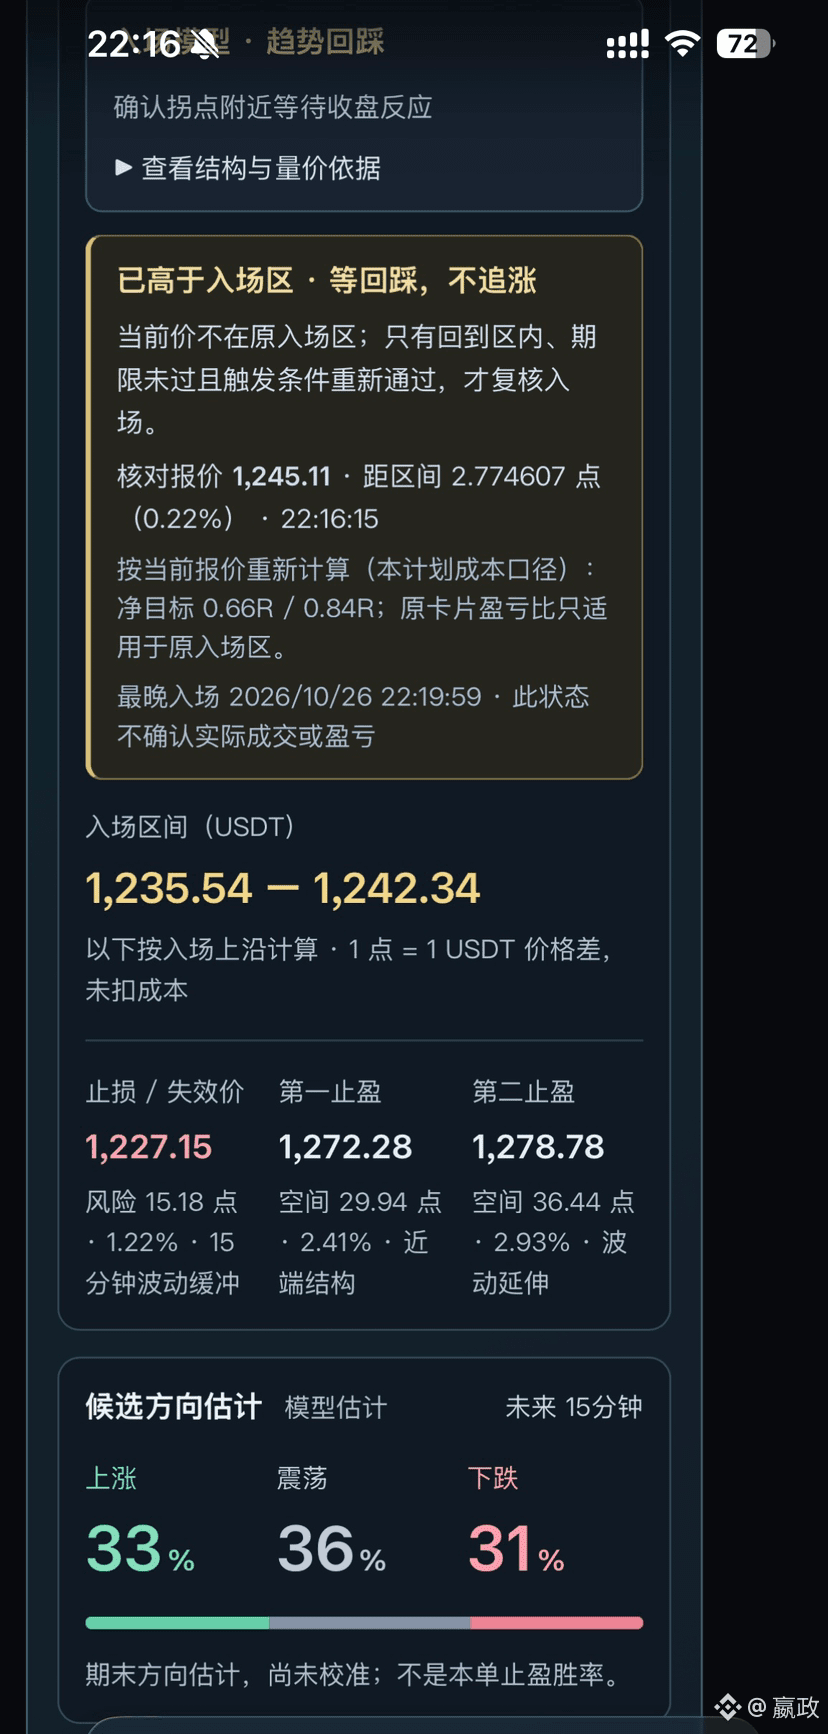
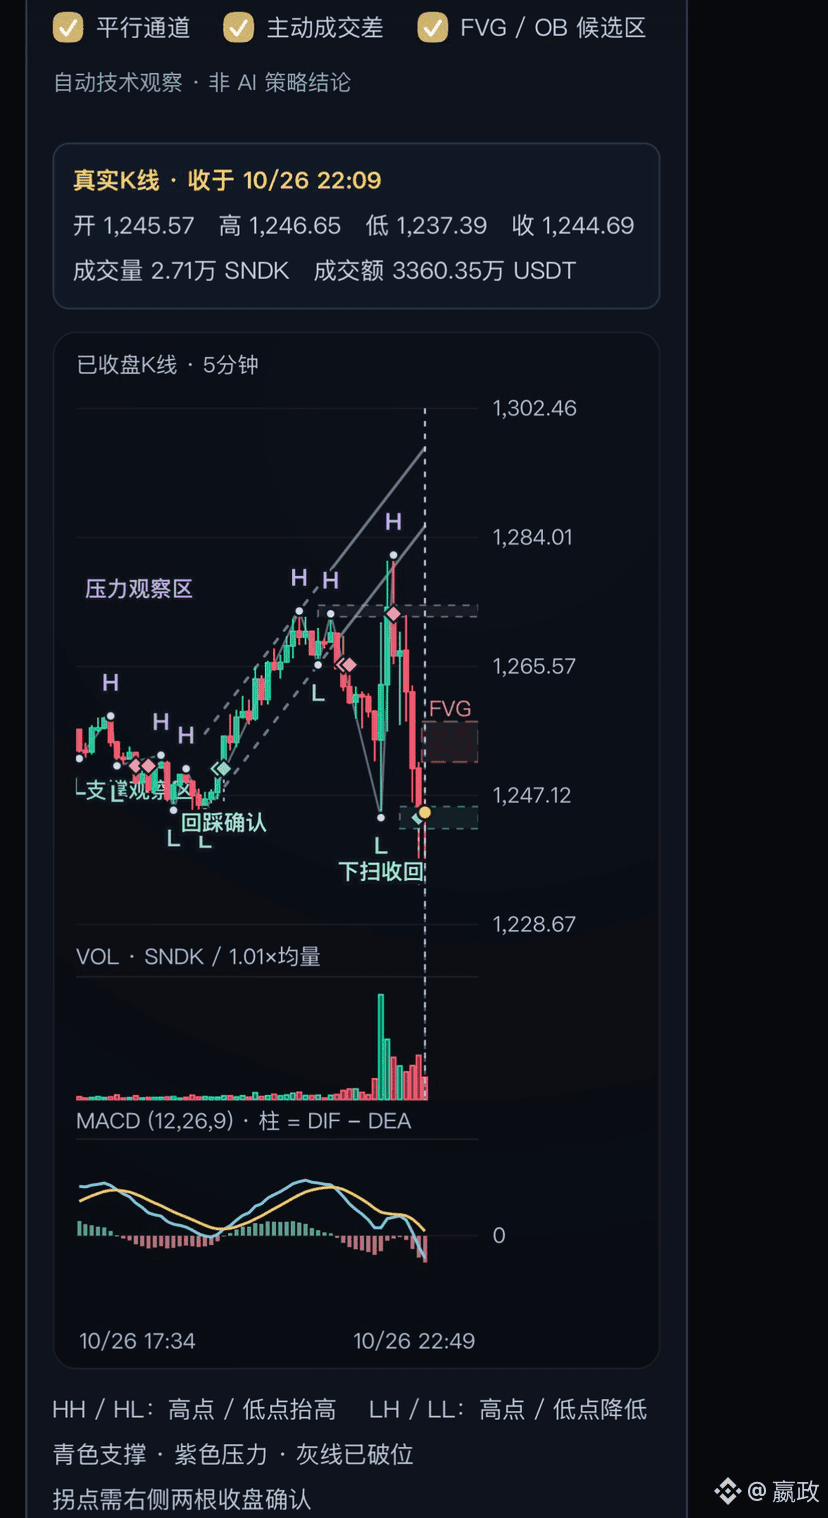
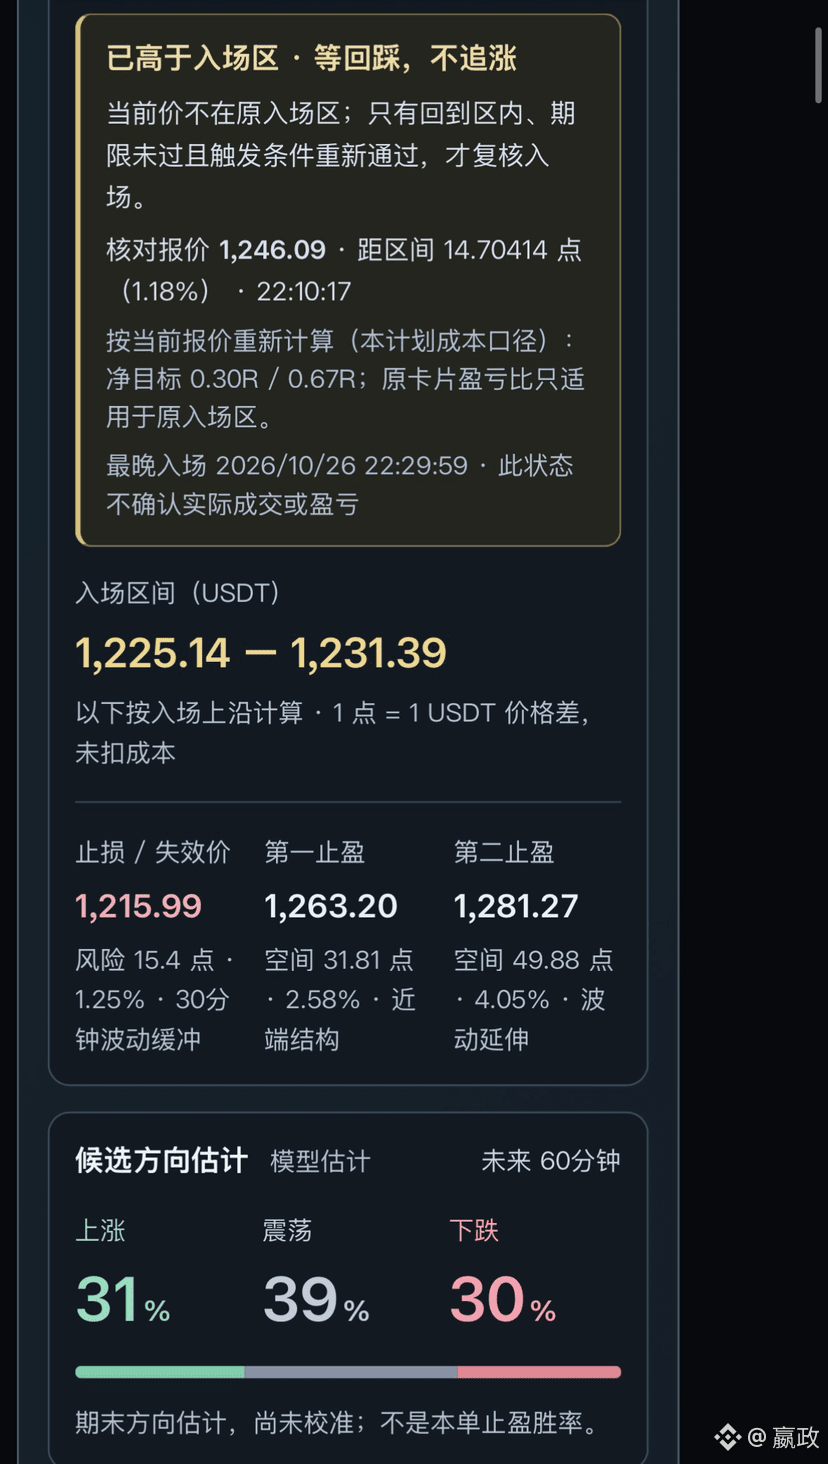
#sndk SNDK/USDT · Binance Perpetual · Next 1 Hour
Generated at: 2026/10/26 22:49:35; Market close: 2026/10/26 22:44:59
Current action: AI analysis completed · Waiting for structure confirmation; Directional view: Neutral
No valid structural price level
AI independent conditional setup; no calibrated win rate yet
The 1-hour chart shows a false breakout on increased volume followed by a pullback, while the 5-minute chart remains in a downward rhythm. On the 4-hour chart, lows are rising and the 1,230.88 sweep was reclaimed; however, volume ratio at 1.40x has not confirmed a reversal. The daily chart has only 6 candles, with no fractals or strokes, ATR not calculated, and Chan theory structure is insufficient. Wait for the 1-hour close to break above 1,257.4 and hold 1,252.6, or break below 1,229.7 and fail to rebound above 1,233.9 before determining direction.
There is no complete conditional entry plan this time; no rule-based fallback plan will be added.
Data source: Binance USDⓈ-M browser fallback market data · Verified by server-side formatting and timeliness checks, source not independently reviewed
Historical condition snapshot, market data must be reloaded before entry. Probability not calibrated; not a winning rate.
#sndk SNDK/USDT · Binance Perpetual · Next 1 Hour
Generated at: 2026/10/26 22:49:35; Market close: 2026/10/26 22:44:59
Current action: AI analysis completed · Waiting for structure confirmation; Directional view: Neutral
No valid structural price level
AI independent conditional setup; no calibrated win rate yet
The 1-hour chart shows a false breakout on increased volume followed by a pullback, while the 5-minute chart remains in a downward rhythm. On the 4-hour chart, lows are rising and the 1,230.88 sweep was reclaimed; however, volume ratio at 1.40x has not confirmed a reversal. The daily chart has only 6 candles, with no fractals or strokes, ATR not calculated, and Chan theory structure is insufficient. Wait for the 1-hour close to break above 1,257.4 and hold 1,252.6, or break below 1,229.7 and fail to rebound above 1,233.9 before determining direction.
There is no complete conditional entry plan this time; no rule-based fallback plan will be added.
Data source: Binance USDⓈ-M browser fallback market data · Verified by server-side formatting and timeliness checks, source not independently reviewed
Historical condition snapshot, market data must be reloaded before entry. Probability not calibrated; not a winning rate.
Generated at: 2026/10/26 22:49:35; Market close: 2026/10/26 22:44:59
Current action: AI analysis completed · Waiting for structure confirmation; Directional view: Neutral
No valid structural price level
AI independent conditional setup; no calibrated win rate yet
The 1-hour chart shows a false breakout on increased volume followed by a pullback, while the 5-minute chart remains in a downward rhythm. On the 4-hour chart, lows are rising and the 1,230.88 sweep was reclaimed; however, volume ratio at 1.40x has not confirmed a reversal. The daily chart has only 6 candles, with no fractals or strokes, ATR not calculated, and Chan theory structure is insufficient. Wait for the 1-hour close to break above 1,257.4 and hold 1,252.6, or break below 1,229.7 and fail to rebound above 1,233.9 before determining direction.
There is no complete conditional entry plan this time; no rule-based fallback plan will be added.
Data source: Binance USDⓈ-M browser fallback market data · Verified by server-side formatting and timeliness checks, source not independently reviewed
Historical condition snapshot, market data must be reloaded before entry. Probability not calibrated; not a winning rate.
86
·
--
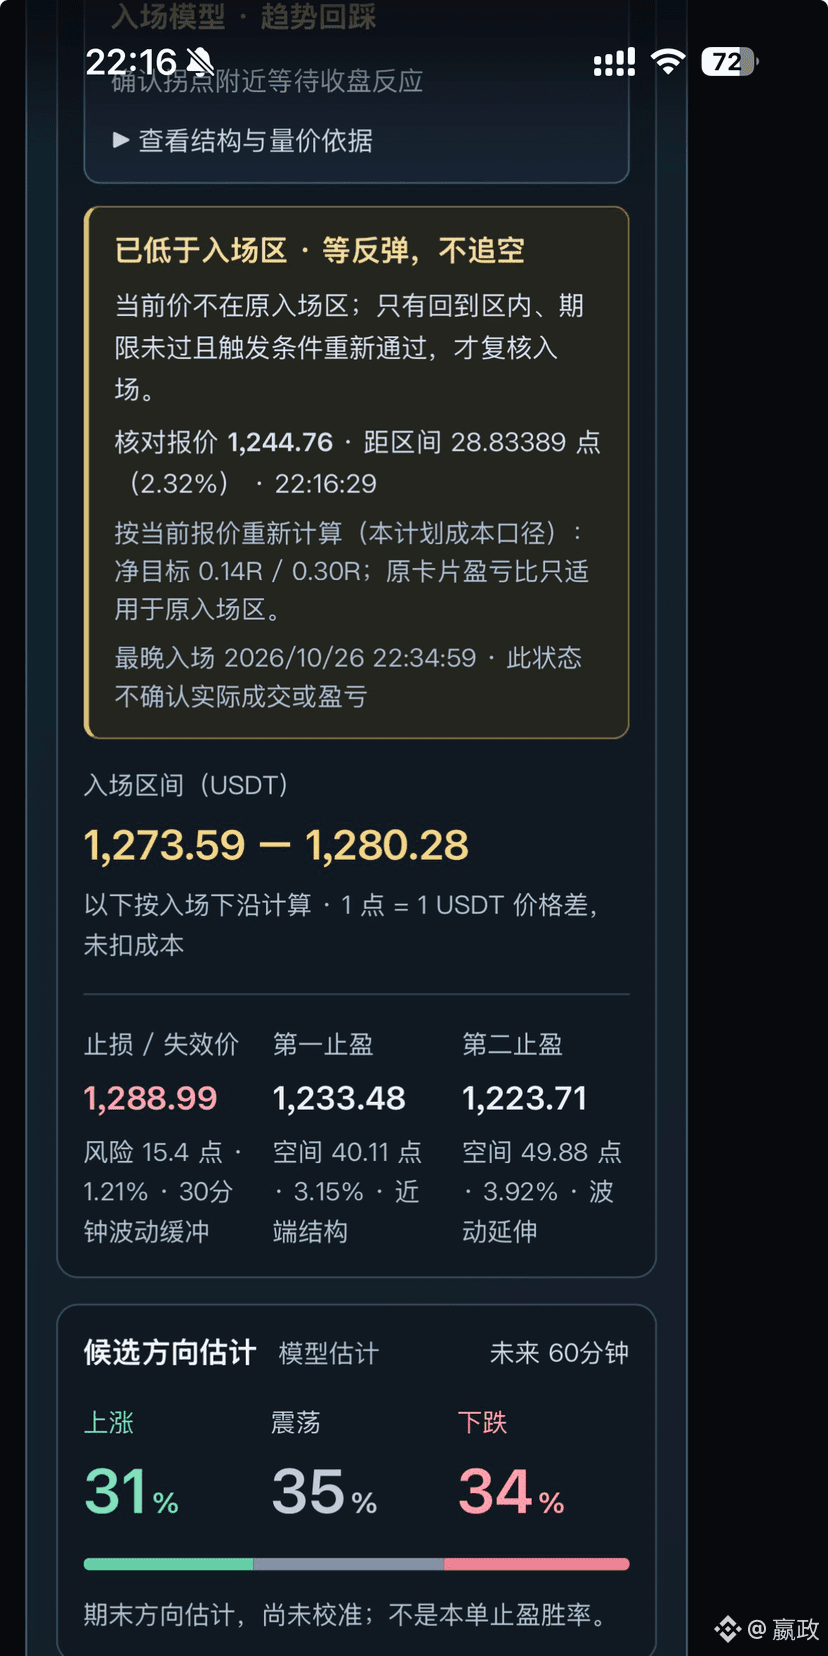
#SNDK is currently pulling back. I'll blindly follow the AI strategy; I can't be bothered to analyze anymore.
#SNDK is currently pulling back. I'll blindly follow the AI strategy; I can't be bothered to analyze anymore.
469
·
--
#sndk , go to 1300 SanDisk. I’m heading out first.
#sndk , go to 1300 SanDisk. I’m heading out first.
2
574
·
--
#币安神算子 BTC prediction points—why haven't they appeared yet? Is it only open for one day? Why do other people's points keep increasing? What exactly are they playing?
#币安神算子 BTC prediction points—why haven't they appeared yet? Is it only open for one day? Why do other people's points keep increasing? What exactly are they playing?

98
·
--
Where are #币安神算子 's BTC predictions? Why have they disappeared? They were still there yesterday. How come they're gone today?
Where are #币安神算子 's BTC predictions? Why have they disappeared? They were still there yesterday. How come they're gone today?


216
·
--
#SNDK Go long on SanDisk at 1391–1398, with a stop-loss at 1380, the first take-profit target at 1485, and the second at 1532.
#SNDK Go long on SanDisk at 1391–1398, with a stop-loss at 1380, the first take-profit target at 1485, and the second at 1532.
1
181
·
--
Multi-Timeframe Summary (1h / 4h / Daily / Weekly)#ETH
Current ETH price: 2377.86
I. Current Status Across Timeframes
1. 1-hour chart
All EMAs are bearishly aligned (the 7, 34, 50, and 200-period moving averages are above the price); MACD remains below the zero line, with green bars continuing; RSI(6) = 22.35, entering oversold territory; OBV is also trending downward, with volume confirming the decline; open interest has edged up, indicating continued short positions being opened during the decline.
Interpretation: The market is oversold in the short term, so a modest technical rebound may occur. However, any rebound is likely to be weak and part of the ongoing downtrend.
2. 4-hour chart
Moving averages are exerting bearish pressure, and the price has fallen below all short-term EMAs; MACD is below the zero line and widening downward; OBV has been trending steadily lower, with volume continuing to flow out; KDJ is at a low level.
Multi-Timeframe Summary (1h / 4h / Daily / Weekly)
#ETH
Current ETH price: 2377.86
I. Current Status Across Timeframes
1. 1-hour chart
All EMAs are bearishly aligned (the 7, 34, 50, and 200-period moving averages are above the price); MACD remains below the zero line, with green bars continuing; RSI(6) = 22.35, entering oversold territory; OBV is also trending downward, with volume confirming the decline; open interest has edged up, indicating continued short positions being opened during the decline.
Interpretation: The market is oversold in the short term, so a modest technical rebound may occur. However, any rebound is likely to be weak and part of the ongoing downtrend.
2. 4-hour chart
Moving averages are exerting bearish pressure, and the price has fallen below all short-term EMAs; MACD is below the zero line and widening downward; OBV has been trending steadily lower, with volume continuing to flow out; KDJ is at a low level.
Current ETH price: 2377.86
I. Current Status Across Timeframes
1. 1-hour chart
All EMAs are bearishly aligned (the 7, 34, 50, and 200-period moving averages are above the price); MACD remains below the zero line, with green bars continuing; RSI(6) = 22.35, entering oversold territory; OBV is also trending downward, with volume confirming the decline; open interest has edged up, indicating continued short positions being opened during the decline.
Interpretation: The market is oversold in the short term, so a modest technical rebound may occur. However, any rebound is likely to be weak and part of the ongoing downtrend.
2. 4-hour chart
Moving averages are exerting bearish pressure, and the price has fallen below all short-term EMAs; MACD is below the zero line and widening downward; OBV has been trending steadily lower, with volume continuing to flow out; KDJ is at a low level.
295
·
--
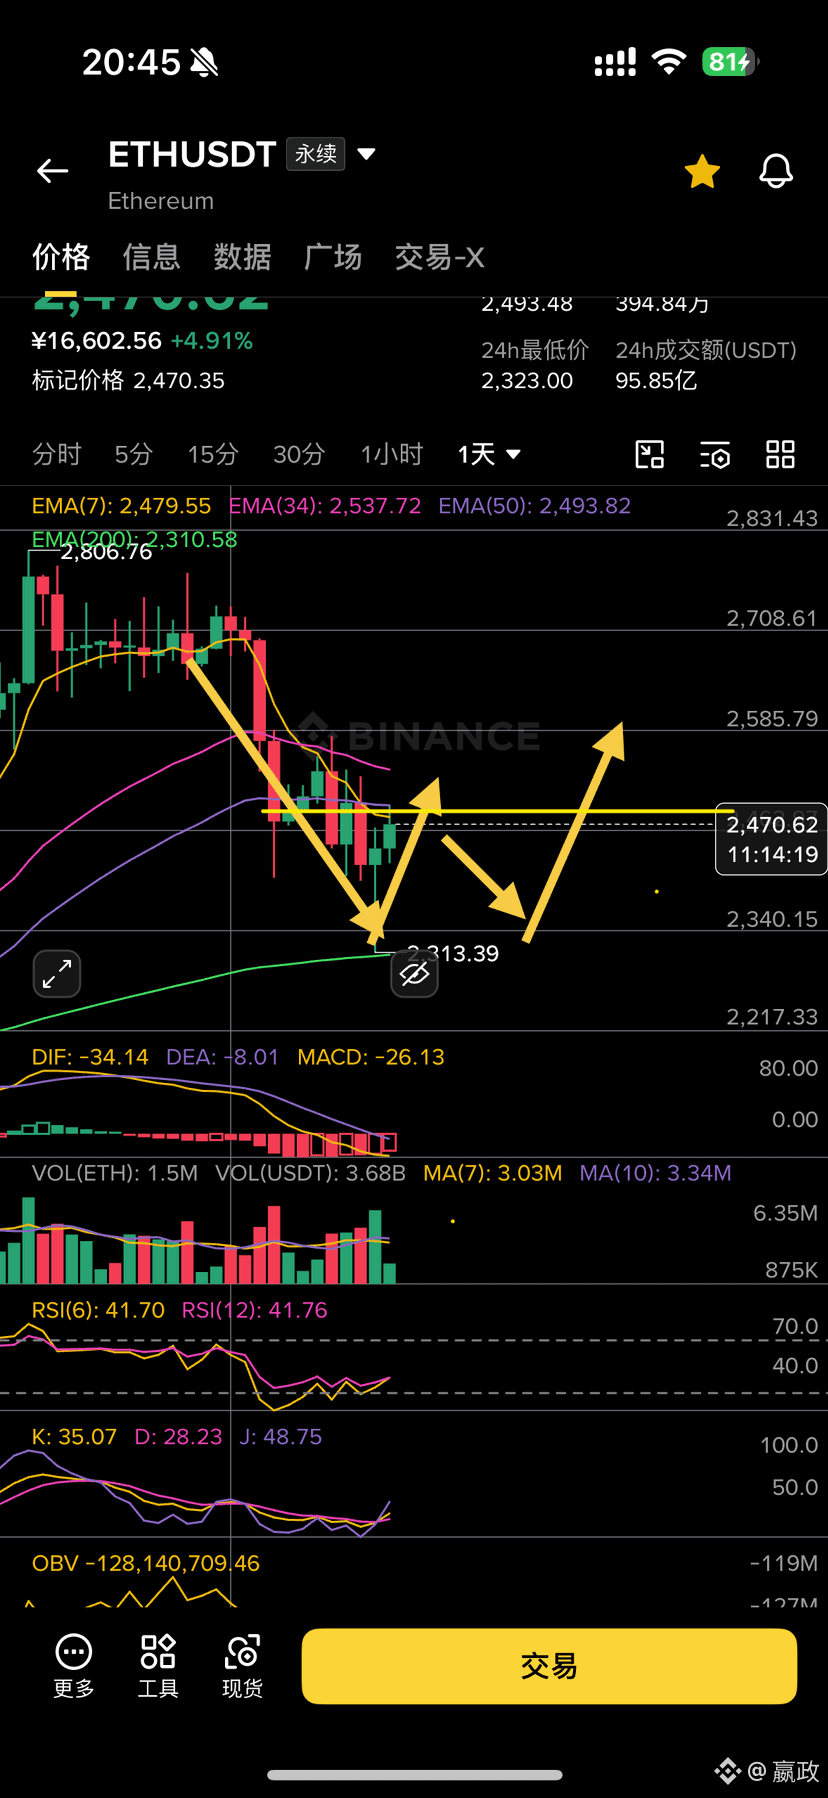
Entry point 2540, stop loss 2580. Take profit at the 200-period moving average,
Entry point 2540, stop loss 2580. Take profit at the 200-period moving average,
1
188
·
--
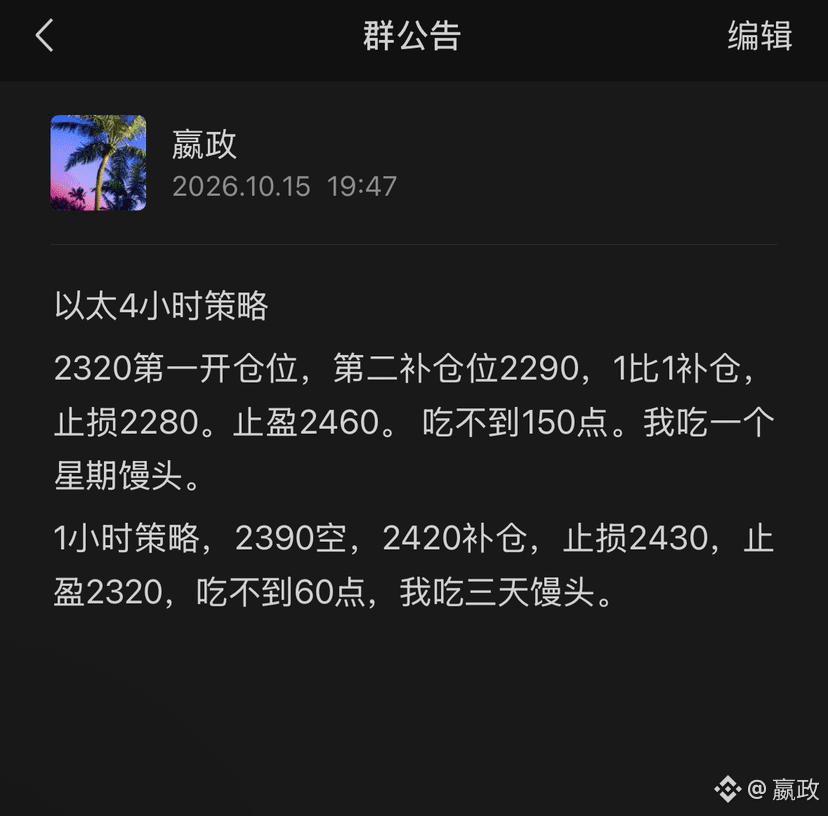
Bring on the hardcore traders. To be honest, my strategy is pretty aggressive, and with just nine people in the group plus me, we’re a bit timid. We can’t hold on to good trades or get in at the right time. My strategy usually has a 5-point range up or down. #ETH Here’s my analysis: there’s no money in it for me, so I’m counting on you to profit and tip me—that’s what keeps me motivated. Last night, the price hit 2323 but didn’t give us an entry opportunity. I can still get the overall direction right: buy the bottom, sell the top.
Follow me if you’re interested.
Bring on the hardcore traders. To be honest, my strategy is pretty aggressive, and with just nine people in the group plus me, we’re a bit timid. We can’t hold on to good trades or get in at the right time. My strategy usually has a 5-point range up or down. #ETH Here’s my analysis: there’s no money in it for me, so I’m counting on you to profit and tip me—that’s what keeps me motivated. Last night, the price hit 2323 but didn’t give us an entry opportunity. I can still get the overall direction right: buy the bottom, sell the top.
Follow me if you’re interested.
Follow me if you’re interested.
160
·
--
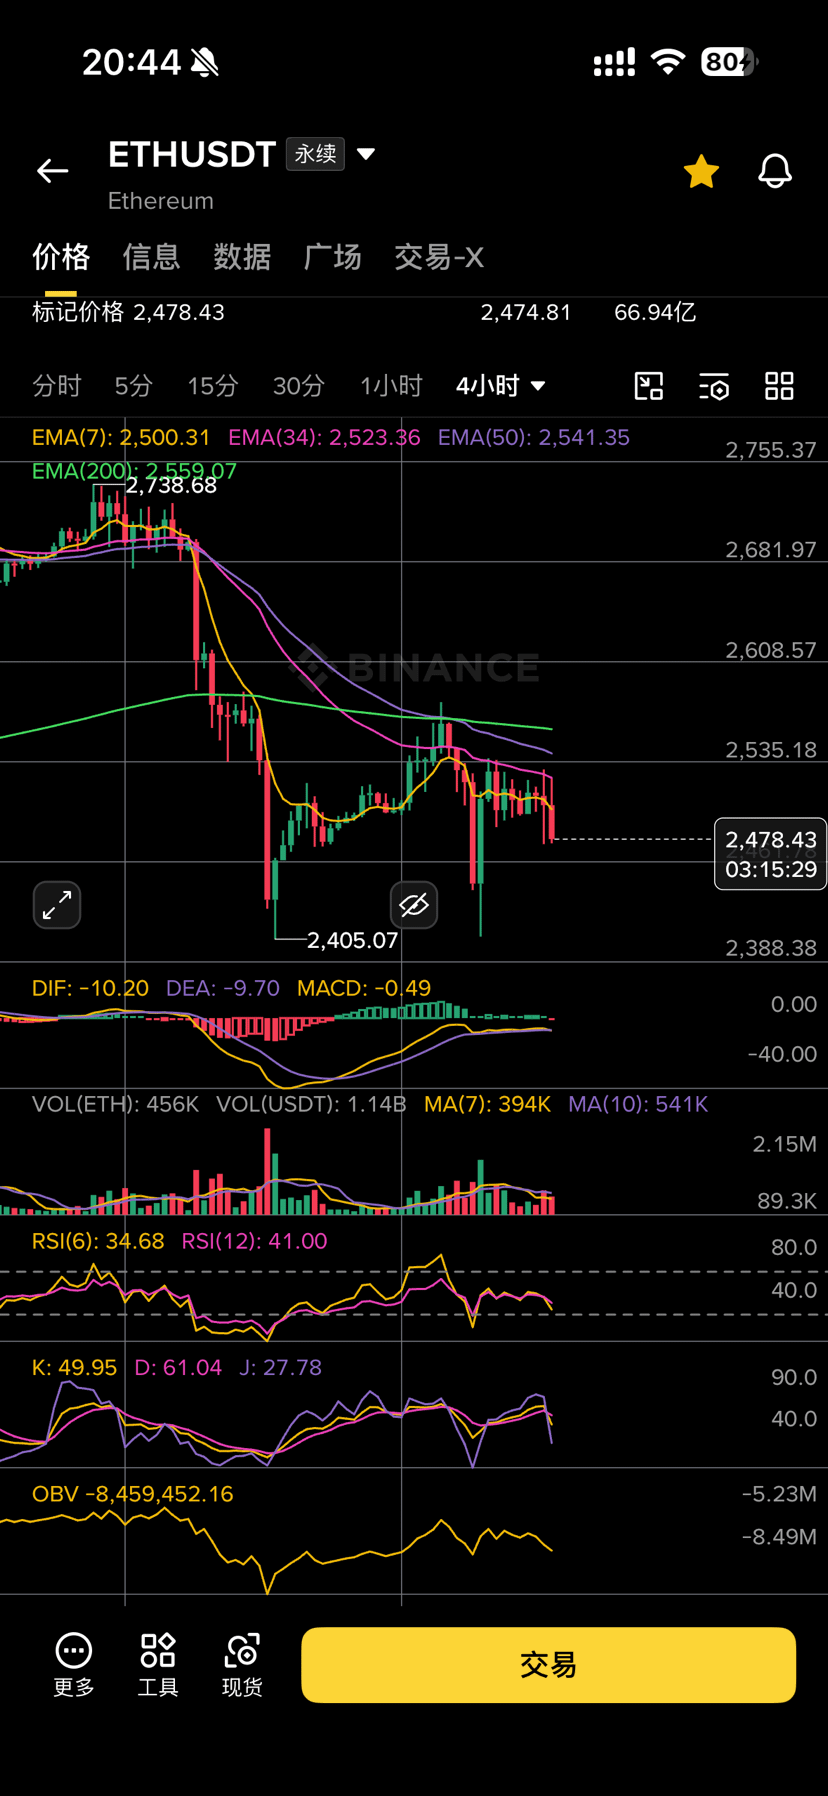
#ETH Market Analysis 【Daily chart | Swing trading; watch the daily close】
• Resistance above:
1. 2499 (EMA50)
2. 2512 (EMA7)
3. 2551 (EMA34, strongest daily resistance)
• Support below:
1. 2405 (key short-term daily level)
2. 2308 (200-day EMA, major daily floor)
⏱️【4-hour chart | Swing entries and exits; watch 4H candle bodies】
• Resistance above:
1. 2501 (4H-EMA7, first hurdle nearby)
2. 2523 (4H-EMA34)
3. 2541–2559 (strong 4H resistance zone)
• Support below:
1. 2440–2420 (buffer zone)
2. 2405 (key 4H support)
Look to go long on dips and short on rallies.
Never let a losing position run; set a stop-loss.
#ETH Market Analysis 【Daily chart | Swing trading; watch the daily close】
• Resistance above:
1. 2499 (EMA50)
2. 2512 (EMA7)
3. 2551 (EMA34, strongest daily resistance)
• Support below:
1. 2405 (key short-term daily level)
2. 2308 (200-day EMA, major daily floor)
⏱️【4-hour chart | Swing entries and exits; watch 4H candle bodies】
• Resistance above:
1. 2501 (4H-EMA7, first hurdle nearby)
2. 2523 (4H-EMA34)
3. 2541–2559 (strong 4H resistance zone)
• Support below:
1. 2440–2420 (buffer zone)
2. 2405 (key 4H support)
Look to go long on dips and short on rallies.
Never let a losing position run; set a stop-loss.
• Resistance above:
1. 2499 (EMA50)
2. 2512 (EMA7)
3. 2551 (EMA34, strongest daily resistance)
• Support below:
1. 2405 (key short-term daily level)
2. 2308 (200-day EMA, major daily floor)
⏱️【4-hour chart | Swing entries and exits; watch 4H candle bodies】
• Resistance above:
1. 2501 (4H-EMA7, first hurdle nearby)
2. 2523 (4H-EMA34)
3. 2541–2559 (strong 4H resistance zone)
• Support below:
1. 2440–2420 (buffer zone)
2. 2405 (key 4H support)
Look to go long on dips and short on rallies.
Never let a losing position run; set a stop-loss.
326
·
--
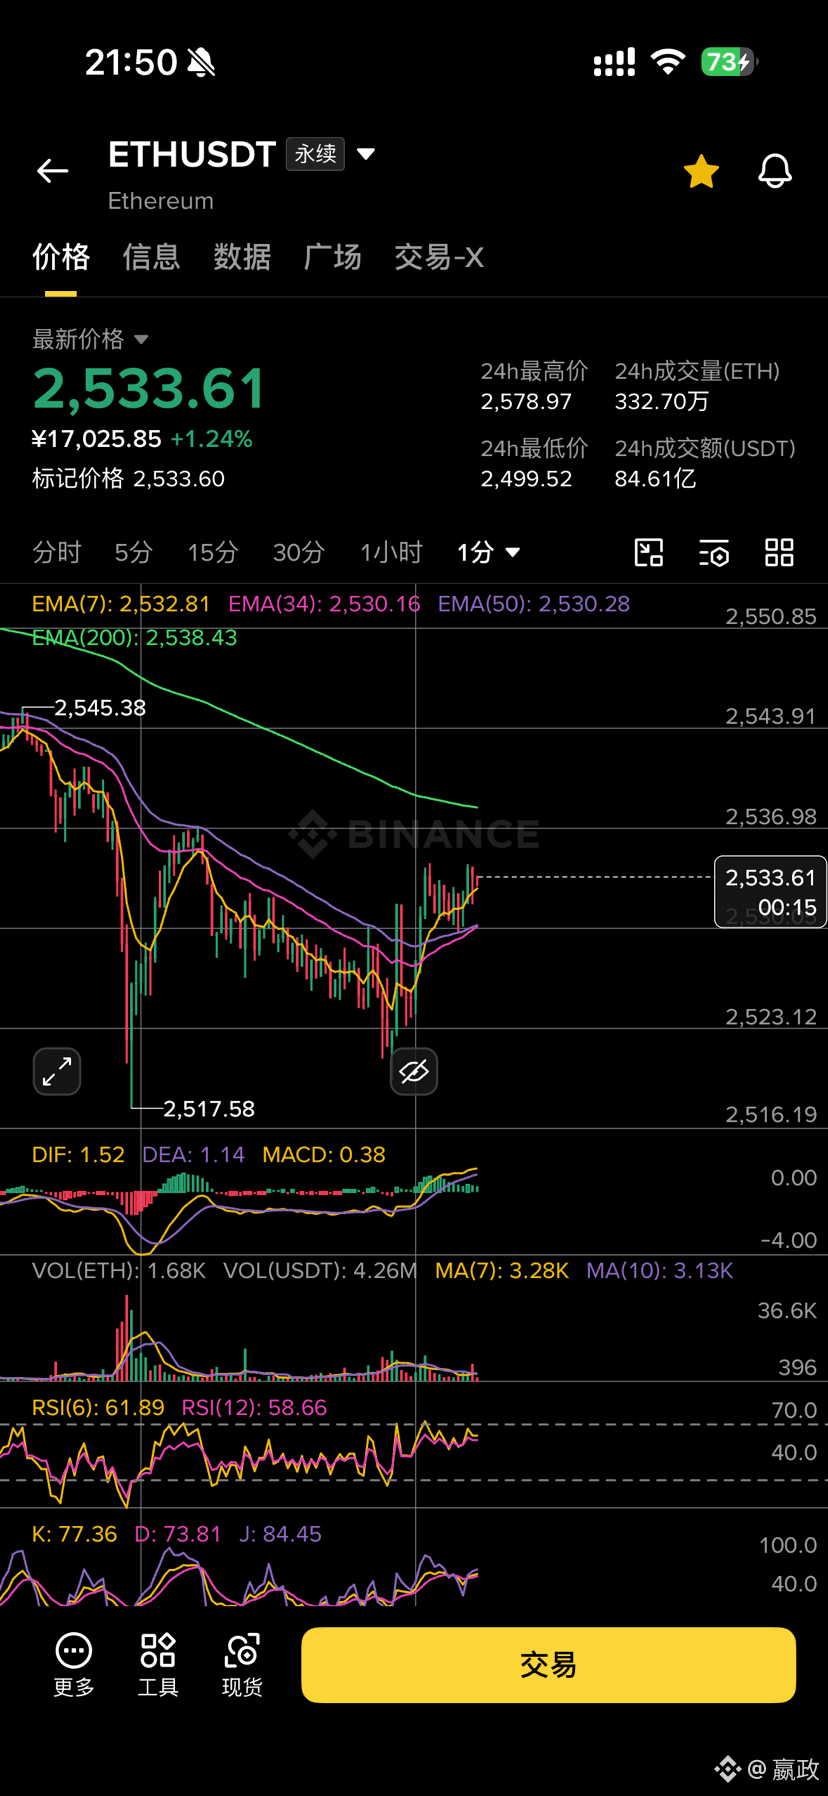
#ETH , analyze Ethereum's current price action. There's currently a double bottom on the one-minute chart; if it breaks above 2537, you can go long, with a stop-loss below the previous low. But I think there's resistance around 2550, and it needs to break out on higher volume. The risk-reward isn't very attractive.
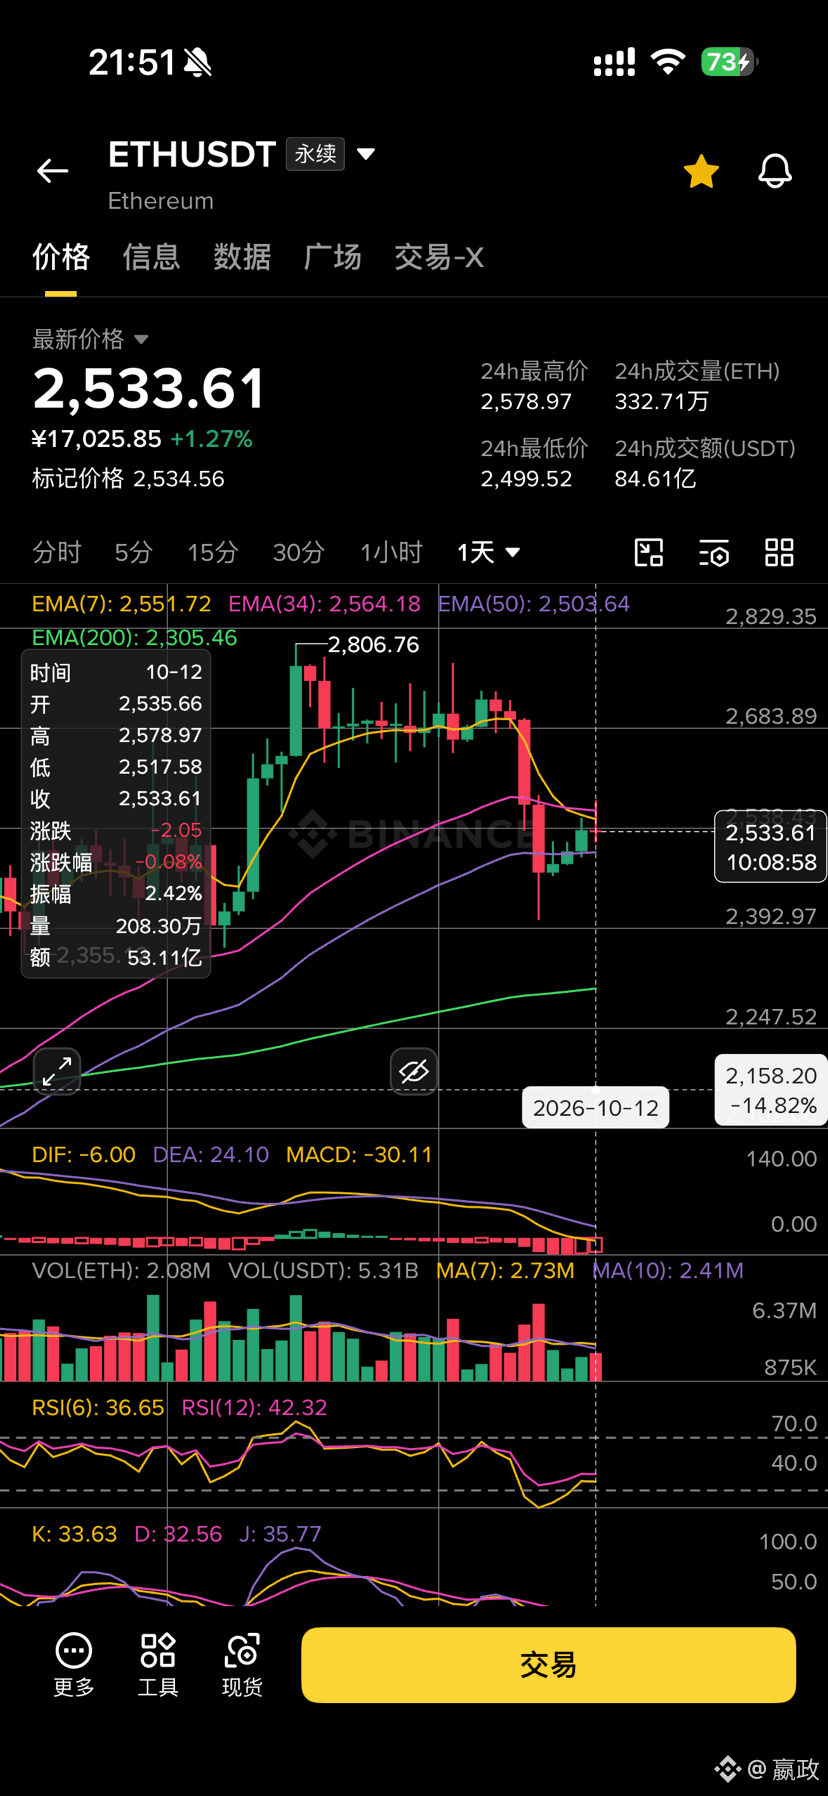
Looking at the daily chart, if tomorrow's daily candle closes bearish, don't overthink it—just go short, with a stop-loss above the previous high. This is the second entry opportunity.
#ETH , analyze Ethereum's current price action. There's currently a double bottom on the one-minute chart; if it breaks above 2537, you can go long, with a stop-loss below the previous low. But I think there's resistance around 2550, and it needs to break out on higher volume. The risk-reward isn't very attractive.
Looking at the daily chart, if tomorrow's daily candle closes bearish, don't overthink it—just go short, with a stop-loss above the previous high. This is the second entry opportunity.
Looking at the daily chart, if tomorrow's daily candle closes bearish, don't overthink it—just go short, with a stop-loss above the previous high. This is the second entry opportunity.
149
·
--
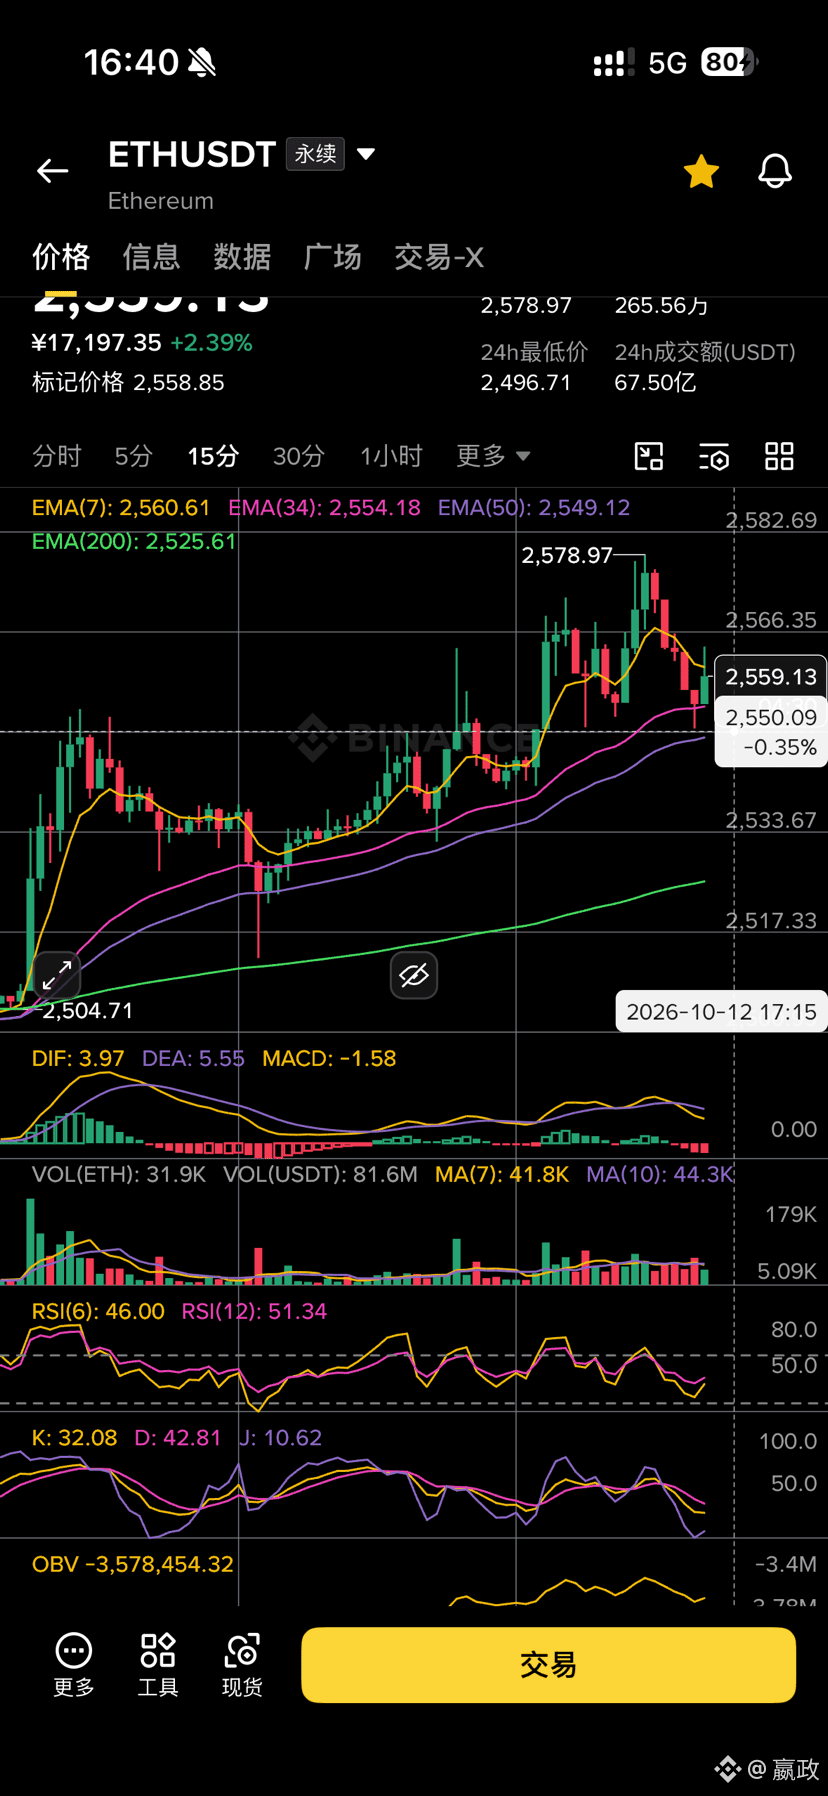
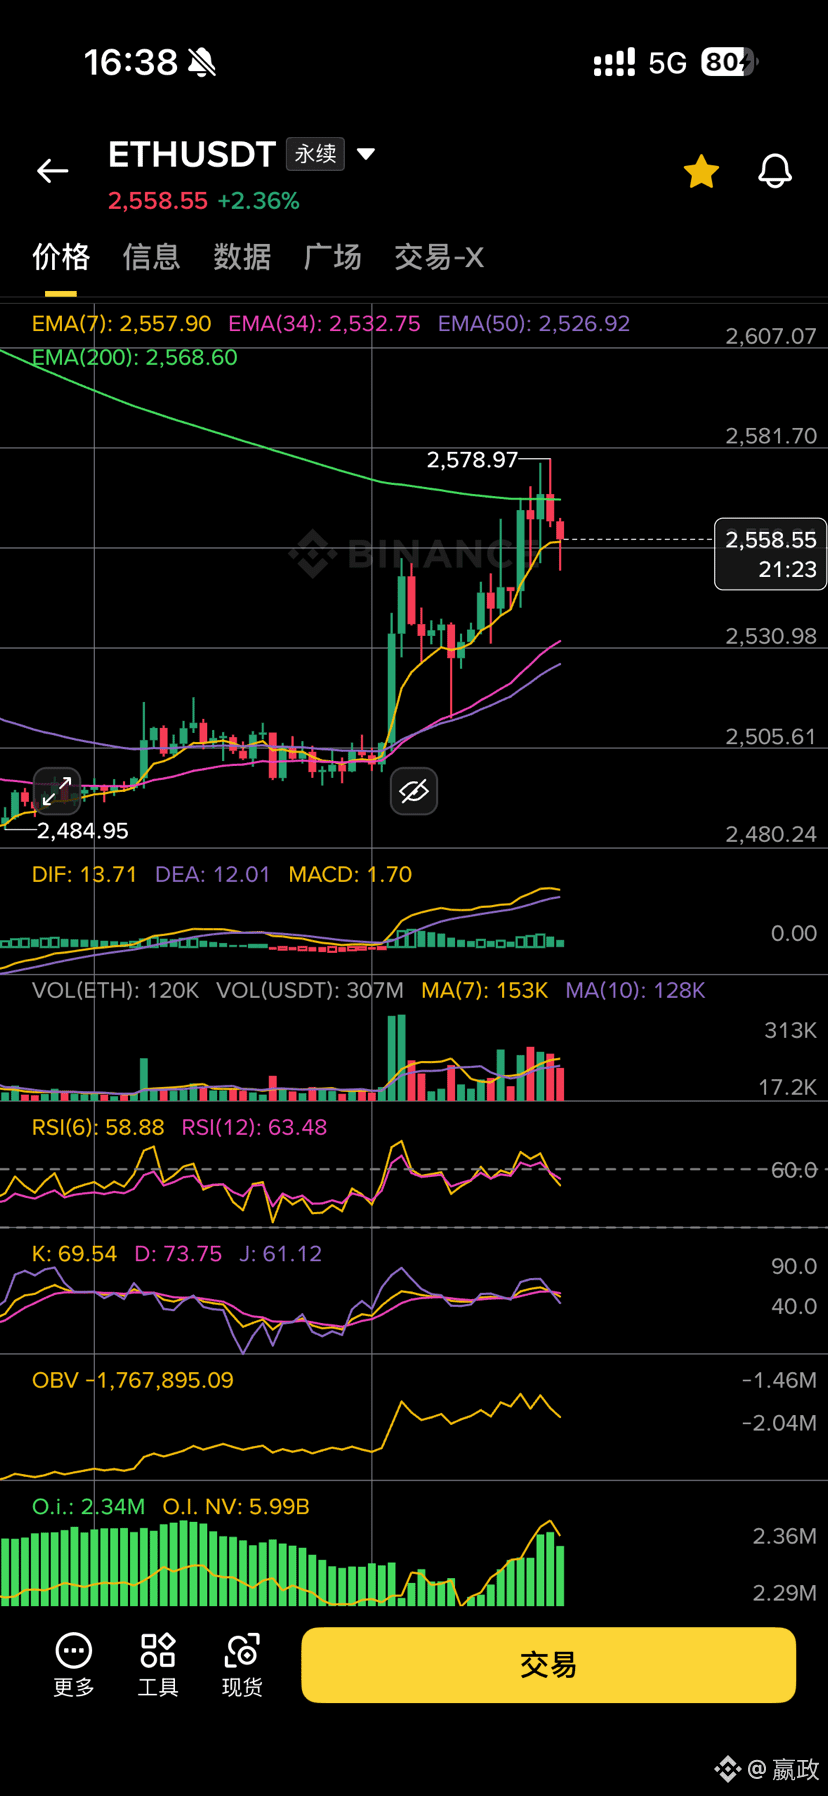
#ETH -hour chart: What is Ether doing? Pulling up the moving averages. The 34-day moving average is expected to reach around 2550 at about 21:30 tonight.
What is the 15-minute chart doing? Supporting the 1-hour chart by moving sideways.
For now, 2550 is holding. As long as it doesn’t break below that, things will stay as they are.
There are about 4 hours and 15 minutes until 21:30.
For the price to move higher, it must break above the previous high of 2586 and have the candle body hold above the 200-day moving average. Only then can we look toward 2600 and above.
#ETH -hour chart: What is Ether doing? Pulling up the moving averages. The 34-day moving average is expected to reach around 2550 at about 21:30 tonight.
What is the 15-minute chart doing? Supporting the 1-hour chart by moving sideways.
For now, 2550 is holding. As long as it doesn’t break below that, things will stay as they are.
There are about 4 hours and 15 minutes until 21:30.
For the price to move higher, it must break above the previous high of 2586 and have the candle body hold above the 200-day moving average. Only then can we look toward 2600 and above.
What is the 15-minute chart doing? Supporting the 1-hour chart by moving sideways.
For now, 2550 is holding. As long as it doesn’t break below that, things will stay as they are.
There are about 4 hours and 15 minutes until 21:30.
For the price to move higher, it must break above the previous high of 2586 and have the candle body hold above the 200-day moving average. Only then can we look toward 2600 and above.
1
728
·
--
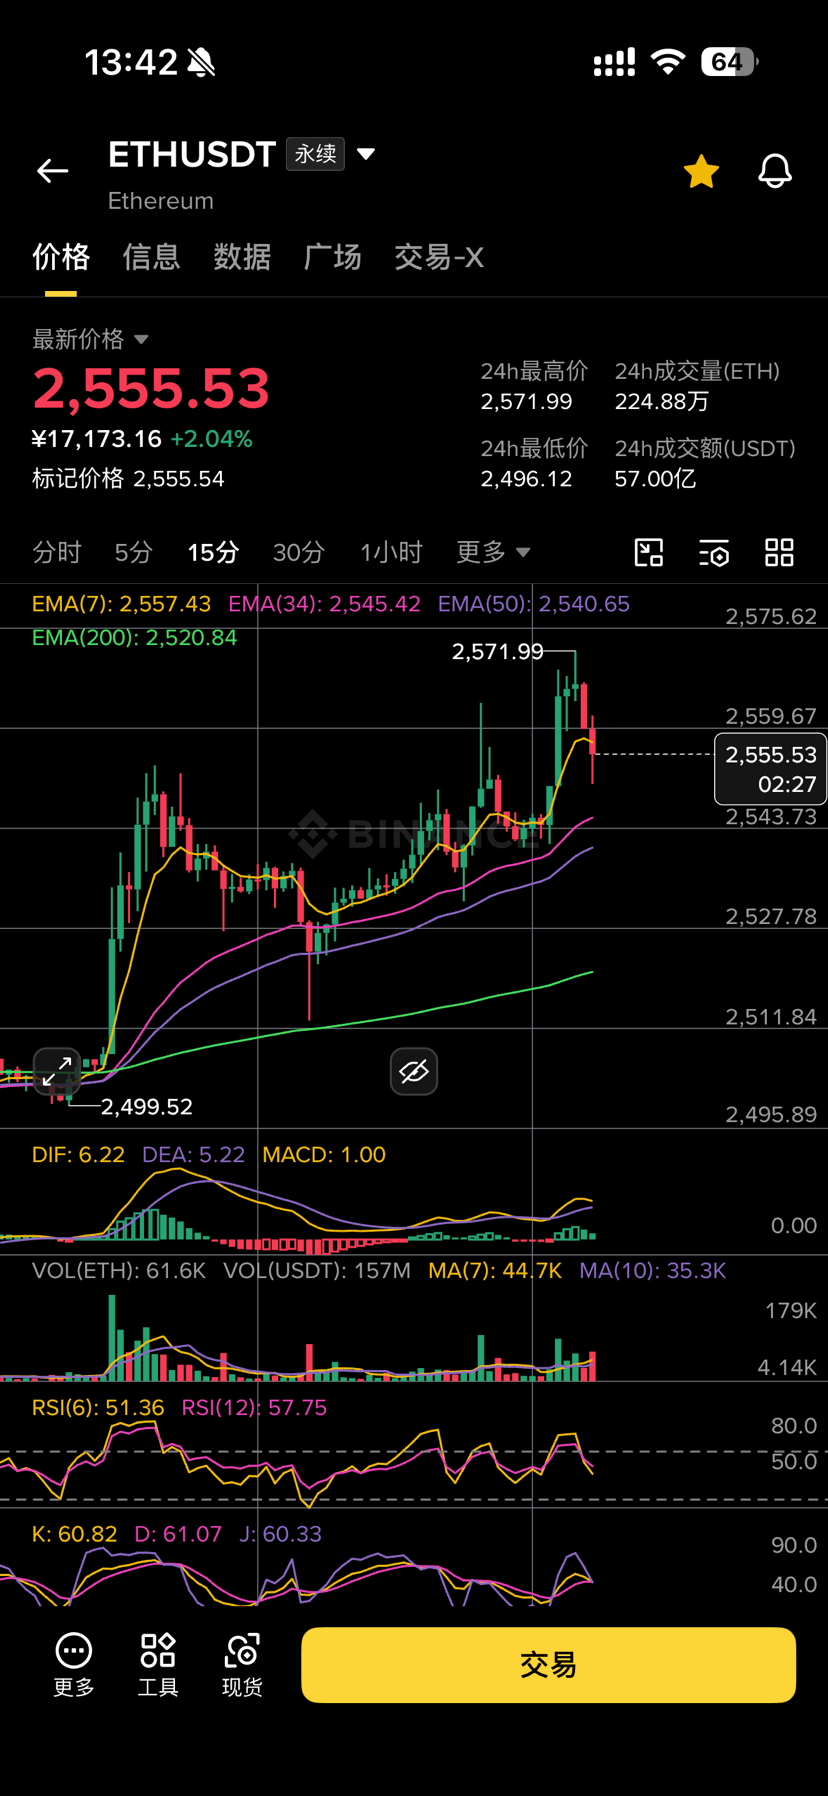
Hi everyone, I'm back. My analysis was right last night: when the price pulled back to around 2510, go long, with 2570 as the first take-profit level. Today, I called for a short around 2570–2580, and it's currently playing out. Some of you opened short positions there—looks like you’ve made a profit again. If you like my analysis, please follow me. And if you’ve made a profit, feel free to tip me—it’ll motivate me to keep sharing my analysis. #ETH I’m just a small-time retail trader with a little over 10 USDT. To be honest, I don’t trade ETH much because the fees are high. With my little bit of money, I only make a small amount, and after a few trades the fees eat it all up. I’m also posting here to learn. I’m just a beginner sharing my analysis—I’ve only been studying for a few months, and I’ve already lost quite a bit on tuition. I’m counting on all you big brothers and sisters to help me make a profit, so please send me a tip. 😀 If you enjoy reading my analysis, feel free to follow me.
Hi everyone, I'm back. My analysis was right last night: when the price pulled back to around 2510, go long, with 2570 as the first take-profit level. Today, I called for a short around 2570–2580, and it's currently playing out. Some of you opened short positions there—looks like you’ve made a profit again. If you like my analysis, please follow me. And if you’ve made a profit, feel free to tip me—it’ll motivate me to keep sharing my analysis. #ETH I’m just a small-time retail trader with a little over 10 USDT. To be honest, I don’t trade ETH much because the fees are high. With my little bit of money, I only make a small amount, and after a few trades the fees eat it all up. I’m also posting here to learn. I’m just a beginner sharing my analysis—I’ve only been studying for a few months, and I’ve already lost quite a bit on tuition. I’m counting on all you big brothers and sisters to help me make a profit, so please send me a tip. 😀 If you enjoy reading my analysis, feel free to follow me.
247
·
--
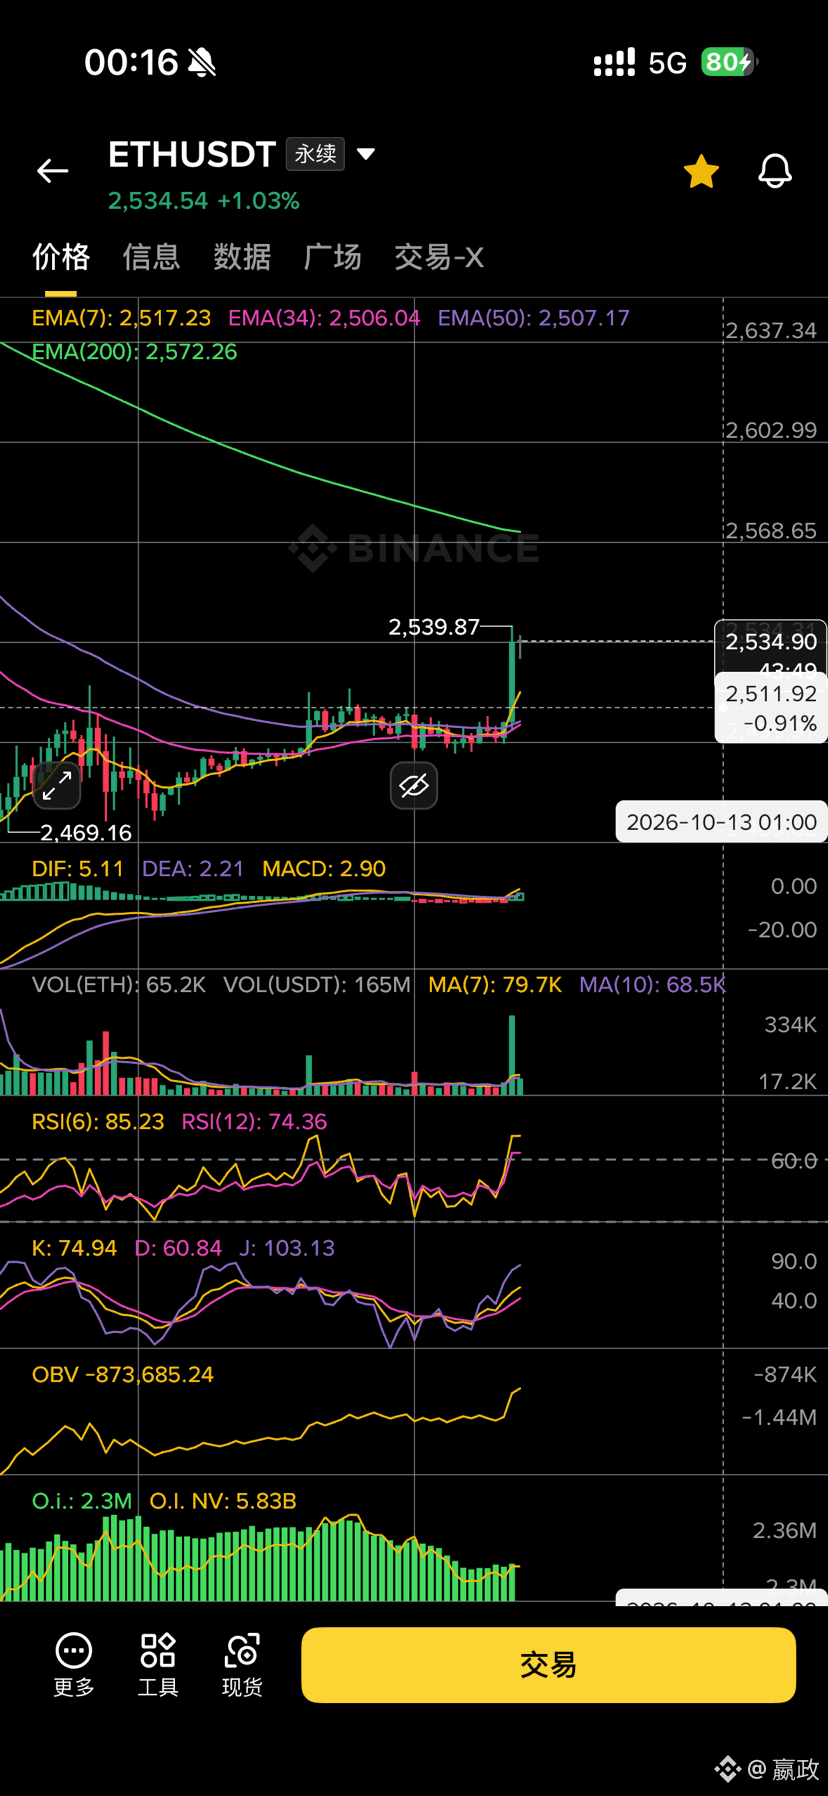
#ETH In my last post, I was bullish on ETH. I expected a pullback to 2433–2450, but the market didn’t give us the chance. It only dipped to 2470, and now we’ve got a big bullish candle on the hourly chart. There’s still some way to go before the 200 MA. Will it keep moving up on increasing volume, or pull back to 2510? Personally, I’m leaning toward a pullback. As long as 2500 holds, I’ll remain bullish. You could enter a small position at 2510, with a stop-loss at 2490. This is a short-term trade. Take two-thirds off at the first target of 2570, and the rest at 2600.
You could consider a short at 2570–2580, with a stop-loss at 2588.
#ETH In my last post, I was bullish on ETH. I expected a pullback to 2433–2450, but the market didn’t give us the chance. It only dipped to 2470, and now we’ve got a big bullish candle on the hourly chart. There’s still some way to go before the 200 MA. Will it keep moving up on increasing volume, or pull back to 2510? Personally, I’m leaning toward a pullback. As long as 2500 holds, I’ll remain bullish. You could enter a small position at 2510, with a stop-loss at 2490. This is a short-term trade. Take two-thirds off at the first target of 2570, and the rest at 2600.
You could consider a short at 2570–2580, with a stop-loss at 2588.
You could consider a short at 2570–2580, with a stop-loss at 2588.
3
1.9k
·
--
This shitcoin, #MAGIC , takes a whole day to go up—it moves so painfully slowly. But it drops in just one minute, leaving you all completely trapped.
This shitcoin, #MAGIC , takes a whole day to go up—it moves so painfully slowly. But it drops in just one minute, leaving you all completely trapped.
546
·
--
#ETH Tonight’s Market Outlook
Long-Short Battle
Whale long-to-short position ratio: 2.6:1. The flow of funds is clearly skewed bullish, with large players still taking the bullish side. Open interest (OI) is up about 6.5% from 30 days ago (747K → 796K), indicating continued inflows into the derivatives market. The current funding rate is slightly negative (-0.0000088), meaning short sellers are paying a small amount to longs. This suggests some short positioning amid expectations of a near-term decline, but the scale is small and not extreme.
Near-term support: 2,490–2,495 (strong 5m Bollinger Band/VWAP support zone)
Key support: 2,450 (4h lower Bollinger Band)
Near-term resistance: 2,504–2,510
Key resistance: 2,705+ (4h upper Bollinger Band)
The price is currently moving within the key short-term range of $2,490–$2,510. The market may pick a direction tonight.
News
Bullish: Ethereum mainnet revenue over the past 30 days was $18.52 million, up 61% year over year, pointing to improving on-chain fundamentals. Bearish/neutral: News about quantum computing plans has raised concerns in parts of the crypto market. There has also been negative news related to SIM card scams, though it has little to do with ETH fundamentals.
Tonight’s outlook
Bullish positioning by large players + market sentiment in the “Greed” zone (64) + improving on-chain revenue → a bullish short-term bias, with a potential rebound if the $2,490 support holds.
However, if $2,490 breaks, the price could quickly drop to $2,450, so watch your stop-losses.
On the upside, watch whether the $2,550–$2,600 zone can be reclaimed and held as a short-term target.
The battle between bulls and bears is still ongoing. Tonight’s price action could involve a sharp shakeout before a rally, so trade cautiously and manage your position size.
#ETH Tonight’s Market Outlook
Long-Short Battle
Whale long-to-short position ratio: 2.6:1. The flow of funds is clearly skewed bullish, with large players still taking the bullish side. Open interest (OI) is up about 6.5% from 30 days ago (747K → 796K), indicating continued inflows into the derivatives market. The current funding rate is slightly negative (-0.0000088), meaning short sellers are paying a small amount to longs. This suggests some short positioning amid expectations of a near-term decline, but the scale is small and not extreme.
Near-term support: 2,490–2,495 (strong 5m Bollinger Band/VWAP support zone)
Key support: 2,450 (4h lower Bollinger Band)
Near-term resistance: 2,504–2,510
Key resistance: 2,705+ (4h upper Bollinger Band)
The price is currently moving within the key short-term range of $2,490–$2,510. The market may pick a direction tonight.
News
Bullish: Ethereum mainnet revenue over the past 30 days was $18.52 million, up 61% year over year, pointing to improving on-chain fundamentals. Bearish/neutral: News about quantum computing plans has raised concerns in parts of the crypto market. There has also been negative news related to SIM card scams, though it has little to do with ETH fundamentals.
Tonight’s outlook
Bullish positioning by large players + market sentiment in the “Greed” zone (64) + improving on-chain revenue → a bullish short-term bias, with a potential rebound if the $2,490 support holds.
However, if $2,490 breaks, the price could quickly drop to $2,450, so watch your stop-losses.
On the upside, watch whether the $2,550–$2,600 zone can be reclaimed and held as a short-term target.
The battle between bulls and bears is still ongoing. Tonight’s price action could involve a sharp shakeout before a rally, so trade cautiously and manage your position size.
Long-Short Battle
Whale long-to-short position ratio: 2.6:1. The flow of funds is clearly skewed bullish, with large players still taking the bullish side. Open interest (OI) is up about 6.5% from 30 days ago (747K → 796K), indicating continued inflows into the derivatives market. The current funding rate is slightly negative (-0.0000088), meaning short sellers are paying a small amount to longs. This suggests some short positioning amid expectations of a near-term decline, but the scale is small and not extreme.
Near-term support: 2,490–2,495 (strong 5m Bollinger Band/VWAP support zone)
Key support: 2,450 (4h lower Bollinger Band)
Near-term resistance: 2,504–2,510
Key resistance: 2,705+ (4h upper Bollinger Band)
The price is currently moving within the key short-term range of $2,490–$2,510. The market may pick a direction tonight.
News
Bullish: Ethereum mainnet revenue over the past 30 days was $18.52 million, up 61% year over year, pointing to improving on-chain fundamentals. Bearish/neutral: News about quantum computing plans has raised concerns in parts of the crypto market. There has also been negative news related to SIM card scams, though it has little to do with ETH fundamentals.
Tonight’s outlook
Bullish positioning by large players + market sentiment in the “Greed” zone (64) + improving on-chain revenue → a bullish short-term bias, with a potential rebound if the $2,490 support holds.
However, if $2,490 breaks, the price could quickly drop to $2,450, so watch your stop-losses.
On the upside, watch whether the $2,550–$2,600 zone can be reclaimed and held as a short-term target.
The battle between bulls and bears is still ongoing. Tonight’s price action could involve a sharp shakeout before a rally, so trade cautiously and manage your position size.
190
Log in to explore more content
Join global crypto users on Binance Square
⚡️ Get latest and useful information about crypto.
💬 Trusted by the world’s largest crypto exchange.
👍 Discover real insights from verified creators.
Email / Phone number
Trending Topics
BinanceReopensWithdrawalsForMoreAssets
733,536 views
3,852 Discussing
Security Incident | Recovery Update #8: Withdrawals for More Assets to Reopen (2026-11-05)
Binance Announcement
·293 Likes
·1.2M views
Binance98PercentReplenished
120,766 views
1,353 Discussing
ADPUSPrivateEmployersAdd86000JobsInOctober
21,434 views
360 Discussing