
ZinBo21
18 Posts

ZinBo21
Report
Block User
Open Trade
High-Frequency Trader
4.8 Years
6 Following
30 Followers
31 Liked
Posts
Portfolio
·
--
Learning US Stocks via Binance: A Quick Guide
Expanding into traditional equities via Binance (BStocks) helps diversify your portfolio. Here is how to start:
Binance Academy: Access free articles and guides covering stock basics, valuation, and tokenized assets.
Binance Research: Read in-depth macroeconomic analysis to understand stock market trends.
Binance Square: Follow market experts and hashtags like #SEABstock for real-time technical and fundamental insights.
Track Live Data: Monitor US Stock token price charts and analyze how global news impacts performance.
Combine educational guides with Binance Square insights to build a strong investment foundation.
#SEABstock #SEAstock
#BinanceSquareTalks #BinanceMyanmar #stockmarketnews #bstock
Learning US Stocks via Binance: A Quick Guide
Expanding into traditional equities via Binance (BStocks) helps diversify your portfolio. Here is how to start:
Binance Academy: Access free articles and guides covering stock basics, valuation, and tokenized assets.
Binance Research: Read in-depth macroeconomic analysis to understand stock market trends.
Binance Square: Follow market experts and hashtags like #SEABstock for real-time technical and fundamental insights.
Track Live Data: Monitor US Stock token price charts and analyze how global news impacts performance.
Combine educational guides with Binance Square insights to build a strong investment foundation.
#SEABstock #SEAstock
#BinanceSquareTalks #BinanceMyanmar #stockmarketnews #bstock
Expanding into traditional equities via Binance (BStocks) helps diversify your portfolio. Here is how to start:
Binance Academy: Access free articles and guides covering stock basics, valuation, and tokenized assets.
Binance Research: Read in-depth macroeconomic analysis to understand stock market trends.
Binance Square: Follow market experts and hashtags like #SEABstock for real-time technical and fundamental insights.
Track Live Data: Monitor US Stock token price charts and analyze how global news impacts performance.
Combine educational guides with Binance Square insights to build a strong investment foundation.
#SEABstock #SEAstock
#BinanceSquareTalks #BinanceMyanmar #stockmarketnews #bstock
1
51
·
--
🇺🇸 US Stock Market News: Meaningful Events for Investors | September 21, 2026
The U.S. stock mark🇺🇸 US Stock Market News: Meaningful Events for Investors | September 21, 2026
The U.S. stock market is entering an important week where Federal Reserve policy, inflation expectations, Treasury yields, oil prices, AI momentum, and upcoming economic data could strongly influence risk sentiment across equities and other financial markets.
From a professional market-analysis perspective, investors should focus less on short-term headlines and more on how these catalysts interact with liquidity, interest rates, corporate earnings, and market positioning.
1️⃣ Federal Reserve: The Biggest Macro Catalyst
The Federal Reserve raised the federal funds target range by 25 basis points to 3.75%–4.00% at its September 16 meeting. The Fed stated that economic activity remains solid, while inflation is still elevated and uncertainty remains significant.
For equity investors, the key question is no longer simply whether rates are rising or falling. The bigger issue is how long restrictive monetary conditions may remain in place.
Higher rates generally increase corporate financing costs and can place pressure on high-valuation growth stocks. At the same time, companies delivering strong earnings and cash-flow growth may continue to attract capital despite elevated yields.
2️⃣ Treasury Yields Remain a Critical Signal
The U.S. 10-year Treasury yield has recently moved close to, and at times above, the 5% level. Elevated bond yields create competition for equities because investors can obtain higher income from relatively lower-risk government securities.
Therefore, traders should monitor the relationship between S&P 500/Nasdaq price action and Treasury yields.
A rising stock market accompanied by stable or declining yields can indicate improving risk appetite. Conversely, rising yields combined with weakening equity prices may signal increasing pressure on valuations.
3️⃣ Inflation & Economic Data
This week's economic calendar contains several important releases, including S&P Global Flash Manufacturing and Services PMIs, weekly jobless claims, new home sales, durable goods orders, and the revised University of Michigan Consumer Sentiment Index.
These reports can influence expectations for future Fed policy.
The market will be watching for a difficult combination: slowing growth + persistent inflation. Such a scenario could increase uncertainty because policymakers may have less flexibility to support economic activity through lower rates.
4️⃣ Oil Prices & Geopolitical Risk
Energy markets remain another important variable. Recent declines in crude prices have helped ease pressure on Treasury yields and supported risk sentiment, while geopolitical developments remain capable of quickly changing the direction of oil and broader markets.
For traders, oil is not just an energy-market indicator. It can affect inflation expectations, consumer spending, corporate margins, transportation costs, and ultimately monetary-policy expectations.
5️⃣ AI & Technology Leadership
AI-related equities remain a major source of market momentum. Recent trading showed renewed interest in major technology and AI-linked companies, while investors continue to debate whether the enormous investment in AI infrastructure will translate into sustainable earnings growth.
This creates an important distinction between narrative-driven momentum and fundamental earnings growth.
Professional investors should therefore monitor revenue growth, margins, capital expenditure, free cash flow, and forward guidance rather than relying solely on price momentum.
6️⃣ The Investor's Key Checklist
For the week ahead, I would closely monitor:
📌 Federal Reserve speeches & rate expectations
📌 10-Year Treasury yield
📌 U.S. inflation expectations
📌 PMI and labor-market data
📌 Crude oil prices
📌 AI/technology earnings and guidance
📌 S&P 500 & Nasdaq market breadth
📌 USD strength and liquidity conditions
📌 Geopolitical developments
📊 Professional Market Perspective
The current environment is a classic example of why traders should avoid looking at only one indicator.
Stocks + Bonds + Dollar + Oil + Fed expectations + Earnings should be analyzed together.
If corporate earnings remain resilient while inflation pressures moderate, equities could continue to receive fundamental support. However, persistent inflation, elevated Treasury yields, geopolitical shocks, or disappointing corporate guidance could increase volatility.
The most important principle is risk management.
Rather than attempting to predict every short-term market move, investors can focus on identifying the major catalysts, waiting for price confirmation, controlling position size, and protecting capital when market conditions become uncertain.
The market does not move because of one headline. It moves because expectations change.
Stay informed.
Stay disciplined.
Manage risk before chasing returns. 📈
Disclaimer: This post is for educational and informational purposes only and is not financial advice or a recommendation to buy or sell any security.
#USStockMarket #StockMarket #Investing #Trading #WallStreet #SP500 #Nasdaq #FederalReserve #Fed #Inflation #TreasuryYields #AIStocks #MarketNews #Investors #BinanceSquare#SEABstock #SEAstock#BinanceMyanmar
🇺🇸 US Stock Market News: Meaningful Events for Investors | September 21, 2026 The U.S. stock mark
🇺🇸 US Stock Market News: Meaningful Events for Investors | September 21, 2026
The U.S. stock market is entering an important week where Federal Reserve policy, inflation expectations, Treasury yields, oil prices, AI momentum, and upcoming economic data could strongly influence risk sentiment across equities and other financial markets.
From a professional market-analysis perspective, investors should focus less on short-term headlines and more on how these catalysts interact with liquidity, interest rates, corporate earnings, and market positioning.
1️⃣ Federal Reserve: The Biggest Macro Catalyst
The Federal Reserve raised the federal funds target range by 25 basis points to 3.75%–4.00% at its September 16 meeting. The Fed stated that economic activity remains solid, while inflation is still elevated and uncertainty remains significant.
For equity investors, the key question is no longer simply whether rates are rising or falling. The bigger issue is how long restrictive monetary conditions may remain in place.
Higher rates generally increase corporate financing costs and can place pressure on high-valuation growth stocks. At the same time, companies delivering strong earnings and cash-flow growth may continue to attract capital despite elevated yields.
2️⃣ Treasury Yields Remain a Critical Signal
The U.S. 10-year Treasury yield has recently moved close to, and at times above, the 5% level. Elevated bond yields create competition for equities because investors can obtain higher income from relatively lower-risk government securities.
Therefore, traders should monitor the relationship between S&P 500/Nasdaq price action and Treasury yields.
A rising stock market accompanied by stable or declining yields can indicate improving risk appetite. Conversely, rising yields combined with weakening equity prices may signal increasing pressure on valuations.
3️⃣ Inflation & Economic Data
This week's economic calendar contains several important releases, including S&P Global Flash Manufacturing and Services PMIs, weekly jobless claims, new home sales, durable goods orders, and the revised University of Michigan Consumer Sentiment Index.
These reports can influence expectations for future Fed policy.
The market will be watching for a difficult combination: slowing growth + persistent inflation. Such a scenario could increase uncertainty because policymakers may have less flexibility to support economic activity through lower rates.
4️⃣ Oil Prices & Geopolitical Risk
Energy markets remain another important variable. Recent declines in crude prices have helped ease pressure on Treasury yields and supported risk sentiment, while geopolitical developments remain capable of quickly changing the direction of oil and broader markets.
For traders, oil is not just an energy-market indicator. It can affect inflation expectations, consumer spending, corporate margins, transportation costs, and ultimately monetary-policy expectations.
5️⃣ AI & Technology Leadership
AI-related equities remain a major source of market momentum. Recent trading showed renewed interest in major technology and AI-linked companies, while investors continue to debate whether the enormous investment in AI infrastructure will translate into sustainable earnings growth.
This creates an important distinction between narrative-driven momentum and fundamental earnings growth.
Professional investors should therefore monitor revenue growth, margins, capital expenditure, free cash flow, and forward guidance rather than relying solely on price momentum.
6️⃣ The Investor's Key Checklist
For the week ahead, I would closely monitor:
📌 Federal Reserve speeches & rate expectations
📌 10-Year Treasury yield
📌 U.S. inflation expectations
📌 PMI and labor-market data
📌 Crude oil prices
📌 AI/technology earnings and guidance
📌 S&P 500 & Nasdaq market breadth
📌 USD strength and liquidity conditions
📌 Geopolitical developments
📊 Professional Market Perspective
The current environment is a classic example of why traders should avoid looking at only one indicator.
Stocks + Bonds + Dollar + Oil + Fed expectations + Earnings should be analyzed together.
If corporate earnings remain resilient while inflation pressures moderate, equities could continue to receive fundamental support. However, persistent inflation, elevated Treasury yields, geopolitical shocks, or disappointing corporate guidance could increase volatility.
The most important principle is risk management.
Rather than attempting to predict every short-term market move, investors can focus on identifying the major catalysts, waiting for price confirmation, controlling position size, and protecting capital when market conditions become uncertain.
The market does not move because of one headline. It moves because expectations change.
Stay informed.
Stay disciplined.
Manage risk before chasing returns. 📈
Disclaimer: This post is for educational and informational purposes only and is not financial advice or a recommendation to buy or sell any security.
#USStockMarket #StockMarket #Investing #Trading #WallStreet #SP500 #Nasdaq #FederalReserve #Fed #Inflation #TreasuryYields #AIStocks #MarketNews #Investors #BinanceSquare#SEABstock #SEAstock#BinanceMyanmar
The U.S. stock market is entering an important week where Federal Reserve policy, inflation expectations, Treasury yields, oil prices, AI momentum, and upcoming economic data could strongly influence risk sentiment across equities and other financial markets.
From a professional market-analysis perspective, investors should focus less on short-term headlines and more on how these catalysts interact with liquidity, interest rates, corporate earnings, and market positioning.
1️⃣ Federal Reserve: The Biggest Macro Catalyst
The Federal Reserve raised the federal funds target range by 25 basis points to 3.75%–4.00% at its September 16 meeting. The Fed stated that economic activity remains solid, while inflation is still elevated and uncertainty remains significant.
For equity investors, the key question is no longer simply whether rates are rising or falling. The bigger issue is how long restrictive monetary conditions may remain in place.
Higher rates generally increase corporate financing costs and can place pressure on high-valuation growth stocks. At the same time, companies delivering strong earnings and cash-flow growth may continue to attract capital despite elevated yields.
2️⃣ Treasury Yields Remain a Critical Signal
The U.S. 10-year Treasury yield has recently moved close to, and at times above, the 5% level. Elevated bond yields create competition for equities because investors can obtain higher income from relatively lower-risk government securities.
Therefore, traders should monitor the relationship between S&P 500/Nasdaq price action and Treasury yields.
A rising stock market accompanied by stable or declining yields can indicate improving risk appetite. Conversely, rising yields combined with weakening equity prices may signal increasing pressure on valuations.
3️⃣ Inflation & Economic Data
This week's economic calendar contains several important releases, including S&P Global Flash Manufacturing and Services PMIs, weekly jobless claims, new home sales, durable goods orders, and the revised University of Michigan Consumer Sentiment Index.
These reports can influence expectations for future Fed policy.
The market will be watching for a difficult combination: slowing growth + persistent inflation. Such a scenario could increase uncertainty because policymakers may have less flexibility to support economic activity through lower rates.
4️⃣ Oil Prices & Geopolitical Risk
Energy markets remain another important variable. Recent declines in crude prices have helped ease pressure on Treasury yields and supported risk sentiment, while geopolitical developments remain capable of quickly changing the direction of oil and broader markets.
For traders, oil is not just an energy-market indicator. It can affect inflation expectations, consumer spending, corporate margins, transportation costs, and ultimately monetary-policy expectations.
5️⃣ AI & Technology Leadership
AI-related equities remain a major source of market momentum. Recent trading showed renewed interest in major technology and AI-linked companies, while investors continue to debate whether the enormous investment in AI infrastructure will translate into sustainable earnings growth.
This creates an important distinction between narrative-driven momentum and fundamental earnings growth.
Professional investors should therefore monitor revenue growth, margins, capital expenditure, free cash flow, and forward guidance rather than relying solely on price momentum.
6️⃣ The Investor's Key Checklist
For the week ahead, I would closely monitor:
📌 Federal Reserve speeches & rate expectations
📌 10-Year Treasury yield
📌 U.S. inflation expectations
📌 PMI and labor-market data
📌 Crude oil prices
📌 AI/technology earnings and guidance
📌 S&P 500 & Nasdaq market breadth
📌 USD strength and liquidity conditions
📌 Geopolitical developments
📊 Professional Market Perspective
The current environment is a classic example of why traders should avoid looking at only one indicator.
Stocks + Bonds + Dollar + Oil + Fed expectations + Earnings should be analyzed together.
If corporate earnings remain resilient while inflation pressures moderate, equities could continue to receive fundamental support. However, persistent inflation, elevated Treasury yields, geopolitical shocks, or disappointing corporate guidance could increase volatility.
The most important principle is risk management.
Rather than attempting to predict every short-term market move, investors can focus on identifying the major catalysts, waiting for price confirmation, controlling position size, and protecting capital when market conditions become uncertain.
The market does not move because of one headline. It moves because expectations change.
Stay informed.
Stay disciplined.
Manage risk before chasing returns. 📈
Disclaimer: This post is for educational and informational purposes only and is not financial advice or a recommendation to buy or sell any security.
#USStockMarket #StockMarket #Investing #Trading #WallStreet #SP500 #Nasdaq #FederalReserve #Fed #Inflation #TreasuryYields #AIStocks #MarketNews #Investors #BinanceSquare#SEABstock #SEAstock#BinanceMyanmar
1
91
·
--
Getting Started with Investing in US Stocks: A Checklist for Beginners
Before allocating capital to US equities, beginner traders must adopt a disciplined framework. Here is an essential checklist:
Fundamental Analysis (FA):
Evaluate corporate balance sheets, quarterly earnings reports (Q1–Q4), Debt-to-Equity ratios, and Price-to-Earnings (P/E) ratios to ensure you are buying into healthy businesses.
Macroeconomic Indicators:
Monitor the Federal Reserve’s interest rate policies, Consumer Price Index (CPI) inflation data, and employment reports. Macro factors heavily dictate broader stock market trends.
Sector Selection:
Identify high-growth industries—such as Semiconductors, Artificial Intelligence, Renewable Energy, and Cloud Computing—to align your capital with secular market expansion.
Risk Management & Position Sizing:
Establish strict risk parameters. Never allocate more than 2–5% of your total portfolio to a single stock, and always establish pre-calculated stop-loss levels.
#SEABstock #SEAstock#BinanceMyanmar
Getting Started with Investing in US Stocks: A Checklist for Beginners
Before allocating capital to US equities, beginner traders must adopt a disciplined framework. Here is an essential checklist:
Fundamental Analysis (FA):
Evaluate corporate balance sheets, quarterly earnings reports (Q1–Q4), Debt-to-Equity ratios, and Price-to-Earnings (P/E) ratios to ensure you are buying into healthy businesses.
Macroeconomic Indicators:
Monitor the Federal Reserve’s interest rate policies, Consumer Price Index (CPI) inflation data, and employment reports. Macro factors heavily dictate broader stock market trends.
Sector Selection:
Identify high-growth industries—such as Semiconductors, Artificial Intelligence, Renewable Energy, and Cloud Computing—to align your capital with secular market expansion.
Risk Management & Position Sizing:
Establish strict risk parameters. Never allocate more than 2–5% of your total portfolio to a single stock, and always establish pre-calculated stop-loss levels.
#SEABstock #SEAstock#BinanceMyanmar
Before allocating capital to US equities, beginner traders must adopt a disciplined framework. Here is an essential checklist:
Fundamental Analysis (FA):
Evaluate corporate balance sheets, quarterly earnings reports (Q1–Q4), Debt-to-Equity ratios, and Price-to-Earnings (P/E) ratios to ensure you are buying into healthy businesses.
Macroeconomic Indicators:
Monitor the Federal Reserve’s interest rate policies, Consumer Price Index (CPI) inflation data, and employment reports. Macro factors heavily dictate broader stock market trends.
Sector Selection:
Identify high-growth industries—such as Semiconductors, Artificial Intelligence, Renewable Energy, and Cloud Computing—to align your capital with secular market expansion.
Risk Management & Position Sizing:
Establish strict risk parameters. Never allocate more than 2–5% of your total portfolio to a single stock, and always establish pre-calculated stop-loss levels.
#SEABstock #SEAstock#BinanceMyanmar
1
67
·
--
How to Access US Stocks Through Binance
Binance has continuously evolved beyond a pure cryptocurrency exchange into a multi-asset platform. Through tokenized equity representations—often referred to as BStocks—traders can gain economic exposure to leading US public companies directly within the digital asset environment.
Understanding Tokenized Equities: BStocks or tokenized stocks are digital tokens backed 1:1 by actual underlying US shares (such as Apple, Tesla, Nvidia, or Microsoft) held by regulated third-party custodians. This gives holders price tracking and economic exposure to traditional stock performance without needing a conventional brokerage account.
Fractional Ownership: One of the biggest barriers in traditional stock trading is high share prices. Fractional stock tokens allow traders to invest precise dollar amounts (e.g., $10 or $50) instead of purchasing a full share, making high-priced growth equities accessible to everyone.
Step-by-Step Access:
Identity Verification: Complete full Know Your Customer (KYC) verification on your Binance account to meet legal compliance standards.
Prepare Capital: Fund your Binance Spot Wallet with backed stablecoins such as USDT or FDUSD.
Navigate to Equities/BStocks: Access the stock token section within the Binance app or web interface.
Execute Orders: Analyze the asset and place your trade using standard Market or Limit orders, identical to traditional spot crypto trading.
#SEABstock #SEAstock#BinanceMyanmar
How to Access US Stocks Through Binance
Binance has continuously evolved beyond a pure cryptocurrency exchange into a multi-asset platform. Through tokenized equity representations—often referred to as BStocks—traders can gain economic exposure to leading US public companies directly within the digital asset environment.
Understanding Tokenized Equities: BStocks or tokenized stocks are digital tokens backed 1:1 by actual underlying US shares (such as Apple, Tesla, Nvidia, or Microsoft) held by regulated third-party custodians. This gives holders price tracking and economic exposure to traditional stock performance without needing a conventional brokerage account.
Fractional Ownership: One of the biggest barriers in traditional stock trading is high share prices. Fractional stock tokens allow traders to invest precise dollar amounts (e.g., $10 or $50) instead of purchasing a full share, making high-priced growth equities accessible to everyone.
Step-by-Step Access:
Identity Verification: Complete full Know Your Customer (KYC) verification on your Binance account to meet legal compliance standards.
Prepare Capital: Fund your Binance Spot Wallet with backed stablecoins such as USDT or FDUSD.
Navigate to Equities/BStocks: Access the stock token section within the Binance app or web interface.
Execute Orders: Analyze the asset and place your trade using standard Market or Limit orders, identical to traditional spot crypto trading.
#SEABstock #SEAstock#BinanceMyanmar
Binance has continuously evolved beyond a pure cryptocurrency exchange into a multi-asset platform. Through tokenized equity representations—often referred to as BStocks—traders can gain economic exposure to leading US public companies directly within the digital asset environment.
Understanding Tokenized Equities: BStocks or tokenized stocks are digital tokens backed 1:1 by actual underlying US shares (such as Apple, Tesla, Nvidia, or Microsoft) held by regulated third-party custodians. This gives holders price tracking and economic exposure to traditional stock performance without needing a conventional brokerage account.
Fractional Ownership: One of the biggest barriers in traditional stock trading is high share prices. Fractional stock tokens allow traders to invest precise dollar amounts (e.g., $10 or $50) instead of purchasing a full share, making high-priced growth equities accessible to everyone.
Step-by-Step Access:
Identity Verification: Complete full Know Your Customer (KYC) verification on your Binance account to meet legal compliance standards.
Prepare Capital: Fund your Binance Spot Wallet with backed stablecoins such as USDT or FDUSD.
Navigate to Equities/BStocks: Access the stock token section within the Binance app or web interface.
Execute Orders: Analyze the asset and place your trade using standard Market or Limit orders, identical to traditional spot crypto trading.
#SEABstock #SEAstock#BinanceMyanmar
1
73
·
--
3. How Are Stocks Different from Crypto? Differences, Risks, and Opportunities
Understanding the distinct structural differences between digital assets and traditional equities is vital for constructing a balanced trading system.
Key Differences
Trading Hours: Crypto operates 24/7/365, allowing instant liquidity around the clock. US stocks trade within defined market hours (Monday to Friday, standard US Eastern Time).
Volatility Profile: Cryptocurrencies regularly experience double-digit percentage swings within hours. US equities generally move with lower, more structured volatility, anchored by tangible earnings and regulatory filings.
Regulatory Landscape: US stock issuers are held to strict reporting standards overseen by the Securities and Exchange Commission (SEC), offering high financial transparency.
Risks and Opportunities
Crypto Markets: Offer high risk alongside high return potential. While rapid capital multiplication is possible, market downturns can be severe.
US Equities: Offer access to world-leading corporations, potential dividend yields, and long-term capital appreciation driven by genuine economic productivity. However, systemic risks like global recessions or geopolitical friction still impact stock valuations.
Conclusion
A mature trading strategy does not pit Crypto against Stocks; instead, it leverages both asset classes. Combining the explosive yield potential of digital assets with the structural stability and value backing of US equities via Binance creates a resilient, well-rounded global portfolio.
#SEABstock #SEAstock#BinanceMyanmar
3. How Are Stocks Different from Crypto? Differences, Risks, and Opportunities
Understanding the distinct structural differences between digital assets and traditional equities is vital for constructing a balanced trading system.
Key Differences
Trading Hours: Crypto operates 24/7/365, allowing instant liquidity around the clock. US stocks trade within defined market hours (Monday to Friday, standard US Eastern Time).
Volatility Profile: Cryptocurrencies regularly experience double-digit percentage swings within hours. US equities generally move with lower, more structured volatility, anchored by tangible earnings and regulatory filings.
Regulatory Landscape: US stock issuers are held to strict reporting standards overseen by the Securities and Exchange Commission (SEC), offering high financial transparency.
Risks and Opportunities
Crypto Markets: Offer high risk alongside high return potential. While rapid capital multiplication is possible, market downturns can be severe.
US Equities: Offer access to world-leading corporations, potential dividend yields, and long-term capital appreciation driven by genuine economic productivity. However, systemic risks like global recessions or geopolitical friction still impact stock valuations.
Conclusion
A mature trading strategy does not pit Crypto against Stocks; instead, it leverages both asset classes. Combining the explosive yield potential of digital assets with the structural stability and value backing of US equities via Binance creates a resilient, well-rounded global portfolio.
#SEABstock #SEAstock#BinanceMyanmar
Understanding the distinct structural differences between digital assets and traditional equities is vital for constructing a balanced trading system.
Key Differences
Trading Hours: Crypto operates 24/7/365, allowing instant liquidity around the clock. US stocks trade within defined market hours (Monday to Friday, standard US Eastern Time).
Volatility Profile: Cryptocurrencies regularly experience double-digit percentage swings within hours. US equities generally move with lower, more structured volatility, anchored by tangible earnings and regulatory filings.
Regulatory Landscape: US stock issuers are held to strict reporting standards overseen by the Securities and Exchange Commission (SEC), offering high financial transparency.
Risks and Opportunities
Crypto Markets: Offer high risk alongside high return potential. While rapid capital multiplication is possible, market downturns can be severe.
US Equities: Offer access to world-leading corporations, potential dividend yields, and long-term capital appreciation driven by genuine economic productivity. However, systemic risks like global recessions or geopolitical friction still impact stock valuations.
Conclusion
A mature trading strategy does not pit Crypto against Stocks; instead, it leverages both asset classes. Combining the explosive yield potential of digital assets with the structural stability and value backing of US equities via Binance creates a resilient, well-rounded global portfolio.
#SEABstock #SEAstock#BinanceMyanmar
1
72
·
--
📊 BTC/USDT 7-Day Market Outlook & Setup 🚀
Bitcoin ($BTC) is currently consolidating within the $63,500 – $65,500 range, signaling a high-volatility breakout soon. As part of a disciplined approach, the strategy focuses on playing the range breakout rather than predicting direction early.
📊 BTC/USDT 7-Day Market Outlook & Setup 🚀
Bitcoin ($BTC) is currently consolidating within the $63,500 – $65,500 range, signaling a high-volatility breakout soon. As part of a disciplined approach, the strategy focuses on playing the range breakout rather than predicting direction early.
Bitcoin ($BTC) is currently consolidating within the $63,500 – $65,500 range, signaling a high-volatility breakout soon. As part of a disciplined approach, the strategy focuses on playing the range breakout rather than predicting direction early.
73
·
--
#baby $BABY
Babylon is revolutionary for Bitcoin security with its Trustless Bitcoin Vaults (TBV)! By enabling native BTC staking without third-party custody or bridge risks, @BabylonLabs_io empowers $BABY to bring unprecedented utility and decentralized security to PoS networks. Extremely bullish on the future of TBV!
#baby $BABY
Babylon is revolutionary for Bitcoin security with its Trustless Bitcoin Vaults (TBV)! By enabling native BTC staking without third-party custody or bridge risks, @BabylonLabs_io empowers $BABY to bring unprecedented utility and decentralized security to PoS networks. Extremely bullish on the future of TBV!
Babylon is revolutionary for Bitcoin security with its Trustless Bitcoin Vaults (TBV)! By enabling native BTC staking without third-party custody or bridge risks, @BabylonLabs_io empowers $BABY to bring unprecedented utility and decentralized security to PoS networks. Extremely bullish on the future of TBV!
71
·
--
#baby $BABY
Babylon is revolutionary for Bitcoin security with its Trustless Bitcoin Vaults (TBV)! By enabling native BTC staking without third-party custody or bridge risks, @BabylonLabs_io empowers $BABY to bring unprecedented utility and decentralized security to PoS networks. Extremely bullish on the future of TBV!
#baby $BABY
Babylon is revolutionary for Bitcoin security with its Trustless Bitcoin Vaults (TBV)! By enabling native BTC staking without third-party custody or bridge risks, @BabylonLabs_io empowers $BABY to bring unprecedented utility and decentralized security to PoS networks. Extremely bullish on the future of TBV!
Babylon is revolutionary for Bitcoin security with its Trustless Bitcoin Vaults (TBV)! By enabling native BTC staking without third-party custody or bridge risks, @BabylonLabs_io empowers $BABY to bring unprecedented utility and decentralized security to PoS networks. Extremely bullish on the future of TBV!
55
·
--
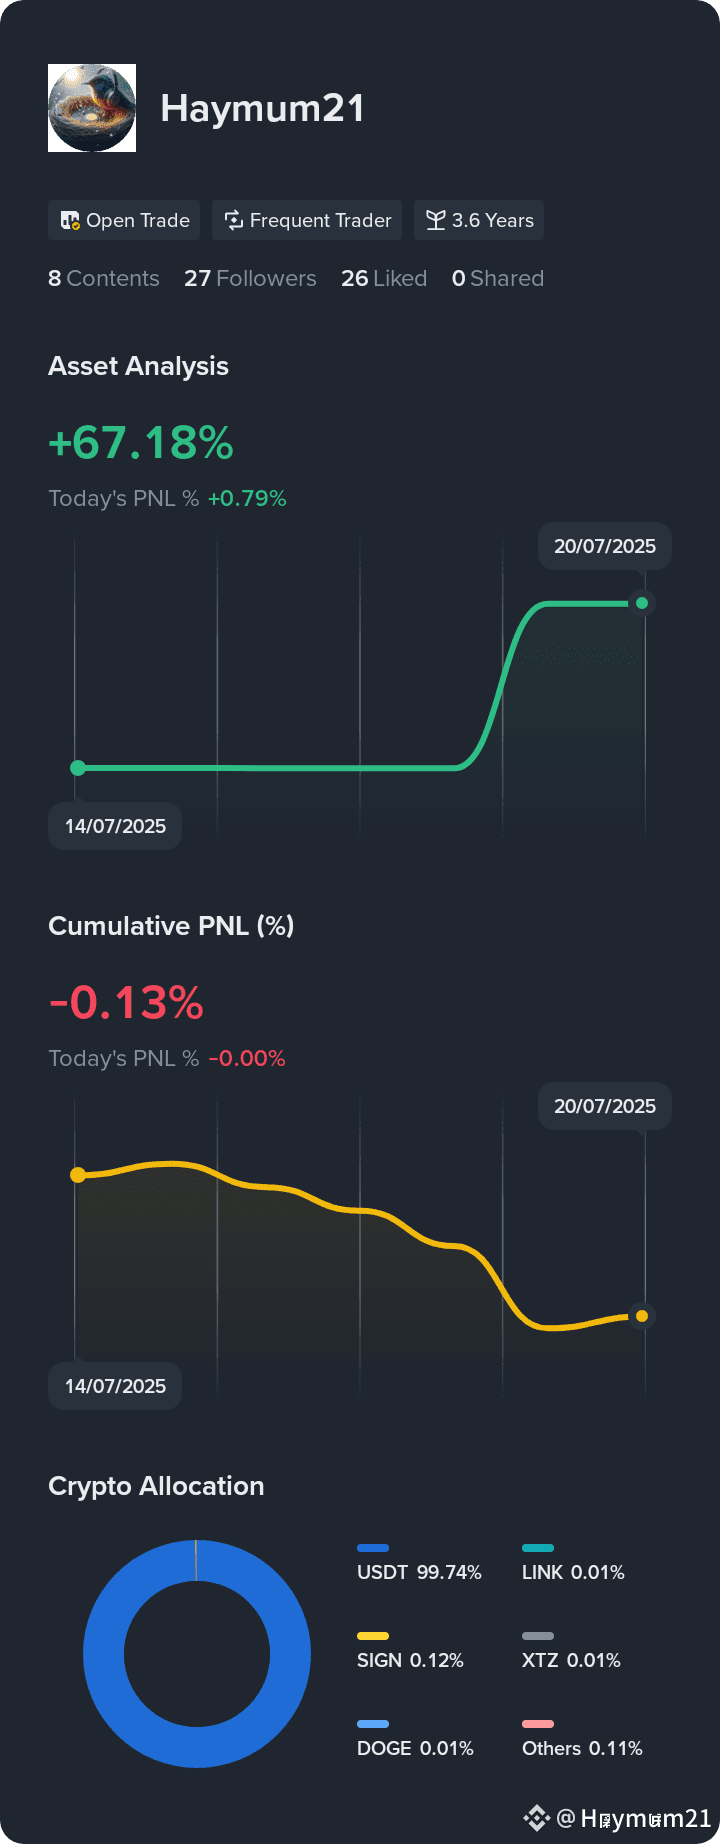
See my returns and portfolio breakdown. Follow for investment tips
See my returns and portfolio breakdown. Follow for investment tips
·
--
#BinanceTurns8 Join us in the #BinanceTurns8 celebration and win a share of up to $888,888 in BNB! https://www.binance.com/activity/binance-turns-8?ref=GRO_19600_BJT0D
#BinanceTurns8 Join us in the #BinanceTurns8 celebration and win a share of up to $888,888 in BNB! https://www.binance.com/activity/binance-turns-8?ref=GRO_19600_BJT0D
·
--
#BinanceTurns8 Collect all #BinanceTurns8 crypto star sign for a chance to win bonus BNB reward! https://www.binance.com/activity/binance-turns-8?ref=GRO_19600_BJT0D
#BinanceTurns8 Collect all #BinanceTurns8 crypto star sign for a chance to win bonus BNB reward! https://www.binance.com/activity/binance-turns-8?ref=GRO_19600_BJT0D
·
--
#BinanceTurns8 Join us in the #BinanceTurns8 celebration and win a share of up to $888,888 in BNB! https://www.binance.com/activity/binance-turns-8?ref=GRO_19600_BJT0D
#BinanceTurns8 Join us in the #BinanceTurns8 celebration and win a share of up to $888,888 in BNB! https://www.binance.com/activity/binance-turns-8?ref=GRO_19600_BJT0D
·
--
#XRPRealityCheck #XRPPredictions $XRP
{spot}(XRPUSDT)
A renowned analyst has disclosed that the ongoing consolidation phase of XRP could end next month, marking the beginning of a new rally.
Another analyst has predicted that a $2000 investment in XRP could generate a profit of $50,000 by the end of the year.
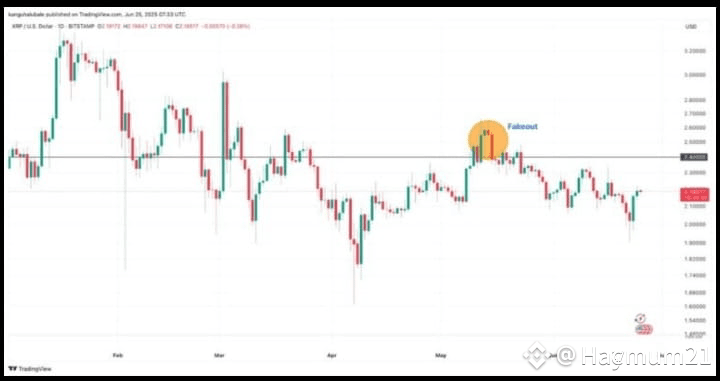
A popular crypto analyst identified as Egrag Crypto has pointed out the formation of a large symmetrical triangle on the XRP’s monthly time frame. According to him, the asset has been in the consolidation phase for 334 days, moving within the range of $2.0 and $2.4. Based on the analysis, the consolidation phase could end soon. After this, XRP could embark on an explosive run by mid-September.
However, the asset has to make a decisive move above the $2.2 level and subsequently break the $2.4 resistance point to validate this upsurge.
Source: TradingView
#XRPRealityCheck #XRPPredictions $XRP
A renowned analyst has disclosed that the ongoing consolidation phase of XRP could end next month, marking the beginning of a new rally.
Another analyst has predicted that a $2000 investment in XRP could generate a profit of $50,000 by the end of the year.
A popular crypto analyst identified as Egrag Crypto has pointed out the formation of a large symmetrical triangle on the XRP’s monthly time frame. According to him, the asset has been in the consolidation phase for 334 days, moving within the range of $2.0 and $2.4. Based on the analysis, the consolidation phase could end soon. After this, XRP could embark on an explosive run by mid-September.
However, the asset has to make a decisive move above the $2.2 level and subsequently break the $2.4 resistance point to validate this upsurge.
Source: TradingView
A renowned analyst has disclosed that the ongoing consolidation phase of XRP could end next month, marking the beginning of a new rally.
Another analyst has predicted that a $2000 investment in XRP could generate a profit of $50,000 by the end of the year.
A popular crypto analyst identified as Egrag Crypto has pointed out the formation of a large symmetrical triangle on the XRP’s monthly time frame. According to him, the asset has been in the consolidation phase for 334 days, moving within the range of $2.0 and $2.4. Based on the analysis, the consolidation phase could end soon. After this, XRP could embark on an explosive run by mid-September.
However, the asset has to make a decisive move above the $2.2 level and subsequently break the $2.4 resistance point to validate this upsurge.
Source: TradingView
125
·
--
TRUMP Price Eyes 55% Upside$TRUMP
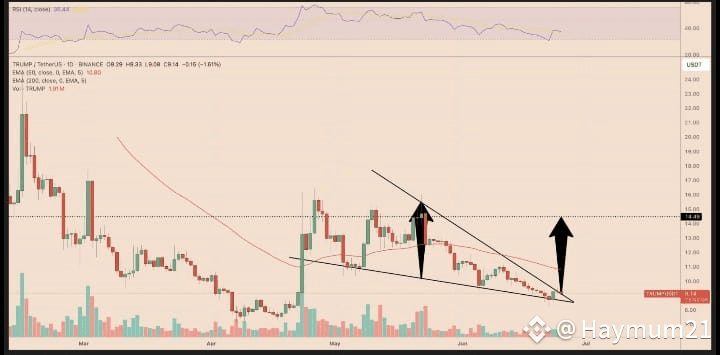
On June 25, the price of $TRUMP climbed past the upper trendline of a falling wedge formation, signaling the potential for a significant rally of up to 55%.
A falling wedge is a bullish reversal pattern characterized by two converging downward-sloping trendlines. This setup often culminates in a breakout above the upper trendline, with price gains usually matching the maximum height of the wedge
TRUMP meme coin breakout – Source: TradingView
#trumpcoin #TrumpCrypto
TRUMP Price Eyes 55% Upside$TRUMP
On June 25, the price of $TRUMP climbed past the upper trendline of a falling wedge formation, signaling the potential for a significant rally of up to 55%.
A falling wedge is a bullish reversal pattern characterized by two converging downward-sloping trendlines. This setup often culminates in a breakout above the upper trendline, with price gains usually matching the maximum height of the wedge
TRUMP meme coin breakout – Source: TradingView
#trumpcoin #TrumpCrypto
On June 25, the price of $TRUMP climbed past the upper trendline of a falling wedge formation, signaling the potential for a significant rally of up to 55%.
A falling wedge is a bullish reversal pattern characterized by two converging downward-sloping trendlines. This setup often culminates in a breakout above the upper trendline, with price gains usually matching the maximum height of the wedge
TRUMP meme coin breakout – Source: TradingView
#trumpcoin #TrumpCrypto
246
·
--
Solana price prediction
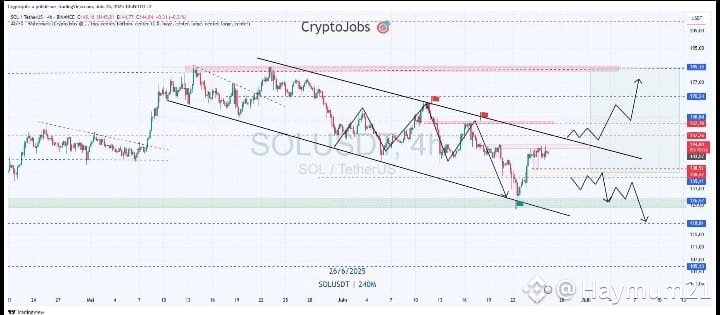
SOL/USDT daily chart. Source: Cointelegraph/TradingView
The recovery is facing selling at the 20-day EMA ($147), but a positive sign is that the bulls have not allowed the price to slide below $140. A shallow pullback increases the possibility of a break above the 20-day EMA. If that happens, the SOL/USDT pair could climb to the 50-day SMA ($160).
Sellers will have to pull and sustain the price below the $140 support to prevent the upside. The pair could then drop to $123 and eventually to $110.
#solanAnalysis $SOL
Solana price prediction
SOL/USDT daily chart. Source: Cointelegraph/TradingView
The recovery is facing selling at the 20-day EMA ($147), but a positive sign is that the bulls have not allowed the price to slide below $140. A shallow pullback increases the possibility of a break above the 20-day EMA. If that happens, the SOL/USDT pair could climb to the 50-day SMA ($160).
Sellers will have to pull and sustain the price below the $140 support to prevent the upside. The pair could then drop to $123 and eventually to $110.
#solanAnalysis $SOL
SOL/USDT daily chart. Source: Cointelegraph/TradingView
The recovery is facing selling at the 20-day EMA ($147), but a positive sign is that the bulls have not allowed the price to slide below $140. A shallow pullback increases the possibility of a break above the 20-day EMA. If that happens, the SOL/USDT pair could climb to the 50-day SMA ($160).
Sellers will have to pull and sustain the price below the $140 support to prevent the upside. The pair could then drop to $123 and eventually to $110.
#solanAnalysis $SOL
13
232
·
--
Daily Crypto Insides$BTC
{spot}(BTCUSDT)
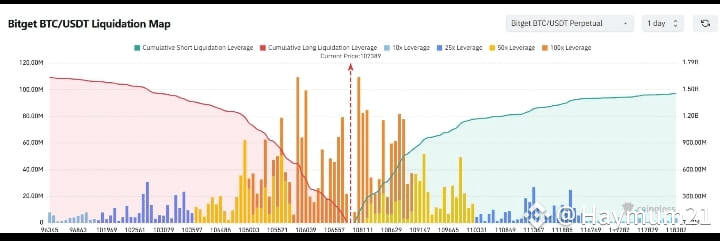
BTC saw slow, steady gains, touching 108,000; there were $205 million in liquidations (mostly shorts) over the past 24h. Small caps like $BAI and $BUBB led the gains, while $AB and $KAS entered the platform's top ten by trading volume.
US stocks lost momentum, but Nvidia rose 4% to boost Nasdaq for a third straight gain; oil rebounded, rising 2% after recent sharp declines; the USD neared three-year lows
#BTC🔥🔥🔥🔥🔥
Daily Crypto Insides$BTC
BTC saw slow, steady gains, touching 108,000; there were $205 million in liquidations (mostly shorts) over the past 24h. Small caps like $BAI and $BUBB led the gains, while $AB and $KAS entered the platform's top ten by trading volume.
US stocks lost momentum, but Nvidia rose 4% to boost Nasdaq for a third straight gain; oil rebounded, rising 2% after recent sharp declines; the USD neared three-year lows
#BTC🔥🔥🔥🔥🔥
BTC saw slow, steady gains, touching 108,000; there were $205 million in liquidations (mostly shorts) over the past 24h. Small caps like $BAI and $BUBB led the gains, while $AB and $KAS entered the platform's top ten by trading volume.
US stocks lost momentum, but Nvidia rose 4% to boost Nasdaq for a third straight gain; oil rebounded, rising 2% after recent sharp declines; the USD neared three-year lows
#BTC🔥🔥🔥🔥🔥
8
1.4k
·
--
Hi
Ethereum (ETH)
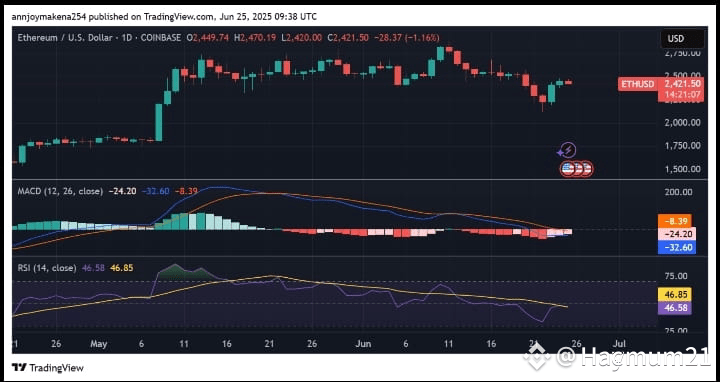
Ethereum outperformed Bitcoin throughout Q2 2025, rising between 39.9% and 53% following a steep decline in Q1. The rebound was a result of revived energy in decentralized finance (DeFi), surging institutional involvement, and augmented involvement in the network. ETH is now valued at $2421, dropping to a low of $2197 earlier this week.
Technical indicators favor an additional increase. The RSI stands at 46.58, and the MACD levels are exhibiting convergence indicators suggesting that the trend can be reversed soon. Near-term resistance stands at $2,547 and $3,000. Any sustained action beyond these new thresholds may result in a retest of $3200 in the early parts of Q3.
Source : trading view
#ETH🔥🔥🔥🔥🔥🔥
Hi
Ethereum (ETH)
Ethereum outperformed Bitcoin throughout Q2 2025, rising between 39.9% and 53% following a steep decline in Q1. The rebound was a result of revived energy in decentralized finance (DeFi), surging institutional involvement, and augmented involvement in the network. ETH is now valued at $2421, dropping to a low of $2197 earlier this week.
Technical indicators favor an additional increase. The RSI stands at 46.58, and the MACD levels are exhibiting convergence indicators suggesting that the trend can be reversed soon. Near-term resistance stands at $2,547 and $3,000. Any sustained action beyond these new thresholds may result in a retest of $3200 in the early parts of Q3.
Source : trading view
#ETH🔥🔥🔥🔥🔥🔥
Ethereum (ETH)
Ethereum outperformed Bitcoin throughout Q2 2025, rising between 39.9% and 53% following a steep decline in Q1. The rebound was a result of revived energy in decentralized finance (DeFi), surging institutional involvement, and augmented involvement in the network. ETH is now valued at $2421, dropping to a low of $2197 earlier this week.
Technical indicators favor an additional increase. The RSI stands at 46.58, and the MACD levels are exhibiting convergence indicators suggesting that the trend can be reversed soon. Near-term resistance stands at $2,547 and $3,000. Any sustained action beyond these new thresholds may result in a retest of $3200 in the early parts of Q3.
Source : trading view
#ETH🔥🔥🔥🔥🔥🔥
5
77
Log in to explore more content
Join global crypto users on Binance Square
⚡️ Get latest and useful information about crypto.
💬 Trusted by the world’s largest crypto exchange.
👍 Discover real insights from verified creators.
Email / Phone number
Trending Topics
AIStocksWhatNext
709,232 views
5,323 Discussing
Share & Win Traffic Reward in our Trending Hashtag Campaign
✨Topic: What Other Investment Opportunities Remain as AI Stocks Keep Rising?
👉How to Join:
Publish a short post or article with hashtag #AIStocksWhatNext
Share whether you’re bullish or bearish, and post your AI stock holdings or trade — using the trade widget may improve your eligibility.
You can also strengthen your post by sharing data or charts, and avoiding AI-generated images.
✍️Create content based on the below angles:
- Nvidia says chip sales will double next year, and top AI companies keep hitting record revenue, the compute spend behind it is just as staggering. Is AI demand really taking off? And how long can it last? AI stocks are up across the board. Is this a real breakout, or just a short-term bounce?
- Industry leaders are calling to slow down AI development, while Trump plans to build an “AI Force”, claiming AI could account for 25% of U.S. GDP in the future. Whose side are you on? Will state-level backing be a long-term win for AI stocks?
- Are you buying AI stocks? Share your AI-related trade/holdings with our trade sharing widget.
⏰Campaign Period:
- 2026-09-22 7:00 - 2026-09-24 4:00 UTC
🎁Reward:
- Qualified posts that comply with the above guidelines and contain more than 100 words will be reviewed and may receive a random traffic boost of 500 to 3,000 views. You will receive a notification from your feed secretary if your post is selected.
- Get a chance to have your article featured on Binance Square Official
Need ideas for your post? Visit the topic page #AIStocksWhatNext or the Square Guide on How to Post for Better Reach.
Binance Square Official
·519 Likes
·1.4M views
21SharesLaunchesEuropesFirstZcashETP
19,311 views
673 Discussing
CardanoJoinsX402PaymentStandard
13,418 views
507 Discussing