

Lisa丽萨
1.4k Posts

Lisa丽萨
 Square Verified+
Report
Block User
👉X Hawk_xxs 最早建设广场的博主,经历多次牛熊,非常看好web3的未来,正在web3赛道上努力着,期待更多志同道合者一起同行🤝
Frequent Trader
8.8 Years
2.5K+ Following
70.2K+ Followers
70.0K+ Liked
Posts
All
Quotes
Videos
Live
·
--
The once-hot L2 Blast has announced it is shutting down—have you withdrawn your money?
Remember how popular Blast was back then? You could store ETH and stablecoins and earn yield built-in, plus points-based incentive airdrops. TVL shot up in just a few days—back then, who wouldn’t rush in?
Now the official announcement says they’re closing it themselves. The reason is unusually direct: operating costs outweigh revenue. The incentives they distribute are more than the gas fees they collect. In plain terms, the numbers don’t add up—this business just isn’t profitable.
Mark these dates for sure:
All assets must be bridged back to the Ethereum mainnet before October 26. In the meantime, because they need to dismantle the staked positions on the Lido side, withdrawals will be paused for about a week. After it resumes, withdrawals will have a 24-hour delay.
If you’ve got money in there, don’t wait until the last few days. People will all squeeze in at the same time then, and the experience will only get worse.
As for the token price, the market has already answered. When the news broke, BLAST dropped more than 40% on the spot, falling to around 0.00024. Market cap is down to roughly $24 million. Everyone knows how high the valuation used to be.
I think this matter is more worth pondering than the mere collapse of a project itself. It shows that L2 has entered a “clearing” phase—chains propped up by subsidies. Once subsidies stop, users leave. Good data doesn’t mean the business is actually sound.
On the same day, Arbitrum’s security committee also urgently upgraded—pausing the activation of new Stylus contracts—and added another layer of protection against the BoLD controversy. The L2 scene hasn’t been exactly peaceful lately.
Going forward, when looking at L2 projects, I’ll only check three things: whether real protocol fee revenue can cover incentive spending; whether there are native applications that can keep users there; and whether the token actually has value capture.
If any one of these can’t be answered, even if the TVL is high, don’t touch it.
The once-hot L2 Blast has announced it is shutting down—have you withdrawn your money?
Remember how popular Blast was back then? You could store ETH and stablecoins and earn yield built-in, plus points-based incentive airdrops. TVL shot up in just a few days—back then, who wouldn’t rush in?
Now the official announcement says they’re closing it themselves. The reason is unusually direct: operating costs outweigh revenue. The incentives they distribute are more than the gas fees they collect. In plain terms, the numbers don’t add up—this business just isn’t profitable.
Mark these dates for sure:
All assets must be bridged back to the Ethereum mainnet before October 26. In the meantime, because they need to dismantle the staked positions on the Lido side, withdrawals will be paused for about a week. After it resumes, withdrawals will have a 24-hour delay.
If you’ve got money in there, don’t wait until the last few days. People will all squeeze in at the same time then, and the experience will only get worse.
As for the token price, the market has already answered. When the news broke, BLAST dropped more than 40% on the spot, falling to around 0.00024. Market cap is down to roughly $24 million. Everyone knows how high the valuation used to be.
I think this matter is more worth pondering than the mere collapse of a project itself. It shows that L2 has entered a “clearing” phase—chains propped up by subsidies. Once subsidies stop, users leave. Good data doesn’t mean the business is actually sound.
On the same day, Arbitrum’s security committee also urgently upgraded—pausing the activation of new Stylus contracts—and added another layer of protection against the BoLD controversy. The L2 scene hasn’t been exactly peaceful lately.
Going forward, when looking at L2 projects, I’ll only check three things: whether real protocol fee revenue can cover incentive spending; whether there are native applications that can keep users there; and whether the token actually has value capture.
If any one of these can’t be answered, even if the TVL is high, don’t touch it.
Remember how popular Blast was back then? You could store ETH and stablecoins and earn yield built-in, plus points-based incentive airdrops. TVL shot up in just a few days—back then, who wouldn’t rush in?
Now the official announcement says they’re closing it themselves. The reason is unusually direct: operating costs outweigh revenue. The incentives they distribute are more than the gas fees they collect. In plain terms, the numbers don’t add up—this business just isn’t profitable.
Mark these dates for sure:
All assets must be bridged back to the Ethereum mainnet before October 26. In the meantime, because they need to dismantle the staked positions on the Lido side, withdrawals will be paused for about a week. After it resumes, withdrawals will have a 24-hour delay.
If you’ve got money in there, don’t wait until the last few days. People will all squeeze in at the same time then, and the experience will only get worse.
As for the token price, the market has already answered. When the news broke, BLAST dropped more than 40% on the spot, falling to around 0.00024. Market cap is down to roughly $24 million. Everyone knows how high the valuation used to be.
I think this matter is more worth pondering than the mere collapse of a project itself. It shows that L2 has entered a “clearing” phase—chains propped up by subsidies. Once subsidies stop, users leave. Good data doesn’t mean the business is actually sound.
On the same day, Arbitrum’s security committee also urgently upgraded—pausing the activation of new Stylus contracts—and added another layer of protection against the BoLD controversy. The L2 scene hasn’t been exactly peaceful lately.
Going forward, when looking at L2 projects, I’ll only check three things: whether real protocol fee revenue can cover incentive spending; whether there are native applications that can keep users there; and whether the token actually has value capture.
If any one of these can’t be answered, even if the TVL is high, don’t touch it.
2
371
·
--
Live now—welcome everyone to the livestream chat!
Live now—welcome everyone to the livestream chat!
Quoted content has been removed
1
170
·
--
Bullish
Verified
$85,000 wall-sell orders get eaten up — what does Bitcoin look at next?
What’s most worth watching in today’s market isn’t how much Bitcoin has risen, but the change in the “sell wall” above that has been suppressing the price for a long time.
Bitcoin has tested the $85,000 area multiple times without truly holding. Many people have already treated this level as a short-term ceiling. But in the latest market data, sell orders near $85,000 are being continuously absorbed, and the overhead selling pressure has clearly decreased.
This points to one thing:
The market isn’t lacking sellers; rather, buyers are starting to be willing to pick up inventory at higher levels.
As of today, Bitcoin is trading around $85,000, up about 1.8% over the past 24 hours. The market sentiment index is still in the “greed” zone at 71. It seems somewhat overheated, but leverage hasn’t shown any particularly extreme signs of going out of control.
What truly needs attention is that the outside environment isn’t easy.
The U.S. 10-year Treasury yield has risen to 5.342%, the highest level since 2002. Typically, higher yields put pressure on risk assets, pulling capital toward cash and bonds. But Bitcoin is still maintaining strength in this backdrop, suggesting that some capital is starting to treat it as an independent asset—not just a shadow of high-volatility tech stocks.
Next, the most critical question isn’t whether Bitcoin will rise or fall just by guessing around $85,000; it’s whether Bitcoin can turn this level from resistance into support.
If it holds at that level with volume, the market may continue searching for new upside room.
If it fails to push higher again and drops back below the sell wall, it would indicate that buyers haven’t fully taken over the market.
Bitcoin is not yet at the stage where you can blindly chase with confidence, but the most comfortable environment for the bears is being dismantled bit by bit.
Bottom line judgment:
The absorption of the $85,000 sell wall is a moderately positive signal, but true confirmation still requires price to hold and for volume to back it up $BTC
{spot}(BTCUSDT)
$85,000 wall-sell orders get eaten up — what does Bitcoin look at next?
What’s most worth watching in today’s market isn’t how much Bitcoin has risen, but the change in the “sell wall” above that has been suppressing the price for a long time.
Bitcoin has tested the $85,000 area multiple times without truly holding. Many people have already treated this level as a short-term ceiling. But in the latest market data, sell orders near $85,000 are being continuously absorbed, and the overhead selling pressure has clearly decreased.
This points to one thing:
The market isn’t lacking sellers; rather, buyers are starting to be willing to pick up inventory at higher levels.
As of today, Bitcoin is trading around $85,000, up about 1.8% over the past 24 hours. The market sentiment index is still in the “greed” zone at 71. It seems somewhat overheated, but leverage hasn’t shown any particularly extreme signs of going out of control.
What truly needs attention is that the outside environment isn’t easy.
The U.S. 10-year Treasury yield has risen to 5.342%, the highest level since 2002. Typically, higher yields put pressure on risk assets, pulling capital toward cash and bonds. But Bitcoin is still maintaining strength in this backdrop, suggesting that some capital is starting to treat it as an independent asset—not just a shadow of high-volatility tech stocks.
Next, the most critical question isn’t whether Bitcoin will rise or fall just by guessing around $85,000; it’s whether Bitcoin can turn this level from resistance into support.
If it holds at that level with volume, the market may continue searching for new upside room.
If it fails to push higher again and drops back below the sell wall, it would indicate that buyers haven’t fully taken over the market.
Bitcoin is not yet at the stage where you can blindly chase with confidence, but the most comfortable environment for the bears is being dismantled bit by bit.
Bottom line judgment:
The absorption of the $85,000 sell wall is a moderately positive signal, but true confirmation still requires price to hold and for volume to back it up $BTC
What’s most worth watching in today’s market isn’t how much Bitcoin has risen, but the change in the “sell wall” above that has been suppressing the price for a long time.
Bitcoin has tested the $85,000 area multiple times without truly holding. Many people have already treated this level as a short-term ceiling. But in the latest market data, sell orders near $85,000 are being continuously absorbed, and the overhead selling pressure has clearly decreased.
This points to one thing:
The market isn’t lacking sellers; rather, buyers are starting to be willing to pick up inventory at higher levels.
As of today, Bitcoin is trading around $85,000, up about 1.8% over the past 24 hours. The market sentiment index is still in the “greed” zone at 71. It seems somewhat overheated, but leverage hasn’t shown any particularly extreme signs of going out of control.
What truly needs attention is that the outside environment isn’t easy.
The U.S. 10-year Treasury yield has risen to 5.342%, the highest level since 2002. Typically, higher yields put pressure on risk assets, pulling capital toward cash and bonds. But Bitcoin is still maintaining strength in this backdrop, suggesting that some capital is starting to treat it as an independent asset—not just a shadow of high-volatility tech stocks.
Next, the most critical question isn’t whether Bitcoin will rise or fall just by guessing around $85,000; it’s whether Bitcoin can turn this level from resistance into support.
If it holds at that level with volume, the market may continue searching for new upside room.
If it fails to push higher again and drops back below the sell wall, it would indicate that buyers haven’t fully taken over the market.
Bitcoin is not yet at the stage where you can blindly chase with confidence, but the most comfortable environment for the bears is being dismantled bit by bit.
Bottom line judgment:
The absorption of the $85,000 sell wall is a moderately positive signal, but true confirmation still requires price to hold and for volume to back it up $BTC
3
813
·
--
Bullish
Will October really go up? This time, what matters more than slogans is seeing a key fact
The hottest phrase in the market lately is
Is the October rally coming again?
The reason is simple: based on historical performance, Bitcoin in October really often surprises the market
Over the past decade or more, Bitcoin’s average rise in October is about 18.52%, with 10 out of the years seeing gains. The median increase is also above 12%
Once this data is released, many people’s first reaction is
Since October’s win rate is so high, shouldn’t we just get in now?
I don’t think it’s that simple
Historical patterns can offer reference, but they can’t replace today’s market environment
Right now, Bitcoin is around $84,200. It has risen nearly 1% over the past 24 hours, and market sentiment is still in the greed zone. The Fear and Greed Index has recently stayed above 70
This suggests the market isn’t short on confidence
But when confidence is too high, you should be careful about one issue
Is the buying demand real, or is it just short-term capital chasing the price?
Bitcoin is up about 42.71% in the third quarter, one of the strongest quarters in history. The price has already moved through a major rally ahead of time
So even if we remain bullish for October, we can’t just understand it as “only up, never down”
A more reasonable scenario might be
First, consolidate and digest the profit-taking, then see whether new capital can keep entering
If spot demand continues to recover and ETF flows keep absorbing, then October has a chance to extend its strength
But if the market only has sentiment and no new funds to carry it forward, then even the “October miracle” from history could turn into choppy consolidation at high levels
What I care about more isn’t whether October can rise
It’s whether, after a pullback, people are still willing to keep buying
That’s the difference between a real market and a sentiment-driven one
Personal view
You can stay optimistic about October, but it isn’t suitable for blindly chasing highs
A truly strong market won’t rise just because of one historical data point
Going forward, the focus should be on spot trading, ETF fund flows, and the strength of follow-through after the pullback
Will October really go up? This time, what matters more than slogans is seeing a key fact
The hottest phrase in the market lately is
Is the October rally coming again?
The reason is simple: based on historical performance, Bitcoin in October really often surprises the market
Over the past decade or more, Bitcoin’s average rise in October is about 18.52%, with 10 out of the years seeing gains. The median increase is also above 12%
Once this data is released, many people’s first reaction is
Since October’s win rate is so high, shouldn’t we just get in now?
I don’t think it’s that simple
Historical patterns can offer reference, but they can’t replace today’s market environment
Right now, Bitcoin is around $84,200. It has risen nearly 1% over the past 24 hours, and market sentiment is still in the greed zone. The Fear and Greed Index has recently stayed above 70
This suggests the market isn’t short on confidence
But when confidence is too high, you should be careful about one issue
Is the buying demand real, or is it just short-term capital chasing the price?
Bitcoin is up about 42.71% in the third quarter, one of the strongest quarters in history. The price has already moved through a major rally ahead of time
So even if we remain bullish for October, we can’t just understand it as “only up, never down”
A more reasonable scenario might be
First, consolidate and digest the profit-taking, then see whether new capital can keep entering
If spot demand continues to recover and ETF flows keep absorbing, then October has a chance to extend its strength
But if the market only has sentiment and no new funds to carry it forward, then even the “October miracle” from history could turn into choppy consolidation at high levels
What I care about more isn’t whether October can rise
It’s whether, after a pullback, people are still willing to keep buying
That’s the difference between a real market and a sentiment-driven one
Personal view
You can stay optimistic about October, but it isn’t suitable for blindly chasing highs
A truly strong market won’t rise just because of one historical data point
Going forward, the focus should be on spot trading, ETF fund flows, and the strength of follow-through after the pullback
The hottest phrase in the market lately is
Is the October rally coming again?
The reason is simple: based on historical performance, Bitcoin in October really often surprises the market
Over the past decade or more, Bitcoin’s average rise in October is about 18.52%, with 10 out of the years seeing gains. The median increase is also above 12%
Once this data is released, many people’s first reaction is
Since October’s win rate is so high, shouldn’t we just get in now?
I don’t think it’s that simple
Historical patterns can offer reference, but they can’t replace today’s market environment
Right now, Bitcoin is around $84,200. It has risen nearly 1% over the past 24 hours, and market sentiment is still in the greed zone. The Fear and Greed Index has recently stayed above 70
This suggests the market isn’t short on confidence
But when confidence is too high, you should be careful about one issue
Is the buying demand real, or is it just short-term capital chasing the price?
Bitcoin is up about 42.71% in the third quarter, one of the strongest quarters in history. The price has already moved through a major rally ahead of time
So even if we remain bullish for October, we can’t just understand it as “only up, never down”
A more reasonable scenario might be
First, consolidate and digest the profit-taking, then see whether new capital can keep entering
If spot demand continues to recover and ETF flows keep absorbing, then October has a chance to extend its strength
But if the market only has sentiment and no new funds to carry it forward, then even the “October miracle” from history could turn into choppy consolidation at high levels
What I care about more isn’t whether October can rise
It’s whether, after a pullback, people are still willing to keep buying
That’s the difference between a real market and a sentiment-driven one
Personal view
You can stay optimistic about October, but it isn’t suitable for blindly chasing highs
A truly strong market won’t rise just because of one historical data point
Going forward, the focus should be on spot trading, ETF fund flows, and the strength of follow-through after the pullback
1
337
·
--
TRX gets a new institutional gateway, but an ETF listing doesn’t mean the price will skyrocket right away
Recent news shows that TRON has clearly been drawing more market attention
The latest update indicates that exchange-traded products related to TRX staking have already launched in the US market, with the ticker TRXS
Why is this worth paying attention to?
Because for many traditional funds, directly buying cryptocurrencies still faces restrictions around accounts, custody, and compliance
Exchange-traded products offer a more familiar entry point
Institutional capital doesn’t necessarily need to directly manage wallets, and it doesn’t need to participate in on-chain staking itself—through a traditional securities account, investors can gain market exposure to TRX
More importantly, this is not just plain spot exposure; it includes a design that incorporates staking yield
If the product can continuously attract capital, the impact may be more than just a short-term boost in visibility
On one hand, it may prompt more traditional investors to start paying attention to the TRON ecosystem
On the other hand, it could also lead the market to revisit TRX cash flow and where its returns come from
Of course, we shouldn’t be overly optimistic here
Whether the product can attract sustained capital after launch, and whether there is actual trading volume, are two completely different matters
Many assets generate a lot of attention right after listing, but if no further capital keeps entering afterward, they eventually revert to their original liquidity levels
For TRX, the real indicators worth watching are three
First, whether the product size can keep growing
Second, whether TRON’s on-chain stablecoin and payments business continues to expand
Third, how much the market recognizes the staking yield
If there’s only headline momentum without supporting capital and on-chain data, price gains are often hard to sustain
But if the product size keeps increasing while TRON network usage rises in parallel, that suggests an institutional gateway is taking shape
An ETF is just the door-opener—the real factors determining TRX’s future upside are still the scale of capital and the level of ecosystem usage
TRX gets a new institutional gateway, but an ETF listing doesn’t mean the price will skyrocket right away
Recent news shows that TRON has clearly been drawing more market attention
The latest update indicates that exchange-traded products related to TRX staking have already launched in the US market, with the ticker TRXS
Why is this worth paying attention to?
Because for many traditional funds, directly buying cryptocurrencies still faces restrictions around accounts, custody, and compliance
Exchange-traded products offer a more familiar entry point
Institutional capital doesn’t necessarily need to directly manage wallets, and it doesn’t need to participate in on-chain staking itself—through a traditional securities account, investors can gain market exposure to TRX
More importantly, this is not just plain spot exposure; it includes a design that incorporates staking yield
If the product can continuously attract capital, the impact may be more than just a short-term boost in visibility
On one hand, it may prompt more traditional investors to start paying attention to the TRON ecosystem
On the other hand, it could also lead the market to revisit TRX cash flow and where its returns come from
Of course, we shouldn’t be overly optimistic here
Whether the product can attract sustained capital after launch, and whether there is actual trading volume, are two completely different matters
Many assets generate a lot of attention right after listing, but if no further capital keeps entering afterward, they eventually revert to their original liquidity levels
For TRX, the real indicators worth watching are three
First, whether the product size can keep growing
Second, whether TRON’s on-chain stablecoin and payments business continues to expand
Third, how much the market recognizes the staking yield
If there’s only headline momentum without supporting capital and on-chain data, price gains are often hard to sustain
But if the product size keeps increasing while TRON network usage rises in parallel, that suggests an institutional gateway is taking shape
An ETF is just the door-opener—the real factors determining TRX’s future upside are still the scale of capital and the level of ecosystem usage
Recent news shows that TRON has clearly been drawing more market attention
The latest update indicates that exchange-traded products related to TRX staking have already launched in the US market, with the ticker TRXS
Why is this worth paying attention to?
Because for many traditional funds, directly buying cryptocurrencies still faces restrictions around accounts, custody, and compliance
Exchange-traded products offer a more familiar entry point
Institutional capital doesn’t necessarily need to directly manage wallets, and it doesn’t need to participate in on-chain staking itself—through a traditional securities account, investors can gain market exposure to TRX
More importantly, this is not just plain spot exposure; it includes a design that incorporates staking yield
If the product can continuously attract capital, the impact may be more than just a short-term boost in visibility
On one hand, it may prompt more traditional investors to start paying attention to the TRON ecosystem
On the other hand, it could also lead the market to revisit TRX cash flow and where its returns come from
Of course, we shouldn’t be overly optimistic here
Whether the product can attract sustained capital after launch, and whether there is actual trading volume, are two completely different matters
Many assets generate a lot of attention right after listing, but if no further capital keeps entering afterward, they eventually revert to their original liquidity levels
For TRX, the real indicators worth watching are three
First, whether the product size can keep growing
Second, whether TRON’s on-chain stablecoin and payments business continues to expand
Third, how much the market recognizes the staking yield
If there’s only headline momentum without supporting capital and on-chain data, price gains are often hard to sustain
But if the product size keeps increasing while TRON network usage rises in parallel, that suggests an institutional gateway is taking shape
An ETF is just the door-opener—the real factors determining TRX’s future upside are still the scale of capital and the level of ecosystem usage
1
390
·
--
3,568 BTC transfers shock the market—but this time it may not actually be selling
An address related to a certain organization transferred 3,568 BTC. Based on the price at the time, the amount is roughly $297 million.
After seeing this figure, many people immediately began speculating whether the institution is preparing to reduce its holdings. Some even directly linked this transfer to a Bitcoin pullback.
But based on current on-chain analysis results, this looks more like internal address reshuffling within a custody system, and it does not necessarily mean these BTC have already been sold.
We need to remind those who are just starting to look at on-chain data: seeing a large transfer doesn’t mean you’ve seen sell orders. Seeing an address change doesn’t mean you’ve seen capital fleeing.
Institutional assets are often distributed across multiple custodial addresses. Transfers between addresses can happen due to security management, account consolidation, risk isolation, or changes in custody structure. If BTC are moved from one custodial address to another, then there is no direct impact on the market’s real supply and demand.
What truly matters are the next three things:
1) Whether these BTC enter public trading platforms.
2) Whether, after the transfer, there are continuous large sell-offs.
3) Whether market price shows a corresponding surge in sell volume and a drop.
If it’s only movement between addresses, its effect on price is driven more by sentiment than by actual sell pressure.
That’s also why on-chain data can’t be judged only by the transfer amount—you have to examine the fund path and the final destination.
Right now, BTC is hovering around $83,000, and the market is already quite sensitive. A transfer of several hundred million dollars can easily be magnified and misinterpreted. But traders can’t rely on the headline alone, and they also can’t treat every large movement as a bearish signal.
Of course, this doesn’t mean institutional transfers carry zero risk. If, going forward, these BTC continue flowing to trading platforms—or if multiple related addresses transfer out at the same time—then market pressure could increase significantly.
In the short term, this news looks more like an emotional shock and still can’t be definitively labeled as institutional selling. The more sensitive the market is, the more important it is to distinguish on-chain transfers from real sell pressure. This is often the difference between ordinary traders and mature traders.
3,568 BTC transfers shock the market—but this time it may not actually be selling
An address related to a certain organization transferred 3,568 BTC. Based on the price at the time, the amount is roughly $297 million.
After seeing this figure, many people immediately began speculating whether the institution is preparing to reduce its holdings. Some even directly linked this transfer to a Bitcoin pullback.
But based on current on-chain analysis results, this looks more like internal address reshuffling within a custody system, and it does not necessarily mean these BTC have already been sold.
We need to remind those who are just starting to look at on-chain data: seeing a large transfer doesn’t mean you’ve seen sell orders. Seeing an address change doesn’t mean you’ve seen capital fleeing.
Institutional assets are often distributed across multiple custodial addresses. Transfers between addresses can happen due to security management, account consolidation, risk isolation, or changes in custody structure. If BTC are moved from one custodial address to another, then there is no direct impact on the market’s real supply and demand.
What truly matters are the next three things:
1) Whether these BTC enter public trading platforms.
2) Whether, after the transfer, there are continuous large sell-offs.
3) Whether market price shows a corresponding surge in sell volume and a drop.
If it’s only movement between addresses, its effect on price is driven more by sentiment than by actual sell pressure.
That’s also why on-chain data can’t be judged only by the transfer amount—you have to examine the fund path and the final destination.
Right now, BTC is hovering around $83,000, and the market is already quite sensitive. A transfer of several hundred million dollars can easily be magnified and misinterpreted. But traders can’t rely on the headline alone, and they also can’t treat every large movement as a bearish signal.
Of course, this doesn’t mean institutional transfers carry zero risk. If, going forward, these BTC continue flowing to trading platforms—or if multiple related addresses transfer out at the same time—then market pressure could increase significantly.
In the short term, this news looks more like an emotional shock and still can’t be definitively labeled as institutional selling. The more sensitive the market is, the more important it is to distinguish on-chain transfers from real sell pressure. This is often the difference between ordinary traders and mature traders.
An address related to a certain organization transferred 3,568 BTC. Based on the price at the time, the amount is roughly $297 million.
After seeing this figure, many people immediately began speculating whether the institution is preparing to reduce its holdings. Some even directly linked this transfer to a Bitcoin pullback.
But based on current on-chain analysis results, this looks more like internal address reshuffling within a custody system, and it does not necessarily mean these BTC have already been sold.
We need to remind those who are just starting to look at on-chain data: seeing a large transfer doesn’t mean you’ve seen sell orders. Seeing an address change doesn’t mean you’ve seen capital fleeing.
Institutional assets are often distributed across multiple custodial addresses. Transfers between addresses can happen due to security management, account consolidation, risk isolation, or changes in custody structure. If BTC are moved from one custodial address to another, then there is no direct impact on the market’s real supply and demand.
What truly matters are the next three things:
1) Whether these BTC enter public trading platforms.
2) Whether, after the transfer, there are continuous large sell-offs.
3) Whether market price shows a corresponding surge in sell volume and a drop.
If it’s only movement between addresses, its effect on price is driven more by sentiment than by actual sell pressure.
That’s also why on-chain data can’t be judged only by the transfer amount—you have to examine the fund path and the final destination.
Right now, BTC is hovering around $83,000, and the market is already quite sensitive. A transfer of several hundred million dollars can easily be magnified and misinterpreted. But traders can’t rely on the headline alone, and they also can’t treat every large movement as a bearish signal.
Of course, this doesn’t mean institutional transfers carry zero risk. If, going forward, these BTC continue flowing to trading platforms—or if multiple related addresses transfer out at the same time—then market pressure could increase significantly.
In the short term, this news looks more like an emotional shock and still can’t be definitively labeled as institutional selling. The more sensitive the market is, the more important it is to distinguish on-chain transfers from real sell pressure. This is often the difference between ordinary traders and mature traders.
3
470
·
--
These two weeks, security incidents have piled up—your account may be riskier than you think
Recently, several security incidents have happened one after another in the circle. Someone’s account was stolen; even after it was frozen, the API was not removed, and 340,000 USDT was transferred out anyway. There were also cases on public chains where, due to a gateway vulnerability, extra tokens were minted—leading to a direct restart.
My biggest takeaway after reading everything is: most people lose money not because of the market, but because of poor security habits.
Here are a few solid, actionable recommendations—you can finish them in ten minutes.
First: minimize API permissions. For quant and copy-trading tools, enable only read and trade permissions. Never enable withdrawal permissions. You must bind an IP whitelist. If you don’t need it, delete it immediately. That 340,000 USDT case happened because of the API.
Second: enable the withdrawal whitelist. Allow withdrawals only to the few addresses you commonly use. Even if the account gets logged into, the money can’t be transferred out.
Third: set an anti-phishing code. Official emails you receive in the future will include this code. If there’s no code, treat it as a scam.
Fourth: if you can use a passkey, don’t rely only on SMS verification. Every year there are cases of phone numbers being hijacked.
Fifth: for large assets that you won’t move for a long time, store them in a cold wallet. Periodically revoke on-chain authorizations. Messy contract approvals are basically backdoors left for hackers.
One more thing that many people ignore: don’t click any “airdrop” links in groups; don’t save screenshots of your seed phrase to your photo album; and don’t trust customer service from private chats.
In a bull market, there are many opportunities to make money—but your principal only has one life. Once it’s gone, it’s really gone.
These two weeks, security incidents have piled up—your account may be riskier than you think
Recently, several security incidents have happened one after another in the circle. Someone’s account was stolen; even after it was frozen, the API was not removed, and 340,000 USDT was transferred out anyway. There were also cases on public chains where, due to a gateway vulnerability, extra tokens were minted—leading to a direct restart.
My biggest takeaway after reading everything is: most people lose money not because of the market, but because of poor security habits.
Here are a few solid, actionable recommendations—you can finish them in ten minutes.
First: minimize API permissions. For quant and copy-trading tools, enable only read and trade permissions. Never enable withdrawal permissions. You must bind an IP whitelist. If you don’t need it, delete it immediately. That 340,000 USDT case happened because of the API.
Second: enable the withdrawal whitelist. Allow withdrawals only to the few addresses you commonly use. Even if the account gets logged into, the money can’t be transferred out.
Third: set an anti-phishing code. Official emails you receive in the future will include this code. If there’s no code, treat it as a scam.
Fourth: if you can use a passkey, don’t rely only on SMS verification. Every year there are cases of phone numbers being hijacked.
Fifth: for large assets that you won’t move for a long time, store them in a cold wallet. Periodically revoke on-chain authorizations. Messy contract approvals are basically backdoors left for hackers.
One more thing that many people ignore: don’t click any “airdrop” links in groups; don’t save screenshots of your seed phrase to your photo album; and don’t trust customer service from private chats.
In a bull market, there are many opportunities to make money—but your principal only has one life. Once it’s gone, it’s really gone.
Recently, several security incidents have happened one after another in the circle. Someone’s account was stolen; even after it was frozen, the API was not removed, and 340,000 USDT was transferred out anyway. There were also cases on public chains where, due to a gateway vulnerability, extra tokens were minted—leading to a direct restart.
My biggest takeaway after reading everything is: most people lose money not because of the market, but because of poor security habits.
Here are a few solid, actionable recommendations—you can finish them in ten minutes.
First: minimize API permissions. For quant and copy-trading tools, enable only read and trade permissions. Never enable withdrawal permissions. You must bind an IP whitelist. If you don’t need it, delete it immediately. That 340,000 USDT case happened because of the API.
Second: enable the withdrawal whitelist. Allow withdrawals only to the few addresses you commonly use. Even if the account gets logged into, the money can’t be transferred out.
Third: set an anti-phishing code. Official emails you receive in the future will include this code. If there’s no code, treat it as a scam.
Fourth: if you can use a passkey, don’t rely only on SMS verification. Every year there are cases of phone numbers being hijacked.
Fifth: for large assets that you won’t move for a long time, store them in a cold wallet. Periodically revoke on-chain authorizations. Messy contract approvals are basically backdoors left for hackers.
One more thing that many people ignore: don’t click any “airdrop” links in groups; don’t save screenshots of your seed phrase to your photo album; and don’t trust customer service from private chats.
In a bull market, there are many opportunities to make money—but your principal only has one life. Once it’s gone, it’s really gone.
2
418
·
--
If banks begin accepting Bitcoin, the ceiling on the crypto market could be reopened
Bitcoin’s biggest change may not be price growth, but that it is gradually moving into the core business of traditional finance
Recently, the market has been discussing another direction: whether banks will include Bitcoin in their custody systems and allow customers to use Bitcoin for collateralized borrowing
This topic is worth paying attention to because it changes not just the price over a day or two, but the way Bitcoin is used
In the past, many institutions bought Bitcoin and then the asset simply sat in their accounts. To obtain liquidity, they had to sell part of their holdings. But once Bitcoin can enter a bank custody system and be used as collateral to get loans, holders wouldn’t need to sell assets frequently
This leads to a very direct result
Bitcoin’s role as a holding could gradually shift from being merely an investment asset to becoming a form of financial collateral
Real estate can be pledged, stocks can be pledged, and gold can be pledged. If Bitcoin can also enter this system in the future, its financial attributes would be further strengthened
At present, Bitcoin is still hovering around $84,000, and the market is still some distance away from full-blown euphoria. But institutions’ attitudes toward it are already completely different from a few years ago
Previously, when many traditional financial institutions talked about Bitcoin, their first reaction was risk and regulation. Now, the questions being discussed are about how to custody it, how to price it, how to lend against it, and how to control risk
That is the most important change
Of course, a bank accepting Bitcoin doesn’t mean Bitcoin will only rise and never fall. The greater the price volatility of the collateral, the higher the risk-control requirements. Once the market drops rapidly, liquidation pressure could further amplify volatility
So investors need to see clearly
Bitcoin entering the banking system is a long-term positive, but in the short term it will still be affected by interest rates, liquidity, and market sentiment
If, in the future, more and more banks allow Bitcoin to be custodied, pledged, and borrowed against, then Bitcoin’s pool of capital will no longer be just a small portion of the crypto market
It will face a much larger financial world
If banks begin accepting Bitcoin, the ceiling on the crypto market could be reopened
Bitcoin’s biggest change may not be price growth, but that it is gradually moving into the core business of traditional finance
Recently, the market has been discussing another direction: whether banks will include Bitcoin in their custody systems and allow customers to use Bitcoin for collateralized borrowing
This topic is worth paying attention to because it changes not just the price over a day or two, but the way Bitcoin is used
In the past, many institutions bought Bitcoin and then the asset simply sat in their accounts. To obtain liquidity, they had to sell part of their holdings. But once Bitcoin can enter a bank custody system and be used as collateral to get loans, holders wouldn’t need to sell assets frequently
This leads to a very direct result
Bitcoin’s role as a holding could gradually shift from being merely an investment asset to becoming a form of financial collateral
Real estate can be pledged, stocks can be pledged, and gold can be pledged. If Bitcoin can also enter this system in the future, its financial attributes would be further strengthened
At present, Bitcoin is still hovering around $84,000, and the market is still some distance away from full-blown euphoria. But institutions’ attitudes toward it are already completely different from a few years ago
Previously, when many traditional financial institutions talked about Bitcoin, their first reaction was risk and regulation. Now, the questions being discussed are about how to custody it, how to price it, how to lend against it, and how to control risk
That is the most important change
Of course, a bank accepting Bitcoin doesn’t mean Bitcoin will only rise and never fall. The greater the price volatility of the collateral, the higher the risk-control requirements. Once the market drops rapidly, liquidation pressure could further amplify volatility
So investors need to see clearly
Bitcoin entering the banking system is a long-term positive, but in the short term it will still be affected by interest rates, liquidity, and market sentiment
If, in the future, more and more banks allow Bitcoin to be custodied, pledged, and borrowed against, then Bitcoin’s pool of capital will no longer be just a small portion of the crypto market
It will face a much larger financial world
Bitcoin’s biggest change may not be price growth, but that it is gradually moving into the core business of traditional finance
Recently, the market has been discussing another direction: whether banks will include Bitcoin in their custody systems and allow customers to use Bitcoin for collateralized borrowing
This topic is worth paying attention to because it changes not just the price over a day or two, but the way Bitcoin is used
In the past, many institutions bought Bitcoin and then the asset simply sat in their accounts. To obtain liquidity, they had to sell part of their holdings. But once Bitcoin can enter a bank custody system and be used as collateral to get loans, holders wouldn’t need to sell assets frequently
This leads to a very direct result
Bitcoin’s role as a holding could gradually shift from being merely an investment asset to becoming a form of financial collateral
Real estate can be pledged, stocks can be pledged, and gold can be pledged. If Bitcoin can also enter this system in the future, its financial attributes would be further strengthened
At present, Bitcoin is still hovering around $84,000, and the market is still some distance away from full-blown euphoria. But institutions’ attitudes toward it are already completely different from a few years ago
Previously, when many traditional financial institutions talked about Bitcoin, their first reaction was risk and regulation. Now, the questions being discussed are about how to custody it, how to price it, how to lend against it, and how to control risk
That is the most important change
Of course, a bank accepting Bitcoin doesn’t mean Bitcoin will only rise and never fall. The greater the price volatility of the collateral, the higher the risk-control requirements. Once the market drops rapidly, liquidation pressure could further amplify volatility
So investors need to see clearly
Bitcoin entering the banking system is a long-term positive, but in the short term it will still be affected by interest rates, liquidity, and market sentiment
If, in the future, more and more banks allow Bitcoin to be custodied, pledged, and borrowed against, then Bitcoin’s pool of capital will no longer be just a small portion of the crypto market
It will face a much larger financial world
3
321
·
--
🎙️ Let’s chat about crypto myths—have the “greenhorns’ roots” survived lately?🤣
End
01 h 01 m 08 s
531
NAS
Holding
0
3
2


·
--
Bitcoin touched 87,000 and then got pushed back down. This week, the real thing to watch is just one candlestick
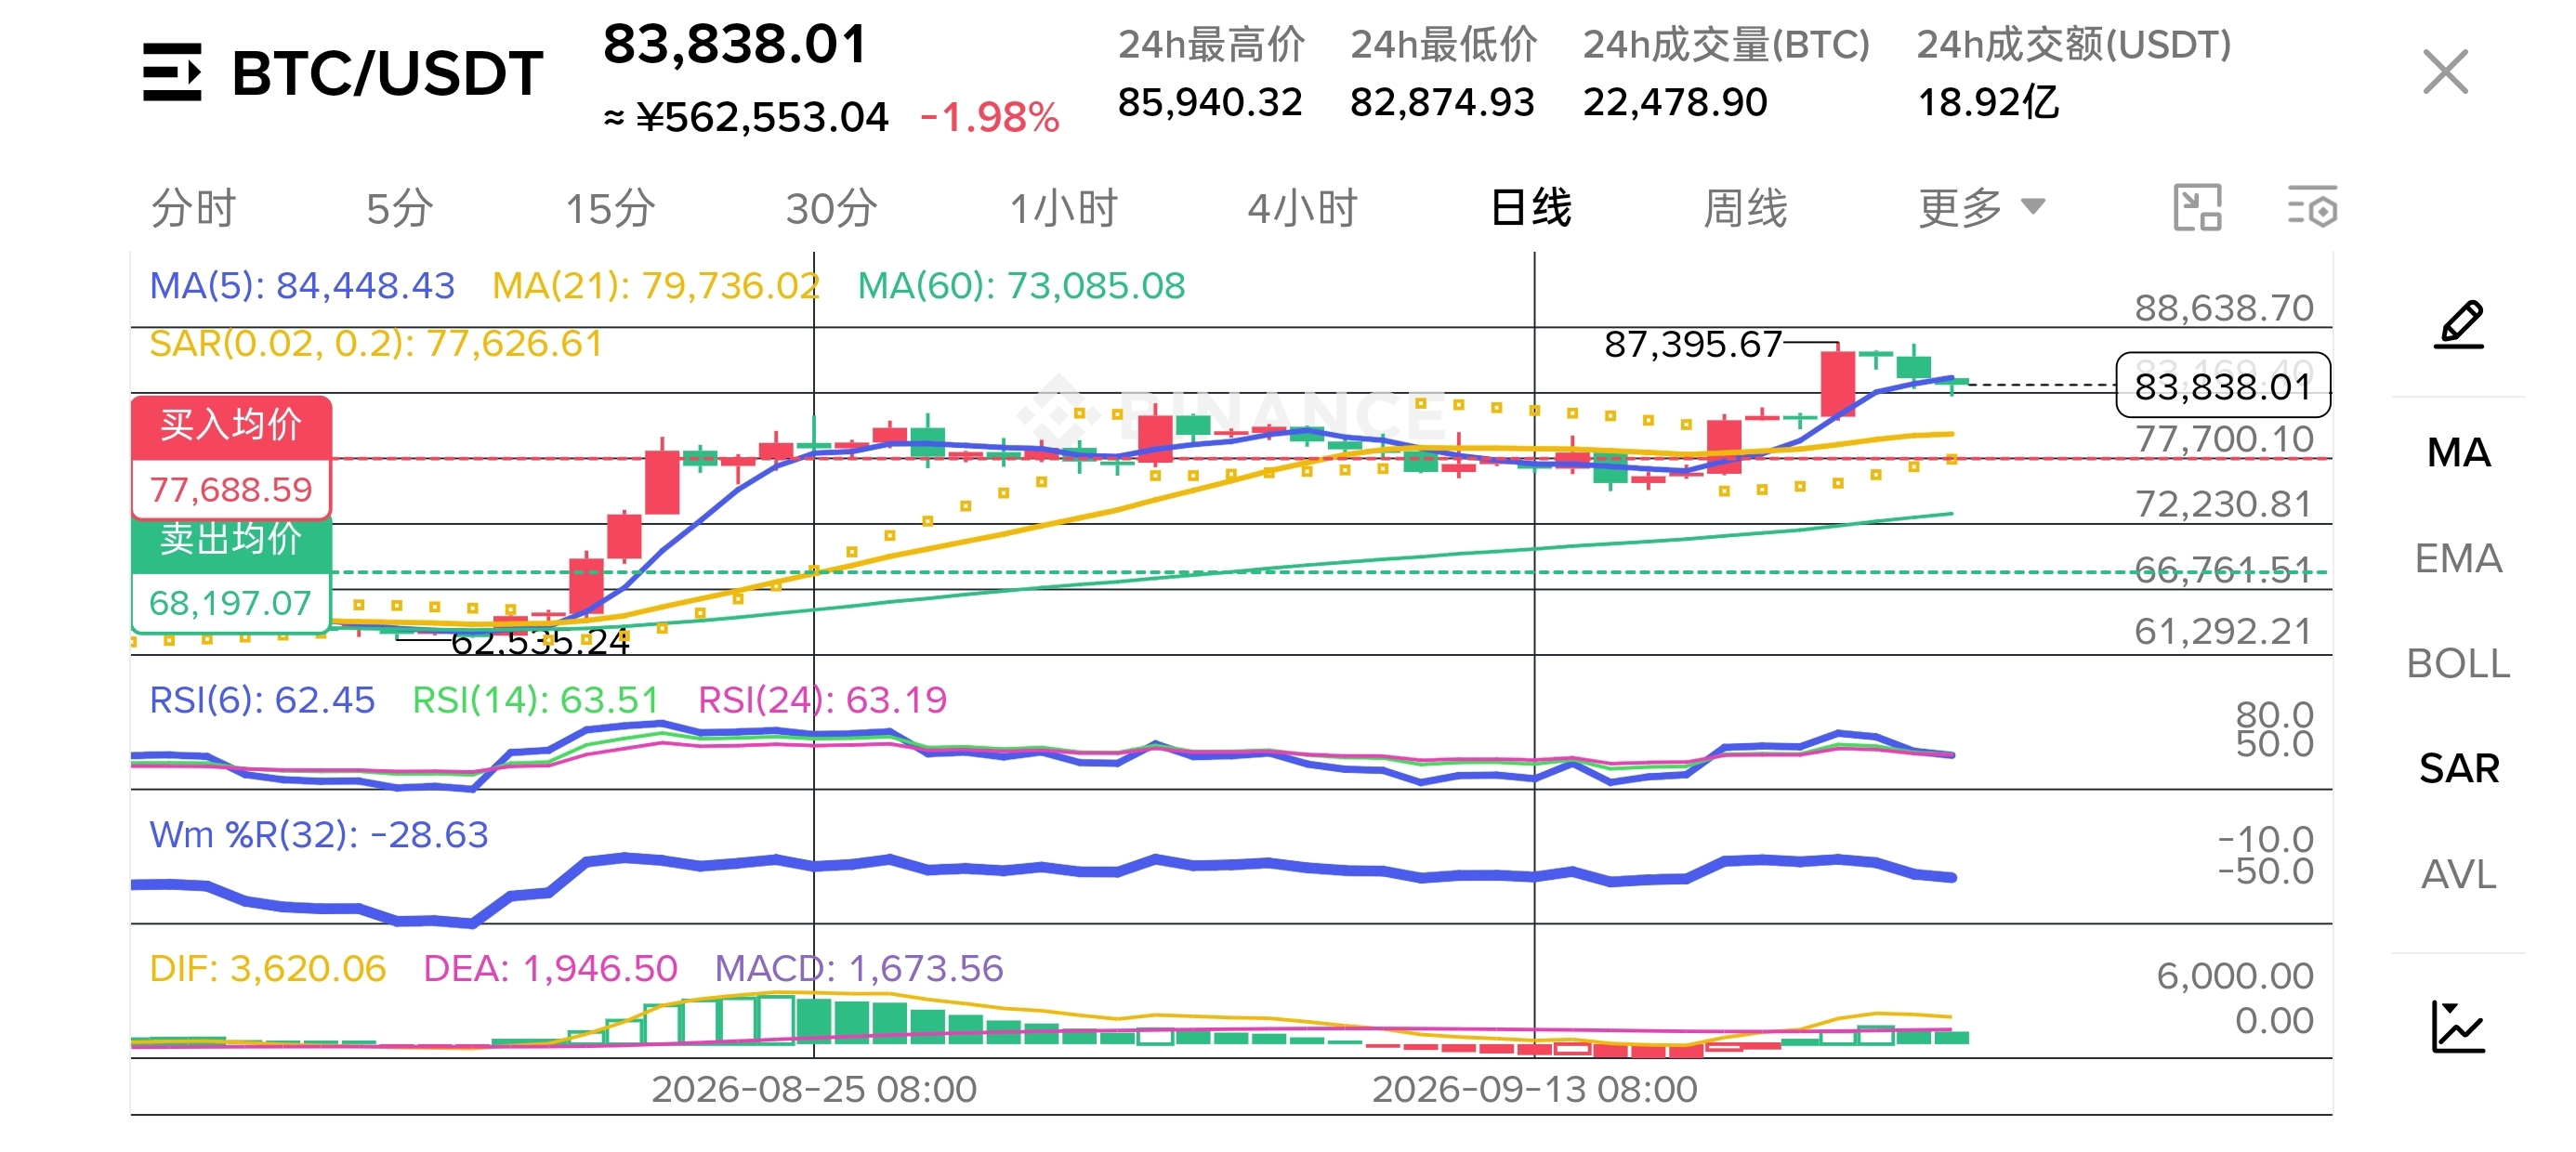
Brothers, have you been watching the chart these past couple of days? $BTC surged all the way to around 87,000, hitting the highest level since January this year. Then it was slammed back to 84,500. In the comments, everyone started getting panicky again. Let me say something practical:
First, look at where the money came from. The engine driving this rally is spot ETF inflows. On Monday, net inflows were nearly $1 billion. Tuesday: $710 million. Wednesday: $350 million. By Thursday, it was down to just $28 million. See the issue? The money is still coming in—but day by day, it’s coming in less. That’s the real reason the price can’t keep rising. It has nothing to do with some bearish “headline.”
Next, look at the derivatives. As the price moves up, leverage gets stacked higher as well. The fear/greed index jumped to around 79 a few days ago—already extremely greedy. Now it has pulled back to 73, but sentiment is still hot. The liquidation map is also interesting. If price breaks above 88,267, roughly $1.4 billion in short positions could get squeezed. If it drops below 80,259, there are also over $1.3 billion in long positions waiting to be harvested. The bullets on both sides are pretty even—who breaks first gets the fuel.
One more detail many people missed: institutional estimates put mining costs around 85,000. The coin price has stayed below that level for a full 280 days. Miners have basically been forced to sell the whole time. As long as it can hold above 85,000, that selling pressure from miners should noticeably ease.
So my plan is simple: for the weekly chart, a close above 82,500 is what counts as confirmation. The next stop would be 88,000 to 90,000. If the weekly close can’t hold, then a pullback toward around 80,000 to find support is completely normal.
Don’t chase with a full position at this level. And don’t cut just because of one dip. This week, just focus on this one weekly candle.
Bitcoin touched 87,000 and then got pushed back down. This week, the real thing to watch is just one candlestick
Brothers, have you been watching the chart these past couple of days? $BTC surged all the way to around 87,000, hitting the highest level since January this year. Then it was slammed back to 84,500. In the comments, everyone started getting panicky again. Let me say something practical:
First, look at where the money came from. The engine driving this rally is spot ETF inflows. On Monday, net inflows were nearly $1 billion. Tuesday: $710 million. Wednesday: $350 million. By Thursday, it was down to just $28 million. See the issue? The money is still coming in—but day by day, it’s coming in less. That’s the real reason the price can’t keep rising. It has nothing to do with some bearish “headline.”
Next, look at the derivatives. As the price moves up, leverage gets stacked higher as well. The fear/greed index jumped to around 79 a few days ago—already extremely greedy. Now it has pulled back to 73, but sentiment is still hot. The liquidation map is also interesting. If price breaks above 88,267, roughly $1.4 billion in short positions could get squeezed. If it drops below 80,259, there are also over $1.3 billion in long positions waiting to be harvested. The bullets on both sides are pretty even—who breaks first gets the fuel.
One more detail many people missed: institutional estimates put mining costs around 85,000. The coin price has stayed below that level for a full 280 days. Miners have basically been forced to sell the whole time. As long as it can hold above 85,000, that selling pressure from miners should noticeably ease.
So my plan is simple: for the weekly chart, a close above 82,500 is what counts as confirmation. The next stop would be 88,000 to 90,000. If the weekly close can’t hold, then a pullback toward around 80,000 to find support is completely normal.
Don’t chase with a full position at this level. And don’t cut just because of one dip. This week, just focus on this one weekly candle.
Brothers, have you been watching the chart these past couple of days? $BTC surged all the way to around 87,000, hitting the highest level since January this year. Then it was slammed back to 84,500. In the comments, everyone started getting panicky again. Let me say something practical:
First, look at where the money came from. The engine driving this rally is spot ETF inflows. On Monday, net inflows were nearly $1 billion. Tuesday: $710 million. Wednesday: $350 million. By Thursday, it was down to just $28 million. See the issue? The money is still coming in—but day by day, it’s coming in less. That’s the real reason the price can’t keep rising. It has nothing to do with some bearish “headline.”
Next, look at the derivatives. As the price moves up, leverage gets stacked higher as well. The fear/greed index jumped to around 79 a few days ago—already extremely greedy. Now it has pulled back to 73, but sentiment is still hot. The liquidation map is also interesting. If price breaks above 88,267, roughly $1.4 billion in short positions could get squeezed. If it drops below 80,259, there are also over $1.3 billion in long positions waiting to be harvested. The bullets on both sides are pretty even—who breaks first gets the fuel.
One more detail many people missed: institutional estimates put mining costs around 85,000. The coin price has stayed below that level for a full 280 days. Miners have basically been forced to sell the whole time. As long as it can hold above 85,000, that selling pressure from miners should noticeably ease.
So my plan is simple: for the weekly chart, a close above 82,500 is what counts as confirmation. The next stop would be 88,000 to 90,000. If the weekly close can’t hold, then a pullback toward around 80,000 to find support is completely normal.
Don’t chase with a full position at this level. And don’t cut just because of one dip. This week, just focus on this one weekly candle.
5
335
·
--
🎙️ Friends in the circle, come and chat about that best entry. Everyone is welcome to chat freely.
End
02 h 03 m 14 s
748

BNB
Holding
+334.89
4
1
·
--
Ethereum whale suddenly sells 42,000 ETH — how should we view the resulting selling pressure?
Today, Ethereum saw a very interesting large-scale capital movement.
A previously persistent institutional address that had been continuously buying Ethereum transferred out approximately 42,000 ETH via an over-the-counter channel. At the current price, this is worth more than $110 million. This position makes up about 80% of its holdings. On paper, the realized profit is over $21 million.
After the news broke, many people started to worry whether Ethereum is about to enter another round of major declines.
My view is that this is indeed somewhat bearish, but it shouldn’t be interpreted simply as the whale completely turning bearish on Ethereum.
Because the average buy-in cost for this capital was around $2,161, and the current Ethereum price is still hovering around $2,680. For a position of such a large size, taking partial profits is a very normal risk-management behavior.
What truly needs attention is whether there will be subsequent continuous large transfers and inflows into exchanges.
If it’s only a one-time realization of gains, it looks more like capital rebalancing or taking profits in stages. But if large amounts of ETH continue to be transferred into the market afterward, that would suggest this large holder is actively reducing its risk exposure.
The issue Ethereum faces right now isn’t that there’s no capital attention. Instead, the market is becoming increasingly demanding about its ability to capture value—network activity, capital inflows, and ecosystem growth. Whether those factors can ultimately transmit to ETH itself is the key to determining whether the market move can extend further.
In the short term, around $2,600 is the level that the bulls need to hold.
If this area holds, this whale’s selling could actually be digested by the market. If it breaks, then the market may interpret the large sale as a signal of a broader trend.
So don’t jump to conclusions just because of a single whale transaction. First, look at how much it actually sold; then see whether the market can absorb it. More importantly, check whether there’s a second follow-up transaction.
Ethereum whale suddenly sells 42,000 ETH — how should we view the resulting selling pressure?
Today, Ethereum saw a very interesting large-scale capital movement.
A previously persistent institutional address that had been continuously buying Ethereum transferred out approximately 42,000 ETH via an over-the-counter channel. At the current price, this is worth more than $110 million. This position makes up about 80% of its holdings. On paper, the realized profit is over $21 million.
After the news broke, many people started to worry whether Ethereum is about to enter another round of major declines.
My view is that this is indeed somewhat bearish, but it shouldn’t be interpreted simply as the whale completely turning bearish on Ethereum.
Because the average buy-in cost for this capital was around $2,161, and the current Ethereum price is still hovering around $2,680. For a position of such a large size, taking partial profits is a very normal risk-management behavior.
What truly needs attention is whether there will be subsequent continuous large transfers and inflows into exchanges.
If it’s only a one-time realization of gains, it looks more like capital rebalancing or taking profits in stages. But if large amounts of ETH continue to be transferred into the market afterward, that would suggest this large holder is actively reducing its risk exposure.
The issue Ethereum faces right now isn’t that there’s no capital attention. Instead, the market is becoming increasingly demanding about its ability to capture value—network activity, capital inflows, and ecosystem growth. Whether those factors can ultimately transmit to ETH itself is the key to determining whether the market move can extend further.
In the short term, around $2,600 is the level that the bulls need to hold.
If this area holds, this whale’s selling could actually be digested by the market. If it breaks, then the market may interpret the large sale as a signal of a broader trend.
So don’t jump to conclusions just because of a single whale transaction. First, look at how much it actually sold; then see whether the market can absorb it. More importantly, check whether there’s a second follow-up transaction.
Today, Ethereum saw a very interesting large-scale capital movement.
A previously persistent institutional address that had been continuously buying Ethereum transferred out approximately 42,000 ETH via an over-the-counter channel. At the current price, this is worth more than $110 million. This position makes up about 80% of its holdings. On paper, the realized profit is over $21 million.
After the news broke, many people started to worry whether Ethereum is about to enter another round of major declines.
My view is that this is indeed somewhat bearish, but it shouldn’t be interpreted simply as the whale completely turning bearish on Ethereum.
Because the average buy-in cost for this capital was around $2,161, and the current Ethereum price is still hovering around $2,680. For a position of such a large size, taking partial profits is a very normal risk-management behavior.
What truly needs attention is whether there will be subsequent continuous large transfers and inflows into exchanges.
If it’s only a one-time realization of gains, it looks more like capital rebalancing or taking profits in stages. But if large amounts of ETH continue to be transferred into the market afterward, that would suggest this large holder is actively reducing its risk exposure.
The issue Ethereum faces right now isn’t that there’s no capital attention. Instead, the market is becoming increasingly demanding about its ability to capture value—network activity, capital inflows, and ecosystem growth. Whether those factors can ultimately transmit to ETH itself is the key to determining whether the market move can extend further.
In the short term, around $2,600 is the level that the bulls need to hold.
If this area holds, this whale’s selling could actually be digested by the market. If it breaks, then the market may interpret the large sale as a signal of a broader trend.
So don’t jump to conclusions just because of a single whale transaction. First, look at how much it actually sold; then see whether the market can absorb it. More importantly, check whether there’s a second follow-up transaction.
4
436
·
--
Bullish
Partly True
ETH hasn’t exploded, but that doesn’t mean it has no story.
Today, ETH is around $2,751. The 24-hour move is only +0.17%.
Compared with BTC and SOL, ETH’s price action is clearly much calmer.
Many people see that ETH hasn’t risen much and start to doubt whether it has already lost market attention.
I think that conclusion is a bit too hasty.
The problem with ETH is never that there’s no ecosystem—it’s that the ecosystem is too big and there’s too much narrative. In the short term, it’s hard to completely ignite the price with just one piece of news.
A direction worth paying attention to recently is the audit-support program rolled out by the Ethereum Foundation.
The core purpose is very simple: help developers reduce the cost of smart-contract security audits and raise the overall security standards across the ecosystem.
This won’t have a pump effect, and it may even look unexciting. But it’s extremely important for long-term building.
Because the market is no longer only focused on who trades faster or who charges lower fees.
Capital is increasingly paying attention to whether protocols are secure, can run stably, and whether there are real users and real revenue.
In addition, ETHGlobal’s Pragma Tokyo event will also take place on September 24, focusing on developers, ecosystem expansion, the Asian market, and the L2 network roadmap.
Such an event may not immediately translate into price gains, but it could bring new partnership opportunities and application expectations.
The key for ETH now isn’t how much it moves in a single day, but whether it can restore the market’s perception of its value capture ability.
If ETH can hold above $2,700 and gradually break through $2,800, short-term sentiment has a good chance to recover.
But if it continues to underperform BTC and SOL, capital rotation will keep going.
So ETH isn’t without opportunity—it just needs more than a slogan. It needs ongoing ecosystem progress and clearer evidence of value flowing back.
ETH hasn’t exploded, but that doesn’t mean it has no story.
Today, ETH is around $2,751. The 24-hour move is only +0.17%.
Compared with BTC and SOL, ETH’s price action is clearly much calmer.
Many people see that ETH hasn’t risen much and start to doubt whether it has already lost market attention.
I think that conclusion is a bit too hasty.
The problem with ETH is never that there’s no ecosystem—it’s that the ecosystem is too big and there’s too much narrative. In the short term, it’s hard to completely ignite the price with just one piece of news.
A direction worth paying attention to recently is the audit-support program rolled out by the Ethereum Foundation.
The core purpose is very simple: help developers reduce the cost of smart-contract security audits and raise the overall security standards across the ecosystem.
This won’t have a pump effect, and it may even look unexciting. But it’s extremely important for long-term building.
Because the market is no longer only focused on who trades faster or who charges lower fees.
Capital is increasingly paying attention to whether protocols are secure, can run stably, and whether there are real users and real revenue.
In addition, ETHGlobal’s Pragma Tokyo event will also take place on September 24, focusing on developers, ecosystem expansion, the Asian market, and the L2 network roadmap.
Such an event may not immediately translate into price gains, but it could bring new partnership opportunities and application expectations.
The key for ETH now isn’t how much it moves in a single day, but whether it can restore the market’s perception of its value capture ability.
If ETH can hold above $2,700 and gradually break through $2,800, short-term sentiment has a good chance to recover.
But if it continues to underperform BTC and SOL, capital rotation will keep going.
So ETH isn’t without opportunity—it just needs more than a slogan. It needs ongoing ecosystem progress and clearer evidence of value flowing back.
Today, ETH is around $2,751. The 24-hour move is only +0.17%.
Compared with BTC and SOL, ETH’s price action is clearly much calmer.
Many people see that ETH hasn’t risen much and start to doubt whether it has already lost market attention.
I think that conclusion is a bit too hasty.
The problem with ETH is never that there’s no ecosystem—it’s that the ecosystem is too big and there’s too much narrative. In the short term, it’s hard to completely ignite the price with just one piece of news.
A direction worth paying attention to recently is the audit-support program rolled out by the Ethereum Foundation.
The core purpose is very simple: help developers reduce the cost of smart-contract security audits and raise the overall security standards across the ecosystem.
This won’t have a pump effect, and it may even look unexciting. But it’s extremely important for long-term building.
Because the market is no longer only focused on who trades faster or who charges lower fees.
Capital is increasingly paying attention to whether protocols are secure, can run stably, and whether there are real users and real revenue.
In addition, ETHGlobal’s Pragma Tokyo event will also take place on September 24, focusing on developers, ecosystem expansion, the Asian market, and the L2 network roadmap.
Such an event may not immediately translate into price gains, but it could bring new partnership opportunities and application expectations.
The key for ETH now isn’t how much it moves in a single day, but whether it can restore the market’s perception of its value capture ability.
If ETH can hold above $2,700 and gradually break through $2,800, short-term sentiment has a good chance to recover.
But if it continues to underperform BTC and SOL, capital rotation will keep going.
So ETH isn’t without opportunity—it just needs more than a slogan. It needs ongoing ecosystem progress and clearer evidence of value flowing back.
5
648
·
--
Bullish
Fear and Greed Index: 79 — Extreme Greed. In my case, when I see this reading, I generally reduce positions rather than add.
Let me show everyone a very plain set of numbers:
On September 16, Fear and Greed was 52 (Neutral) — BTC 75,560.
On September 18, Fear and Greed was 57 — BTC 76,385.
On September 21, Fear and Greed was 71 — BTC 81,741.
On September 22, Fear and Greed was 79 (Extreme Greed) — BTC 86,429.
In six days, sentiment went from Neutral straight to Extreme Greed, and the price rose 14%.
I’ve seen this kind of slope a lot. The sentiment indicator isn’t a buy/sell signal, but it is a position-management signal.
The meaning of a reading of 79 isn’t “it’s about to drop,” but rather “people entering right now have very low tolerance.”
Why is tolerance low? Because at high levels, sentiment often coincides with three things at the same time: leverage is maxed out, retail traders step in as buyers, and the news flow is entirely positive. Today, all three arrive, without missing a beat.
On the derivatives side, the market just added $2.0 billion in leverage. In the last 24 hours, the entire network’s futures open interest for ETH rose 6.59% to $36.75 billion.
On social media, it has changed from last week’s despair to full screens of “targeting 100,000.”
There’s another detail worth mentioning: Bitcoin’s all-time high was 126,080, which appeared last October. Now it’s a bit above 86,000, leaving still 31% of room before the ATH. So, strictly speaking, this is a recovery after a deep pullback—not a new-high行情 (a new high trend). The trading logic for the two is completely different. In a recovery, what you need to do is take profits in batches. In a new-high trend, you can hold.
Some analysts say this move still has another 2 to 4 weeks of upside, after which it will enter an overbought zone that needs to cool off. I basically agree with that view—but pay attention: the second half is the real point.
When it’s Extreme Greed, I never ask “how much more can it go up?” I only ask one thing: if tomorrow it drops straight back to 80,000, can my position withstand it?
If you can, hold it. If you can’t, sell a bit first. That’s it—simple.
Fear and Greed Index: 79 — Extreme Greed. In my case, when I see this reading, I generally reduce positions rather than add.
Let me show everyone a very plain set of numbers:
On September 16, Fear and Greed was 52 (Neutral) — BTC 75,560.
On September 18, Fear and Greed was 57 — BTC 76,385.
On September 21, Fear and Greed was 71 — BTC 81,741.
On September 22, Fear and Greed was 79 (Extreme Greed) — BTC 86,429.
In six days, sentiment went from Neutral straight to Extreme Greed, and the price rose 14%.
I’ve seen this kind of slope a lot. The sentiment indicator isn’t a buy/sell signal, but it is a position-management signal.
The meaning of a reading of 79 isn’t “it’s about to drop,” but rather “people entering right now have very low tolerance.”
Why is tolerance low? Because at high levels, sentiment often coincides with three things at the same time: leverage is maxed out, retail traders step in as buyers, and the news flow is entirely positive. Today, all three arrive, without missing a beat.
On the derivatives side, the market just added $2.0 billion in leverage. In the last 24 hours, the entire network’s futures open interest for ETH rose 6.59% to $36.75 billion.
On social media, it has changed from last week’s despair to full screens of “targeting 100,000.”
There’s another detail worth mentioning: Bitcoin’s all-time high was 126,080, which appeared last October. Now it’s a bit above 86,000, leaving still 31% of room before the ATH. So, strictly speaking, this is a recovery after a deep pullback—not a new-high行情 (a new high trend). The trading logic for the two is completely different. In a recovery, what you need to do is take profits in batches. In a new-high trend, you can hold.
Some analysts say this move still has another 2 to 4 weeks of upside, after which it will enter an overbought zone that needs to cool off. I basically agree with that view—but pay attention: the second half is the real point.
When it’s Extreme Greed, I never ask “how much more can it go up?” I only ask one thing: if tomorrow it drops straight back to 80,000, can my position withstand it?
If you can, hold it. If you can’t, sell a bit first. That’s it—simple.
Let me show everyone a very plain set of numbers:
On September 16, Fear and Greed was 52 (Neutral) — BTC 75,560.
On September 18, Fear and Greed was 57 — BTC 76,385.
On September 21, Fear and Greed was 71 — BTC 81,741.
On September 22, Fear and Greed was 79 (Extreme Greed) — BTC 86,429.
In six days, sentiment went from Neutral straight to Extreme Greed, and the price rose 14%.
I’ve seen this kind of slope a lot. The sentiment indicator isn’t a buy/sell signal, but it is a position-management signal.
The meaning of a reading of 79 isn’t “it’s about to drop,” but rather “people entering right now have very low tolerance.”
Why is tolerance low? Because at high levels, sentiment often coincides with three things at the same time: leverage is maxed out, retail traders step in as buyers, and the news flow is entirely positive. Today, all three arrive, without missing a beat.
On the derivatives side, the market just added $2.0 billion in leverage. In the last 24 hours, the entire network’s futures open interest for ETH rose 6.59% to $36.75 billion.
On social media, it has changed from last week’s despair to full screens of “targeting 100,000.”
There’s another detail worth mentioning: Bitcoin’s all-time high was 126,080, which appeared last October. Now it’s a bit above 86,000, leaving still 31% of room before the ATH. So, strictly speaking, this is a recovery after a deep pullback—not a new-high行情 (a new high trend). The trading logic for the two is completely different. In a recovery, what you need to do is take profits in batches. In a new-high trend, you can hold.
Some analysts say this move still has another 2 to 4 weeks of upside, after which it will enter an overbought zone that needs to cool off. I basically agree with that view—but pay attention: the second half is the real point.
When it’s Extreme Greed, I never ask “how much more can it go up?” I only ask one thing: if tomorrow it drops straight back to 80,000, can my position withstand it?
If you can, hold it. If you can’t, sell a bit first. That’s it—simple.
6
593
·
--
It’s not that the imitation-season is here—it’s that capital has started picking which coins to buy
What’s most worth noting in today’s market isn’t how much Bitcoin has risen again, but rather how altcoins are beginning to show clear differentiation
As of September 21st, Bitcoin is trading around $81,268, up about 1% over the past 24 hours. Ethereum is up more than 3%, and SOL also remains upward
What’s really eye-catching is NEAR, up more than 22% in 24 hours. INJ is also up more than 22%. ENA is up more than 10%. Even established majors like ARB, UNI, and AVAX have shown clear rebounds
This indicates that risk appetite is indeed recovering
However, I’m not willing to call a full-blown altseason just yet. The reason is simple: the current rise is not a broad-based rally across the whole market—it's capital concentrating its attacks on a few directions with stories, expectations, and catalysts
NEAR represents the AI and chain abstraction narrative. INJ has expectations for an RWA upgrade. ENA’s backdrop is stablecoins and yield trading. ARB and UNI fall under valuation repair within the Ethereum ecosystem
This kind of market is easiest to create a false sense of security
The illusion is: as long as you buy an altcoin, you can make money
In reality, it’s more like large players are doing sector rotation—today it’s AI, tomorrow it might shift to RWA, and the day after that it could swing back to the Ethereum ecosystem
If a coin lacks real catalysts and lacks trading volume to support it, even if it’s in a popular track, it may only be carried up for an hour
Right now I’m watching two signals more closely
First: can the rally expand from a few popular coins to more mainstream names?
Second: after a volume-backed rise, can it hold key levels?
If only a handful of coins pump in the short term, but market breadth doesn’t keep widening, then it’s more like a sentiment-driven move
A true altseason is when capital keeps flowing in, sector rotation accelerates, and the leaders don’t easily fall back to where they started
You can be optimistic now, but don’t get carried away
The market is starting to heat up—but the phase where real money is made is often not after you see the gains and chase in. It’s before that, when you can already understand where the money is moving
It’s not that the imitation-season is here—it’s that capital has started picking which coins to buy
What’s most worth noting in today’s market isn’t how much Bitcoin has risen again, but rather how altcoins are beginning to show clear differentiation
As of September 21st, Bitcoin is trading around $81,268, up about 1% over the past 24 hours. Ethereum is up more than 3%, and SOL also remains upward
What’s really eye-catching is NEAR, up more than 22% in 24 hours. INJ is also up more than 22%. ENA is up more than 10%. Even established majors like ARB, UNI, and AVAX have shown clear rebounds
This indicates that risk appetite is indeed recovering
However, I’m not willing to call a full-blown altseason just yet. The reason is simple: the current rise is not a broad-based rally across the whole market—it's capital concentrating its attacks on a few directions with stories, expectations, and catalysts
NEAR represents the AI and chain abstraction narrative. INJ has expectations for an RWA upgrade. ENA’s backdrop is stablecoins and yield trading. ARB and UNI fall under valuation repair within the Ethereum ecosystem
This kind of market is easiest to create a false sense of security
The illusion is: as long as you buy an altcoin, you can make money
In reality, it’s more like large players are doing sector rotation—today it’s AI, tomorrow it might shift to RWA, and the day after that it could swing back to the Ethereum ecosystem
If a coin lacks real catalysts and lacks trading volume to support it, even if it’s in a popular track, it may only be carried up for an hour
Right now I’m watching two signals more closely
First: can the rally expand from a few popular coins to more mainstream names?
Second: after a volume-backed rise, can it hold key levels?
If only a handful of coins pump in the short term, but market breadth doesn’t keep widening, then it’s more like a sentiment-driven move
A true altseason is when capital keeps flowing in, sector rotation accelerates, and the leaders don’t easily fall back to where they started
You can be optimistic now, but don’t get carried away
The market is starting to heat up—but the phase where real money is made is often not after you see the gains and chase in. It’s before that, when you can already understand where the money is moving
What’s most worth noting in today’s market isn’t how much Bitcoin has risen again, but rather how altcoins are beginning to show clear differentiation
As of September 21st, Bitcoin is trading around $81,268, up about 1% over the past 24 hours. Ethereum is up more than 3%, and SOL also remains upward
What’s really eye-catching is NEAR, up more than 22% in 24 hours. INJ is also up more than 22%. ENA is up more than 10%. Even established majors like ARB, UNI, and AVAX have shown clear rebounds
This indicates that risk appetite is indeed recovering
However, I’m not willing to call a full-blown altseason just yet. The reason is simple: the current rise is not a broad-based rally across the whole market—it's capital concentrating its attacks on a few directions with stories, expectations, and catalysts
NEAR represents the AI and chain abstraction narrative. INJ has expectations for an RWA upgrade. ENA’s backdrop is stablecoins and yield trading. ARB and UNI fall under valuation repair within the Ethereum ecosystem
This kind of market is easiest to create a false sense of security
The illusion is: as long as you buy an altcoin, you can make money
In reality, it’s more like large players are doing sector rotation—today it’s AI, tomorrow it might shift to RWA, and the day after that it could swing back to the Ethereum ecosystem
If a coin lacks real catalysts and lacks trading volume to support it, even if it’s in a popular track, it may only be carried up for an hour
Right now I’m watching two signals more closely
First: can the rally expand from a few popular coins to more mainstream names?
Second: after a volume-backed rise, can it hold key levels?
If only a handful of coins pump in the short term, but market breadth doesn’t keep widening, then it’s more like a sentiment-driven move
A true altseason is when capital keeps flowing in, sector rotation accelerates, and the leaders don’t easily fall back to where they started
You can be optimistic now, but don’t get carried away
The market is starting to heat up—but the phase where real money is made is often not after you see the gains and chase in. It’s before that, when you can already understand where the money is moving
3
634
·
--
Partly True
NEAR saw a single-day increase of more than 24%—the AI narrative is finally back
NEAR’s performance today is truly impressive
The price briefly pushed above $3.8, with a 24-hour gain of over 24%, and spot trading volume has also expanded significantly. The core explanation the market gives is that the AI narrative has reignited, along with the expansion of NEAR’s ecosystem applications in privacy computing and artificial intelligence
When the market mentions AI tokens, many people’s first reaction is to chase the hot trend
But what’s interesting about NEAR’s move this time is that it isn’t some suddenly emerging pure-concept project. Based on the day’s market information, the amount of privacy-computing tokens locked in NEAR has already exceeded $70 million, and the number of models covered by AI applications is also growing
Can these data directly support future valuation? Of course, it still needs to be watched further
But at least one thing is clear: the market has started looking again for AI projects with real product directions, not just a single concept image or a few marketing slogans
NEAR’s performance over the past stretch hasn’t been particularly strong, and many holders have already lost patience. When volume suddenly surges and prices rally, it tends to attract two kinds of capital
One is short-term money that chases the move after spotting the trend
The other is trapped funds from earlier that have been waiting to break even
After these two types of capital overlap, the market action often becomes extremely intense
The most critical level for NEAR going forward isn’t how much it’s up today, but whether it can hold the $3.5 to $3.6 zone. If it spikes up and then quickly falls back, this rally will look more like sentiment correction. If, after a pullback, it can still continue to rise on expanding volume, that would suggest the AI narrative may truly be starting to spread into mainstream assets
So NEAR is worth watching, but don’t just focus on the percentage gain
The genuinely valuable market move will ultimately come back to products, users, and capital flows
NEAR saw a single-day increase of more than 24%—the AI narrative is finally back
NEAR’s performance today is truly impressive
The price briefly pushed above $3.8, with a 24-hour gain of over 24%, and spot trading volume has also expanded significantly. The core explanation the market gives is that the AI narrative has reignited, along with the expansion of NEAR’s ecosystem applications in privacy computing and artificial intelligence
When the market mentions AI tokens, many people’s first reaction is to chase the hot trend
But what’s interesting about NEAR’s move this time is that it isn’t some suddenly emerging pure-concept project. Based on the day’s market information, the amount of privacy-computing tokens locked in NEAR has already exceeded $70 million, and the number of models covered by AI applications is also growing
Can these data directly support future valuation? Of course, it still needs to be watched further
But at least one thing is clear: the market has started looking again for AI projects with real product directions, not just a single concept image or a few marketing slogans
NEAR’s performance over the past stretch hasn’t been particularly strong, and many holders have already lost patience. When volume suddenly surges and prices rally, it tends to attract two kinds of capital
One is short-term money that chases the move after spotting the trend
The other is trapped funds from earlier that have been waiting to break even
After these two types of capital overlap, the market action often becomes extremely intense
The most critical level for NEAR going forward isn’t how much it’s up today, but whether it can hold the $3.5 to $3.6 zone. If it spikes up and then quickly falls back, this rally will look more like sentiment correction. If, after a pullback, it can still continue to rise on expanding volume, that would suggest the AI narrative may truly be starting to spread into mainstream assets
So NEAR is worth watching, but don’t just focus on the percentage gain
The genuinely valuable market move will ultimately come back to products, users, and capital flows
NEAR’s performance today is truly impressive
The price briefly pushed above $3.8, with a 24-hour gain of over 24%, and spot trading volume has also expanded significantly. The core explanation the market gives is that the AI narrative has reignited, along with the expansion of NEAR’s ecosystem applications in privacy computing and artificial intelligence
When the market mentions AI tokens, many people’s first reaction is to chase the hot trend
But what’s interesting about NEAR’s move this time is that it isn’t some suddenly emerging pure-concept project. Based on the day’s market information, the amount of privacy-computing tokens locked in NEAR has already exceeded $70 million, and the number of models covered by AI applications is also growing
Can these data directly support future valuation? Of course, it still needs to be watched further
But at least one thing is clear: the market has started looking again for AI projects with real product directions, not just a single concept image or a few marketing slogans
NEAR’s performance over the past stretch hasn’t been particularly strong, and many holders have already lost patience. When volume suddenly surges and prices rally, it tends to attract two kinds of capital
One is short-term money that chases the move after spotting the trend
The other is trapped funds from earlier that have been waiting to break even
After these two types of capital overlap, the market action often becomes extremely intense
The most critical level for NEAR going forward isn’t how much it’s up today, but whether it can hold the $3.5 to $3.6 zone. If it spikes up and then quickly falls back, this rally will look more like sentiment correction. If, after a pullback, it can still continue to rise on expanding volume, that would suggest the AI narrative may truly be starting to spread into mainstream assets
So NEAR is worth watching, but don’t just focus on the percentage gain
The genuinely valuable market move will ultimately come back to products, users, and capital flows
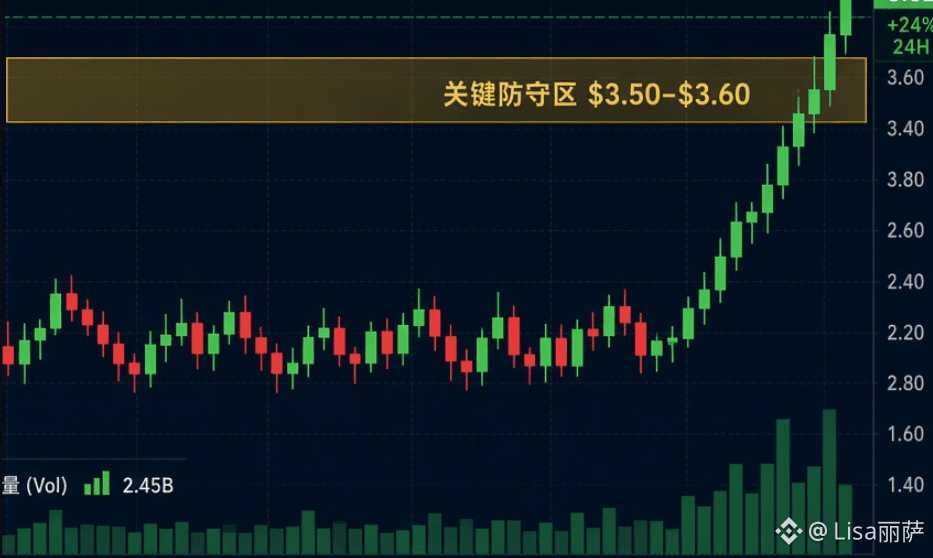
4
663
·
--
The market has risen these past two days. The key positive catalysts and logic (suitable for short-video narration, simplified)
Hey everyone, these past two days, global financial markets have collectively bounced back. The core reason isn’t some sudden, massive “game-changing” good news, but rather: bad news has run its course, rate expectations have started to recover, and market sentiment has warmed up.
First, it’s the U.S. August core CPI data we discussed earlier. Even though the month-on-month figure came in at 0.3%, slightly above expectations, the market interpretation was this: inflation hasn’t worsened further. The case for the Fed’s final rate hike has largely been removed, so market pricing for further hikes is very likely close to done. Once rate-hike expectations peak, yields on the long end of U.S. Treasuries tend to fall, the U.S. dollar weakens, and investors finally feel confident returning to risk assets—supporting stocks, gold, and crypto assets at the same time.
Second, the U.S. Treasury has stepped in to stabilize the bond market by expanding the scale of long-term Treasury repo operations. This move effectively puts a floor under long-dated Treasuries, preventing yields from continuing to spike and ripping through the market. It directly reduces pressure on global financing costs, eases valuation pressure on high-risk assets, and is an important catalyst for this round of rebound.
Third, from a sentiment perspective: earlier, short positions had piled up. Once the market turns, short squeezes get triggered. Large volumes of short funds are forced to buy back to cover, which pushes prices higher and amplifies the upward move. On top of that, U.S. crypto regulation has sent relatively positive signals, further boosting risk appetite and lifting the entire crypto sector.
In China, meanwhile, policies to stabilize the capital markets have continued to roll out. Long-term capital and central SOE buybacks/increased holdings keep providing support. With external conditions improving, foreign capital has started to flow back, helping drive a rebound in A-shares.
⚠️ Reminder: This rebound is driven by expectation repair—not a confirmed trend reversal. Inflation may keep fluctuating, and geopolitical conflicts remain potential risks. Don’t blindly chase higher prices.
#比特币突破8万美元大关 #B丅C #ETH #BNB #SOL
The market has risen these past two days. The key positive catalysts and logic (suitable for short-video narration, simplified)
Hey everyone, these past two days, global financial markets have collectively bounced back. The core reason isn’t some sudden, massive “game-changing” good news, but rather: bad news has run its course, rate expectations have started to recover, and market sentiment has warmed up.
First, it’s the U.S. August core CPI data we discussed earlier. Even though the month-on-month figure came in at 0.3%, slightly above expectations, the market interpretation was this: inflation hasn’t worsened further. The case for the Fed’s final rate hike has largely been removed, so market pricing for further hikes is very likely close to done. Once rate-hike expectations peak, yields on the long end of U.S. Treasuries tend to fall, the U.S. dollar weakens, and investors finally feel confident returning to risk assets—supporting stocks, gold, and crypto assets at the same time.
Second, the U.S. Treasury has stepped in to stabilize the bond market by expanding the scale of long-term Treasury repo operations. This move effectively puts a floor under long-dated Treasuries, preventing yields from continuing to spike and ripping through the market. It directly reduces pressure on global financing costs, eases valuation pressure on high-risk assets, and is an important catalyst for this round of rebound.
Third, from a sentiment perspective: earlier, short positions had piled up. Once the market turns, short squeezes get triggered. Large volumes of short funds are forced to buy back to cover, which pushes prices higher and amplifies the upward move. On top of that, U.S. crypto regulation has sent relatively positive signals, further boosting risk appetite and lifting the entire crypto sector.
In China, meanwhile, policies to stabilize the capital markets have continued to roll out. Long-term capital and central SOE buybacks/increased holdings keep providing support. With external conditions improving, foreign capital has started to flow back, helping drive a rebound in A-shares.
⚠️ Reminder: This rebound is driven by expectation repair—not a confirmed trend reversal. Inflation may keep fluctuating, and geopolitical conflicts remain potential risks. Don’t blindly chase higher prices.
#比特币突破8万美元大关 #B丅C #ETH #BNB #SOL
Hey everyone, these past two days, global financial markets have collectively bounced back. The core reason isn’t some sudden, massive “game-changing” good news, but rather: bad news has run its course, rate expectations have started to recover, and market sentiment has warmed up.
First, it’s the U.S. August core CPI data we discussed earlier. Even though the month-on-month figure came in at 0.3%, slightly above expectations, the market interpretation was this: inflation hasn’t worsened further. The case for the Fed’s final rate hike has largely been removed, so market pricing for further hikes is very likely close to done. Once rate-hike expectations peak, yields on the long end of U.S. Treasuries tend to fall, the U.S. dollar weakens, and investors finally feel confident returning to risk assets—supporting stocks, gold, and crypto assets at the same time.
Second, the U.S. Treasury has stepped in to stabilize the bond market by expanding the scale of long-term Treasury repo operations. This move effectively puts a floor under long-dated Treasuries, preventing yields from continuing to spike and ripping through the market. It directly reduces pressure on global financing costs, eases valuation pressure on high-risk assets, and is an important catalyst for this round of rebound.
Third, from a sentiment perspective: earlier, short positions had piled up. Once the market turns, short squeezes get triggered. Large volumes of short funds are forced to buy back to cover, which pushes prices higher and amplifies the upward move. On top of that, U.S. crypto regulation has sent relatively positive signals, further boosting risk appetite and lifting the entire crypto sector.
In China, meanwhile, policies to stabilize the capital markets have continued to roll out. Long-term capital and central SOE buybacks/increased holdings keep providing support. With external conditions improving, foreign capital has started to flow back, helping drive a rebound in A-shares.
⚠️ Reminder: This rebound is driven by expectation repair—not a confirmed trend reversal. Inflation may keep fluctuating, and geopolitical conflicts remain potential risks. Don’t blindly chase higher prices.
#比特币突破8万美元大关 #B丅C #ETH #BNB #SOL
1
739
Log in to explore more content
Join global crypto users on Binance Square
⚡️ Get latest and useful information about crypto.
💬 Trusted by the world’s largest crypto exchange.
👍 Discover real insights from verified creators.
Email / Phone number
Trending Topics
ZcashETFPostsFirstWeeklyOutflow$93.6M
47,102 views
143 Discussing
#ZcashETFPostsFirstWeeklyOutflow$93.6M
Zcash ETF’s first weekly outflow of $93.6 million signals weakening investor demand and possible profit-booking. This could put short-term pressure on ZEC’s price and hurt sentiment across privacy-focused cryptocurrencies. Traders should watch support levels and further fund flows before taking positions.
Eram Trading Lab
·1 Likes
·215 views
GreekPoliceBustCryptoScamRingArrest17
123,786 views
893 Discussing
BitcoinRejectedAt$87K
143,201 views
199 Discussing