
Domad_
105 Posts

Domad_
Report
Block User
Open Trade
Frequent Trader
11.4 Months
4 Following
55 Followers
12 Liked
Posts
Portfolio
·
--
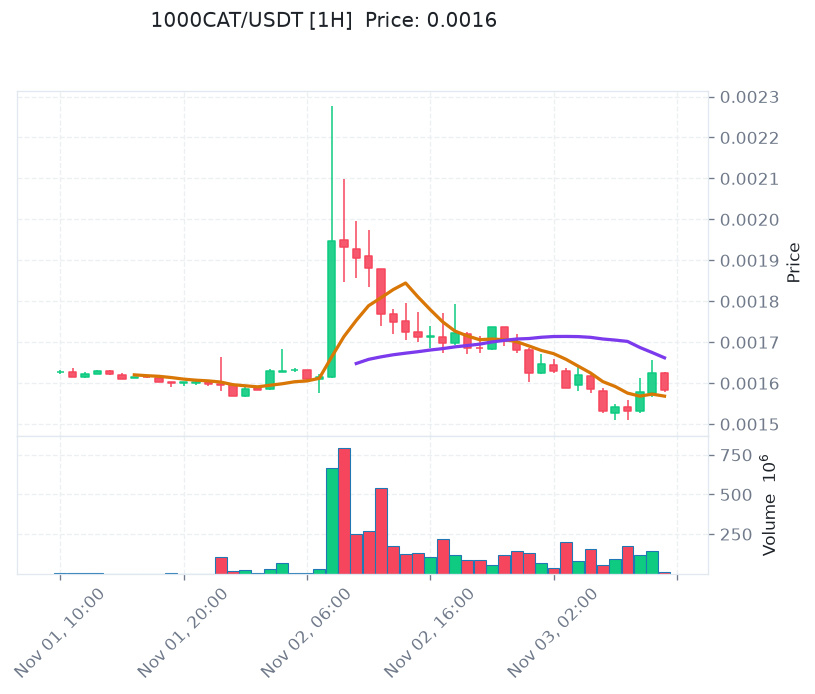
1000CAT is currently trading at 0.00, down 18.05% over the past 24 hours. It has broken below the short-term support range on heavy volume, breaching the previous narrow consolidation zone and weakening the short-term structure.
Trading volume has expanded significantly, indicating that selling pressure is being released alongside buying interest and growing market disagreement—not one-sided selling. Whether the price holds around 0.00 is now crucial. If volume continues to rise but the price cannot reclaim that level, the breakdown is more likely to hold. Conversely, if the price stabilizes on declining volume, the strength of buying support will need to be assessed. This is the key point to watch next.
#1000CAT #Crypto #BinanceSquare $1000CAT
1000CAT is currently trading at 0.00, down 18.05% over the past 24 hours. It has broken below the short-term support range on heavy volume, breaching the previous narrow consolidation zone and weakening the short-term structure.
Trading volume has expanded significantly, indicating that selling pressure is being released alongside buying interest and growing market disagreement—not one-sided selling. Whether the price holds around 0.00 is now crucial. If volume continues to rise but the price cannot reclaim that level, the breakdown is more likely to hold. Conversely, if the price stabilizes on declining volume, the strength of buying support will need to be assessed. This is the key point to watch next.
#1000CAT #Crypto #BinanceSquare $1000CAT
Trading volume has expanded significantly, indicating that selling pressure is being released alongside buying interest and growing market disagreement—not one-sided selling. Whether the price holds around 0.00 is now crucial. If volume continues to rise but the price cannot reclaim that level, the breakdown is more likely to hold. Conversely, if the price stabilizes on declining volume, the strength of buying support will need to be assessed. This is the key point to watch next.
#1000CAT #Crypto #BinanceSquare $1000CAT
3
·
--
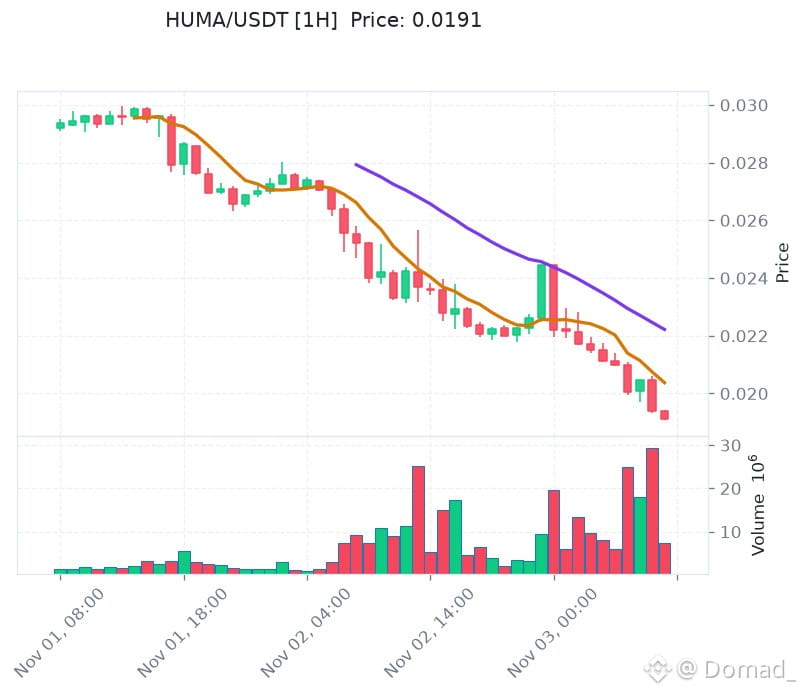
HUMA is currently at 0.02, down 23.89% in 24 hours. Heavy-volume selling has pushed it straight through the previous short-term support zone, confirming a short-term breakdown, with the moving averages above now acting as resistance.
The surge in volume suggests intense turnover between active sellers and buyers stepping in, with a marked increase in market disagreement rather than a one-sided sell-off. Whether the 0.02 level holds is now crucial. If volume continues to rise but the price cannot stabilize, the support's strength is in doubt. Going forward, watch for stabilization on lower volume or a continued decline on higher volume. Short-term traders on the forum can share what they’re observing.
#HUMA #Crypto #BinanceSquare $HUMA
HUMA is currently at 0.02, down 23.89% in 24 hours. Heavy-volume selling has pushed it straight through the previous short-term support zone, confirming a short-term breakdown, with the moving averages above now acting as resistance.
The surge in volume suggests intense turnover between active sellers and buyers stepping in, with a marked increase in market disagreement rather than a one-sided sell-off. Whether the 0.02 level holds is now crucial. If volume continues to rise but the price cannot stabilize, the support's strength is in doubt. Going forward, watch for stabilization on lower volume or a continued decline on higher volume. Short-term traders on the forum can share what they’re observing.
#HUMA #Crypto #BinanceSquare $HUMA
The surge in volume suggests intense turnover between active sellers and buyers stepping in, with a marked increase in market disagreement rather than a one-sided sell-off. Whether the 0.02 level holds is now crucial. If volume continues to rise but the price cannot stabilize, the support's strength is in doubt. Going forward, watch for stabilization on lower volume or a continued decline on higher volume. Short-term traders on the forum can share what they’re observing.
#HUMA #Crypto #BinanceSquare $HUMA
1
·
--
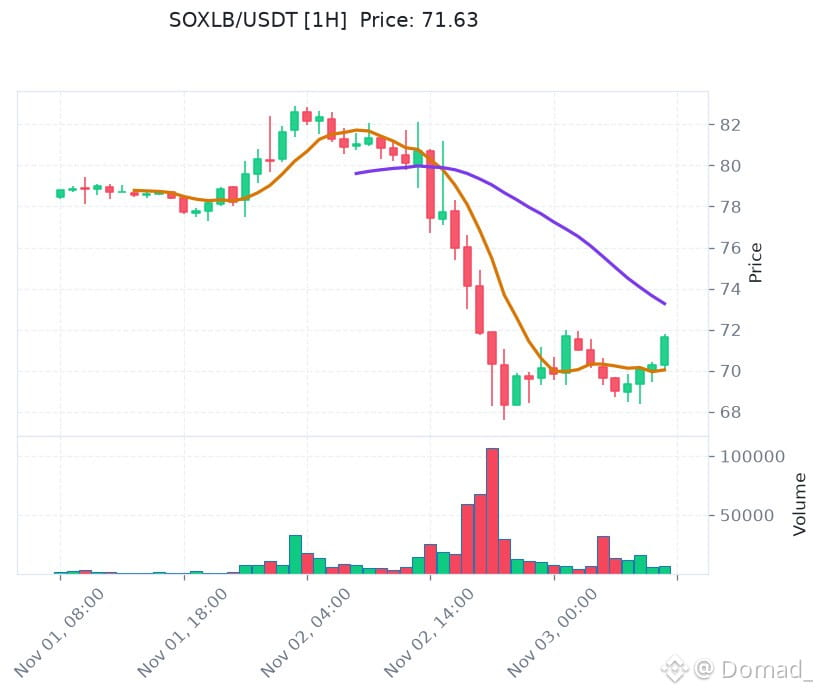
SOXLB is currently at 71.63, down 12.28% over the past 24 hours. It has dropped sharply on increased volume, breaking below a short-term support platform and the previous narrow consolidation range. The short-term chart pattern has turned bearish.
The increase in trading volume indicates that both active selling and buying interest are present, with a clear escalation in market disagreement—not one-sided panic. Whether the price holds around 71.63 is crucial. If volume continues to expand but the price fails to reclaim this level, the support's reliability will be in doubt. Next, watch for stabilization on declining volume or a continued drop on expanding volume.
#SOXLB #Crypto #BinanceSquare $SOXLB
SOXLB is currently at 71.63, down 12.28% over the past 24 hours. It has dropped sharply on increased volume, breaking below a short-term support platform and the previous narrow consolidation range. The short-term chart pattern has turned bearish.
The increase in trading volume indicates that both active selling and buying interest are present, with a clear escalation in market disagreement—not one-sided panic. Whether the price holds around 71.63 is crucial. If volume continues to expand but the price fails to reclaim this level, the support's reliability will be in doubt. Next, watch for stabilization on declining volume or a continued drop on expanding volume.
#SOXLB #Crypto #BinanceSquare $SOXLB
The increase in trading volume indicates that both active selling and buying interest are present, with a clear escalation in market disagreement—not one-sided panic. Whether the price holds around 71.63 is crucial. If volume continues to expand but the price fails to reclaim this level, the support's reliability will be in doubt. Next, watch for stabilization on declining volume or a continued drop on expanding volume.
#SOXLB #Crypto #BinanceSquare $SOXLB
·
--
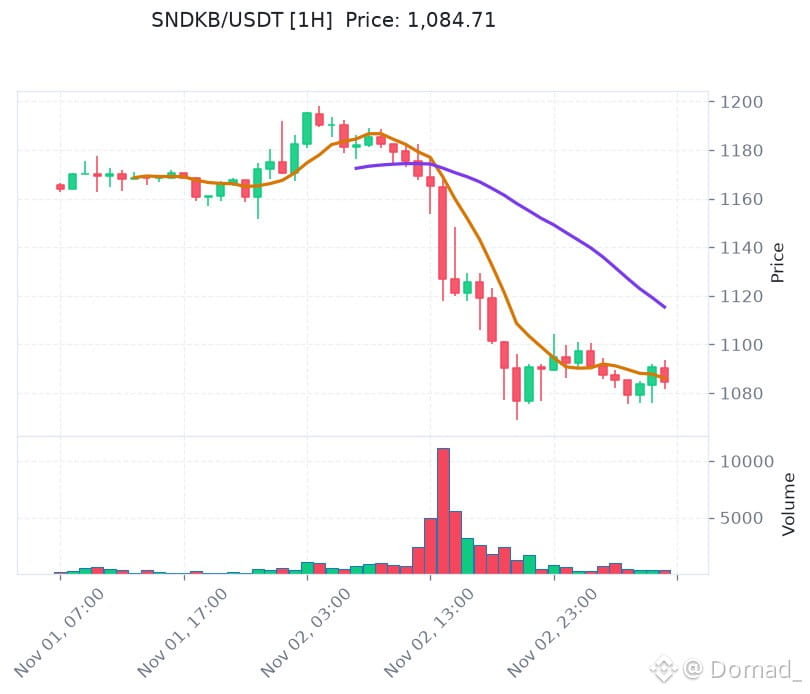
SNDKB is currently trading at 1,084.78, down 8.56% over the past 24 hours. Heavy-volume selling has pushed it below the previous short-term support zone, confirming a short-term breakdown. After the bulls’ defense zone gave way, the price has shifted markedly lower.
The decline has been accompanied by rising trading volume, with clear signs of active selling. So far, the market has yet to show effective buying support, while the bull-bear divide has widened at lower levels. Whether the price holds around 1,084.78 is now the key point to watch. If volume continues to rise but the price fails to reclaim support, the breakdown will be further confirmed. Conversely, stabilization on declining volume would provide a basis for recovery. Pay close attention to the relationship between price and volume.
#SNDKB #Crypto #BinanceSquare $SNDKB
SNDKB is currently trading at 1,084.78, down 8.56% over the past 24 hours. Heavy-volume selling has pushed it below the previous short-term support zone, confirming a short-term breakdown. After the bulls’ defense zone gave way, the price has shifted markedly lower.
The decline has been accompanied by rising trading volume, with clear signs of active selling. So far, the market has yet to show effective buying support, while the bull-bear divide has widened at lower levels. Whether the price holds around 1,084.78 is now the key point to watch. If volume continues to rise but the price fails to reclaim support, the breakdown will be further confirmed. Conversely, stabilization on declining volume would provide a basis for recovery. Pay close attention to the relationship between price and volume.
#SNDKB #Crypto #BinanceSquare $SNDKB
The decline has been accompanied by rising trading volume, with clear signs of active selling. So far, the market has yet to show effective buying support, while the bull-bear divide has widened at lower levels. Whether the price holds around 1,084.78 is now the key point to watch. If volume continues to rise but the price fails to reclaim support, the breakdown will be further confirmed. Conversely, stabilization on declining volume would provide a basis for recovery. Pay close attention to the relationship between price and volume.
#SNDKB #Crypto #BinanceSquare $SNDKB
·
--
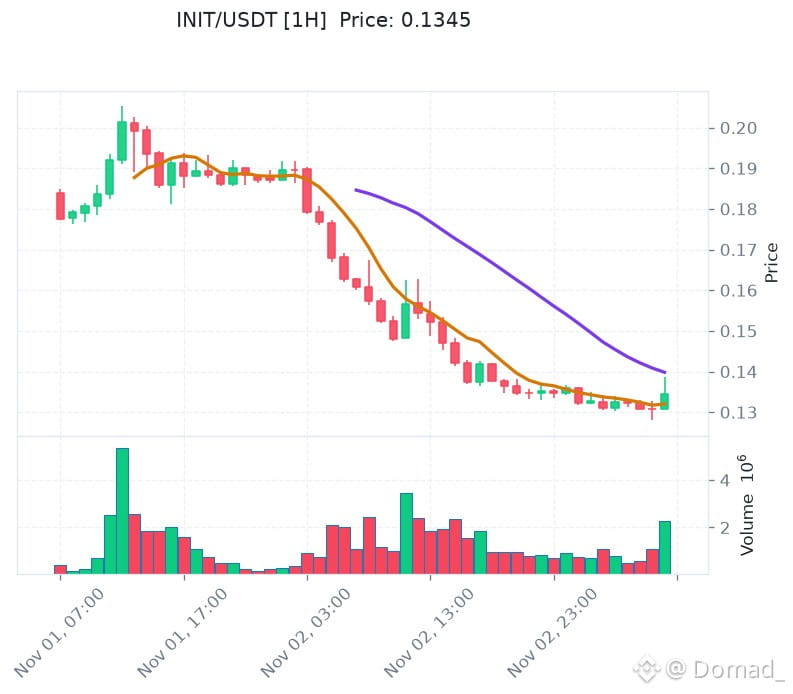
INIT is currently at 0.13, down 16.77% over the past 24 hours. Heavy trading pushed the price below the lower boundary of the previous narrow consolidation range, confirming a short-term breakdown. The 0.14 level has now turned into resistance.
Trading volume has expanded noticeably during the decline, indicating growing divergence between active selling pressure and buying demand—not simply a low-volume drift downward. Whether the price holds around 0.13 is now crucial. If volume continues to rise but the price fails to stabilize, the support’s strength is questionable; if the decline stops on lower volume, watch to see whether capital flows back in.
#INIT #Crypto #BinanceSquare $INIT
INIT is currently at 0.13, down 16.77% over the past 24 hours. Heavy trading pushed the price below the lower boundary of the previous narrow consolidation range, confirming a short-term breakdown. The 0.14 level has now turned into resistance.
Trading volume has expanded noticeably during the decline, indicating growing divergence between active selling pressure and buying demand—not simply a low-volume drift downward. Whether the price holds around 0.13 is now crucial. If volume continues to rise but the price fails to stabilize, the support’s strength is questionable; if the decline stops on lower volume, watch to see whether capital flows back in.
#INIT #Crypto #BinanceSquare $INIT
Trading volume has expanded noticeably during the decline, indicating growing divergence between active selling pressure and buying demand—not simply a low-volume drift downward. Whether the price holds around 0.13 is now crucial. If volume continues to rise but the price fails to stabilize, the support’s strength is questionable; if the decline stops on lower volume, watch to see whether capital flows back in.
#INIT #Crypto #BinanceSquare $INIT
3
·
--
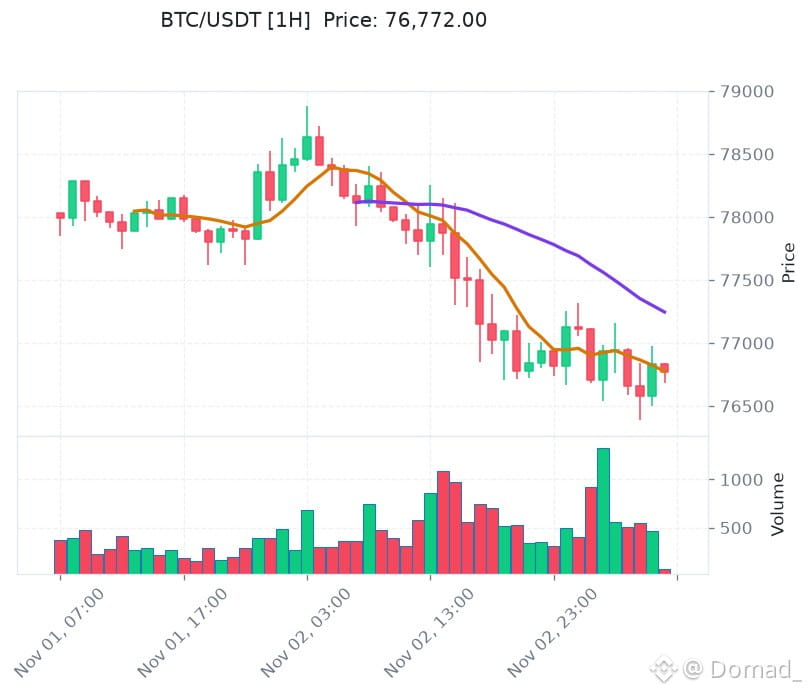
BTC is currently trading at 76,772, down 1.80% over the past 24 hours. The price is consolidating in a narrowing range around the average of key moving averages. The lower end of the previous trading range has held so far, and the short-term structure is building momentum ahead of a potential move.
Trading volume has contracted overall, with limited aggressive selling pressure. Buyers are stepping in around the moving averages, while others are staying on the sidelines; the market’s divergence has yet to play out. Whether support around 76,772 holds depends on a pickup in volume. If low-volume consolidation continues, a directional move is approaching. A volume-backed breakout or breakdown is the next key focus.
#BTC #Crypto #BinanceSquare $BTC
BTC is currently trading at 76,772, down 1.80% over the past 24 hours. The price is consolidating in a narrowing range around the average of key moving averages. The lower end of the previous trading range has held so far, and the short-term structure is building momentum ahead of a potential move.
Trading volume has contracted overall, with limited aggressive selling pressure. Buyers are stepping in around the moving averages, while others are staying on the sidelines; the market’s divergence has yet to play out. Whether support around 76,772 holds depends on a pickup in volume. If low-volume consolidation continues, a directional move is approaching. A volume-backed breakout or breakdown is the next key focus.
#BTC #Crypto #BinanceSquare $BTC
Trading volume has contracted overall, with limited aggressive selling pressure. Buyers are stepping in around the moving averages, while others are staying on the sidelines; the market’s divergence has yet to play out. Whether support around 76,772 holds depends on a pickup in volume. If low-volume consolidation continues, a directional move is approaching. A volume-backed breakout or breakdown is the next key focus.
#BTC #Crypto #BinanceSquare $BTC
13
·
--
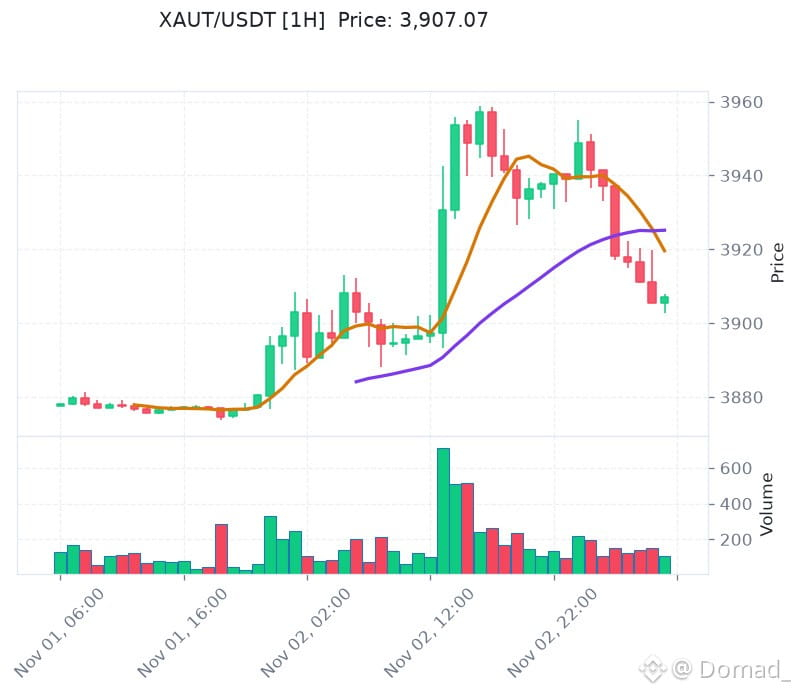
XAUT is currently at 3,907.08, up a modest 0.28% over the past 24 hours. The price is moving sideways and tightening around the average of key moving averages. It has not broken below the lower edge of the previous range in the short term, nor has it made a convincing breakout—this is a typical consolidation pattern as the market builds momentum.
Trading volume has contracted moderately, suggesting limited selling pressure. Instead, buyers are cautiously stepping in around the moving averages, and the divide between bulls and bears has yet to widen. The key things to watch next are whether support around 3,907.08 holds and whether volume expands in tandem with the market’s directional move.
#XAUT #Crypto #BinanceSquare $XAUT
XAUT is currently at 3,907.08, up a modest 0.28% over the past 24 hours. The price is moving sideways and tightening around the average of key moving averages. It has not broken below the lower edge of the previous range in the short term, nor has it made a convincing breakout—this is a typical consolidation pattern as the market builds momentum.
Trading volume has contracted moderately, suggesting limited selling pressure. Instead, buyers are cautiously stepping in around the moving averages, and the divide between bulls and bears has yet to widen. The key things to watch next are whether support around 3,907.08 holds and whether volume expands in tandem with the market’s directional move.
#XAUT #Crypto #BinanceSquare $XAUT
Trading volume has contracted moderately, suggesting limited selling pressure. Instead, buyers are cautiously stepping in around the moving averages, and the divide between bulls and bears has yet to widen. The key things to watch next are whether support around 3,907.08 holds and whether volume expands in tandem with the market’s directional move.
#XAUT #Crypto #BinanceSquare $XAUT
2
·
--
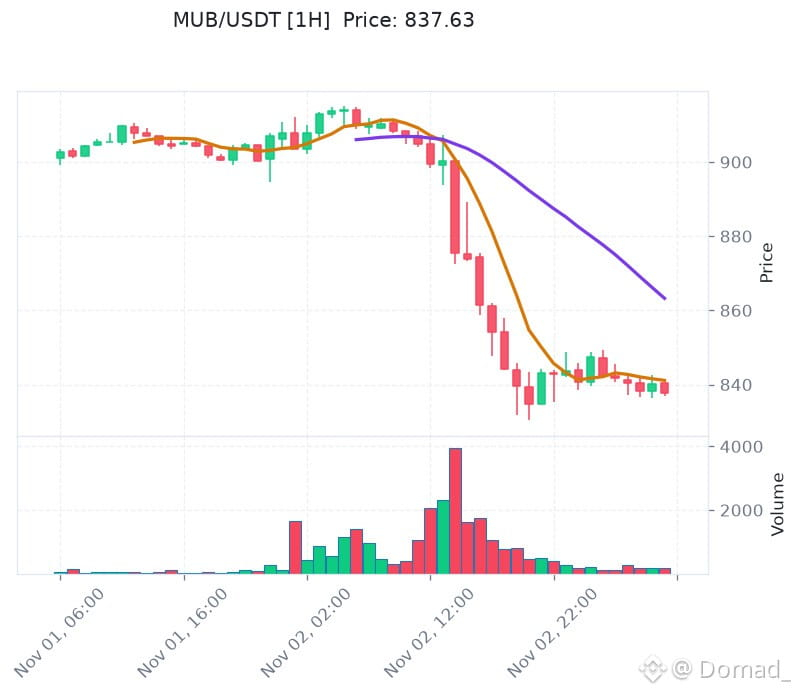
MUB is currently priced at 837.63, down 7.83% over 24 hours. It has broken below the short-term support platform on heavy volume, and the lower boundary of the previous consolidation range has failed to hold, shifting the short-term structure to a breakdown and downward move.
The surge in trading volume indicates concentrated selling pressure, with both active selling by investors and buying interest at lower levels. The divergence has clearly intensified. Whether the price holds around 837.63 is now key. If volume continues to expand while the price fails to reclaim the platform's lower boundary, the breakdown will be confirmed; otherwise, stabilization on declining volume is what to watch for.
#MUB #Crypto #BinanceSquare $MUB
MUB is currently priced at 837.63, down 7.83% over 24 hours. It has broken below the short-term support platform on heavy volume, and the lower boundary of the previous consolidation range has failed to hold, shifting the short-term structure to a breakdown and downward move.
The surge in trading volume indicates concentrated selling pressure, with both active selling by investors and buying interest at lower levels. The divergence has clearly intensified. Whether the price holds around 837.63 is now key. If volume continues to expand while the price fails to reclaim the platform's lower boundary, the breakdown will be confirmed; otherwise, stabilization on declining volume is what to watch for.
#MUB #Crypto #BinanceSquare $MUB
The surge in trading volume indicates concentrated selling pressure, with both active selling by investors and buying interest at lower levels. The divergence has clearly intensified. Whether the price holds around 837.63 is now key. If volume continues to expand while the price fails to reclaim the platform's lower boundary, the breakdown will be confirmed; otherwise, stabilization on declining volume is what to watch for.
#MUB #Crypto #BinanceSquare $MUB
·
--
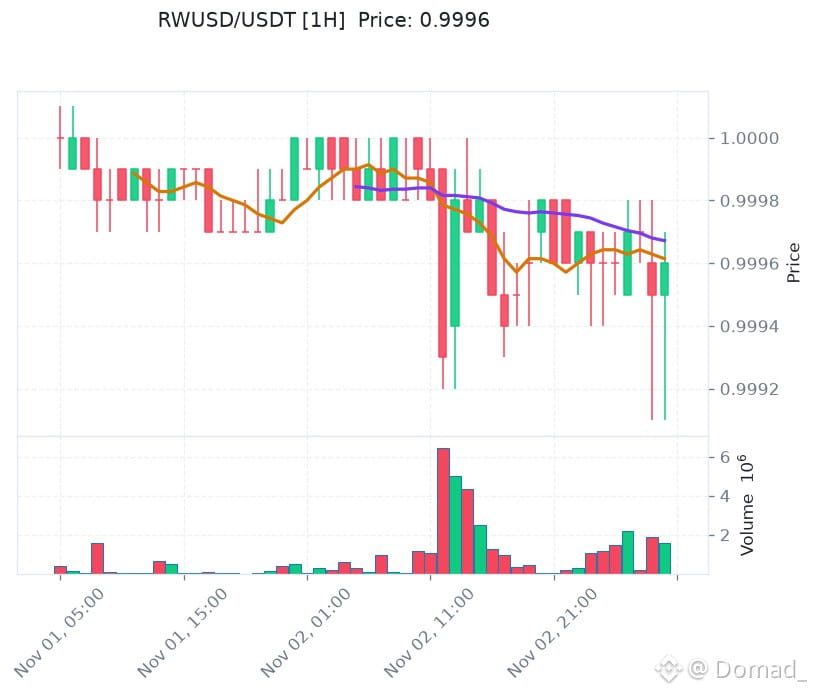
RWUSD is currently at 1.00, down slightly by 0.03% over the past 24 hours. The price is moving sideways in a narrowing range around the key moving-average level, with short-term volatility compressed into an extremely tight range. No clear direction has emerged yet, and the 1.00 psychological level remains intact.
Trading volume has contracted in tandem, and differences among market participants have narrowed at this level. There is little willingness to actively sell, but buyers are also lacking aggressiveness, with most choosing to wait and see. Whether support around 1.00 holds depends on whether volume picks up again. If trading continues to thin out as the price moves sideways, we will have to wait for a clear market signal before the breakout direction becomes apparent. This is also the key development to watch next.
#RWUSD #Crypto #BinanceSquare $RWUSD
RWUSD is currently at 1.00, down slightly by 0.03% over the past 24 hours. The price is moving sideways in a narrowing range around the key moving-average level, with short-term volatility compressed into an extremely tight range. No clear direction has emerged yet, and the 1.00 psychological level remains intact.
Trading volume has contracted in tandem, and differences among market participants have narrowed at this level. There is little willingness to actively sell, but buyers are also lacking aggressiveness, with most choosing to wait and see. Whether support around 1.00 holds depends on whether volume picks up again. If trading continues to thin out as the price moves sideways, we will have to wait for a clear market signal before the breakout direction becomes apparent. This is also the key development to watch next.
#RWUSD #Crypto #BinanceSquare $RWUSD
Trading volume has contracted in tandem, and differences among market participants have narrowed at this level. There is little willingness to actively sell, but buyers are also lacking aggressiveness, with most choosing to wait and see. Whether support around 1.00 holds depends on whether volume picks up again. If trading continues to thin out as the price moves sideways, we will have to wait for a clear market signal before the breakout direction becomes apparent. This is also the key development to watch next.
#RWUSD #Crypto #BinanceSquare $RWUSD
·
--
Binance officially disclosed that deposits on the platform currently exceed withdrawals each hour. This data reflects a recent net inflow of funds, with deposit volumes consistently higher than withdrawal volumes.
#币安 #Crypto #BinanceSquare #Web3
Binance officially disclosed that deposits on the platform currently exceed withdrawals each hour. This data reflects a recent net inflow of funds, with deposit volumes consistently higher than withdrawal volumes.
#币安 #Crypto #BinanceSquare #Web3
#币安 #Crypto #BinanceSquare #Web3
2
·
--
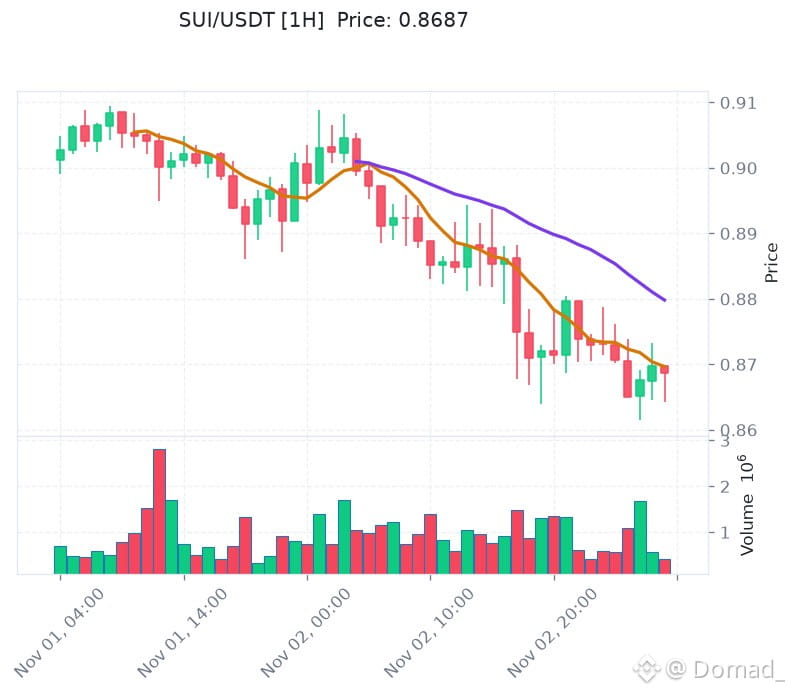
SUI is currently at 0.87, down 3.53% over the past 24 hours. It is moving sideways and consolidating around key moving averages, with buyers and sellers temporarily at an impasse. The previous low remains intact as support, but rebound highs are gradually moving lower.
Trading volume has contracted noticeably compared with earlier levels. While active selling pressure has eased, buyers remain cautious, and market disagreement continues to build within the narrowing range. The strength of support around 0.87 now depends on whether volume can pick up. If low-volume sideways trading continues, a directional move may be approaching. Watch closely for a breakout or breakdown on increased volume.
#SUI #Crypto #BinanceSquare $SUI
SUI is currently at 0.87, down 3.53% over the past 24 hours. It is moving sideways and consolidating around key moving averages, with buyers and sellers temporarily at an impasse. The previous low remains intact as support, but rebound highs are gradually moving lower.
Trading volume has contracted noticeably compared with earlier levels. While active selling pressure has eased, buyers remain cautious, and market disagreement continues to build within the narrowing range. The strength of support around 0.87 now depends on whether volume can pick up. If low-volume sideways trading continues, a directional move may be approaching. Watch closely for a breakout or breakdown on increased volume.
#SUI #Crypto #BinanceSquare $SUI
Trading volume has contracted noticeably compared with earlier levels. While active selling pressure has eased, buyers remain cautious, and market disagreement continues to build within the narrowing range. The strength of support around 0.87 now depends on whether volume can pick up. If low-volume sideways trading continues, a directional move may be approaching. Watch closely for a breakout or breakdown on increased volume.
#SUI #Crypto #BinanceSquare $SUI
8
·
--
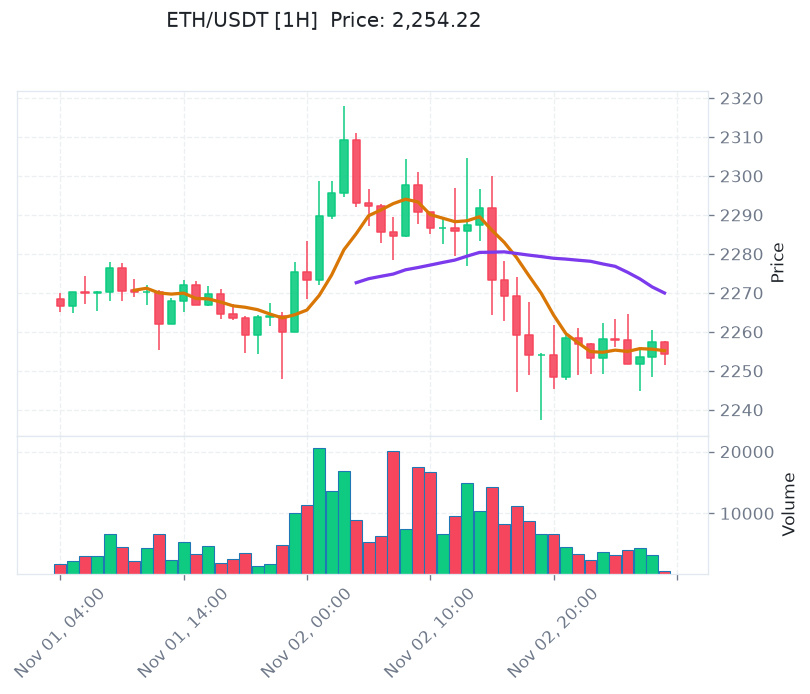
ETH is currently at 2,254.22, down 1.59% over the past 24 hours. The price is moving sideways in a narrowing range around the key moving-average level, with buyers and sellers temporarily balanced. No clear breakdown or rally has emerged in the short term, and a directional move is approaching.
Trading volume has contracted moderately, suggesting limited aggressive selling. Market participants are mostly waiting on the sidelines, while buyers are also stepping in; the disagreement is brewing as it narrows. The key level to watch is 2,254.22: if the price holds above it on increased volume, support will be confirmed; if it breaks below on declining volume, caution is warranted. Next, focus on whether volume supports a breakout in either direction.
#ETH #Crypto #BinanceSquare $ETH
ETH is currently at 2,254.22, down 1.59% over the past 24 hours. The price is moving sideways in a narrowing range around the key moving-average level, with buyers and sellers temporarily balanced. No clear breakdown or rally has emerged in the short term, and a directional move is approaching.
Trading volume has contracted moderately, suggesting limited aggressive selling. Market participants are mostly waiting on the sidelines, while buyers are also stepping in; the disagreement is brewing as it narrows. The key level to watch is 2,254.22: if the price holds above it on increased volume, support will be confirmed; if it breaks below on declining volume, caution is warranted. Next, focus on whether volume supports a breakout in either direction.
#ETH #Crypto #BinanceSquare $ETH
Trading volume has contracted moderately, suggesting limited aggressive selling. Market participants are mostly waiting on the sidelines, while buyers are also stepping in; the disagreement is brewing as it narrows. The key level to watch is 2,254.22: if the price holds above it on increased volume, support will be confirmed; if it breaks below on declining volume, caution is warranted. Next, focus on whether volume supports a breakout in either direction.
#ETH #Crypto #BinanceSquare $ETH
135
·
--
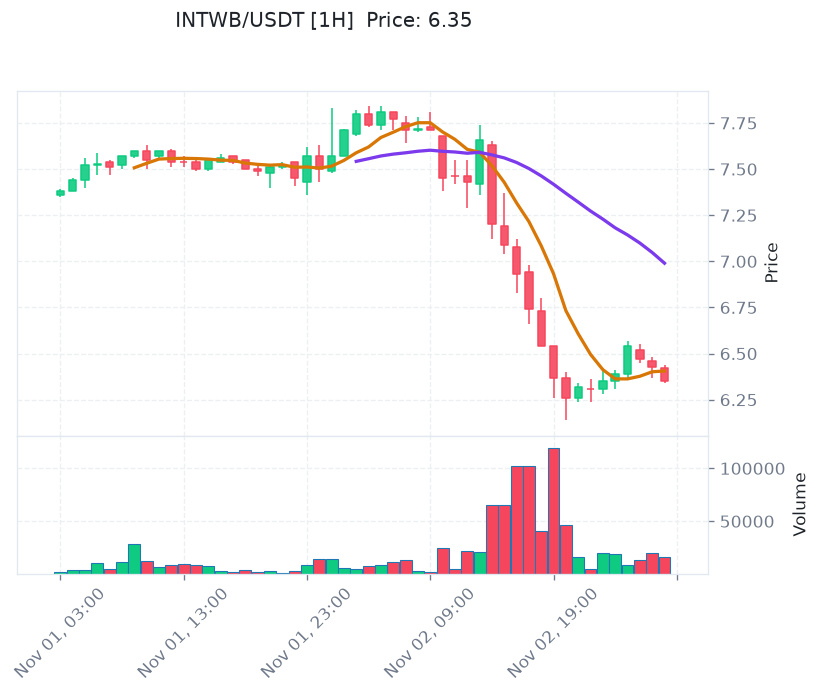
INTWB is currently priced at 6.35, down 18.27% in 24 hours. Heavy-volume selling drove it straight through short-term support, breaking below the previous consolidation range and shifting the short-term structure into a downward breakdown.
This surge in volume is essentially a head-on clash between active selling and buying demand. After the price broke below the platform, panic selling and stop-loss orders flooded the market, sharply intensifying disagreement among market participants. Whether the price can hold around 6.35 is now key. If volume continues to expand but the price fails to reclaim the platform’s lower edge, the support’s reliability is in doubt. Next, watch whether the price stabilizes on declining volume or continues falling on heavy volume.
#INTWB #Crypto #BinanceSquare $INTWB
INTWB is currently priced at 6.35, down 18.27% in 24 hours. Heavy-volume selling drove it straight through short-term support, breaking below the previous consolidation range and shifting the short-term structure into a downward breakdown.
This surge in volume is essentially a head-on clash between active selling and buying demand. After the price broke below the platform, panic selling and stop-loss orders flooded the market, sharply intensifying disagreement among market participants. Whether the price can hold around 6.35 is now key. If volume continues to expand but the price fails to reclaim the platform’s lower edge, the support’s reliability is in doubt. Next, watch whether the price stabilizes on declining volume or continues falling on heavy volume.
#INTWB #Crypto #BinanceSquare $INTWB
This surge in volume is essentially a head-on clash between active selling and buying demand. After the price broke below the platform, panic selling and stop-loss orders flooded the market, sharply intensifying disagreement among market participants. Whether the price can hold around 6.35 is now key. If volume continues to expand but the price fails to reclaim the platform’s lower edge, the support’s reliability is in doubt. Next, watch whether the price stabilizes on declining volume or continues falling on heavy volume.
#INTWB #Crypto #BinanceSquare $INTWB
14
·
--
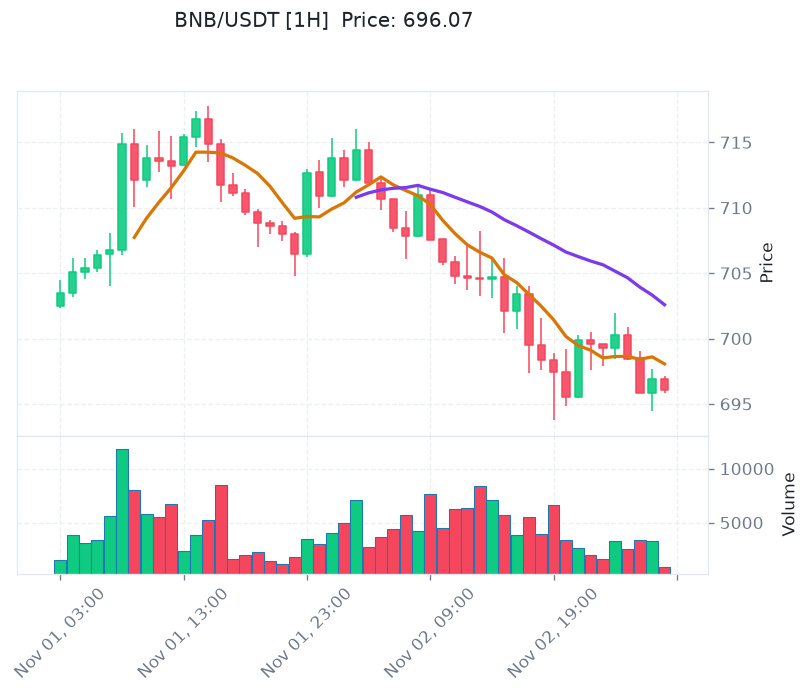
BNB is currently at 696.07, down 2.57% over the past 24 hours. The price is moving sideways in a narrowing range around the key moving-average level, forming a tight short-term structure as the market builds momentum and awaits direction. The 700 level is near-term resistance, while the area around 690 is a reference point for recent support.
Trading volume has contracted noticeably at this level. Active selling pressure has eased, but buyers remain cautious as well. The divergence between bulls and bears is narrowing rather than intensifying, suggesting that traders are waiting on the sidelines ahead of a key level. Whether the price holds around 696.07 will determine the short-term direction. A high-volume hold above the moving average would increase the likelihood of an upward move, while a low-volume break below 690 would warrant caution about a further pullback. Whether volume confirms the move is the key market signal to watch next.
#BNB #Crypto #BinanceSquare $BNB
BNB is currently at 696.07, down 2.57% over the past 24 hours. The price is moving sideways in a narrowing range around the key moving-average level, forming a tight short-term structure as the market builds momentum and awaits direction. The 700 level is near-term resistance, while the area around 690 is a reference point for recent support.
Trading volume has contracted noticeably at this level. Active selling pressure has eased, but buyers remain cautious as well. The divergence between bulls and bears is narrowing rather than intensifying, suggesting that traders are waiting on the sidelines ahead of a key level. Whether the price holds around 696.07 will determine the short-term direction. A high-volume hold above the moving average would increase the likelihood of an upward move, while a low-volume break below 690 would warrant caution about a further pullback. Whether volume confirms the move is the key market signal to watch next.
#BNB #Crypto #BinanceSquare $BNB
Trading volume has contracted noticeably at this level. Active selling pressure has eased, but buyers remain cautious as well. The divergence between bulls and bears is narrowing rather than intensifying, suggesting that traders are waiting on the sidelines ahead of a key level. Whether the price holds around 696.07 will determine the short-term direction. A high-volume hold above the moving average would increase the likelihood of an upward move, while a low-volume break below 690 would warrant caution about a further pullback. Whether volume confirms the move is the key market signal to watch next.
#BNB #Crypto #BinanceSquare $BNB
43
·
--
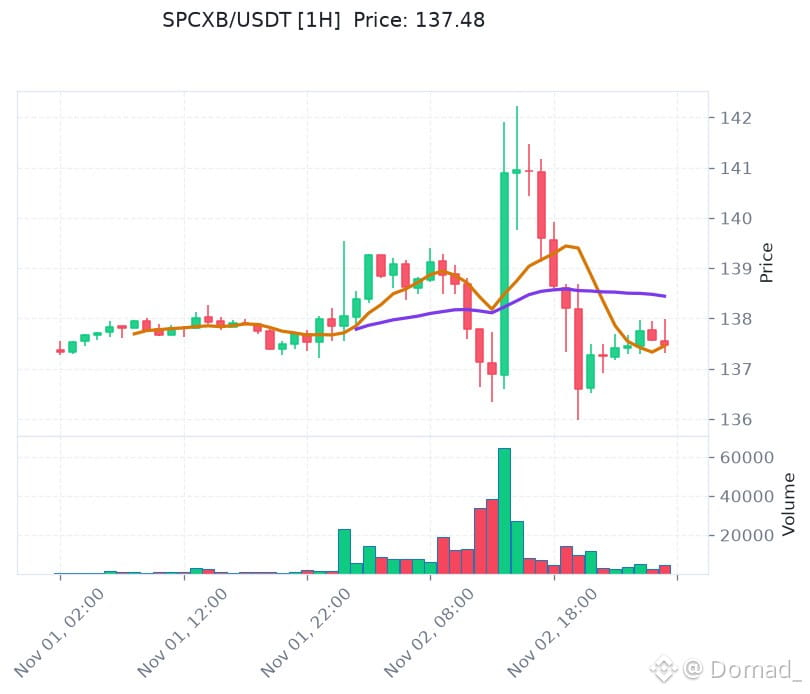
SPCXB is currently at 137.48, down 1.11% over 24 hours. The price is moving sideways in a narrowing range around a key moving-average level, with bulls and bears temporarily balanced. No clear breakdown or rally has emerged in the short term, suggesting a directional move may be approaching.
Trading volume has contracted moderately, indicating little willingness to sell actively. Buying support is limited, and the divergence is narrowing rather than widening. The effectiveness of support around 137.48 currently depends on whether volume expands. If volume continues to shrink, the range-bound movement may persist; the direction of any volume expansion is the key factor to watch next.
#SPCXB #Crypto #BinanceSquare $SPCXB
SPCXB is currently at 137.48, down 1.11% over 24 hours. The price is moving sideways in a narrowing range around a key moving-average level, with bulls and bears temporarily balanced. No clear breakdown or rally has emerged in the short term, suggesting a directional move may be approaching.
Trading volume has contracted moderately, indicating little willingness to sell actively. Buying support is limited, and the divergence is narrowing rather than widening. The effectiveness of support around 137.48 currently depends on whether volume expands. If volume continues to shrink, the range-bound movement may persist; the direction of any volume expansion is the key factor to watch next.
#SPCXB #Crypto #BinanceSquare $SPCXB
Trading volume has contracted moderately, indicating little willingness to sell actively. Buying support is limited, and the divergence is narrowing rather than widening. The effectiveness of support around 137.48 currently depends on whether volume expands. If volume continues to shrink, the range-bound movement may persist; the direction of any volume expansion is the key factor to watch next.
#SPCXB #Crypto #BinanceSquare $SPCXB
5
·
--
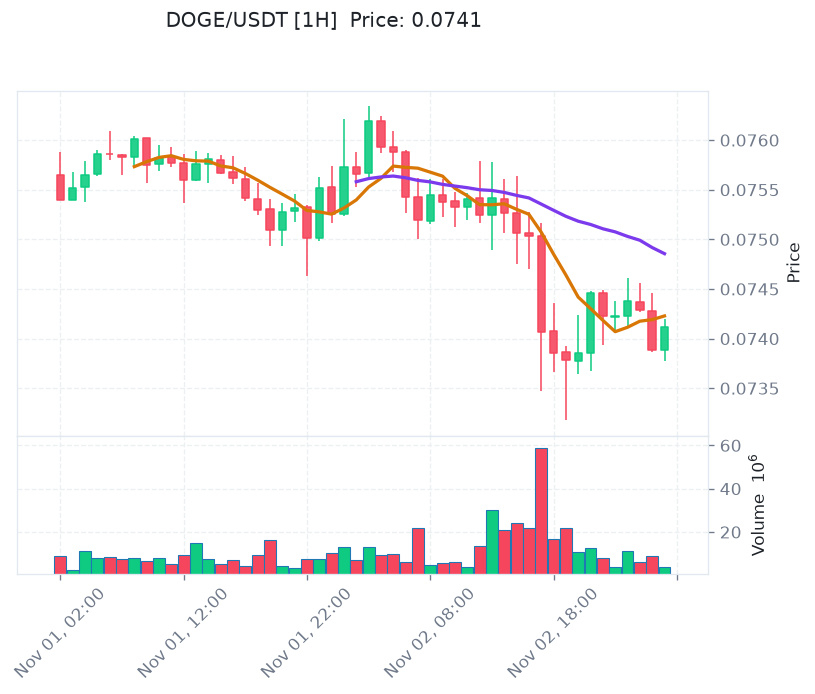
DOGE is currently at 0.07, down 2.28% over the past 24 hours. The price is moving sideways in a narrowing range around a key moving-average level, with no clear short-term breakdown. Bulls and bears are temporarily locked in repeated battles around this moving average.
Trading volume has contracted overall. Active selling pressure is limited, but buying support is also lackluster, with market differences building within the narrow range. Whether DOGE can hold the 0.07 level is the key point to watch: a hold accompanied by increased volume would strengthen the structure, while a low-volume breakdown would raise concerns that moving-average support has failed. Whether volume confirms the move will determine the next direction.
#DOGE #Crypto #BinanceSquare $DOGE
DOGE is currently at 0.07, down 2.28% over the past 24 hours. The price is moving sideways in a narrowing range around a key moving-average level, with no clear short-term breakdown. Bulls and bears are temporarily locked in repeated battles around this moving average.
Trading volume has contracted overall. Active selling pressure is limited, but buying support is also lackluster, with market differences building within the narrow range. Whether DOGE can hold the 0.07 level is the key point to watch: a hold accompanied by increased volume would strengthen the structure, while a low-volume breakdown would raise concerns that moving-average support has failed. Whether volume confirms the move will determine the next direction.
#DOGE #Crypto #BinanceSquare $DOGE
Trading volume has contracted overall. Active selling pressure is limited, but buying support is also lackluster, with market differences building within the narrow range. Whether DOGE can hold the 0.07 level is the key point to watch: a hold accompanied by increased volume would strengthen the structure, while a low-volume breakdown would raise concerns that moving-average support has failed. Whether volume confirms the move will determine the next direction.
#DOGE #Crypto #BinanceSquare $DOGE
2
·
--
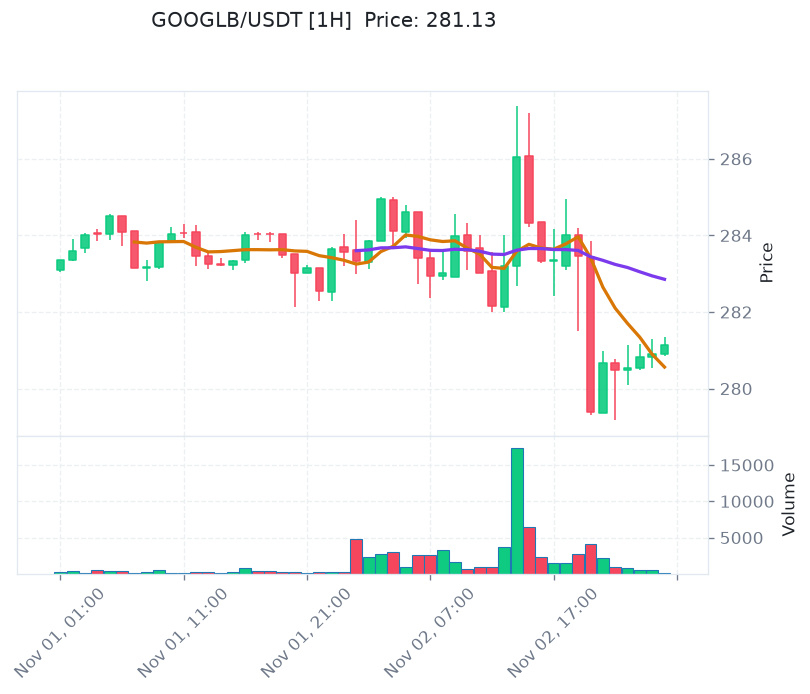
GOOGLB is currently at 281.13, down 0.96% over 24 hours. The price is moving sideways in a narrowing range near the key moving-average level. The previous range has neither been decisively broken above nor below, and the short-term chart is consolidating in a tight range while awaiting direction.
Trading volume is contracting moderately, with no clear signs of active selling. Instead, this appears to reflect buyers stepping in near the moving average as bullish and bearish positions converge. Whether support around 281.13 holds is the key point to watch. Whether volume expands in tandem will determine the strength of any directional move, so watch for the first volume surge after this narrow consolidation.
#GOOGLB #Crypto #BinanceSquare $GOOGLB
GOOGLB is currently at 281.13, down 0.96% over 24 hours. The price is moving sideways in a narrowing range near the key moving-average level. The previous range has neither been decisively broken above nor below, and the short-term chart is consolidating in a tight range while awaiting direction.
Trading volume is contracting moderately, with no clear signs of active selling. Instead, this appears to reflect buyers stepping in near the moving average as bullish and bearish positions converge. Whether support around 281.13 holds is the key point to watch. Whether volume expands in tandem will determine the strength of any directional move, so watch for the first volume surge after this narrow consolidation.
#GOOGLB #Crypto #BinanceSquare $GOOGLB
Trading volume is contracting moderately, with no clear signs of active selling. Instead, this appears to reflect buyers stepping in near the moving average as bullish and bearish positions converge. Whether support around 281.13 holds is the key point to watch. Whether volume expands in tandem will determine the strength of any directional move, so watch for the first volume surge after this narrow consolidation.
#GOOGLB #Crypto #BinanceSquare $GOOGLB
76
·
--
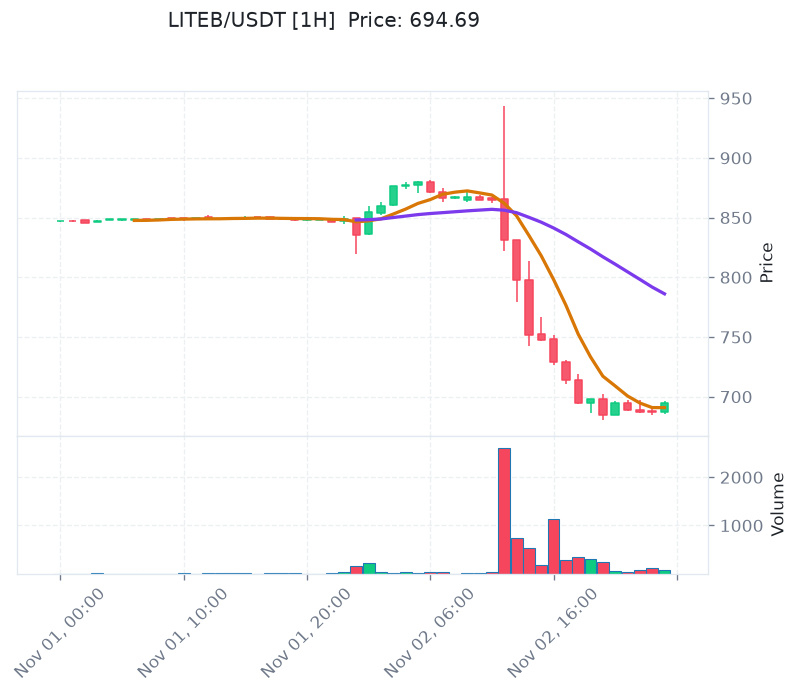
LITEB is currently trading at 694.69, down 18.65% over the past 24 hours. Heavy-volume selling has pushed it below the short-term support platform, and the lower boundary of the previous trading range has been breached, shifting the short-term structure into a breakdown.
The surge in volume appears to reflect a combination of active selling and panic-driven exits. Buying support is limited, and disagreement has intensified as prices have fallen. Whether the price holds around 694.69 is now critical. If volume continues to expand and the price fails to reclaim the platform’s lower boundary, the breakdown will be reinforced. Conversely, only a stabilization on lower volume would merit attention. The key focus going forward is whether this level can provide effective support.
#LITEB #Crypto #BinanceSquare $LITEB
LITEB is currently trading at 694.69, down 18.65% over the past 24 hours. Heavy-volume selling has pushed it below the short-term support platform, and the lower boundary of the previous trading range has been breached, shifting the short-term structure into a breakdown.
The surge in volume appears to reflect a combination of active selling and panic-driven exits. Buying support is limited, and disagreement has intensified as prices have fallen. Whether the price holds around 694.69 is now critical. If volume continues to expand and the price fails to reclaim the platform’s lower boundary, the breakdown will be reinforced. Conversely, only a stabilization on lower volume would merit attention. The key focus going forward is whether this level can provide effective support.
#LITEB #Crypto #BinanceSquare $LITEB
The surge in volume appears to reflect a combination of active selling and panic-driven exits. Buying support is limited, and disagreement has intensified as prices have fallen. Whether the price holds around 694.69 is now critical. If volume continues to expand and the price fails to reclaim the platform’s lower boundary, the breakdown will be reinforced. Conversely, only a stabilization on lower volume would merit attention. The key focus going forward is whether this level can provide effective support.
#LITEB #Crypto #BinanceSquare $LITEB
38
·
--
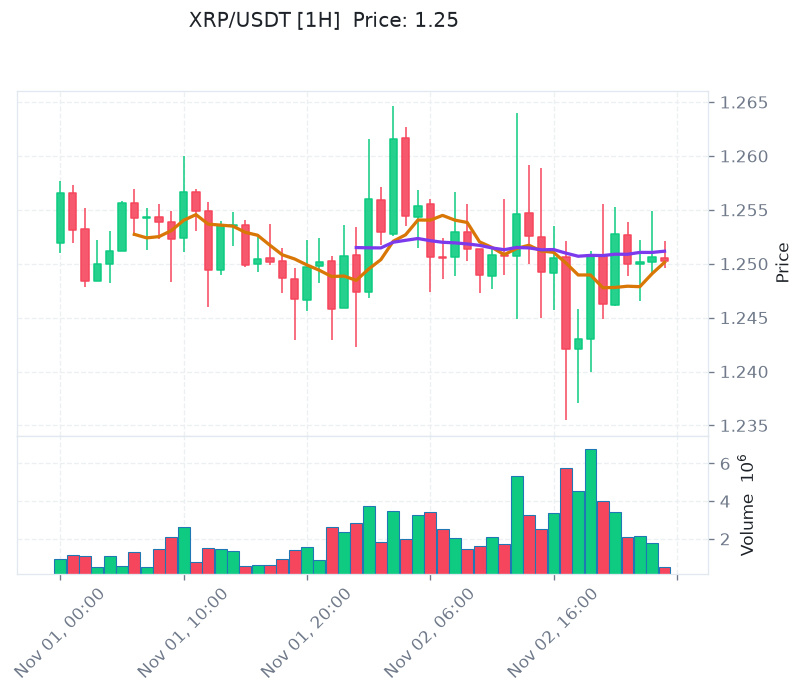
XRP is currently priced at 1.25, down slightly by 0.54% over the past 24 hours. The price is consolidating in a narrowing range around the key moving-average level, with buyers and sellers temporarily balanced. In the short-term structure, 1.25 is the dividing line between bullish and bearish sentiment. There is near-term resistance around 1.27 and recent support at 1.23. With no clear breakdown, the price appears to be building momentum while waiting for a direction.
Trading volume has contracted overall, suggesting that both aggressive selling and buying into rallies are on the sidelines. Most activity consists of existing funds tentatively providing support near key price levels, and disagreement has not intensified. Whether the price holds above 1.25 is the key point to watch. If it holds with increased volume, it may test resistance at 1.27; if it falls below 1.25 on declining volume, watch whether support at 1.23 holds. Volume confirmation will determine which direction the price takes.
#XRP #Crypto #BinanceSquare $XRP
XRP is currently priced at 1.25, down slightly by 0.54% over the past 24 hours. The price is consolidating in a narrowing range around the key moving-average level, with buyers and sellers temporarily balanced. In the short-term structure, 1.25 is the dividing line between bullish and bearish sentiment. There is near-term resistance around 1.27 and recent support at 1.23. With no clear breakdown, the price appears to be building momentum while waiting for a direction.
Trading volume has contracted overall, suggesting that both aggressive selling and buying into rallies are on the sidelines. Most activity consists of existing funds tentatively providing support near key price levels, and disagreement has not intensified. Whether the price holds above 1.25 is the key point to watch. If it holds with increased volume, it may test resistance at 1.27; if it falls below 1.25 on declining volume, watch whether support at 1.23 holds. Volume confirmation will determine which direction the price takes.
#XRP #Crypto #BinanceSquare $XRP
Trading volume has contracted overall, suggesting that both aggressive selling and buying into rallies are on the sidelines. Most activity consists of existing funds tentatively providing support near key price levels, and disagreement has not intensified. Whether the price holds above 1.25 is the key point to watch. If it holds with increased volume, it may test resistance at 1.27; if it falls below 1.25 on declining volume, watch whether support at 1.23 holds. Volume confirmation will determine which direction the price takes.
#XRP #Crypto #BinanceSquare $XRP
56
·
--
According to KCNA on the 3rd, Kim Yo Jong, a department director of the Workers’ Party of Korea Central Committee, issued a statement on the 2nd rejecting the FBI’s claim that a hacking group “supported” by North Korea was involved in the theft of billions of dollars in cryptocurrency from Binance. She said the United States was trying to smear North Korea as a “cybercrime state.”
#加密货币 #Crypto #BinanceSquare #Web3
According to KCNA on the 3rd, Kim Yo Jong, a department director of the Workers’ Party of Korea Central Committee, issued a statement on the 2nd rejecting the FBI’s claim that a hacking group “supported” by North Korea was involved in the theft of billions of dollars in cryptocurrency from Binance. She said the United States was trying to smear North Korea as a “cybercrime state.”
#加密货币 #Crypto #BinanceSquare #Web3
#加密货币 #Crypto #BinanceSquare #Web3

74
Log in to explore more content
Join global crypto users on Binance Square
⚡️ Get latest and useful information about crypto.
💬 Trusted by the world’s largest crypto exchange.
👍 Discover real insights from verified creators.
Email / Phone number
Trending Topics
USMidterms-WhatAreMarketsExpecting?
45,267 views
496 Discussing
Democratic Congressional Sweep Shakes Trump Trades in AI Stocks and Crypto
Binance News
·4 Likes
·2.7k views
USOctoberNFP-AreRateCutsStillPossible
222,168 views
1,761 Discussing
AMDBeatsExpectations-AINarrativeContinues
8,542 views
186 Discussing