
crypto export 12
11 Posts

crypto export 12
Report
Block User
10 Following
1 Followers
0 Liked
Posts
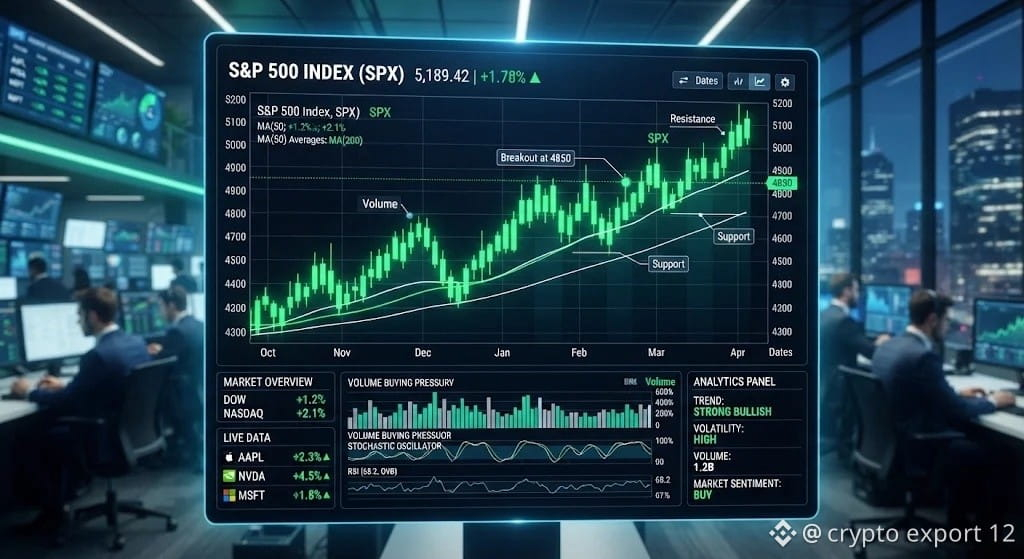
$SNDK Trend Overview: Recent price action shows a persistent bullish continuation, characterized by consecutive higher highs and higher lows on the daily timeframe.
Key Support & Resistance: Immediate support rests near the lower Bollinger Band / moving average convergence zone, while resistance is tested at the recent swing high.
Momentum Indicators: Volume remains supportive of the upward momentum, though oscillators suggest watching for potential consolidation as prices approach key overhead resistance levels.#CanNvidia’sDataCenterGrowthContinue? #KOSPIFalls2.59%ToLowestCloseSinceFebruary
{stock_us}(SNDK.US)
$SNDK Trend Overview: Recent price action shows a persistent bullish continuation, characterized by consecutive higher highs and higher lows on the daily timeframe.
Key Support & Resistance: Immediate support rests near the lower Bollinger Band / moving average convergence zone, while resistance is tested at the recent swing high.
Momentum Indicators: Volume remains supportive of the upward momentum, though oscillators suggest watching for potential consolidation as prices approach key overhead resistance levels.#CanNvidia’sDataCenterGrowthContinue? #KOSPIFalls2.59%ToLowestCloseSinceFebruary
Key Support & Resistance: Immediate support rests near the lower Bollinger Band / moving average convergence zone, while resistance is tested at the recent swing high.
Momentum Indicators: Volume remains supportive of the upward momentum, though oscillators suggest watching for potential consolidation as prices approach key overhead resistance levels.#CanNvidia’sDataCenterGrowthContinue? #KOSPIFalls2.59%ToLowestCloseSinceFebruary
125
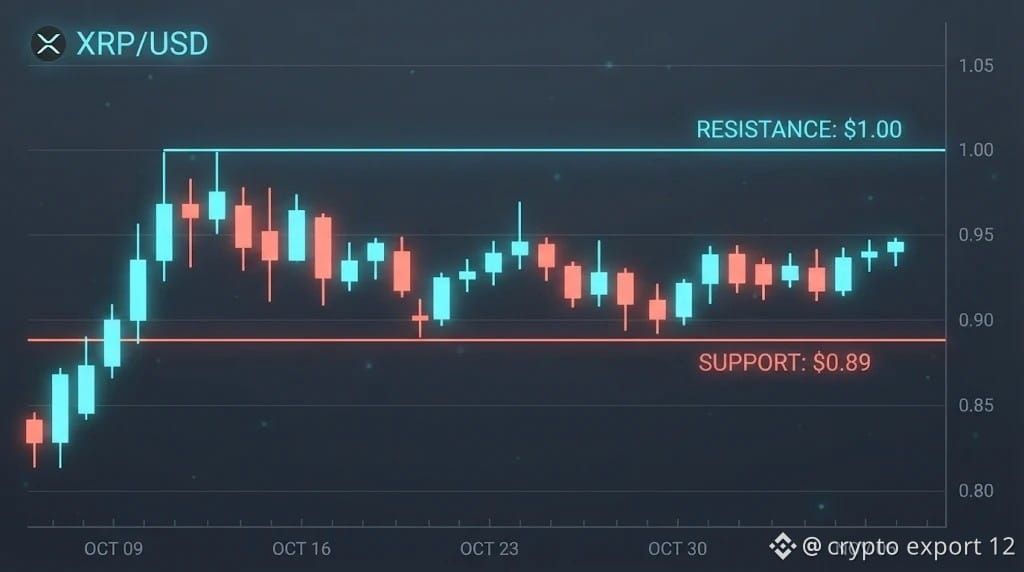
$XRP is trading in a tight consolidation range between $0.95 and $0.98 after slipping below the psychological $1.00 mark for the first time in two years.
Technical Outlook (Bearish but Oversold): Sellers remain in control with XRP trading well below its 50-day, 100-day, and 200-day Exponential Moving Averages ($1.22–$1.33). However, the daily Relative Strength Index (RSI) is hovering near 25–26 (deep in oversold territory), suggesting selling momentum is stretched and a short-term relief bounce is possible.
Key Levels to Watch:
Resistance: $1.00 (psychological barrier), followed by $1.11–$1.16. Bulls must reclaim $1.00 on a daily close to shift near-term sentiment.
Support: $0.94 (immediate range floor) and $0.89 (recent multi-year low). A breakdown below $0.89 opens the door toward $0.78–$0.80.
Market Drivers: Macro headwinds (expectations of potential Federal Reserve rate hikes) and high correlation with Bitcoin (~0.89) are weighing on price action, even as Ripple reports strong institutional growth (~1,700 institutional users) and whales move over $270M off exchanges into private wallets.
Disclaimer: Cryptocurrency markets are highly volatile; this analysis is for informational purposes only and not financial advice.#LedgerHardwareImplantReportsExtendToDubai #KOSPIFalls2.59%ToLowestCloseSinceFebruary #WhatInvestmentSignalsDo13FFilingsReveal?
{spot}(XRPUSDT)
$XRP is trading in a tight consolidation range between $0.95 and $0.98 after slipping below the psychological $1.00 mark for the first time in two years.
Technical Outlook (Bearish but Oversold): Sellers remain in control with XRP trading well below its 50-day, 100-day, and 200-day Exponential Moving Averages ($1.22–$1.33). However, the daily Relative Strength Index (RSI) is hovering near 25–26 (deep in oversold territory), suggesting selling momentum is stretched and a short-term relief bounce is possible.
Key Levels to Watch:
Resistance: $1.00 (psychological barrier), followed by $1.11–$1.16. Bulls must reclaim $1.00 on a daily close to shift near-term sentiment.
Support: $0.94 (immediate range floor) and $0.89 (recent multi-year low). A breakdown below $0.89 opens the door toward $0.78–$0.80.
Market Drivers: Macro headwinds (expectations of potential Federal Reserve rate hikes) and high correlation with Bitcoin (~0.89) are weighing on price action, even as Ripple reports strong institutional growth (~1,700 institutional users) and whales move over $270M off exchanges into private wallets.
Disclaimer: Cryptocurrency markets are highly volatile; this analysis is for informational purposes only and not financial advice.#LedgerHardwareImplantReportsExtendToDubai #KOSPIFalls2.59%ToLowestCloseSinceFebruary #WhatInvestmentSignalsDo13FFilingsReveal?
Technical Outlook (Bearish but Oversold): Sellers remain in control with XRP trading well below its 50-day, 100-day, and 200-day Exponential Moving Averages ($1.22–$1.33). However, the daily Relative Strength Index (RSI) is hovering near 25–26 (deep in oversold territory), suggesting selling momentum is stretched and a short-term relief bounce is possible.
Key Levels to Watch:
Resistance: $1.00 (psychological barrier), followed by $1.11–$1.16. Bulls must reclaim $1.00 on a daily close to shift near-term sentiment.
Support: $0.94 (immediate range floor) and $0.89 (recent multi-year low). A breakdown below $0.89 opens the door toward $0.78–$0.80.
Market Drivers: Macro headwinds (expectations of potential Federal Reserve rate hikes) and high correlation with Bitcoin (~0.89) are weighing on price action, even as Ripple reports strong institutional growth (~1,700 institutional users) and whales move over $270M off exchanges into private wallets.
Disclaimer: Cryptocurrency markets are highly volatile; this analysis is for informational purposes only and not financial advice.#LedgerHardwareImplantReportsExtendToDubai #KOSPIFalls2.59%ToLowestCloseSinceFebruary #WhatInvestmentSignalsDo13FFilingsReveal?
27
Bitcoin (BTC) Market Snapshot — November 18, 2026
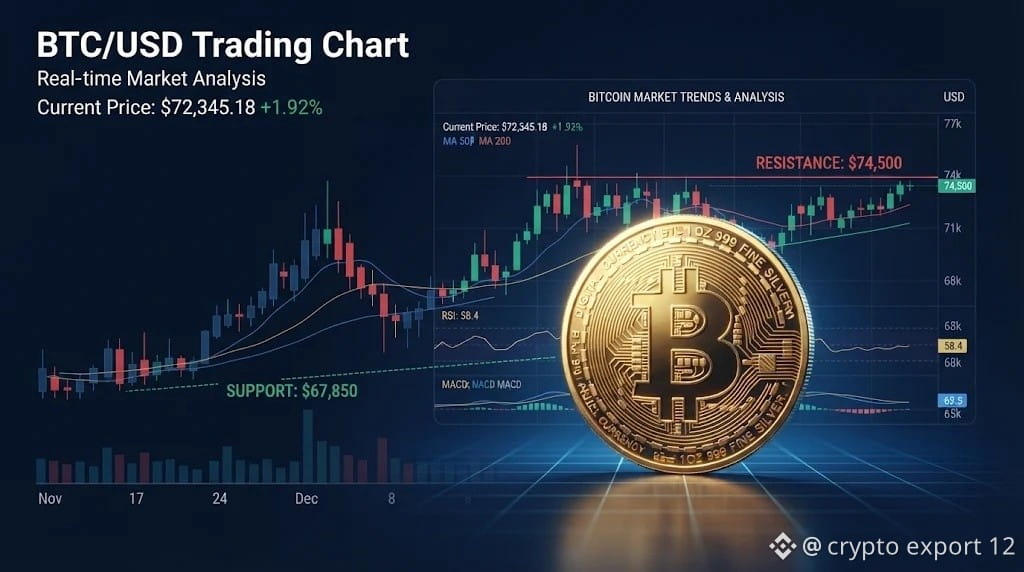
Bitcoin is trading near $64,400 (approx. 17.89 million PKR), consolidating after a steep ~12% weekly pullback that pushed it below its 200-week moving average.
Market Drivers: Tightening financial conditions, rising bond yields, and three consecutive weeks of spot Bitcoin ETF outflows ($1.07 billion withdrawn last week) are weighing heavily on price action.
Technical Outlook: Short-term momentum remains bearish as BTC trades well below its 50- and 200-day moving averages (clustered around $75,600–$76,600). However, the daily RSI is deep in oversold territory near 23, suggesting selling exhaustion could soon trigger a relief bounce.
Key Levels to Watch:
$BTC
Support: $62,600 (immediate weekly floor), followed by the critical $57,700–$58,500 zone. Losing $57,700 opens a drop toward $50,000.
Resistance: $67,250 (first recovery hurdle) and $75,500–$76,600 (major trend-reversal zone).
Volatility is expected to stay elevated around today's Federal Reserve meeting minutes and Friday's Deribit options expiry.#CanNvidia’sDataCenterGrowthContinue? #LedgerHardwareImplantReportsExtendToDubai #NvidiaBoardNotConsideringHuang’sReturnasCEO
{spot}(BTCUSDT)
Bitcoin (BTC) Market Snapshot — November 18, 2026
Bitcoin is trading near $64,400 (approx. 17.89 million PKR), consolidating after a steep ~12% weekly pullback that pushed it below its 200-week moving average.
Market Drivers: Tightening financial conditions, rising bond yields, and three consecutive weeks of spot Bitcoin ETF outflows ($1.07 billion withdrawn last week) are weighing heavily on price action.
Technical Outlook: Short-term momentum remains bearish as BTC trades well below its 50- and 200-day moving averages (clustered around $75,600–$76,600). However, the daily RSI is deep in oversold territory near 23, suggesting selling exhaustion could soon trigger a relief bounce.
Key Levels to Watch:
$BTC
Support: $62,600 (immediate weekly floor), followed by the critical $57,700–$58,500 zone. Losing $57,700 opens a drop toward $50,000.
Resistance: $67,250 (first recovery hurdle) and $75,500–$76,600 (major trend-reversal zone).
Volatility is expected to stay elevated around today's Federal Reserve meeting minutes and Friday's Deribit options expiry.#CanNvidia’sDataCenterGrowthContinue? #LedgerHardwareImplantReportsExtendToDubai #NvidiaBoardNotConsideringHuang’sReturnasCEO
Bitcoin is trading near $64,400 (approx. 17.89 million PKR), consolidating after a steep ~12% weekly pullback that pushed it below its 200-week moving average.
Market Drivers: Tightening financial conditions, rising bond yields, and three consecutive weeks of spot Bitcoin ETF outflows ($1.07 billion withdrawn last week) are weighing heavily on price action.
Technical Outlook: Short-term momentum remains bearish as BTC trades well below its 50- and 200-day moving averages (clustered around $75,600–$76,600). However, the daily RSI is deep in oversold territory near 23, suggesting selling exhaustion could soon trigger a relief bounce.
Key Levels to Watch:
$BTC
Support: $62,600 (immediate weekly floor), followed by the critical $57,700–$58,500 zone. Losing $57,700 opens a drop toward $50,000.
Resistance: $67,250 (first recovery hurdle) and $75,500–$76,600 (major trend-reversal zone).
Volatility is expected to stay elevated around today's Federal Reserve meeting minutes and Friday's Deribit options expiry.#CanNvidia’sDataCenterGrowthContinue? #LedgerHardwareImplantReportsExtendToDubai #NvidiaBoardNotConsideringHuang’sReturnasCEO
20
🍎 Apple (AAPL) Latest Stock Analysis
Medium-term bullish
Short-term pullback$AAPLB
Current price: $351.58 (Nov 18, 2026)
- Support: $346.79
- Resistance: $356.06
- Pivot: $353.40
- Trend: Daily trend remains bullish.
- Outlook: A bounce toward $356.06 is possible if support holds. Below $346.79, further downside risk increases.
My view: Watch for a breakout above $353.40 before considering a bullish entry.
{spot}(AAPLBUSDT)
#NvidiaBoardNotConsideringHuang’sReturnasCEO #NvidiaBoardNotConsideringHuang’sReturnasCEO #TetherCapitalMakesStrategicInvestmentInStables #AnthropicClearedToListOnNasdaqAsANT
🍎 Apple (AAPL) Latest Stock Analysis
Medium-term bullish
Short-term pullback$AAPLB
Current price: $351.58 (Nov 18, 2026)
- Support: $346.79
- Resistance: $356.06
- Pivot: $353.40
- Trend: Daily trend remains bullish.
- Outlook: A bounce toward $356.06 is possible if support holds. Below $346.79, further downside risk increases.
My view: Watch for a breakout above $353.40 before considering a bullish entry.
#NvidiaBoardNotConsideringHuang’sReturnasCEO #NvidiaBoardNotConsideringHuang’sReturnasCEO #TetherCapitalMakesStrategicInvestmentInStables #AnthropicClearedToListOnNasdaqAsANT
Medium-term bullish
Short-term pullback$AAPLB
Current price: $351.58 (Nov 18, 2026)
- Support: $346.79
- Resistance: $356.06
- Pivot: $353.40
- Trend: Daily trend remains bullish.
- Outlook: A bounce toward $356.06 is possible if support holds. Below $346.79, further downside risk increases.
My view: Watch for a breakout above $353.40 before considering a bullish entry.
#NvidiaBoardNotConsideringHuang’sReturnasCEO #NvidiaBoardNotConsideringHuang’sReturnasCEO #TetherCapitalMakesStrategicInvestmentInStables #AnthropicClearedToListOnNasdaqAsANT
91
Key trading levels
Level Price (USDT)
Resistance 1 140.84
Resistance 2 146.32
Support 1 135.34
Support 2 131.90
Trading outlook
- Bullish: Break and hold above 140.84.
- Bearish: Break below 135.34 could open downside toward 131.90.
- RSI: Around 46.7, neutral.
- Trend: Short-term bearish.$SPCX.US
{spot}(SPCXBUSDT)
#NvidiaEarningsTonight:AIStocks’NextMove? #OPTIMJACKAttackInfectsAtLeast186Websites #OPTIMJACKAttackInfectsAtLeast186Websites
Key trading levels
Level Price (USDT)
Resistance 1 140.84
Resistance 2 146.32
Support 1 135.34
Support 2 131.90
Trading outlook
- Bullish: Break and hold above 140.84.
- Bearish: Break below 135.34 could open downside toward 131.90.
- RSI: Around 46.7, neutral.
- Trend: Short-term bearish.$SPCX.US
#NvidiaEarningsTonight:AIStocks’NextMove? #OPTIMJACKAttackInfectsAtLeast186Websites #OPTIMJACKAttackInfectsAtLeast186Websites
Level Price (USDT)
Resistance 1 140.84
Resistance 2 146.32
Support 1 135.34
Support 2 131.90
Trading outlook
- Bullish: Break and hold above 140.84.
- Bearish: Break below 135.34 could open downside toward 131.90.
- RSI: Around 46.7, neutral.
- Trend: Short-term bearish.$SPCX.US
#NvidiaEarningsTonight:AIStocks’NextMove? #OPTIMJACKAttackInfectsAtLeast186Websites #OPTIMJACKAttackInfectsAtLeast186Websites
SPCXUS+0.31%
281
📊 SNDKUSDT Latest Analysis
17 November 2026
Bearish — 24H: -5.00%
- Current Price: $816.67
- Resistance 1: $828
- Resistance 2: $843
- Support: $796
- 24H High: $867.87
- 24H Low: $796.44
Market Outlook:.$SNDK.US
{future}(SNDKUSDT)
SNDKUSDT is showing bearish pressure. A breakout above $828 could trigger a recovery toward $843. If $796 breaks, further downside is possible.
Trading View: Neutral to bearish. Wait for breakout confirmation before entering.
Not financial advice. Prices are market snapshots and can change quickly.
📊 SNDKUSDT Latest Analysis
17 November 2026
Bearish — 24H: -5.00%
- Current Price: $816.67
- Resistance 1: $828
- Resistance 2: $843
- Support: $796
- 24H High: $867.87
- 24H Low: $796.44
Market Outlook:.$SNDK.US
SNDKUSDT is showing bearish pressure. A breakout above $828 could trigger a recovery toward $843. If $796 breaks, further downside is possible.
Trading View: Neutral to bearish. Wait for breakout confirmation before entering.
Not financial advice. Prices are market snapshots and can change quickly.
17 November 2026
Bearish — 24H: -5.00%
- Current Price: $816.67
- Resistance 1: $828
- Resistance 2: $843
- Support: $796
- 24H High: $867.87
- 24H Low: $796.44
Market Outlook:.$SNDK.US
SNDKUSDT is showing bearish pressure. A breakout above $828 could trigger a recovery toward $843. If $796 breaks, further downside is possible.
Trading View: Neutral to bearish. Wait for breakout confirmation before entering.
Not financial advice. Prices are market snapshots and can change quickly.
SNDKUS+2.60%
990
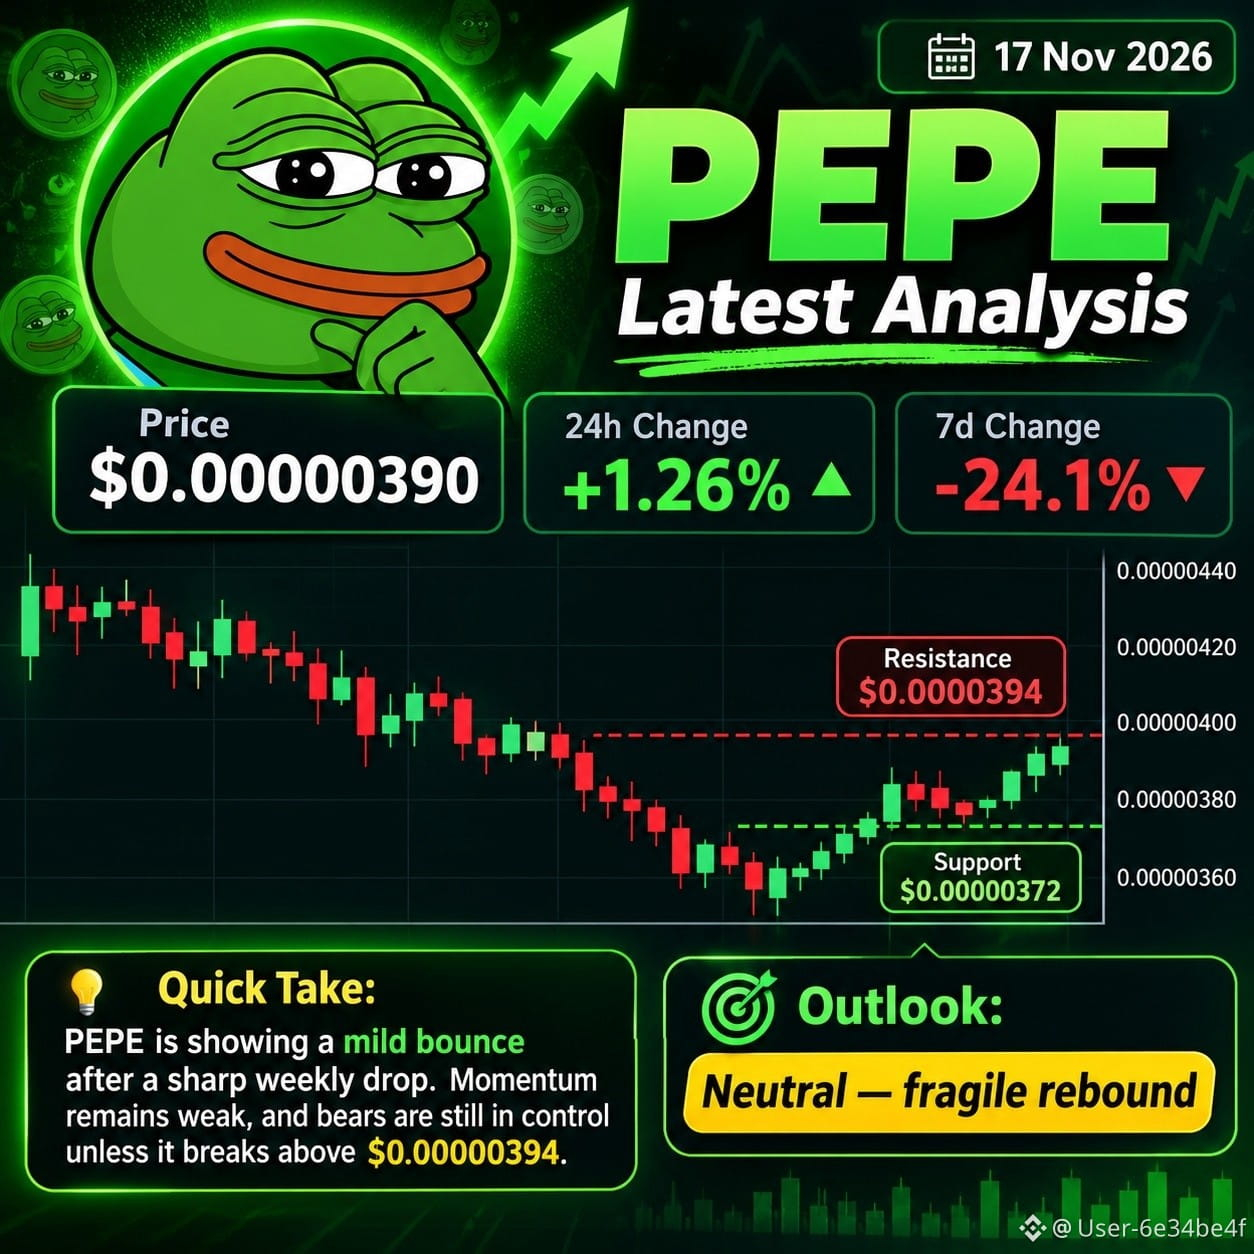
🐸 PEPE Latest Market Analysis
17 November 2026
24H: +1.26%
7D: -24.1%
- Current price: $0.00000390
- Resistance: $0.00000394
- Support: $0.00000372
- Short-term trend: Weak recovery.
Market outlook: PEPE is showing a small recovery after a sharp weekly decline. A breakout above $0.00000394 could bring bullish momentum. If support at $0.00000372 breaks, further downside is possible.
Neutral — Cautious
Trading view: Watch support and resistance before entering a trade. High volatility means higher risk.
Not financial advice.$PEPE
{spot}(PEPEUSDT)
🐸 PEPE Latest Market Analysis
17 November 2026
24H: +1.26%
7D: -24.1%
- Current price: $0.00000390
- Resistance: $0.00000394
- Support: $0.00000372
- Short-term trend: Weak recovery.
Market outlook: PEPE is showing a small recovery after a sharp weekly decline. A breakout above $0.00000394 could bring bullish momentum. If support at $0.00000372 breaks, further downside is possible.
Neutral — Cautious
Trading view: Watch support and resistance before entering a trade. High volatility means higher risk.
Not financial advice.$PEPE
17 November 2026
24H: +1.26%
7D: -24.1%
- Current price: $0.00000390
- Resistance: $0.00000394
- Support: $0.00000372
- Short-term trend: Weak recovery.
Market outlook: PEPE is showing a small recovery after a sharp weekly decline. A breakout above $0.00000394 could bring bullish momentum. If support at $0.00000372 breaks, further downside is possible.
Neutral — Cautious
Trading view: Watch support and resistance before entering a trade. High volatility means higher risk.
Not financial advice.$PEPE
35
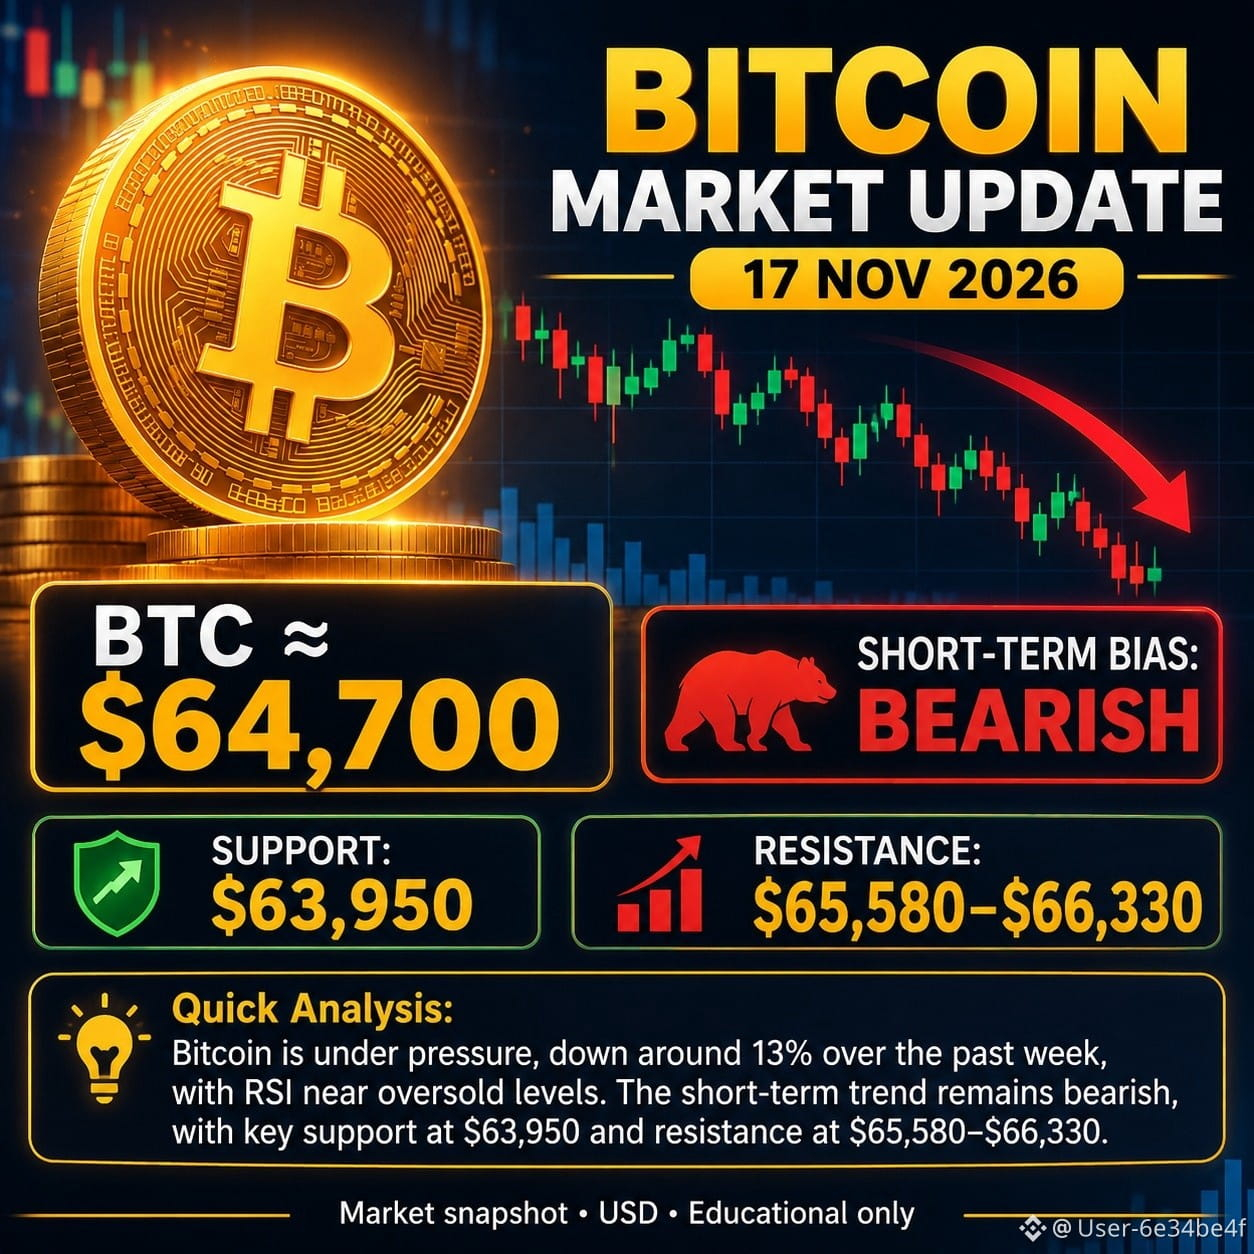
Current price: Around $64,700
Bitcoin is facing strong selling pressure, falling approximately 13% over the past week. The market remains bearish, although RSI near oversold territory suggests a possible short-term bounce.
{spot}(BTCUSDT)
Key price levels:
- Support: $63,950
- Resistance: $65,580–$66,330
- Bullish signal: Break above 66,330.
- Bearish signal: Break below $63,950.66,330.
- Bearish signal: Break below $BTC
My view: Bitcoin needs to reclaim resistance before a strong recovery can be confirmed. Watch support carefully.
Source: btc· Technical analysis.
Disclaimer: Educational analysis only, not financial advice. Prices change rapidly.#AnthropicIPOTestsInvestorAppetiteForAI #NvidiaBoardNotConsideringHuang’sReturnasCEO #InvescoStablecoinReservesFundLaunchesOnEthereum
Current price: Around $64,700
Bitcoin is facing strong selling pressure, falling approximately 13% over the past week. The market remains bearish, although RSI near oversold territory suggests a possible short-term bounce.
Key price levels:
- Support: $63,950
- Resistance: $65,580–$66,330
- Bullish signal: Break above 66,330.
- Bearish signal: Break below $63,950.66,330.
- Bearish signal: Break below $BTC
My view: Bitcoin needs to reclaim resistance before a strong recovery can be confirmed. Watch support carefully.
Source: btc· Technical analysis.
Disclaimer: Educational analysis only, not financial advice. Prices change rapidly.#AnthropicIPOTestsInvestorAppetiteForAI #NvidiaBoardNotConsideringHuang’sReturnasCEO #InvescoStablecoinReservesFundLaunchesOnEthereum
Bitcoin is facing strong selling pressure, falling approximately 13% over the past week. The market remains bearish, although RSI near oversold territory suggests a possible short-term bounce.
Key price levels:
- Support: $63,950
- Resistance: $65,580–$66,330
- Bullish signal: Break above 66,330.
- Bearish signal: Break below $63,950.66,330.
- Bearish signal: Break below $BTC
My view: Bitcoin needs to reclaim resistance before a strong recovery can be confirmed. Watch support carefully.
Source: btc· Technical analysis.
Disclaimer: Educational analysis only, not financial advice. Prices change rapidly.#AnthropicIPOTestsInvestorAppetiteForAI #NvidiaBoardNotConsideringHuang’sReturnasCEO #InvescoStablecoinReservesFundLaunchesOnEthereum
13
·
--
Bearish
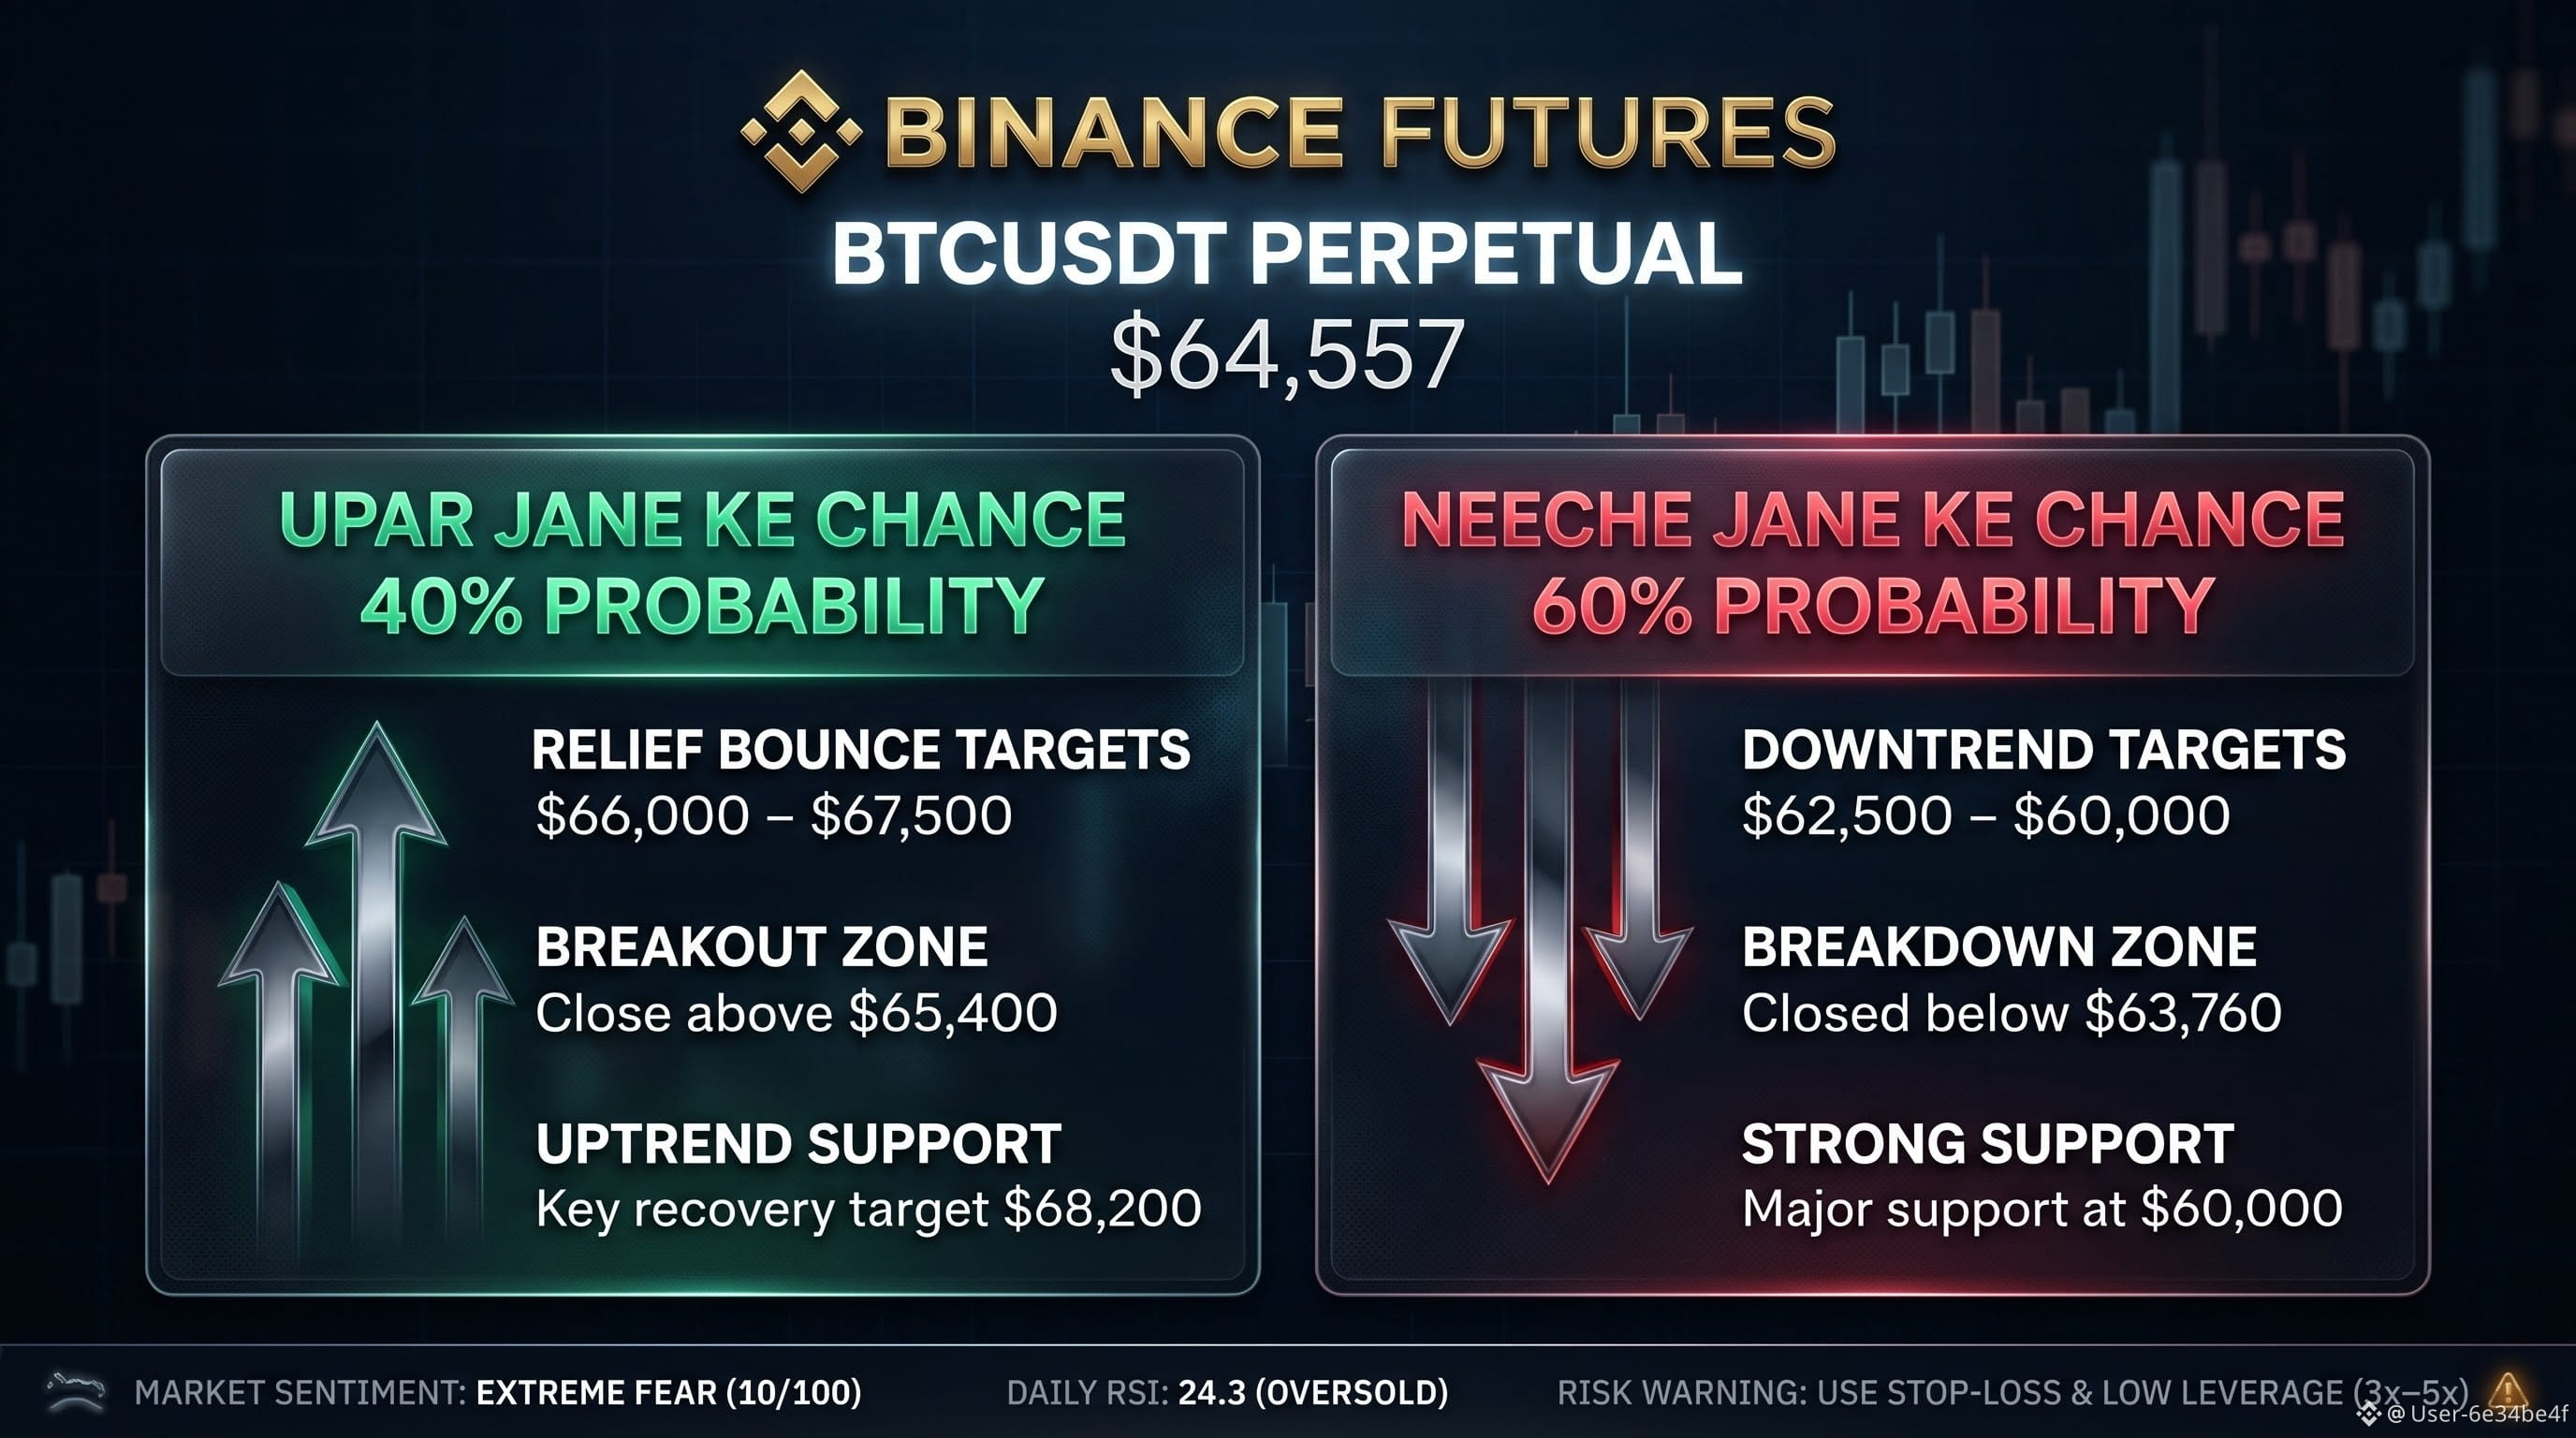
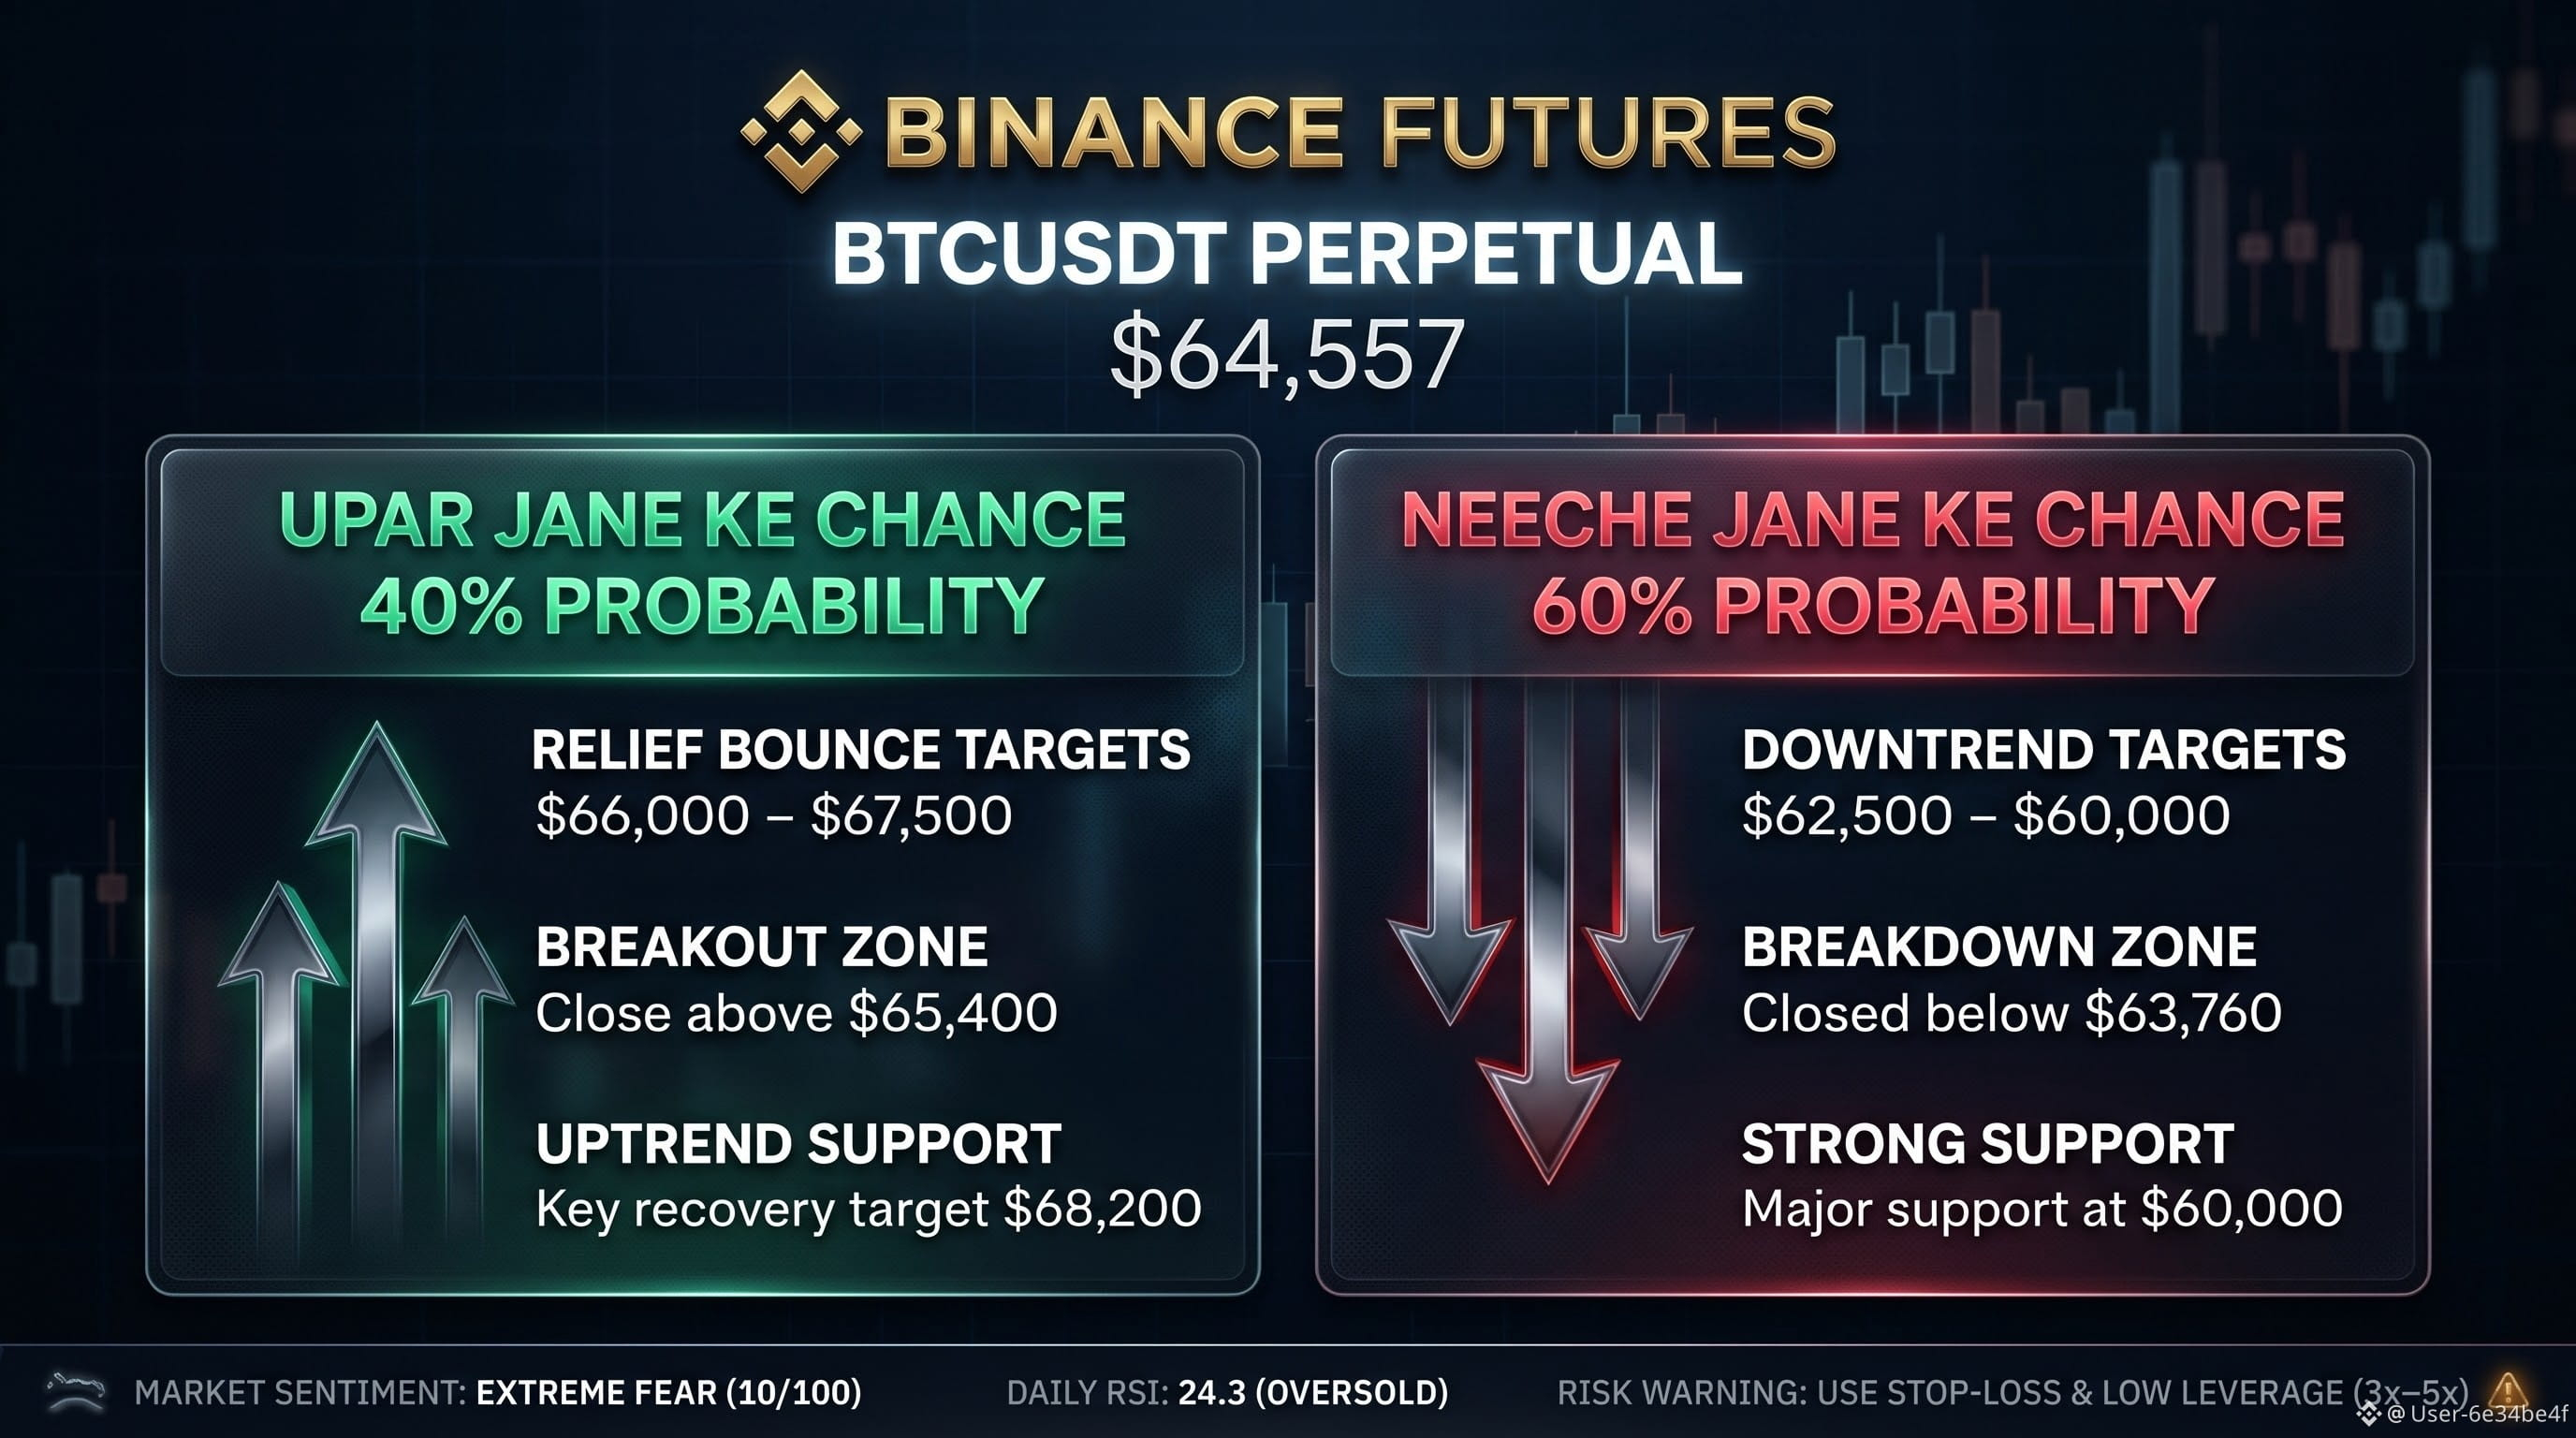
BTCUSDT Binance Futures trading analysis: Short-term trend highlights 60% probability of a downward move towards $62,500 – $60,000 if it breaks below $63,760, driven by bearish pressure and market fear. However, there is a 40% chance of a relief bounce towards $66,000 – $67,500 if it holds support or breaks above $65,400 due to oversold conditions (RSI 24.3). Strict risk management with stop-loss and low leverage is recommended.✨
BTCUSDT Binance Futures trading analysis: Short-term trend highlights 60% probability of a downward move towards $62,500 – $60,000 if it breaks below $63,760, driven by bearish pressure and market fear. However, there is a 40% chance of a relief bounce towards $66,000 – $67,500 if it holds support or breaks above $65,400 due to oversold conditions (RSI 24.3). Strict risk management with stop-loss and low leverage is recommended.✨
12
Log in to explore more content
Join global crypto users on Binance Square
⚡️ Get latest and useful information about crypto.
💬 Trusted by the world’s largest crypto exchange.
👍 Discover real insights from verified creators.
Email / Phone number
Trending Topics
NvidiaBeatsEstimatesWith$130BQ4Outlook
3,092 views
72 Discussing
Nvidia Beats With $115.8 Billion in Revenue, Guides to $130 Billion and Adds $150 Billion Buyback
Binance News
·26 Likes
·32.3k views
AnthropicIPOPriceCouldExceed$80
7,553 views
75 Discussing
CanNvidia’sDataCenterGrowthContinue?
17,244 views
308 Discussing