
周期幸存者老何
21 Posts

周期幸存者老何
Report
Block User
1 Following
0 Followers
21 Liked
Posts
·
--
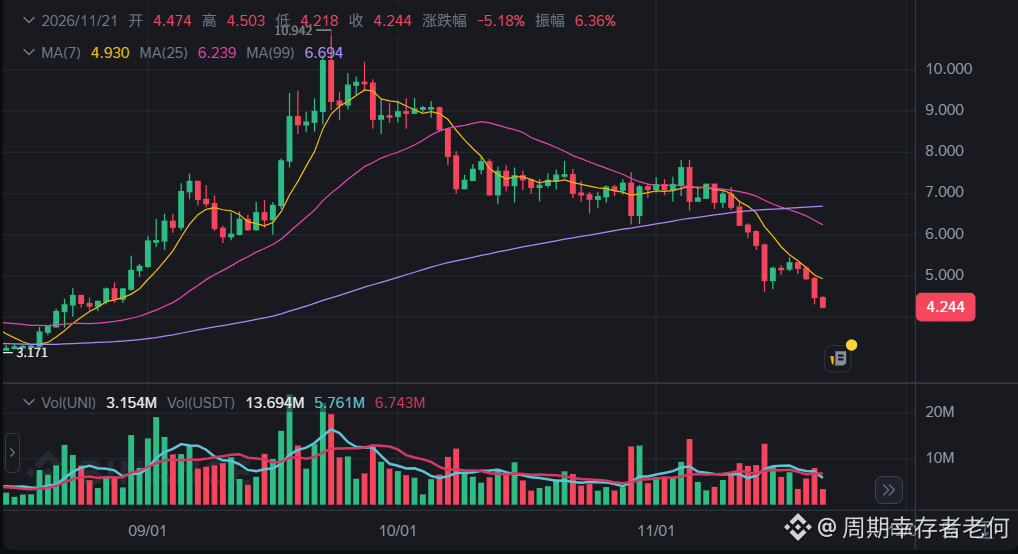
UNI (Uniswap) | Is there an opportunity after the decline?
Reference price
$4.47
24H -9.24%
Key levels to watch
$4.40 / $4.70
Trend analysis: UNI is a core token in the DEX sector, but its price is still under bearish pressure. A nearly 10% drop in a single day indicates significant selling pressure; don't assume that being oversold automatically means a reversal.
Entry timing: First watch for support near $4.40. Consider a small position after it stabilizes on the 4-hour chart; a more reliable rebound signal would be a high-volume move back above $4.70 that holds. Reassess if it falls below $4.40.
In a nutshell: UNI has fundamentals, but charts don't care about the story. Until buying interest appears, don't try to call the bottom for the market.#UNIUSDT #UNI
UNI (Uniswap) | Is there an opportunity after the decline?
Reference price
$4.47
24H -9.24%
Key levels to watch
$4.40 / $4.70
Trend analysis: UNI is a core token in the DEX sector, but its price is still under bearish pressure. A nearly 10% drop in a single day indicates significant selling pressure; don't assume that being oversold automatically means a reversal.
Entry timing: First watch for support near $4.40. Consider a small position after it stabilizes on the 4-hour chart; a more reliable rebound signal would be a high-volume move back above $4.70 that holds. Reassess if it falls below $4.40.
In a nutshell: UNI has fundamentals, but charts don't care about the story. Until buying interest appears, don't try to call the bottom for the market.#UNIUSDT #UNI
Reference price
$4.47
24H -9.24%
Key levels to watch
$4.40 / $4.70
Trend analysis: UNI is a core token in the DEX sector, but its price is still under bearish pressure. A nearly 10% drop in a single day indicates significant selling pressure; don't assume that being oversold automatically means a reversal.
Entry timing: First watch for support near $4.40. Consider a small position after it stabilizes on the 4-hour chart; a more reliable rebound signal would be a high-volume move back above $4.70 that holds. Reassess if it falls below $4.40.
In a nutshell: UNI has fundamentals, but charts don't care about the story. Until buying interest appears, don't try to call the bottom for the market.#UNIUSDT #UNI
7
·
--
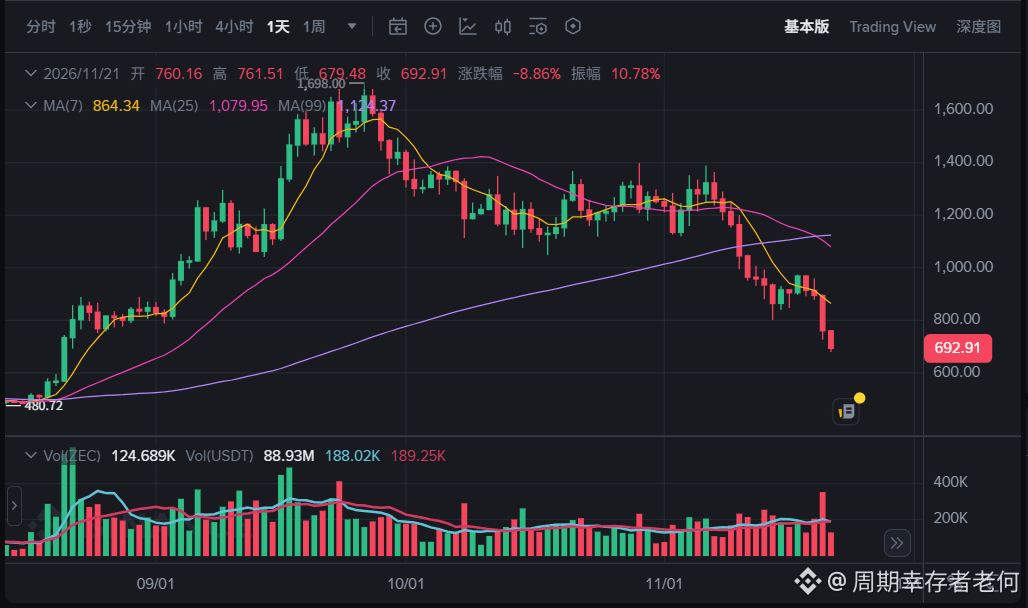
ZEC (Zcash) | Is there a chance of a rebound after the sharp drop?
Nov 21 | Spot market snapshot
$691.92 24H -19.18%
24H high: $859.29 24H low: $679.48
24H trading volume: $312 million Circulating market cap: approx. $11.74 billion
Price analysis: ZEC fell nearly 20% in a single day, with an intraday high-low range of about 26.5%, a classic high-volatility sell-off. Price action like this can lead to a rapid rebound, but it can also continue falling after a bounce. Don't assume that major players are accumulating just because the price has dropped sharply.
Entry assessment:
$680–700: Watch for buying support; consider a small position after the 4-hour chart shows signs of a bottom.
$730–750: A rebound is more worth watching if it reclaims this range on increased volume.
Below $679: Be alert for a further decline.
Around $800: If the rebound continues, watch for selling pressure above.
In a nutshell: The most tempting thing about ZEC right now is how far it has fallen—and that's also the most dangerous thing. The rebound could be sharp, but until there's confirmation that the price has bottomed, don't bet heavily that the sell-off is over. #ZECUSDT #ZEC.24小时交易策略
ZEC (Zcash) | Is there a chance of a rebound after the sharp drop?
Nov 21 | Spot market snapshot
$691.92 24H -19.18%
24H high: $859.29 24H low: $679.48
24H trading volume: $312 million Circulating market cap: approx. $11.74 billion
Price analysis: ZEC fell nearly 20% in a single day, with an intraday high-low range of about 26.5%, a classic high-volatility sell-off. Price action like this can lead to a rapid rebound, but it can also continue falling after a bounce. Don't assume that major players are accumulating just because the price has dropped sharply.
Entry assessment:
$680–700: Watch for buying support; consider a small position after the 4-hour chart shows signs of a bottom.
$730–750: A rebound is more worth watching if it reclaims this range on increased volume.
Below $679: Be alert for a further decline.
Around $800: If the rebound continues, watch for selling pressure above.
In a nutshell: The most tempting thing about ZEC right now is how far it has fallen—and that's also the most dangerous thing. The rebound could be sharp, but until there's confirmation that the price has bottomed, don't bet heavily that the sell-off is over. #ZECUSDT #ZEC.24小时交易策略
Nov 21 | Spot market snapshot
$691.92 24H -19.18%
24H high: $859.29 24H low: $679.48
24H trading volume: $312 million Circulating market cap: approx. $11.74 billion
Price analysis: ZEC fell nearly 20% in a single day, with an intraday high-low range of about 26.5%, a classic high-volatility sell-off. Price action like this can lead to a rapid rebound, but it can also continue falling after a bounce. Don't assume that major players are accumulating just because the price has dropped sharply.
Entry assessment:
$680–700: Watch for buying support; consider a small position after the 4-hour chart shows signs of a bottom.
$730–750: A rebound is more worth watching if it reclaims this range on increased volume.
Below $679: Be alert for a further decline.
Around $800: If the rebound continues, watch for selling pressure above.
In a nutshell: The most tempting thing about ZEC right now is how far it has fallen—and that's also the most dangerous thing. The rebound could be sharp, but until there's confirmation that the price has bottomed, don't bet heavily that the sell-off is over. #ZECUSDT #ZEC.24小时交易策略
108
·
--
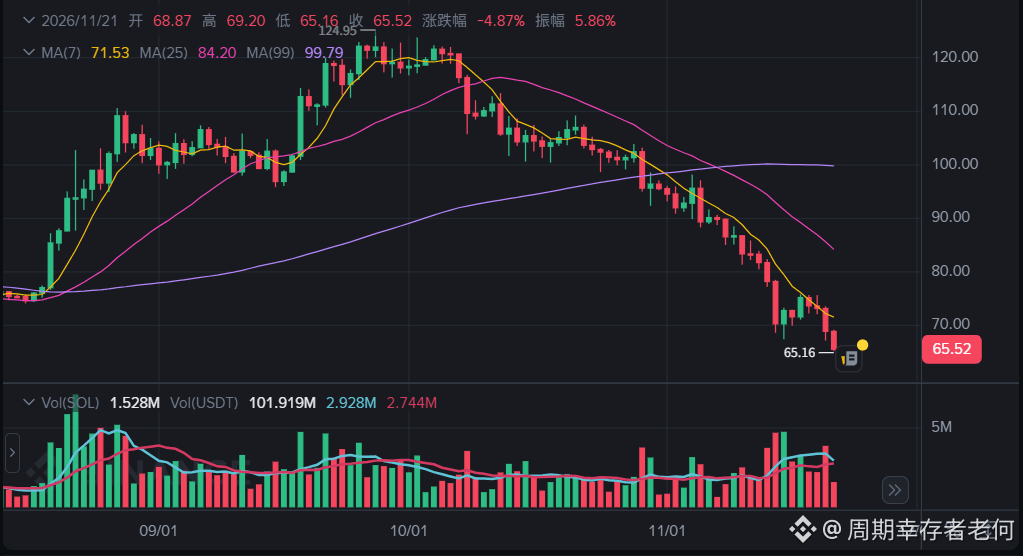
SOL (Solana) | Where could a rebound happen?
Nov 21 | Spot market snapshot
$65.50 24H -9.83%
24H high: $72.93 24H low: $65.44
24H trading volume: $294 million Circulating market cap: approx. $38.76 billion
Price analysis: SOL is down nearly 10%, with its price approaching the day’s low, indicating that short-term selling pressure remains heavy. High trading activity doesn’t necessarily mean buyers are in control; the key thing to watch now is whether sustained buying support emerges near $65.
Entry assessment:
$65–66: Watch for signs that the decline is stopping; don’t chase shorts or blindly buy the dip.
$69–70: After a high-volume recovery, watch whether the price holds on a pullback.
Below $65: Be alert for a further drop and wait for new support to form.
In a nutshell: SOL has room to rebound, but the market is still selling off. Keep an eye on the area around $65; wait for buyers to push the price back up before entering. #sol
SOL (Solana) | Where could a rebound happen?
Nov 21 | Spot market snapshot
$65.50 24H -9.83%
24H high: $72.93 24H low: $65.44
24H trading volume: $294 million Circulating market cap: approx. $38.76 billion
Price analysis: SOL is down nearly 10%, with its price approaching the day’s low, indicating that short-term selling pressure remains heavy. High trading activity doesn’t necessarily mean buyers are in control; the key thing to watch now is whether sustained buying support emerges near $65.
Entry assessment:
$65–66: Watch for signs that the decline is stopping; don’t chase shorts or blindly buy the dip.
$69–70: After a high-volume recovery, watch whether the price holds on a pullback.
Below $65: Be alert for a further drop and wait for new support to form.
In a nutshell: SOL has room to rebound, but the market is still selling off. Keep an eye on the area around $65; wait for buyers to push the price back up before entering. #sol
Nov 21 | Spot market snapshot
$65.50 24H -9.83%
24H high: $72.93 24H low: $65.44
24H trading volume: $294 million Circulating market cap: approx. $38.76 billion
Price analysis: SOL is down nearly 10%, with its price approaching the day’s low, indicating that short-term selling pressure remains heavy. High trading activity doesn’t necessarily mean buyers are in control; the key thing to watch now is whether sustained buying support emerges near $65.
Entry assessment:
$65–66: Watch for signs that the decline is stopping; don’t chase shorts or blindly buy the dip.
$69–70: After a high-volume recovery, watch whether the price holds on a pullback.
Below $65: Be alert for a further drop and wait for new support to form.
In a nutshell: SOL has room to rebound, but the market is still selling off. Keep an eye on the area around $65; wait for buyers to push the price back up before entering. #sol
121
·
--
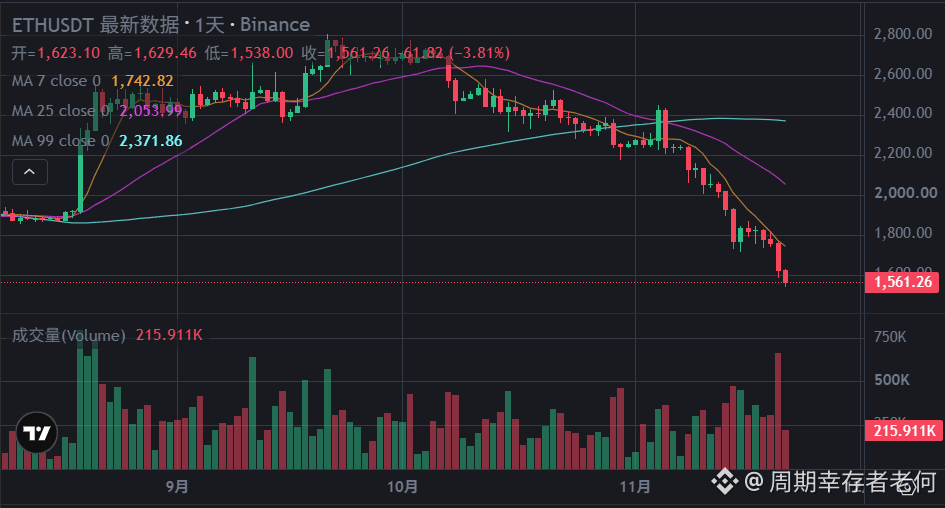
ETH (Ethereum) | Has the decline run its course?
November 21 CoinGlass
$1,565.10 24H -9.26%
24H high: $1,762.80 24H low: $1,536.10
7-day change: -11.53% Open interest: $20.77 billion
24H change in open interest: -8.56% 24H liquidations: approx. $540 million
Trend analysis: ETH is currently in a clear bearish trend. About $484 million in long positions were liquidated over the past 24 hours, and funds continue to pull out of futures markets. Funding rates have turned negative, indicating bearish market sentiment, but negative rates alone do not prove that a bottom has formed.
Entry assessment:
$1,535–1,550: Watch for the decline to stall; consider a small exploratory position after a 4-hour reversal pattern appears.
$1,620–1,650: Consider following the move only after price reclaims this range on increased volume and holds it on a retest.
Below $1,535: Be alert for a further decline.
In a nutshell: The biggest risk with ETH right now isn’t missing a rebound—it’s mistaking a pause in the decline for a bottom. I wouldn’t rush to take a large position before it reclaims $1,650.#ETH #ETHETFsApproved
ETH (Ethereum) | Has the decline run its course?
November 21 CoinGlass
$1,565.10 24H -9.26%
24H high: $1,762.80 24H low: $1,536.10
7-day change: -11.53% Open interest: $20.77 billion
24H change in open interest: -8.56% 24H liquidations: approx. $540 million
Trend analysis: ETH is currently in a clear bearish trend. About $484 million in long positions were liquidated over the past 24 hours, and funds continue to pull out of futures markets. Funding rates have turned negative, indicating bearish market sentiment, but negative rates alone do not prove that a bottom has formed.
Entry assessment:
$1,535–1,550: Watch for the decline to stall; consider a small exploratory position after a 4-hour reversal pattern appears.
$1,620–1,650: Consider following the move only after price reclaims this range on increased volume and holds it on a retest.
Below $1,535: Be alert for a further decline.
In a nutshell: The biggest risk with ETH right now isn’t missing a rebound—it’s mistaking a pause in the decline for a bottom. I wouldn’t rush to take a large position before it reclaims $1,650.#ETH #ETHETFsApproved
November 21 CoinGlass
$1,565.10 24H -9.26%
24H high: $1,762.80 24H low: $1,536.10
7-day change: -11.53% Open interest: $20.77 billion
24H change in open interest: -8.56% 24H liquidations: approx. $540 million
Trend analysis: ETH is currently in a clear bearish trend. About $484 million in long positions were liquidated over the past 24 hours, and funds continue to pull out of futures markets. Funding rates have turned negative, indicating bearish market sentiment, but negative rates alone do not prove that a bottom has formed.
Entry assessment:
$1,535–1,550: Watch for the decline to stall; consider a small exploratory position after a 4-hour reversal pattern appears.
$1,620–1,650: Consider following the move only after price reclaims this range on increased volume and holds it on a retest.
Below $1,535: Be alert for a further decline.
In a nutshell: The biggest risk with ETH right now isn’t missing a rebound—it’s mistaking a pause in the decline for a bottom. I wouldn’t rush to take a large position before it reclaims $1,650.#ETH #ETHETFsApproved
210
·
--
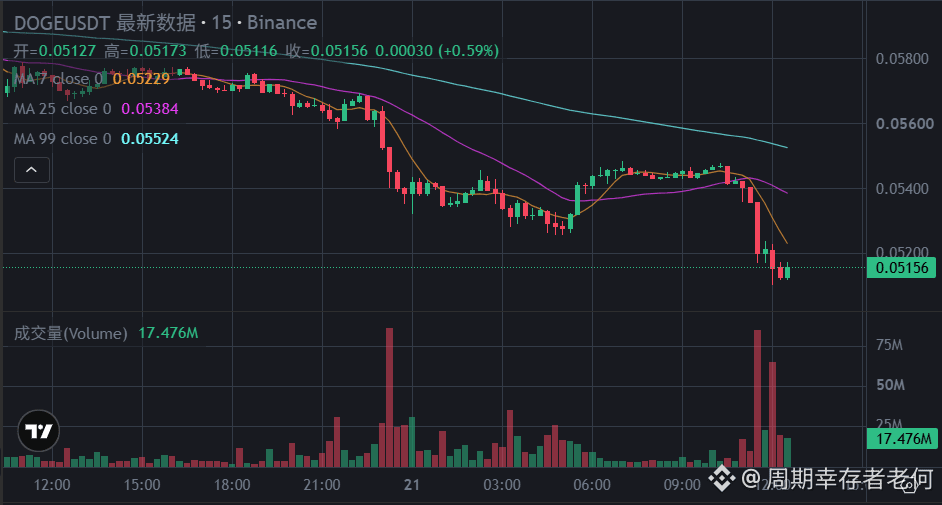
DOGE (Dogecoin) | Short-Term Entry Analysis
November 21, 2026 | Latest Market Snapshot
$0.05419
24H -5.8%
7-day decline -17.4%
24H trading volume: $668 million DOGE
Bears are still in control. The high-volume decline indicates considerable selling pressure, and there is no clear reversal signal for now.
Entry suggestions:
$0.0525–0.0535: Watch for the price to stop falling; test the waters with a small position.
Break above $0.0585: Consider following through only after it holds above this level on increased volume.
Fall below $0.0525: Beware of further downside.
In a nutshell: DOGE doesn’t lack hype; it lacks sustained buying. Entering now means trying to catch a falling knife against the trend. Wait for $0.0585 to hold before treating it as a genuine rebound opportunity. Better to miss part of the move than rush in too soon.
#DOGE #ETH #zec
DOGE (Dogecoin) | Short-Term Entry Analysis
November 21, 2026 | Latest Market Snapshot
$0.05419
24H -5.8%
7-day decline -17.4%
24H trading volume: $668 million DOGE
Bears are still in control. The high-volume decline indicates considerable selling pressure, and there is no clear reversal signal for now.
Entry suggestions:
$0.0525–0.0535: Watch for the price to stop falling; test the waters with a small position.
Break above $0.0585: Consider following through only after it holds above this level on increased volume.
Fall below $0.0525: Beware of further downside.
In a nutshell: DOGE doesn’t lack hype; it lacks sustained buying. Entering now means trying to catch a falling knife against the trend. Wait for $0.0585 to hold before treating it as a genuine rebound opportunity. Better to miss part of the move than rush in too soon.
#DOGE #ETH #zec
November 21, 2026 | Latest Market Snapshot
$0.05419
24H -5.8%
7-day decline -17.4%
24H trading volume: $668 million DOGE
Bears are still in control. The high-volume decline indicates considerable selling pressure, and there is no clear reversal signal for now.
Entry suggestions:
$0.0525–0.0535: Watch for the price to stop falling; test the waters with a small position.
Break above $0.0585: Consider following through only after it holds above this level on increased volume.
Fall below $0.0525: Beware of further downside.
In a nutshell: DOGE doesn’t lack hype; it lacks sustained buying. Entering now means trying to catch a falling knife against the trend. Wait for $0.0585 to hold before treating it as a genuine rebound opportunity. Better to miss part of the move than rush in too soon.
#DOGE #ETH #zec
18
·
--
Bullish
#NVDAB #bnb #BTC
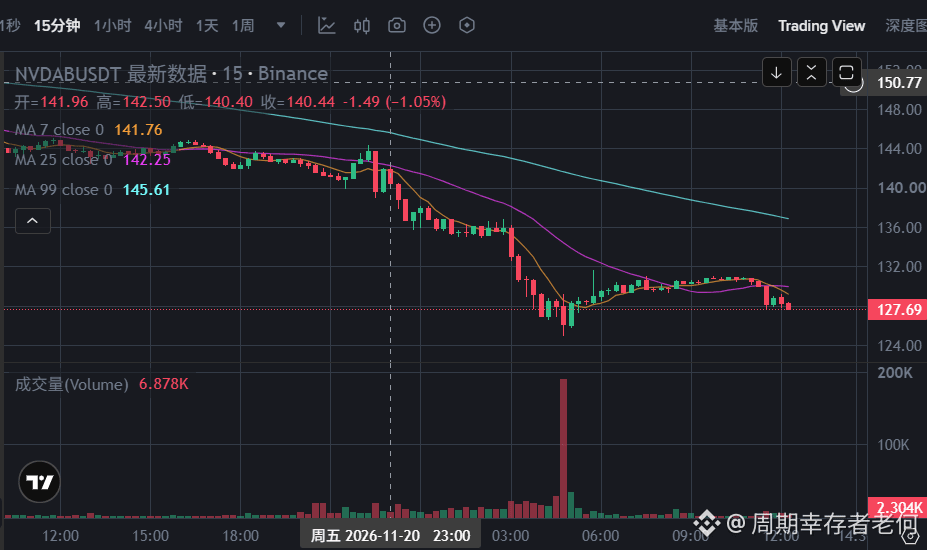
NVDAB Trend Analysis | Is It Time to Buy the Dip?
November 21, 2026
24H -10.39%
24H High $146.46
24H Low $125.09
Trading volume approx. $170 million
NVDAB is not an ordinary altcoin, but a tokenized product representing Nvidia stock. It is clearly in a downtrend, and active trading does not mean major players are accumulating.
Entry suggestions:
$125–128: Watch for the decline to stabilize; test the waters with a small position.
Break above $140–145: Consider following the trend only after it holds with increased volume.
Fall below $125: Be alert for further declines; don't blindly average down.
These are observation levels derived from recent price movements.
In a nutshell: What really matters for NVDAB is Nvidia's share price and sentiment in the U.S. tech sector. Buying the dip now means trying to catch a falling knife. Better to wait for it to hold above $145 than rush to bet that $125 is the bottom.
#NVDAB #bnb #BTC
NVDAB Trend Analysis | Is It Time to Buy the Dip?
November 21, 2026
24H -10.39%
24H High $146.46
24H Low $125.09
Trading volume approx. $170 million
NVDAB is not an ordinary altcoin, but a tokenized product representing Nvidia stock. It is clearly in a downtrend, and active trading does not mean major players are accumulating.
Entry suggestions:
$125–128: Watch for the decline to stabilize; test the waters with a small position.
Break above $140–145: Consider following the trend only after it holds with increased volume.
Fall below $125: Be alert for further declines; don't blindly average down.
These are observation levels derived from recent price movements.
In a nutshell: What really matters for NVDAB is Nvidia's share price and sentiment in the U.S. tech sector. Buying the dip now means trying to catch a falling knife. Better to wait for it to hold above $145 than rush to bet that $125 is the bottom.
NVDAB Trend Analysis | Is It Time to Buy the Dip?
November 21, 2026
24H -10.39%
24H High $146.46
24H Low $125.09
Trading volume approx. $170 million
NVDAB is not an ordinary altcoin, but a tokenized product representing Nvidia stock. It is clearly in a downtrend, and active trading does not mean major players are accumulating.
Entry suggestions:
$125–128: Watch for the decline to stabilize; test the waters with a small position.
Break above $140–145: Consider following the trend only after it holds with increased volume.
Fall below $125: Be alert for further declines; don't blindly average down.
These are observation levels derived from recent price movements.
In a nutshell: What really matters for NVDAB is Nvidia's share price and sentiment in the U.S. tech sector. Buying the dip now means trying to catch a falling knife. Better to wait for it to hold above $145 than rush to bet that $125 is the bottom.
91
·
--
JUV (Juventus Fan Token) Short-Term Entry Analysis
Latest price: ¥0.2171
1. 24-hour decline: -5.9%
2. 7-day decline: -10%
3. 24-hour trading volume: approximately $720,000.
Key takeaway: JUV remains weak and in a downtrend, with insufficient buying support and no clear short-term reversal signals.
Entry suggestions:
1. ¥0.213–0.216: Watch for the decline to stabilize; try a small position.
2. Break above ¥0.233: Consider following only after it holds with increased volume.
3. Fall below ¥0.213: Be alert to further declines.
In a nutshell: Low-cap fan tokens like JUV are driven by sentiment and lack sustained buying pressure. Buying the dip now is a bet on a rebound; waiting for it to hold above $0.233 looks more like trend-following. Better to miss some gains than rush in and catch a falling knife.
#JUV🔥 #SNXXB #SOXLB
JUV (Juventus Fan Token) Short-Term Entry Analysis
Latest price: ¥0.2171
1. 24-hour decline: -5.9%
2. 7-day decline: -10%
3. 24-hour trading volume: approximately $720,000.
Key takeaway: JUV remains weak and in a downtrend, with insufficient buying support and no clear short-term reversal signals.
Entry suggestions:
1. ¥0.213–0.216: Watch for the decline to stabilize; try a small position.
2. Break above ¥0.233: Consider following only after it holds with increased volume.
3. Fall below ¥0.213: Be alert to further declines.
In a nutshell: Low-cap fan tokens like JUV are driven by sentiment and lack sustained buying pressure. Buying the dip now is a bet on a rebound; waiting for it to hold above $0.233 looks more like trend-following. Better to miss some gains than rush in and catch a falling knife.
#JUV🔥 #SNXXB #SOXLB
Latest price: ¥0.2171
1. 24-hour decline: -5.9%
2. 7-day decline: -10%
3. 24-hour trading volume: approximately $720,000.
Key takeaway: JUV remains weak and in a downtrend, with insufficient buying support and no clear short-term reversal signals.
Entry suggestions:
1. ¥0.213–0.216: Watch for the decline to stabilize; try a small position.
2. Break above ¥0.233: Consider following only after it holds with increased volume.
3. Fall below ¥0.213: Be alert to further declines.
In a nutshell: Low-cap fan tokens like JUV are driven by sentiment and lack sustained buying pressure. Buying the dip now is a bet on a rebound; waiting for it to hold above $0.233 looks more like trend-following. Better to miss some gains than rush in and catch a falling knife.
#JUV🔥 #SNXXB #SOXLB
32
·
--
ATM Short-Term Analysis: It’s Still Too Early to Buy the Dip
ATM is currently around $0.6687, down 5.16% in 24 hours and 33% over the past 30 days. The trend is weak, buying support is insufficient, and no clear reversal signals have emerged.
Entry suggestions:
1. $0.64–$0.66: Try a small position after the price stabilizes.
2. Break above $0.73: Consider following only after a high-volume breakout holds.
3. Fall below $0.64: Be wary of further declines.
In a nutshell: ATM is not in an accumulation phase right now; it’s weakly trying to form a bottom. Don’t rush to buy the dip—waiting for funds to enter is more reliable than trying to guess the bottom.
#ATM
ATM Short-Term Analysis: It’s Still Too Early to Buy the Dip
ATM is currently around $0.6687, down 5.16% in 24 hours and 33% over the past 30 days. The trend is weak, buying support is insufficient, and no clear reversal signals have emerged.
Entry suggestions:
1. $0.64–$0.66: Try a small position after the price stabilizes.
2. Break above $0.73: Consider following only after a high-volume breakout holds.
3. Fall below $0.64: Be wary of further declines.
In a nutshell: ATM is not in an accumulation phase right now; it’s weakly trying to form a bottom. Don’t rush to buy the dip—waiting for funds to enter is more reliable than trying to guess the bottom.
#ATM
ATM is currently around $0.6687, down 5.16% in 24 hours and 33% over the past 30 days. The trend is weak, buying support is insufficient, and no clear reversal signals have emerged.
Entry suggestions:
1. $0.64–$0.66: Try a small position after the price stabilizes.
2. Break above $0.73: Consider following only after a high-volume breakout holds.
3. Fall below $0.64: Be wary of further declines.
In a nutshell: ATM is not in an accumulation phase right now; it’s weakly trying to form a bottom. Don’t rush to buy the dip—waiting for funds to enter is more reliable than trying to guess the bottom.
#ATM
1
70
·
--
ZEC (Zcash) price analysis: Is it a good time to buy the dip?
The current move in ZEC isn't an ordinary pullback; it's a mass exit by highly leveraged traders.
The 24-hour futures trading volume is $6.53 billion, 10 times the spot trading volume. Open interest fell by 14.63%, and long liquidations totaled about $35.79 million. This indicates that the decline has come with a significant flush of leveraged positions. There may be room for a short-term bounce, but it's too early to call a reversal.
My entry plan:
1. ¥725–740: Watch for the price to stop falling. Only consider a small test position after it stabilizes on the 4-hour chart.
2. ¥780–800: A breakout on strong volume that holds above this range would make a short-term rebound more convincing.
3. Below ¥725: Be alert to a further drop; don't blindly add to your position.
4. ¥850–900: If the rebound continues, pay close attention to selling pressure above.
These are observation ranges based on recent price action, not definitive support or resistance levels.
In short: What ZEC has no shortage of right now is people trying to buy the dip; what's missing is real money willing to keep stepping in. I’m in no rush to enter around $750. I’d rather wait for it to hold above $800 before considering a position than bet that $725 is definitely the bottom.
#zec
ZEC (Zcash) price analysis: Is it a good time to buy the dip?
The current move in ZEC isn't an ordinary pullback; it's a mass exit by highly leveraged traders.
The 24-hour futures trading volume is $6.53 billion, 10 times the spot trading volume. Open interest fell by 14.63%, and long liquidations totaled about $35.79 million. This indicates that the decline has come with a significant flush of leveraged positions. There may be room for a short-term bounce, but it's too early to call a reversal.
My entry plan:
1. ¥725–740: Watch for the price to stop falling. Only consider a small test position after it stabilizes on the 4-hour chart.
2. ¥780–800: A breakout on strong volume that holds above this range would make a short-term rebound more convincing.
3. Below ¥725: Be alert to a further drop; don't blindly add to your position.
4. ¥850–900: If the rebound continues, pay close attention to selling pressure above.
These are observation ranges based on recent price action, not definitive support or resistance levels.
In short: What ZEC has no shortage of right now is people trying to buy the dip; what's missing is real money willing to keep stepping in. I’m in no rush to enter around $750. I’d rather wait for it to hold above $800 before considering a position than bet that $725 is definitely the bottom.
#zec
The current move in ZEC isn't an ordinary pullback; it's a mass exit by highly leveraged traders.
The 24-hour futures trading volume is $6.53 billion, 10 times the spot trading volume. Open interest fell by 14.63%, and long liquidations totaled about $35.79 million. This indicates that the decline has come with a significant flush of leveraged positions. There may be room for a short-term bounce, but it's too early to call a reversal.
My entry plan:
1. ¥725–740: Watch for the price to stop falling. Only consider a small test position after it stabilizes on the 4-hour chart.
2. ¥780–800: A breakout on strong volume that holds above this range would make a short-term rebound more convincing.
3. Below ¥725: Be alert to a further drop; don't blindly add to your position.
4. ¥850–900: If the rebound continues, pay close attention to selling pressure above.
These are observation ranges based on recent price action, not definitive support or resistance levels.
In short: What ZEC has no shortage of right now is people trying to buy the dip; what's missing is real money willing to keep stepping in. I’m in no rush to enter around $750. I’d rather wait for it to hold above $800 before considering a position than bet that $725 is definitely the bottom.
#zec
1
69
·
--
SC (Siacoin) trend analysis | Is now a good time to buy the dip?
November 21, 2026
SC is currently in a weak downtrend, not at a confirmed bottom.
It has fallen about 10% over the past 7 days and more than 30% over the past 30 days. Although there may be room for a short-term oversold bounce, the overall trend remains bearish. Increased trading volume has not led to a sustained rise, suggesting selling pressure has not yet been fully absorbed.
My entry assessment:
1: $0.00053–$0.00054: Watch for support; consider a small position only after it stabilizes on the 4-hour chart.
2: $0.000058–$0.00060: A more reliable short-term opportunity would require a breakout on increased volume and the price holding above this range.
3: Below $0.000526: Be alert for further declines; don't add to your position blindly.
These are observation ranges derived from recent highs and lows.
In short: SC has fallen a lot, but the market has yet to show a clear reversal signal. Entering now means betting on a bottom; entering after it holds above $0.00058 means trading with the trend. It's better to miss some of the first leg up than to catch the final leg down.
#SC
SC (Siacoin) trend analysis | Is now a good time to buy the dip?
November 21, 2026
SC is currently in a weak downtrend, not at a confirmed bottom.
It has fallen about 10% over the past 7 days and more than 30% over the past 30 days. Although there may be room for a short-term oversold bounce, the overall trend remains bearish. Increased trading volume has not led to a sustained rise, suggesting selling pressure has not yet been fully absorbed.
My entry assessment:
1: $0.00053–$0.00054: Watch for support; consider a small position only after it stabilizes on the 4-hour chart.
2: $0.000058–$0.00060: A more reliable short-term opportunity would require a breakout on increased volume and the price holding above this range.
3: Below $0.000526: Be alert for further declines; don't add to your position blindly.
These are observation ranges derived from recent highs and lows.
In short: SC has fallen a lot, but the market has yet to show a clear reversal signal. Entering now means betting on a bottom; entering after it holds above $0.00058 means trading with the trend. It's better to miss some of the first leg up than to catch the final leg down.
#SC
November 21, 2026
SC is currently in a weak downtrend, not at a confirmed bottom.
It has fallen about 10% over the past 7 days and more than 30% over the past 30 days. Although there may be room for a short-term oversold bounce, the overall trend remains bearish. Increased trading volume has not led to a sustained rise, suggesting selling pressure has not yet been fully absorbed.
My entry assessment:
1: $0.00053–$0.00054: Watch for support; consider a small position only after it stabilizes on the 4-hour chart.
2: $0.000058–$0.00060: A more reliable short-term opportunity would require a breakout on increased volume and the price holding above this range.
3: Below $0.000526: Be alert for further declines; don't add to your position blindly.
These are observation ranges derived from recent highs and lows.
In short: SC has fallen a lot, but the market has yet to show a clear reversal signal. Entering now means betting on a bottom; entering after it holds above $0.00058 means trading with the trend. It's better to miss some of the first leg up than to catch the final leg down.
#SC
1
102
·
--
#uvxyb
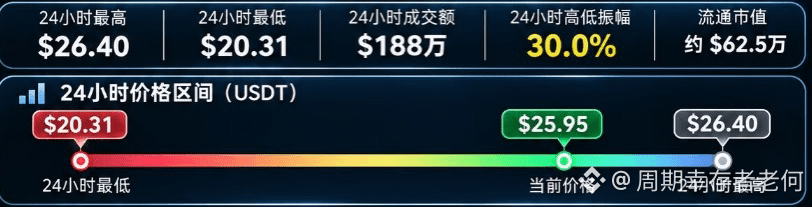
UVXYB Price Analysis | After the Surge, Is It Still Worth Getting In?
November 20, 2026 | Binance UVXYB/USDT | Latest Snapshot
$25.95 +24.19% (24H)
24H High
$26.40
24H Low
$20.31
24H Trading Volume
$1.88 million
24H Range
Approx. 30.0%
Circulating Market Cap
$625,000
All-Time High
$26.40
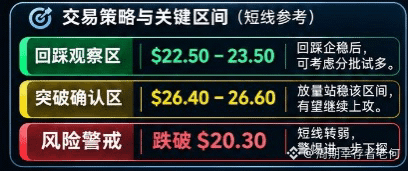
UVXYB is currently surging on fear-driven market momentum, but it is already near the day's high, making the risk of chasing the rally notably high.
First, understand that this isn't an ordinary altcoin. It's a tokenized product linked to the ProShares Ultra VIX Short-Term Futures ETF (UVXY). Its price is driven mainly by short-term VIX futures, not by hype around a crypto project. If market fears intensify, it could surge quickly; if they fade, it could give back those gains just as fast.
In a nutshell: with an asset like UVXYB, you're not buying long-term value—you're buying market fear. After a 24% gain, the risk-reward for chasing it is no longer attractive. I'd rather wait for a pullback and confirmation than bet on another sharp surge near the day's high.
Also keep in mind that UVXY itself is subject to futures roll decay and the effects of daily leveraged compounding, making it unsuitable for a simple long-term hold. The tokenized product also carries risks related to trading premiums, liquidity, and regional access.
#uvxyb
UVXYB Price Analysis | After the Surge, Is It Still Worth Getting In?
November 20, 2026 | Binance UVXYB/USDT | Latest Snapshot
$25.95 +24.19% (24H)
24H High
$26.40
24H Low
$20.31
24H Trading Volume
$1.88 million
24H Range
Approx. 30.0%
Circulating Market Cap
$625,000
All-Time High
$26.40
UVXYB is currently surging on fear-driven market momentum, but it is already near the day's high, making the risk of chasing the rally notably high.
First, understand that this isn't an ordinary altcoin. It's a tokenized product linked to the ProShares Ultra VIX Short-Term Futures ETF (UVXY). Its price is driven mainly by short-term VIX futures, not by hype around a crypto project. If market fears intensify, it could surge quickly; if they fade, it could give back those gains just as fast.
In a nutshell: with an asset like UVXYB, you're not buying long-term value—you're buying market fear. After a 24% gain, the risk-reward for chasing it is no longer attractive. I'd rather wait for a pullback and confirmation than bet on another sharp surge near the day's high.
Also keep in mind that UVXY itself is subject to futures roll decay and the effects of daily leveraged compounding, making it unsuitable for a simple long-term hold. The tokenized product also carries risks related to trading premiums, liquidity, and regional access.
UVXYB Price Analysis | After the Surge, Is It Still Worth Getting In?
November 20, 2026 | Binance UVXYB/USDT | Latest Snapshot
$25.95 +24.19% (24H)
24H High
$26.40
24H Low
$20.31
24H Trading Volume
$1.88 million
24H Range
Approx. 30.0%
Circulating Market Cap
$625,000
All-Time High
$26.40
UVXYB is currently surging on fear-driven market momentum, but it is already near the day's high, making the risk of chasing the rally notably high.
First, understand that this isn't an ordinary altcoin. It's a tokenized product linked to the ProShares Ultra VIX Short-Term Futures ETF (UVXY). Its price is driven mainly by short-term VIX futures, not by hype around a crypto project. If market fears intensify, it could surge quickly; if they fade, it could give back those gains just as fast.
In a nutshell: with an asset like UVXYB, you're not buying long-term value—you're buying market fear. After a 24% gain, the risk-reward for chasing it is no longer attractive. I'd rather wait for a pullback and confirmation than bet on another sharp surge near the day's high.
Also keep in mind that UVXY itself is subject to futures roll decay and the effects of daily leveraged compounding, making it unsuitable for a simple long-term hold. The tokenized product also carries risks related to trading premiums, liquidity, and regional access.
1
23
·
--
#snxxb
SNXXB Price Analysis | After the Crash, Is It Time to Buy the Dip?
November 20, 2026 | Binance SNXXB/USDT
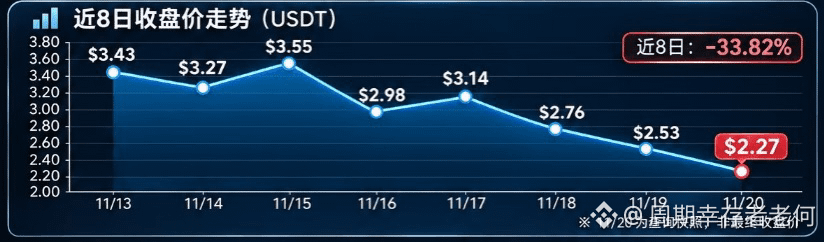
$2.27 -22.26% (24H)
24H Low
$2.20
24H High
$3.22
24H Trading Volume
$8.32 million
7-Day Change
-42.68%
30-Day Change
-75.80%
24H Range
46.36%
SNXXB is severely oversold, but a bottom has not yet been confirmed.
This isn't an ordinary altcoin. It's a tokenized product tracking the Tradr 2X Long SNDK Daily ETF, an ETF that provides daily 2x leveraged long exposure to SanDisk. Its price is affected by the U.S. semiconductor and storage sectors, so it can't be analyzed solely through the lens of crypto market flows.
The 1-hour RSI is currently around 20.9, and the daily RSI is around 27.7. Short-term oversold conditions are clear, but being oversold only means the price has fallen sharply—it doesn't mean a reversal is imminent.
My entry outlook:
$2.20–2.30: Watch for signs of stabilization; don't blindly try to catch a falling knife just yet.
$2.50–2.60: If it holds above this range on strong 4-hour volume and a pullback holds, consider a small position as a test.
Below $2.20: Be alert for further new lows; don't add to your position against the trend.
$2.75–3.00: An area to watch closely for selling pressure after a rebound.
These are trading levels inferred from recent price action, not confirmed support levels or price targets.
In short: After falling over 40% in 7 days and over 75% in 30 days, this kind of market is prone to both violent rebounds and trapping dip buyers halfway down. I'd rather wait for confirmation above $2.50 than rush to bet that $2.20 is the bottom.
#snxxb
SNXXB Price Analysis | After the Crash, Is It Time to Buy the Dip?
November 20, 2026 | Binance SNXXB/USDT
$2.27 -22.26% (24H)
24H Low
$2.20
24H High
$3.22
24H Trading Volume
$8.32 million
7-Day Change
-42.68%
30-Day Change
-75.80%
24H Range
46.36%
SNXXB is severely oversold, but a bottom has not yet been confirmed.
This isn't an ordinary altcoin. It's a tokenized product tracking the Tradr 2X Long SNDK Daily ETF, an ETF that provides daily 2x leveraged long exposure to SanDisk. Its price is affected by the U.S. semiconductor and storage sectors, so it can't be analyzed solely through the lens of crypto market flows.
The 1-hour RSI is currently around 20.9, and the daily RSI is around 27.7. Short-term oversold conditions are clear, but being oversold only means the price has fallen sharply—it doesn't mean a reversal is imminent.
My entry outlook:
$2.20–2.30: Watch for signs of stabilization; don't blindly try to catch a falling knife just yet.
$2.50–2.60: If it holds above this range on strong 4-hour volume and a pullback holds, consider a small position as a test.
Below $2.20: Be alert for further new lows; don't add to your position against the trend.
$2.75–3.00: An area to watch closely for selling pressure after a rebound.
These are trading levels inferred from recent price action, not confirmed support levels or price targets.
In short: After falling over 40% in 7 days and over 75% in 30 days, this kind of market is prone to both violent rebounds and trapping dip buyers halfway down. I'd rather wait for confirmation above $2.50 than rush to bet that $2.20 is the bottom.
SNXXB Price Analysis | After the Crash, Is It Time to Buy the Dip?
November 20, 2026 | Binance SNXXB/USDT
$2.27 -22.26% (24H)
24H Low
$2.20
24H High
$3.22
24H Trading Volume
$8.32 million
7-Day Change
-42.68%
30-Day Change
-75.80%
24H Range
46.36%
SNXXB is severely oversold, but a bottom has not yet been confirmed.
This isn't an ordinary altcoin. It's a tokenized product tracking the Tradr 2X Long SNDK Daily ETF, an ETF that provides daily 2x leveraged long exposure to SanDisk. Its price is affected by the U.S. semiconductor and storage sectors, so it can't be analyzed solely through the lens of crypto market flows.
The 1-hour RSI is currently around 20.9, and the daily RSI is around 27.7. Short-term oversold conditions are clear, but being oversold only means the price has fallen sharply—it doesn't mean a reversal is imminent.
My entry outlook:
$2.20–2.30: Watch for signs of stabilization; don't blindly try to catch a falling knife just yet.
$2.50–2.60: If it holds above this range on strong 4-hour volume and a pullback holds, consider a small position as a test.
Below $2.20: Be alert for further new lows; don't add to your position against the trend.
$2.75–3.00: An area to watch closely for selling pressure after a rebound.
These are trading levels inferred from recent price action, not confirmed support levels or price targets.
In short: After falling over 40% in 7 days and over 75% in 30 days, this kind of market is prone to both violent rebounds and trapping dip buyers halfway down. I'd rather wait for confirmation above $2.50 than rush to bet that $2.20 is the bottom.
1
567
·
--
#SOXLB
SOXLB Trend Analysis | Is It Time to Buy the Dip?
November 20, 2026 | Binance SOXLB/USDT | Market Snapshot
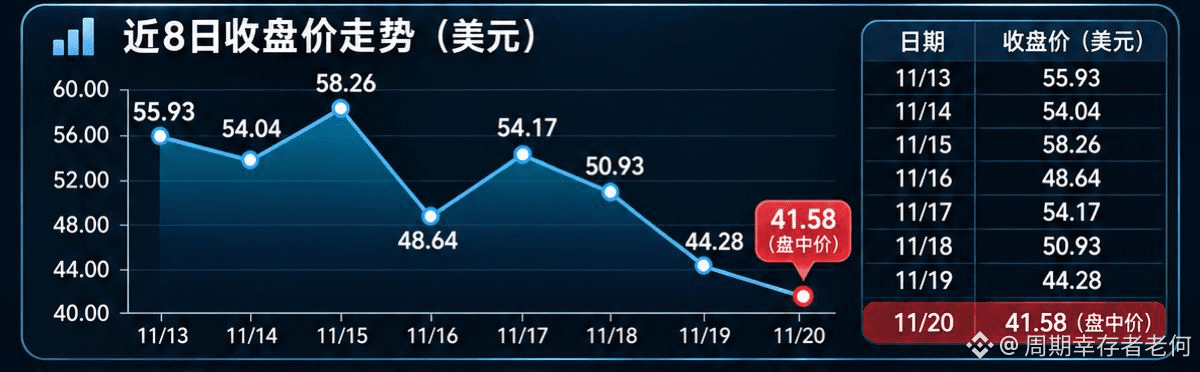
$41.58 Daily -6.10%
Day's high
$44.82
Day's low
$41.41
November 19 decline
-13.06%
SOXLB is currently in a weak downtrend; this is not a confirmed buying opportunity.
This is essentially a tokenized product linked to a 3x leveraged long semiconductor ETF, not an ordinary altcoin. If the semiconductor sector continues to correct, its losses will be magnified. It plunged 37.67% in a single day on November 5, then fell another 13.06% on November 19, showing just how volatile the market is.
My entry assessment:
$39–41: Watch closely for support near the previous low; only consider a small position after a clear sign that the decline has stopped.
$44.8–46.6: A sustained move back above this range would increase confidence that short-term momentum is turning bullish.
Below $38.9: If support at the previous low gives way, beware of further downside and don't average down blindly.
These price levels are observational ranges derived from recent highs and lows, not confirmed support levels.
In a nutshell: With a 3x leveraged product like SOXLB, a big drop doesn't mean it's cheap. I wouldn't rush to catch a falling knife right now. First, I'll see whether it can hold $39–41, or wait for strength to be confirmed above $46.6 before acting!
#SOXLB
SOXLB Trend Analysis | Is It Time to Buy the Dip?
November 20, 2026 | Binance SOXLB/USDT | Market Snapshot
$41.58 Daily -6.10%
Day's high
$44.82
Day's low
$41.41
November 19 decline
-13.06%
SOXLB is currently in a weak downtrend; this is not a confirmed buying opportunity.
This is essentially a tokenized product linked to a 3x leveraged long semiconductor ETF, not an ordinary altcoin. If the semiconductor sector continues to correct, its losses will be magnified. It plunged 37.67% in a single day on November 5, then fell another 13.06% on November 19, showing just how volatile the market is.
My entry assessment:
$39–41: Watch closely for support near the previous low; only consider a small position after a clear sign that the decline has stopped.
$44.8–46.6: A sustained move back above this range would increase confidence that short-term momentum is turning bullish.
Below $38.9: If support at the previous low gives way, beware of further downside and don't average down blindly.
These price levels are observational ranges derived from recent highs and lows, not confirmed support levels.
In a nutshell: With a 3x leveraged product like SOXLB, a big drop doesn't mean it's cheap. I wouldn't rush to catch a falling knife right now. First, I'll see whether it can hold $39–41, or wait for strength to be confirmed above $46.6 before acting!
SOXLB Trend Analysis | Is It Time to Buy the Dip?
November 20, 2026 | Binance SOXLB/USDT | Market Snapshot
$41.58 Daily -6.10%
Day's high
$44.82
Day's low
$41.41
November 19 decline
-13.06%
SOXLB is currently in a weak downtrend; this is not a confirmed buying opportunity.
This is essentially a tokenized product linked to a 3x leveraged long semiconductor ETF, not an ordinary altcoin. If the semiconductor sector continues to correct, its losses will be magnified. It plunged 37.67% in a single day on November 5, then fell another 13.06% on November 19, showing just how volatile the market is.
My entry assessment:
$39–41: Watch closely for support near the previous low; only consider a small position after a clear sign that the decline has stopped.
$44.8–46.6: A sustained move back above this range would increase confidence that short-term momentum is turning bullish.
Below $38.9: If support at the previous low gives way, beware of further downside and don't average down blindly.
These price levels are observational ranges derived from recent highs and lows, not confirmed support levels.
In a nutshell: With a 3x leveraged product like SOXLB, a big drop doesn't mean it's cheap. I wouldn't rush to catch a falling knife right now. First, I'll see whether it can hold $39–41, or wait for strength to be confirmed above $46.6 before acting!
1
191
·
--
#mmt
MMT Price Analysis | Chase the Rally or Wait for a Pullback?
November 20, 2026 | Momentum (MMT)
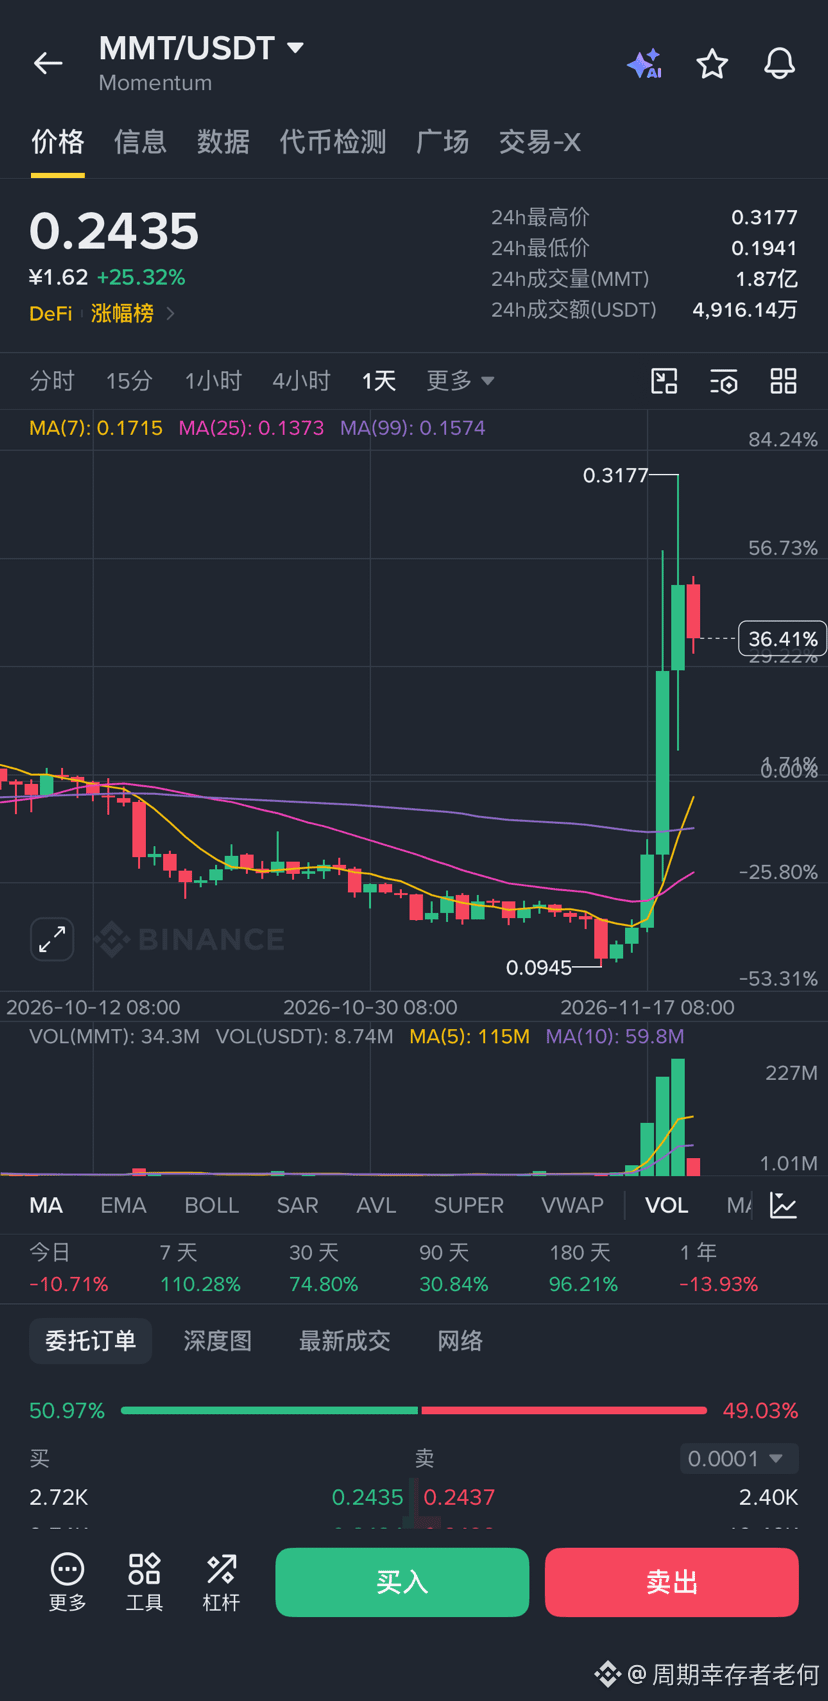
$0.2565 +17.8% (24H)
24H High
$0.3164
24H Low
$0.1928
24H Trading Volume
$180 million
7-Day Gain
+121.9%
Circulating Market Cap
$52.35 million
24H Volatility
About 64.1%
MMT is no longer a low-priced accumulation play; it’s a high-volatility bet after a sharp rally.
It doubled in 7 days, surged to a 24-hour high of $0.3164, then pulled back noticeably. CoinGlass data shows that the previous rally coincided with an 11.64% drop in open interest, while short liquidations totaled about $2.79 million.
This suggests the rally was significantly driven by short covering, and shouldn’t be interpreted entirely as sustained buying by new capital.
My entry strategy:
$0.22–$0.23: A pullback zone to watch first. Wait for the 4-hour candle to stabilize and trading volume to recover before considering a small position.
$0.27–$0.28: A level to watch for a renewed short-term uptrend. Consider entering only after it holds above this range on increased volume.
Below $0.19: Watch for a breakdown of the bullish structure; don’t add to your position blindly.
These strategy ranges are based on recent price structure and are not confirmed buy or sell signals.
In a nutshell: MMT has momentum and trading volume, but the most dangerous move right now is rushing in only after seeing it double. I wouldn’t chase it around $0.25. I’d rather wait for a confirmed pullback than buy at the height of the excitement~
#mmt
MMT Price Analysis | Chase the Rally or Wait for a Pullback?
November 20, 2026 | Momentum (MMT)
$0.2565 +17.8% (24H)
24H High
$0.3164
24H Low
$0.1928
24H Trading Volume
$180 million
7-Day Gain
+121.9%
Circulating Market Cap
$52.35 million
24H Volatility
About 64.1%
MMT is no longer a low-priced accumulation play; it’s a high-volatility bet after a sharp rally.
It doubled in 7 days, surged to a 24-hour high of $0.3164, then pulled back noticeably. CoinGlass data shows that the previous rally coincided with an 11.64% drop in open interest, while short liquidations totaled about $2.79 million.
This suggests the rally was significantly driven by short covering, and shouldn’t be interpreted entirely as sustained buying by new capital.
My entry strategy:
$0.22–$0.23: A pullback zone to watch first. Wait for the 4-hour candle to stabilize and trading volume to recover before considering a small position.
$0.27–$0.28: A level to watch for a renewed short-term uptrend. Consider entering only after it holds above this range on increased volume.
Below $0.19: Watch for a breakdown of the bullish structure; don’t add to your position blindly.
These strategy ranges are based on recent price structure and are not confirmed buy or sell signals.
In a nutshell: MMT has momentum and trading volume, but the most dangerous move right now is rushing in only after seeing it double. I wouldn’t chase it around $0.25. I’d rather wait for a confirmed pullback than buy at the height of the excitement~
MMT Price Analysis | Chase the Rally or Wait for a Pullback?
November 20, 2026 | Momentum (MMT)
$0.2565 +17.8% (24H)
24H High
$0.3164
24H Low
$0.1928
24H Trading Volume
$180 million
7-Day Gain
+121.9%
Circulating Market Cap
$52.35 million
24H Volatility
About 64.1%
MMT is no longer a low-priced accumulation play; it’s a high-volatility bet after a sharp rally.
It doubled in 7 days, surged to a 24-hour high of $0.3164, then pulled back noticeably. CoinGlass data shows that the previous rally coincided with an 11.64% drop in open interest, while short liquidations totaled about $2.79 million.
This suggests the rally was significantly driven by short covering, and shouldn’t be interpreted entirely as sustained buying by new capital.
My entry strategy:
$0.22–$0.23: A pullback zone to watch first. Wait for the 4-hour candle to stabilize and trading volume to recover before considering a small position.
$0.27–$0.28: A level to watch for a renewed short-term uptrend. Consider entering only after it holds above this range on increased volume.
Below $0.19: Watch for a breakdown of the bullish structure; don’t add to your position blindly.
These strategy ranges are based on recent price structure and are not confirmed buy or sell signals.
In a nutshell: MMT has momentum and trading volume, but the most dangerous move right now is rushing in only after seeing it double. I wouldn’t chase it around $0.25. I’d rather wait for a confirmed pullback than buy at the height of the excitement~
1
130
·
--
#SOXSB
November 20, 2026 | Binance SOXSB/USDT |
Latest query snapshot
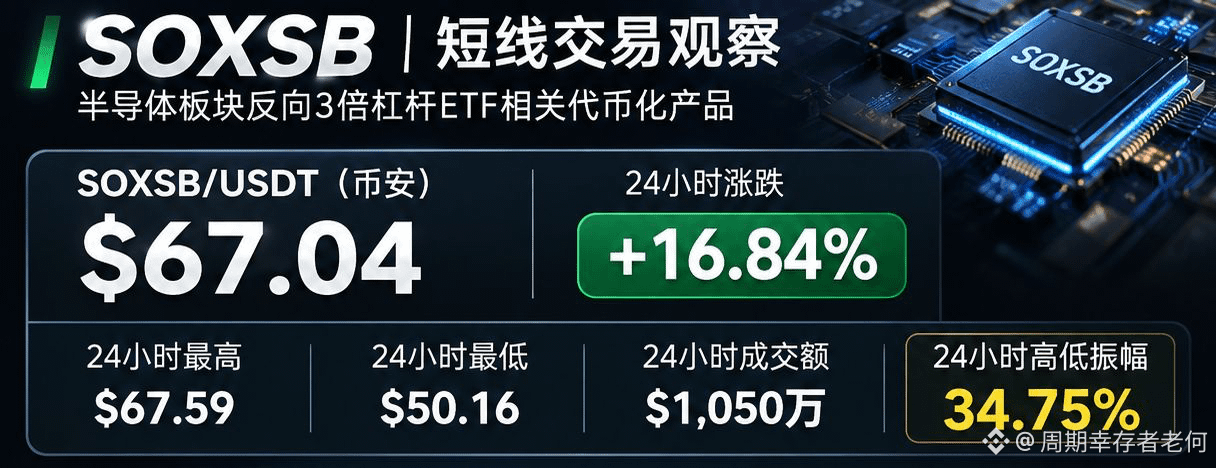
$67.04 +16.84% (24H)
24H high
$67.59
24H low
$50.16
24H trading volume
$10.5 million
SOXSB is not an ordinary altcoin, but a tokenized product linked to a 3x inverse leveraged ETF for the semiconductor sector.
The main reason it is rising isn't so-called whale accumulation, but rather that inverse products may benefit when the semiconductor sector weakens. It has gained more than 16% in the past 24 hours, with a high-low price range of about 34.75%, indicating extremely volatile trading.
My entry assessment:
Above $67.6: Consider a short-term trade in the direction of the trend only if it breaks out on strong volume and holds above this level.
$62–64: If it pulls back and stabilizes, watch for an opportunity to take a small position.
Below $60: The short-term bullish structure would weaken significantly; avoid blindly adding to your position.
These are levels to watch based on current market conditions, not confirmed technical support.
In short: the biggest mistake right now would be rushing in just because you saw a 16% gain. SOXSB's direction should be assessed alongside the performance of U.S.-listed semiconductor stocks. In particular, beware of the compounding drag and tracking error of daily 3x inverse products. Better to wait for a confirmed pullback than to get stuck buying at the top.
#SOXSB
November 20, 2026 | Binance SOXSB/USDT |
Latest query snapshot
$67.04 +16.84% (24H)
24H high
$67.59
24H low
$50.16
24H trading volume
$10.5 million
SOXSB is not an ordinary altcoin, but a tokenized product linked to a 3x inverse leveraged ETF for the semiconductor sector.
The main reason it is rising isn't so-called whale accumulation, but rather that inverse products may benefit when the semiconductor sector weakens. It has gained more than 16% in the past 24 hours, with a high-low price range of about 34.75%, indicating extremely volatile trading.
My entry assessment:
Above $67.6: Consider a short-term trade in the direction of the trend only if it breaks out on strong volume and holds above this level.
$62–64: If it pulls back and stabilizes, watch for an opportunity to take a small position.
Below $60: The short-term bullish structure would weaken significantly; avoid blindly adding to your position.
These are levels to watch based on current market conditions, not confirmed technical support.
In short: the biggest mistake right now would be rushing in just because you saw a 16% gain. SOXSB's direction should be assessed alongside the performance of U.S.-listed semiconductor stocks. In particular, beware of the compounding drag and tracking error of daily 3x inverse products. Better to wait for a confirmed pullback than to get stuck buying at the top.
November 20, 2026 | Binance SOXSB/USDT |
Latest query snapshot
$67.04 +16.84% (24H)
24H high
$67.59
24H low
$50.16
24H trading volume
$10.5 million
SOXSB is not an ordinary altcoin, but a tokenized product linked to a 3x inverse leveraged ETF for the semiconductor sector.
The main reason it is rising isn't so-called whale accumulation, but rather that inverse products may benefit when the semiconductor sector weakens. It has gained more than 16% in the past 24 hours, with a high-low price range of about 34.75%, indicating extremely volatile trading.
My entry assessment:
Above $67.6: Consider a short-term trade in the direction of the trend only if it breaks out on strong volume and holds above this level.
$62–64: If it pulls back and stabilizes, watch for an opportunity to take a small position.
Below $60: The short-term bullish structure would weaken significantly; avoid blindly adding to your position.
These are levels to watch based on current market conditions, not confirmed technical support.
In short: the biggest mistake right now would be rushing in just because you saw a 16% gain. SOXSB's direction should be assessed alongside the performance of U.S.-listed semiconductor stocks. In particular, beware of the compounding drag and tracking error of daily 3x inverse products. Better to wait for a confirmed pullback than to get stuck buying at the top.
1
3
·
--
#CYBER
CYBER Trend Analysis | How Do Veteran Traders View Entry Timing?
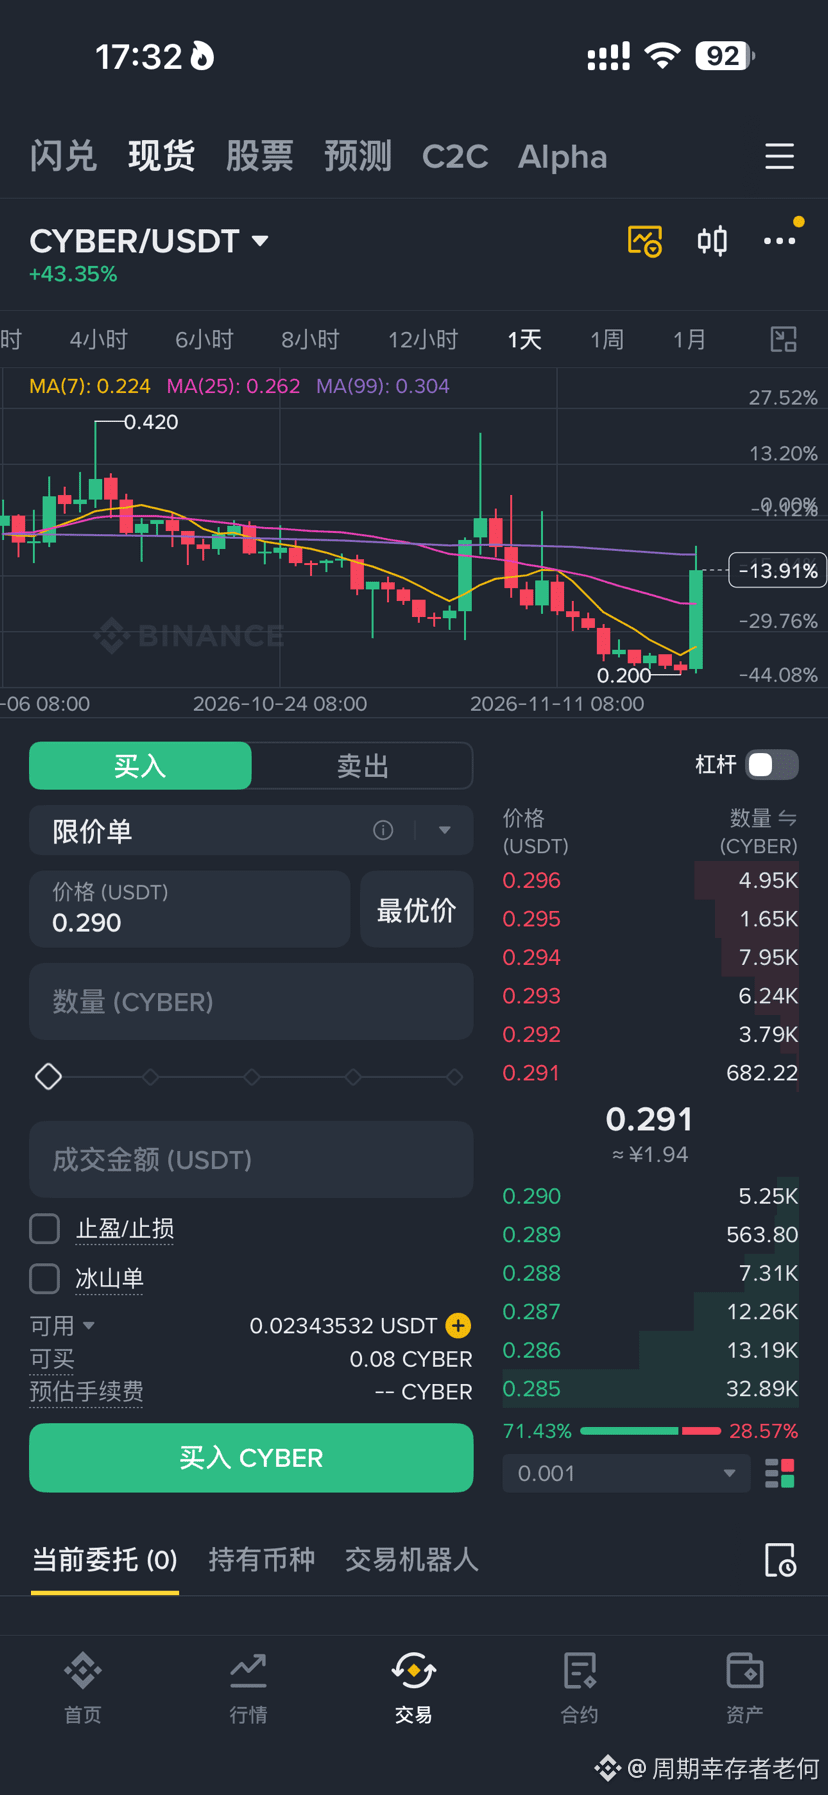
CYBER is experiencing an oversold bounce, not a trend reversal.
The coin has fallen more than 98% from its all-time high. Although it has recently rebounded, it is still down 10.71% over the past 7 days. What’s really worth watching is the flow of funds: futures trading volume is about $11.51 million, 5.5 times that of spot; open interest has grown 9.37% in 24 hours; and the funding rate is significantly negative. This suggests intense leveraged trading, creating an opportunity for a rapid rally driven by short covering—but also making a sharp pullback likely.
My entry plan:
$0.200–$0.205: Watch for support. Consider a small position to test the waters only after the price stabilizes on the 4-hour chart.
$0.215–$0.220: Short-term resistance zone. Consider following the move only after a breakout on increased volume and a successful retest.
Below $0.199: This would indicate that support near the previous low has failed, so watch out for further declines.
These are trading levels inferred from recent price ranges, not confirmed support or resistance.
One final point: CYBER has rebound potential, but there isn’t enough evidence yet to prove that major investors have finished accumulating. I wouldn’t chase it around $0.21. I’d rather wait for signs of a bottom near $0.20 or for a confirmed breakout above $0.22. When trading small-cap coins like this, position sizing matters more than trying to call the bottom. Stay rational! The human brain can’t beat a computer…!
#CYBER
CYBER Trend Analysis | How Do Veteran Traders View Entry Timing?
CYBER is experiencing an oversold bounce, not a trend reversal.
The coin has fallen more than 98% from its all-time high. Although it has recently rebounded, it is still down 10.71% over the past 7 days. What’s really worth watching is the flow of funds: futures trading volume is about $11.51 million, 5.5 times that of spot; open interest has grown 9.37% in 24 hours; and the funding rate is significantly negative. This suggests intense leveraged trading, creating an opportunity for a rapid rally driven by short covering—but also making a sharp pullback likely.
My entry plan:
$0.200–$0.205: Watch for support. Consider a small position to test the waters only after the price stabilizes on the 4-hour chart.
$0.215–$0.220: Short-term resistance zone. Consider following the move only after a breakout on increased volume and a successful retest.
Below $0.199: This would indicate that support near the previous low has failed, so watch out for further declines.
These are trading levels inferred from recent price ranges, not confirmed support or resistance.
One final point: CYBER has rebound potential, but there isn’t enough evidence yet to prove that major investors have finished accumulating. I wouldn’t chase it around $0.21. I’d rather wait for signs of a bottom near $0.20 or for a confirmed breakout above $0.22. When trading small-cap coins like this, position sizing matters more than trying to call the bottom. Stay rational! The human brain can’t beat a computer…!
CYBER Trend Analysis | How Do Veteran Traders View Entry Timing?
CYBER is experiencing an oversold bounce, not a trend reversal.
The coin has fallen more than 98% from its all-time high. Although it has recently rebounded, it is still down 10.71% over the past 7 days. What’s really worth watching is the flow of funds: futures trading volume is about $11.51 million, 5.5 times that of spot; open interest has grown 9.37% in 24 hours; and the funding rate is significantly negative. This suggests intense leveraged trading, creating an opportunity for a rapid rally driven by short covering—but also making a sharp pullback likely.
My entry plan:
$0.200–$0.205: Watch for support. Consider a small position to test the waters only after the price stabilizes on the 4-hour chart.
$0.215–$0.220: Short-term resistance zone. Consider following the move only after a breakout on increased volume and a successful retest.
Below $0.199: This would indicate that support near the previous low has failed, so watch out for further declines.
These are trading levels inferred from recent price ranges, not confirmed support or resistance.
One final point: CYBER has rebound potential, but there isn’t enough evidence yet to prove that major investors have finished accumulating. I wouldn’t chase it around $0.21. I’d rather wait for signs of a bottom near $0.20 or for a confirmed breakout above $0.22. When trading small-cap coins like this, position sizing matters more than trying to call the bottom. Stay rational! The human brain can’t beat a computer…!
1
177
·
--
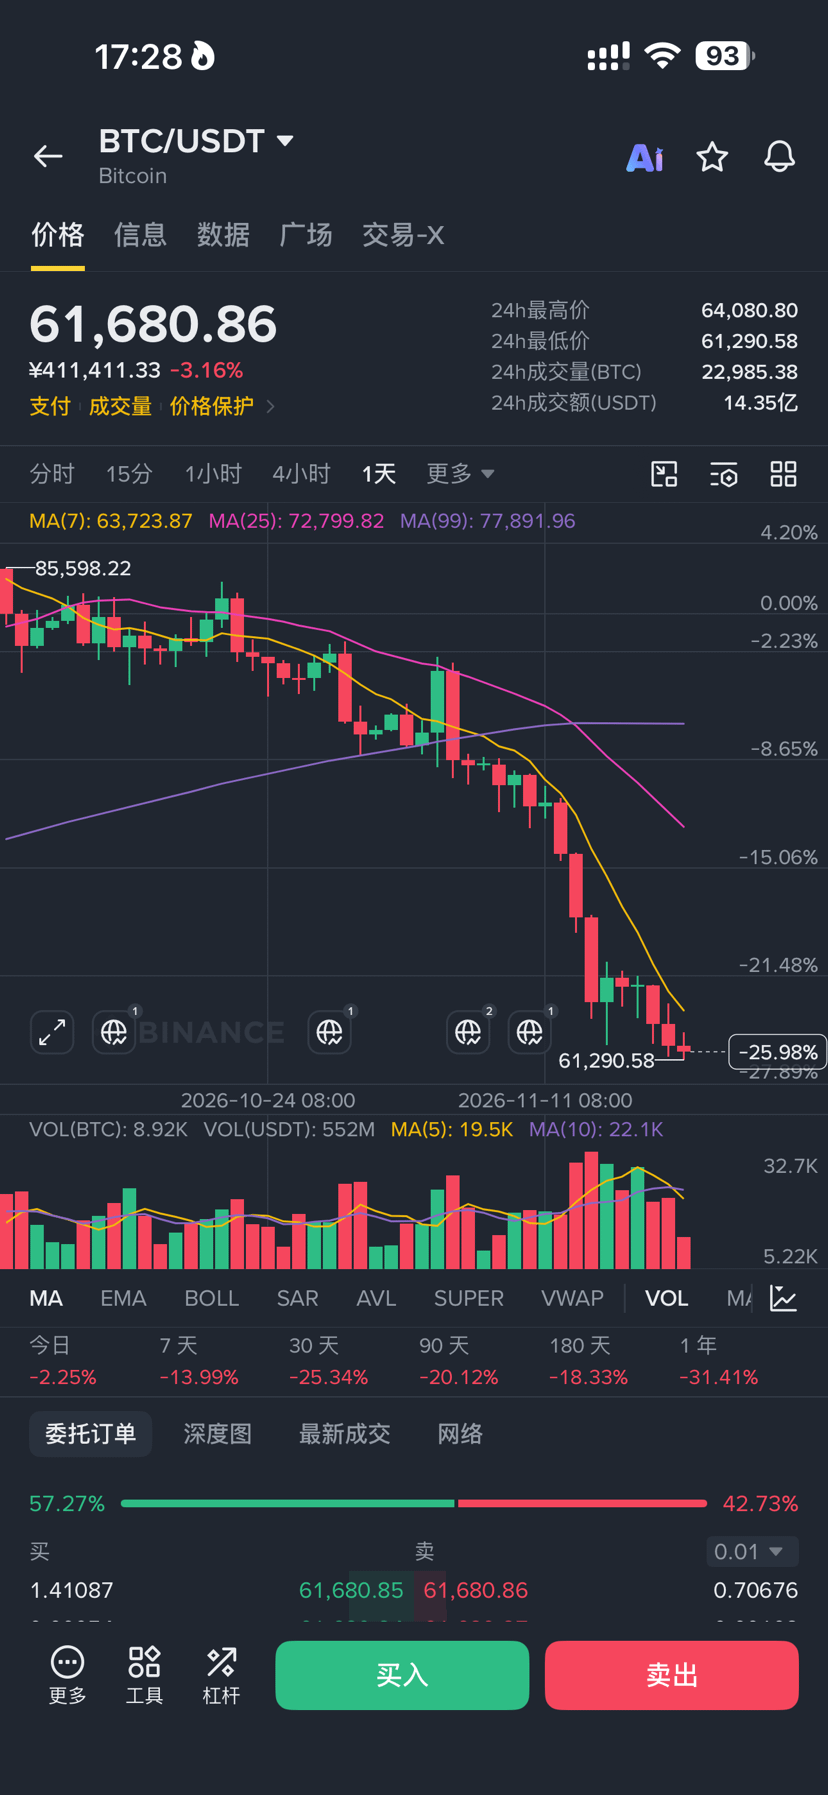
Now #BTC has fallen below $62,000. Bad news had been piling up: the Binance hack, the midterm elections, losses in U.S. stocks, ETF outflows, rising expectations of interest rate hikes, and more.
Anthropic shares are priced at $83, and its IPO set a global record. It will also draw funds away from Bitcoin. Bitcoin has fallen for seven consecutive weeks; if more bearish sentiment emerges, a drop below $60,000 wouldn’t be surprising. Institutions are selling, and ETF flows are net negative.
The Fed is still talking about December, and if inflation data remains a concern, it will keep raising rates. In the short term, the market looks more likely to trade sideways with a downward bias. Expectations of rate hikes are still running hot, so it remains to be seen whether Bitcoin can hold the $60,000 level.
Manage your position size and don’t use leverage. If you have money, you could buy a little spot; if not, just save it and enjoy a drink or two. What could be better?
#加息预期叠加美股分流,比特币跌破6.2万美元
Now #BTC has fallen below $62,000. Bad news had been piling up: the Binance hack, the midterm elections, losses in U.S. stocks, ETF outflows, rising expectations of interest rate hikes, and more.
Anthropic shares are priced at $83, and its IPO set a global record. It will also draw funds away from Bitcoin. Bitcoin has fallen for seven consecutive weeks; if more bearish sentiment emerges, a drop below $60,000 wouldn’t be surprising. Institutions are selling, and ETF flows are net negative.
The Fed is still talking about December, and if inflation data remains a concern, it will keep raising rates. In the short term, the market looks more likely to trade sideways with a downward bias. Expectations of rate hikes are still running hot, so it remains to be seen whether Bitcoin can hold the $60,000 level.
Manage your position size and don’t use leverage. If you have money, you could buy a little spot; if not, just save it and enjoy a drink or two. What could be better?
#加息预期叠加美股分流,比特币跌破6.2万美元
Anthropic shares are priced at $83, and its IPO set a global record. It will also draw funds away from Bitcoin. Bitcoin has fallen for seven consecutive weeks; if more bearish sentiment emerges, a drop below $60,000 wouldn’t be surprising. Institutions are selling, and ETF flows are net negative.
The Fed is still talking about December, and if inflation data remains a concern, it will keep raising rates. In the short term, the market looks more likely to trade sideways with a downward bias. Expectations of rate hikes are still running hot, so it remains to be seen whether Bitcoin can hold the $60,000 level.
Manage your position size and don’t use leverage. If you have money, you could buy a little spot; if not, just save it and enjoy a drink or two. What could be better?
#加息预期叠加美股分流,比特币跌破6.2万美元
1
28
·
--
#mito What does everyone think of this coin right now? Buy the dip or keep waiting?
MITO has been behaving strangely lately. This isn't a normal pullback; it's struggling near historical lows after a prolonged decline.
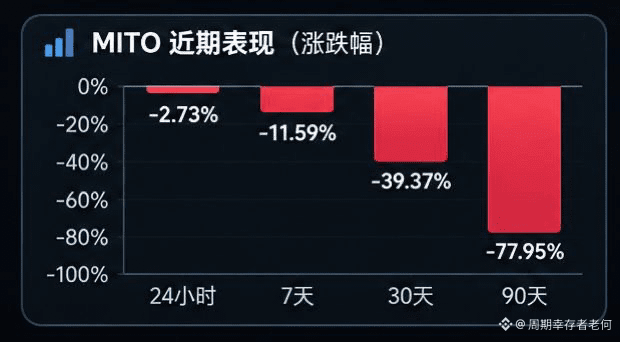
It's down nearly 40% over the past 30 days and almost 78% over the past 90 days, and has fallen about 98.6% from its all-time high. More concerning, Binance added MITO to its Monitoring Tag list on November 20, meaning it faces stricter listing reviews and potential delisting risk.
You shouldn't assume a coin is cheap just because it's fallen a lot.
My take: There's no need to rush into buying right now. Wait for the 4-hour candle to close above $0.00630 with increased volume before considering a small position. That's more sensible than buying the dip outright.
Only about 18.1% of MITO's supply is circulating, so further token supply could create pressure. Combined with Binance's Monitoring Tag, this isn't a good time to take a large position.
In short: MITO could see an oversold bounce, but there's no evidence of a reversal yet. The real opportunity isn't buying at the absolute bottom—it's waiting for selling pressure to ease before entering.
#mito What does everyone think of this coin right now? Buy the dip or keep waiting?
MITO has been behaving strangely lately. This isn't a normal pullback; it's struggling near historical lows after a prolonged decline.
It's down nearly 40% over the past 30 days and almost 78% over the past 90 days, and has fallen about 98.6% from its all-time high. More concerning, Binance added MITO to its Monitoring Tag list on November 20, meaning it faces stricter listing reviews and potential delisting risk.
You shouldn't assume a coin is cheap just because it's fallen a lot.
My take: There's no need to rush into buying right now. Wait for the 4-hour candle to close above $0.00630 with increased volume before considering a small position. That's more sensible than buying the dip outright.
Only about 18.1% of MITO's supply is circulating, so further token supply could create pressure. Combined with Binance's Monitoring Tag, this isn't a good time to take a large position.
In short: MITO could see an oversold bounce, but there's no evidence of a reversal yet. The real opportunity isn't buying at the absolute bottom—it's waiting for selling pressure to ease before entering.
MITO has been behaving strangely lately. This isn't a normal pullback; it's struggling near historical lows after a prolonged decline.
It's down nearly 40% over the past 30 days and almost 78% over the past 90 days, and has fallen about 98.6% from its all-time high. More concerning, Binance added MITO to its Monitoring Tag list on November 20, meaning it faces stricter listing reviews and potential delisting risk.
You shouldn't assume a coin is cheap just because it's fallen a lot.
My take: There's no need to rush into buying right now. Wait for the 4-hour candle to close above $0.00630 with increased volume before considering a small position. That's more sensible than buying the dip outright.
Only about 18.1% of MITO's supply is circulating, so further token supply could create pressure. Combined with Binance's Monitoring Tag, this isn't a good time to take a large position.
In short: MITO could see an oversold bounce, but there's no evidence of a reversal yet. The real opportunity isn't buying at the absolute bottom—it's waiting for selling pressure to ease before entering.
3
447
·
--
PREDICT Trend Analysis and Short-Term Entry Timing
PREDICT is currently trading around $1.10, down about 45% from its peak of $1.99. Its 24-hour trading volume is approximately $1.13 million, so market activity is relatively subdued. Retail traders have a relatively high short position ratio, while large holders are slightly net long. This suggests the market is anticipating a rebound, but buying pressure is not yet strong enough to confirm a reversal.
My view is simple: this is not the time to chase a rally. The $1.00–$1.04 range is a support zone worth watching; if the price pulls back and stabilizes there, you could consider testing the waters with a small position. A short-term move higher becomes more likely only if it breaks above $1.17 on increased volume and holds. Conversely, if it falls below $0.9275, be wary of another sharp leg down.
In short: this coin has bounce potential, but it hasn’t formed a truly strong trend yet. It’s better to wait for confirmation before entering than to rush in and try to catch the bottom, only to become someone else’s exit liquidity.
#predict
PREDICT Trend Analysis and Short-Term Entry Timing
PREDICT is currently trading around $1.10, down about 45% from its peak of $1.99. Its 24-hour trading volume is approximately $1.13 million, so market activity is relatively subdued. Retail traders have a relatively high short position ratio, while large holders are slightly net long. This suggests the market is anticipating a rebound, but buying pressure is not yet strong enough to confirm a reversal.
My view is simple: this is not the time to chase a rally. The $1.00–$1.04 range is a support zone worth watching; if the price pulls back and stabilizes there, you could consider testing the waters with a small position. A short-term move higher becomes more likely only if it breaks above $1.17 on increased volume and holds. Conversely, if it falls below $0.9275, be wary of another sharp leg down.
In short: this coin has bounce potential, but it hasn’t formed a truly strong trend yet. It’s better to wait for confirmation before entering than to rush in and try to catch the bottom, only to become someone else’s exit liquidity.
#predict
PREDICT is currently trading around $1.10, down about 45% from its peak of $1.99. Its 24-hour trading volume is approximately $1.13 million, so market activity is relatively subdued. Retail traders have a relatively high short position ratio, while large holders are slightly net long. This suggests the market is anticipating a rebound, but buying pressure is not yet strong enough to confirm a reversal.
My view is simple: this is not the time to chase a rally. The $1.00–$1.04 range is a support zone worth watching; if the price pulls back and stabilizes there, you could consider testing the waters with a small position. A short-term move higher becomes more likely only if it breaks above $1.17 on increased volume and holds. Conversely, if it falls below $0.9275, be wary of another sharp leg down.
In short: this coin has bounce potential, but it hasn’t formed a truly strong trend yet. It’s better to wait for confirmation before entering than to rush in and try to catch the bottom, only to become someone else’s exit liquidity.
#predict
5
2.3k
·
--
TH has fallen to around $1,700. Is this a buying opportunity, or the start of another downward move?
I've been keeping a close eye on ETH lately. Honestly, this drop has been even more severe than I expected, but the lower it goes, the less inclined I am to rush in.
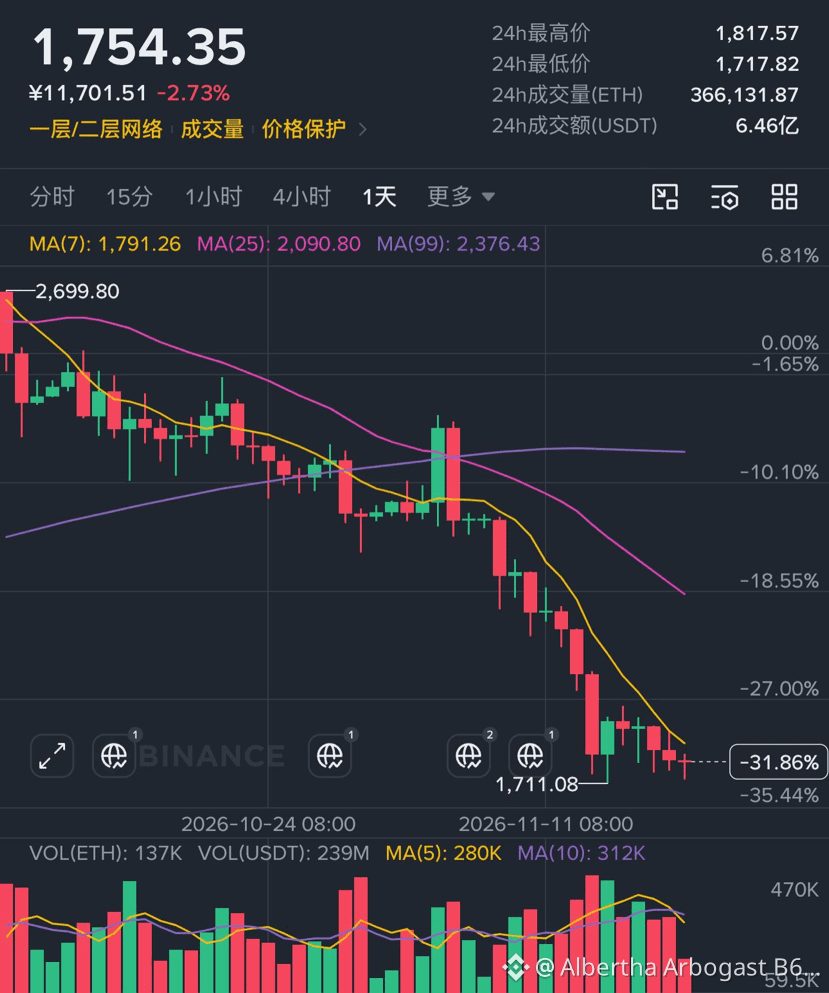
First, let's look at the data. ETH is currently trading at $1,754.35, down 3.32% in 24 hours, with a high of $1,817 and a low of $1,717.1. It has fallen a total of 9.41% over the past seven days. It's now 64.8% below its all-time high of $4,953.7.
What makes me cautious isn't the size of the drop, but the structure of the capital flows. 24-hour futures trading volume is $41.75 billion, while spot volume is only $2.57 billion—futures volume is 16.2 times spot volume. Open interest stands at $23.13 billion, and $82.95 million in long positions were liquidated over the past 24 hours. Looking at ETFs, U.S. spot ETH ETFs saw net outflows of $131.2 million on November 19.
What does this market action tell us? Leveraged traders are still battling it out, but spot buying and institutional fund flows have yet to provide a strong enough signal of a reversal.
I'm watching three key levels right now.
$1,710–$1,730 is the first support zone. If a retest holds and the 4-hour chart shows a strong-volume reclaim, it may be worth testing the waters with a small position.
Around $1,685 is the next line of defense. If $1,710 breaks decisively, I won't rush to add to my position; I'll first watch to see whether buyers step in here.
$1,800–$1,850 is the resistance zone that any short-term rebound will have to face. #ETH🔥🔥🔥🔥🔥🔥
TH has fallen to around $1,700. Is this a buying opportunity, or the start of another downward move?
I've been keeping a close eye on ETH lately. Honestly, this drop has been even more severe than I expected, but the lower it goes, the less inclined I am to rush in.
First, let's look at the data. ETH is currently trading at $1,754.35, down 3.32% in 24 hours, with a high of $1,817 and a low of $1,717.1. It has fallen a total of 9.41% over the past seven days. It's now 64.8% below its all-time high of $4,953.7.
What makes me cautious isn't the size of the drop, but the structure of the capital flows. 24-hour futures trading volume is $41.75 billion, while spot volume is only $2.57 billion—futures volume is 16.2 times spot volume. Open interest stands at $23.13 billion, and $82.95 million in long positions were liquidated over the past 24 hours. Looking at ETFs, U.S. spot ETH ETFs saw net outflows of $131.2 million on November 19.
What does this market action tell us? Leveraged traders are still battling it out, but spot buying and institutional fund flows have yet to provide a strong enough signal of a reversal.
I'm watching three key levels right now.
$1,710–$1,730 is the first support zone. If a retest holds and the 4-hour chart shows a strong-volume reclaim, it may be worth testing the waters with a small position.
Around $1,685 is the next line of defense. If $1,710 breaks decisively, I won't rush to add to my position; I'll first watch to see whether buyers step in here.
$1,800–$1,850 is the resistance zone that any short-term rebound will have to face. #ETH🔥🔥🔥🔥🔥🔥
I've been keeping a close eye on ETH lately. Honestly, this drop has been even more severe than I expected, but the lower it goes, the less inclined I am to rush in.
First, let's look at the data. ETH is currently trading at $1,754.35, down 3.32% in 24 hours, with a high of $1,817 and a low of $1,717.1. It has fallen a total of 9.41% over the past seven days. It's now 64.8% below its all-time high of $4,953.7.
What makes me cautious isn't the size of the drop, but the structure of the capital flows. 24-hour futures trading volume is $41.75 billion, while spot volume is only $2.57 billion—futures volume is 16.2 times spot volume. Open interest stands at $23.13 billion, and $82.95 million in long positions were liquidated over the past 24 hours. Looking at ETFs, U.S. spot ETH ETFs saw net outflows of $131.2 million on November 19.
What does this market action tell us? Leveraged traders are still battling it out, but spot buying and institutional fund flows have yet to provide a strong enough signal of a reversal.
I'm watching three key levels right now.
$1,710–$1,730 is the first support zone. If a retest holds and the 4-hour chart shows a strong-volume reclaim, it may be worth testing the waters with a small position.
Around $1,685 is the next line of defense. If $1,710 breaks decisively, I won't rush to add to my position; I'll first watch to see whether buyers step in here.
$1,800–$1,850 is the resistance zone that any short-term rebound will have to face. #ETH🔥🔥🔥🔥🔥🔥
1
1
1.2k
Log in to explore more content
Join global crypto users on Binance Square
⚡️ Get latest and useful information about crypto.
💬 Trusted by the world’s largest crypto exchange.
👍 Discover real insights from verified creators.
Email / Phone number
Trending Topics
CanBTCReboundAfterFallingBelow60K?
240,283 views
1,068 Discussing
Bitcoin News | Bitcoin Falls Below $60,000 for the First Time Since July as IBIT Posts Record $541 Million Outflow
Binance News
·48 Likes
·88.2k views
GlobalStocksFaceLongestLosingStreakSince2023
84,212 views
816 Discussing
AnthropicPlungesTowardIPOPriceonDay2
40,172 views
414 Discussing