

星期天-77
18.3k Posts

星期天-77
 Square Verified+
Report
Block User
人在星期天,心在Web3 ,财神公会在此,牛市埋伏走起!
3.8K+ Following
91.4K+ Followers
100.2K+ Liked
Posts
All
Quotes
Videos
PINNED
·
--
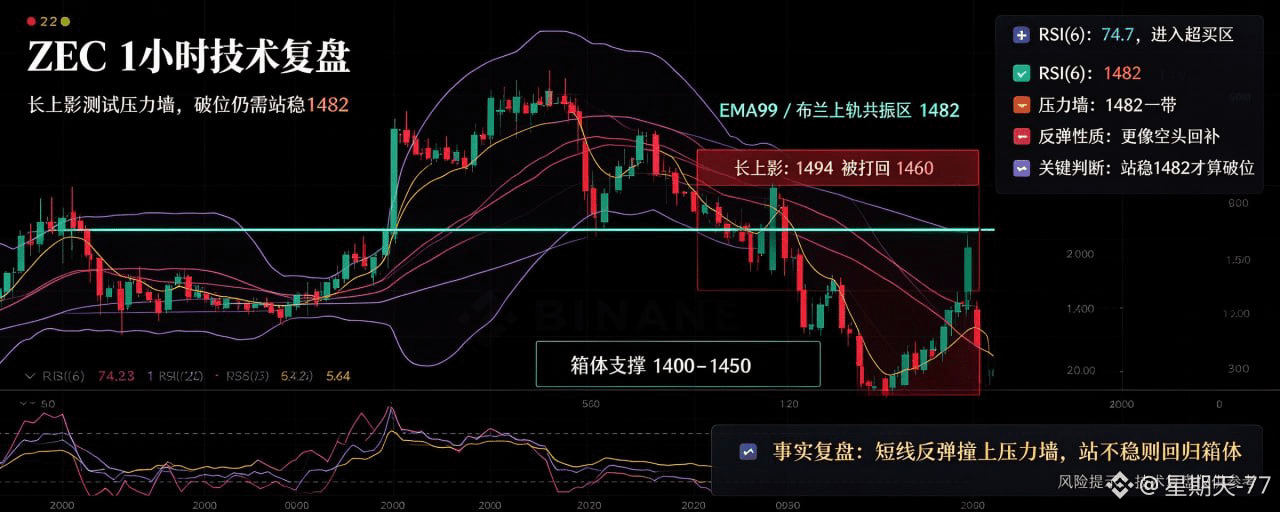
$ZEC Tonight we pulled up to 1,494, only to be pushed back to 1,460 again; the upper wick is very long.
A short-term rebound collided with a resistance wall.
On the 1-hour timeframe, around 1,482 the market is simultaneously at EMA99 and the upper Bollinger Band, and RSI(6) has already reached 74.7. After being cut from 1,698 down to 1,356, this leg looks more like short-covering rather than a new trend starting yet.
Only if it holds above 1,482 can we call it a breakdown; if it can’t hold, then it will return to the box range of 1,400 to 1,450.
#zec #ZECUSDT #Zcash #股票财报季
{future}(ZECUSDT)
$ZEC Tonight we pulled up to 1,494, only to be pushed back to 1,460 again; the upper wick is very long.
A short-term rebound collided with a resistance wall.
On the 1-hour timeframe, around 1,482 the market is simultaneously at EMA99 and the upper Bollinger Band, and RSI(6) has already reached 74.7. After being cut from 1,698 down to 1,356, this leg looks more like short-covering rather than a new trend starting yet.
Only if it holds above 1,482 can we call it a breakdown; if it can’t hold, then it will return to the box range of 1,400 to 1,450.
#zec #ZECUSDT #Zcash #股票财报季
A short-term rebound collided with a resistance wall.
On the 1-hour timeframe, around 1,482 the market is simultaneously at EMA99 and the upper Bollinger Band, and RSI(6) has already reached 74.7. After being cut from 1,698 down to 1,356, this leg looks more like short-covering rather than a new trend starting yet.
Only if it holds above 1,482 can we call it a breakdown; if it can’t hold, then it will return to the box range of 1,400 to 1,450.
#zec #ZECUSDT #Zcash #股票财报季
3
4.3k
·
--
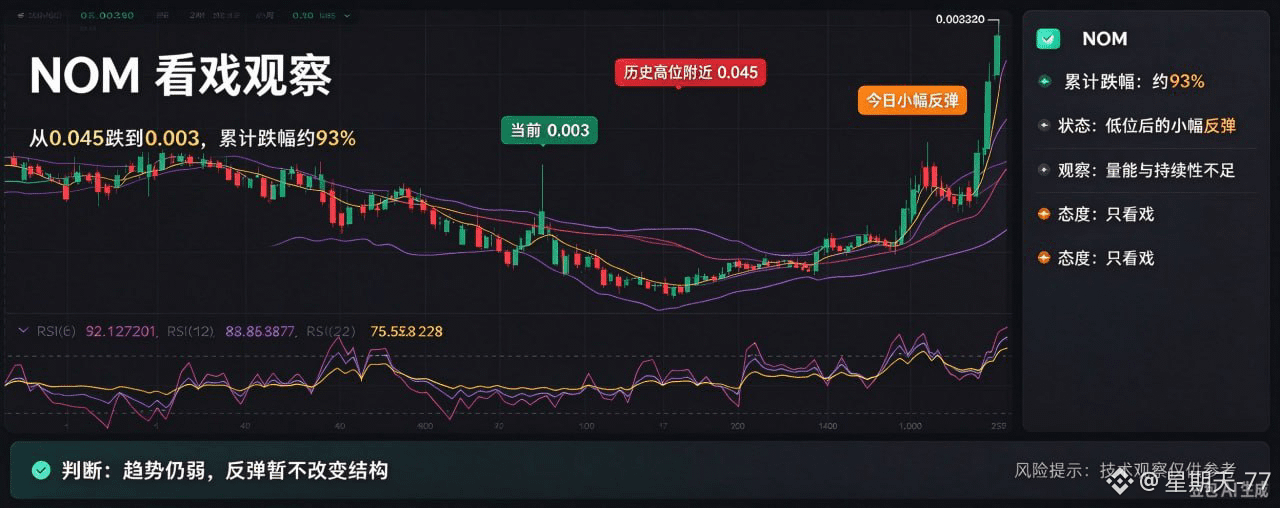
$NOM fell from 0.045 to 0.003
It's already down 93% from the top
This little rebound today—
I’m just here to watch this kind of market
#nomina #比特币升破85200美元 $BTC
{future}(NOMUSDT)
$NOM fell from 0.045 to 0.003
It's already down 93% from the top
This little rebound today—
I’m just here to watch this kind of market
#nomina #比特币升破85200美元 $BTC
It's already down 93% from the top
This little rebound today—
I’m just here to watch this kind of market
#nomina #比特币升破85200美元 $BTC
3
738
·
--
Happy National Day
Happy National Day
星期天-77
·
--
On the 11th, set off and rush toward the great rivers and mountains of the motherland 🌿
Breathe in the wind from the mountains and fields, and watch the everyday fireworks of life.
May each year bring peace and safety, and may all things be well.
#BTC $BTC
Breathe in the wind from the mountains and fields, and watch the everyday fireworks of life.
May each year bring peace and safety, and may all things be well.
#BTC $BTC

2
200
·
--
On the 11th, set off and rush toward the great rivers and mountains of the motherland 🌿
Breathe in the wind from the mountains and fields, and watch the everyday fireworks of life.
May each year bring peace and safety, and may all things be well.
#BTC $BTC
{future}(BTCUSDT)
On the 11th, set off and rush toward the great rivers and mountains of the motherland 🌿
Breathe in the wind from the mountains and fields, and watch the everyday fireworks of life.
May each year bring peace and safety, and may all things be well.
#BTC $BTC
Breathe in the wind from the mountains and fields, and watch the everyday fireworks of life.
May each year bring peace and safety, and may all things be well.
#BTC $BTC

61
1
6
405
·
--
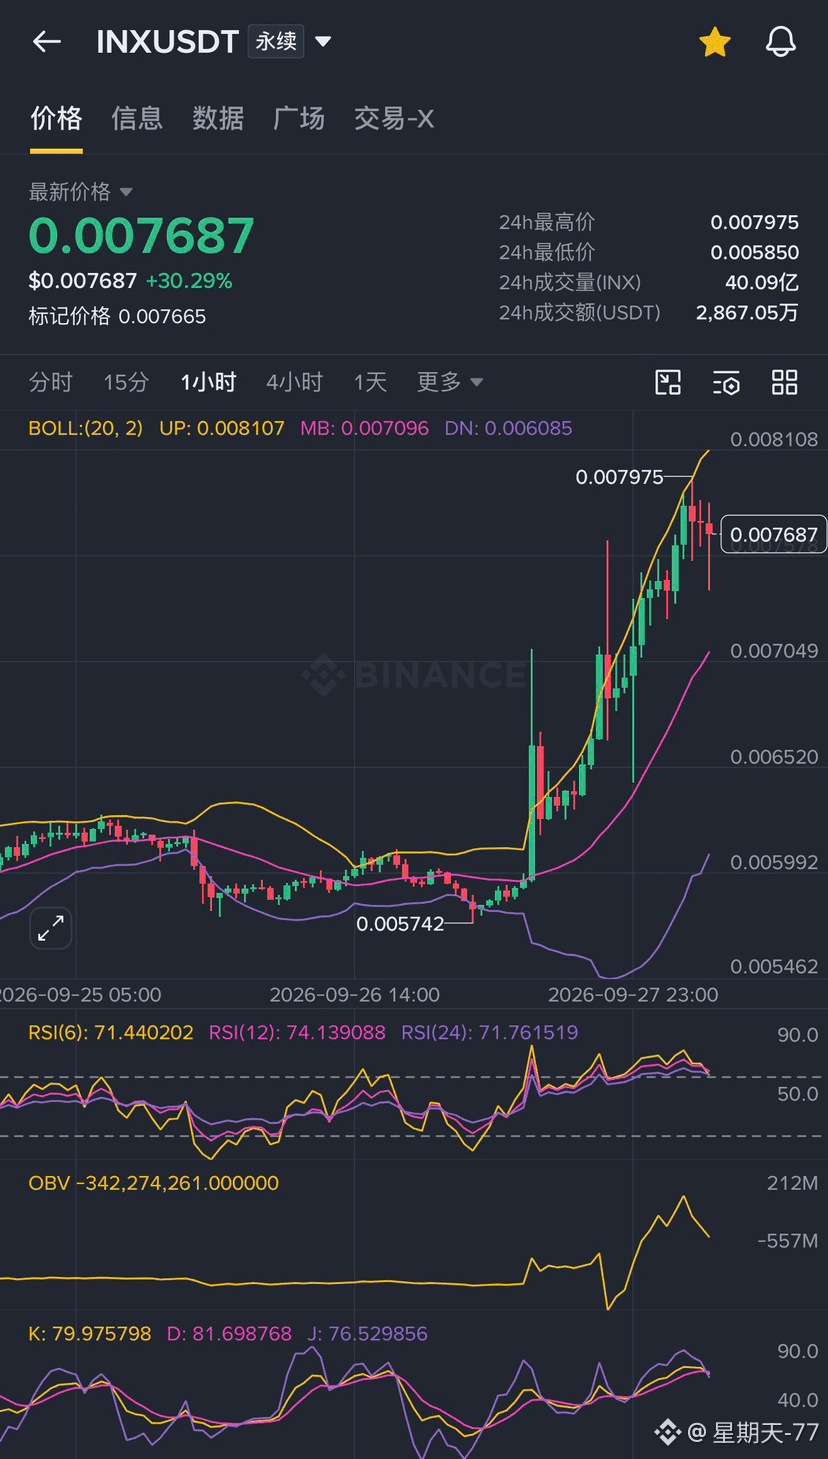
Open $INX , +30.29%. My hands are already shaking.
First, calm down and take a look: 24h low 0.005850, high 0.007975, current price 0.007687, and it has already given back 3.6% from the high. In this kind of position, it’s the most dangerous: it’s not that it hasn’t gone up—it already surged a lot. The thought “if you don’t get on the train now, it’ll be gone” is loudest in your head.
My own old bad habit is exactly like this: on the 1-hour chart, one big bullish candle pulls it up, and all three RSI lines are sitting above 70. I’m still telling myself “strong, and won’t turn back.” But when you review afterward, you find that the orders you chased are, in most cases, trapped inside the upper wicks during the sharp pullback.
24h trading volume is 28.67M U, which shows money really has come in—not that nobody’s playing a dead card. But volume doesn’t mean you can chase; volume can also mean someone else is offloading.
Don’t chase today. Let’s see whether it can pull back and hold steady. Missing a bullish candle isn’t a big deal. What’s truly regrettable is losing money by chasing the highs.
Just sharing personal trading psychology; not investment advice.
#INX
{future}(INXUSDT)
Open $INX , +30.29%. My hands are already shaking.
First, calm down and take a look: 24h low 0.005850, high 0.007975, current price 0.007687, and it has already given back 3.6% from the high. In this kind of position, it’s the most dangerous: it’s not that it hasn’t gone up—it already surged a lot. The thought “if you don’t get on the train now, it’ll be gone” is loudest in your head.
My own old bad habit is exactly like this: on the 1-hour chart, one big bullish candle pulls it up, and all three RSI lines are sitting above 70. I’m still telling myself “strong, and won’t turn back.” But when you review afterward, you find that the orders you chased are, in most cases, trapped inside the upper wicks during the sharp pullback.
24h trading volume is 28.67M U, which shows money really has come in—not that nobody’s playing a dead card. But volume doesn’t mean you can chase; volume can also mean someone else is offloading.
Don’t chase today. Let’s see whether it can pull back and hold steady. Missing a bullish candle isn’t a big deal. What’s truly regrettable is losing money by chasing the highs.
Just sharing personal trading psychology; not investment advice.
#INX
First, calm down and take a look: 24h low 0.005850, high 0.007975, current price 0.007687, and it has already given back 3.6% from the high. In this kind of position, it’s the most dangerous: it’s not that it hasn’t gone up—it already surged a lot. The thought “if you don’t get on the train now, it’ll be gone” is loudest in your head.
My own old bad habit is exactly like this: on the 1-hour chart, one big bullish candle pulls it up, and all three RSI lines are sitting above 70. I’m still telling myself “strong, and won’t turn back.” But when you review afterward, you find that the orders you chased are, in most cases, trapped inside the upper wicks during the sharp pullback.
24h trading volume is 28.67M U, which shows money really has come in—not that nobody’s playing a dead card. But volume doesn’t mean you can chase; volume can also mean someone else is offloading.
Don’t chase today. Let’s see whether it can pull back and hold steady. Missing a bullish candle isn’t a big deal. What’s truly regrettable is losing money by chasing the highs.
Just sharing personal trading psychology; not investment advice.
#INX
4
798
·
--
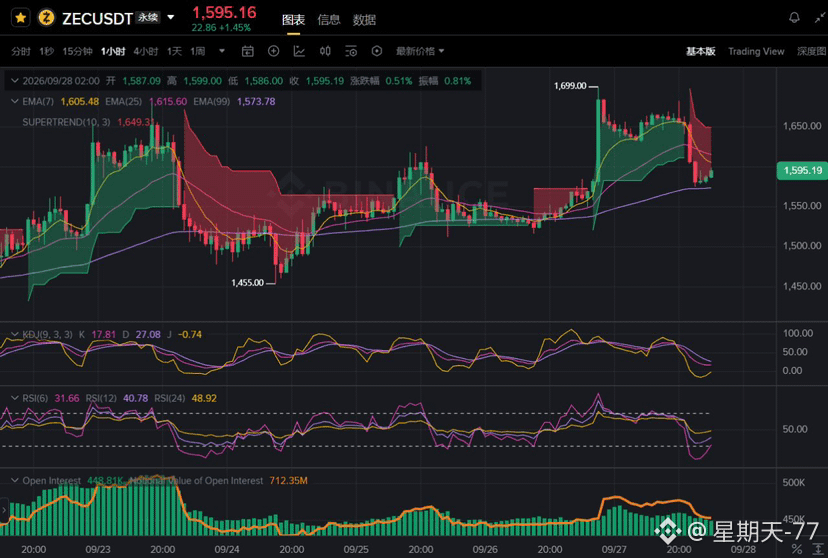
$ZEC This temper really hasn’t changed—here we go again with the old script.
Coming up from that dip at 1455, this time it ran straight to 1699; it even touched new highs. But then the same old play of the needle-like top sticking out came back—straight back down to around 1580. Now at 1595, it’s barely managed to stop the slide. This is already the third time in these few days that it surged and then pulled back: 1443→1679, then a retest; and then back up to 1699 again. Every time it reaches high levels, it’s like it was agreed upon—immediately a sell-off.
This time the position size is actually pretty strong. During the push up, it jumped from 450k to over 480k—clearly new funds have really come in, not just pretending. But after that high-point move, that one big bearish candle crashing down suggests yet another batch of chase-buyers got buried. History always rhymes in the same way.
Honestly, this kind of ZEC price action—repeatedly poking at highs and then getting smashed—isn’t the first time, not even the second. Following the crowd as it chases the prior high over these past few days, people’s emotions likely broke down more than once. Today’s close turned red again, +1.45%, which suggests there’s money picking it up after the dump, but whether it can really hold depends on if it can defend the 1580 line going forward.
I personally can’t be bothered to chase this kind of stock. Since it always sells right after pushing up, it’s better to wait until it finishes dumping and stabilizes before looking again. The feeling of chasing at the top of the mountain—over the past couple of weeks, quite a few people have probably tasted it.
#zec #ZECUSDT #Circle与Tether冻结Bitget黑客钱包
{future}(ZECUSDT)
$ZEC This temper really hasn’t changed—here we go again with the old script.
Coming up from that dip at 1455, this time it ran straight to 1699; it even touched new highs. But then the same old play of the needle-like top sticking out came back—straight back down to around 1580. Now at 1595, it’s barely managed to stop the slide. This is already the third time in these few days that it surged and then pulled back: 1443→1679, then a retest; and then back up to 1699 again. Every time it reaches high levels, it’s like it was agreed upon—immediately a sell-off.
This time the position size is actually pretty strong. During the push up, it jumped from 450k to over 480k—clearly new funds have really come in, not just pretending. But after that high-point move, that one big bearish candle crashing down suggests yet another batch of chase-buyers got buried. History always rhymes in the same way.
Honestly, this kind of ZEC price action—repeatedly poking at highs and then getting smashed—isn’t the first time, not even the second. Following the crowd as it chases the prior high over these past few days, people’s emotions likely broke down more than once. Today’s close turned red again, +1.45%, which suggests there’s money picking it up after the dump, but whether it can really hold depends on if it can defend the 1580 line going forward.
I personally can’t be bothered to chase this kind of stock. Since it always sells right after pushing up, it’s better to wait until it finishes dumping and stabilizes before looking again. The feeling of chasing at the top of the mountain—over the past couple of weeks, quite a few people have probably tasted it.
#zec #ZECUSDT #Circle与Tether冻结Bitget黑客钱包
Coming up from that dip at 1455, this time it ran straight to 1699; it even touched new highs. But then the same old play of the needle-like top sticking out came back—straight back down to around 1580. Now at 1595, it’s barely managed to stop the slide. This is already the third time in these few days that it surged and then pulled back: 1443→1679, then a retest; and then back up to 1699 again. Every time it reaches high levels, it’s like it was agreed upon—immediately a sell-off.
This time the position size is actually pretty strong. During the push up, it jumped from 450k to over 480k—clearly new funds have really come in, not just pretending. But after that high-point move, that one big bearish candle crashing down suggests yet another batch of chase-buyers got buried. History always rhymes in the same way.
Honestly, this kind of ZEC price action—repeatedly poking at highs and then getting smashed—isn’t the first time, not even the second. Following the crowd as it chases the prior high over these past few days, people’s emotions likely broke down more than once. Today’s close turned red again, +1.45%, which suggests there’s money picking it up after the dump, but whether it can really hold depends on if it can defend the 1580 line going forward.
I personally can’t be bothered to chase this kind of stock. Since it always sells right after pushing up, it’s better to wait until it finishes dumping and stabilizes before looking again. The feeling of chasing at the top of the mountain—over the past couple of weeks, quite a few people have probably tasted it.
#zec #ZECUSDT #Circle与Tether冻结Bitget黑客钱包
1
1.1k
·
--
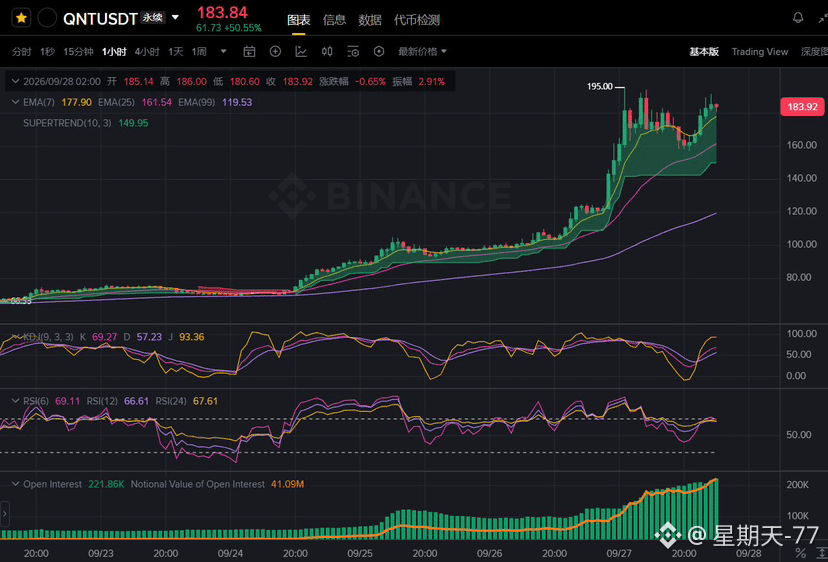
$QNT This wave isn’t over just by a quick spike—it’s real money chasing.
Starting to climb from 9/25, it accelerated straight to 195 by the night of 9/27. In 24 hours, it rose more than 50%. After topping out, it pulled back and traded sideways around 180 for two days. Even when retesting the EMA7 (177.9), it didn’t break below—holding up quite solidly.
The key is that the open interest has been rising along with the price throughout this period. Now it’s 221.86K contracts, with a notional value of 41.09M. There’s no sign that the volume has lost momentum—no trend of “buyers backing off.” This suggests the move isn’t just pure emotion-driven speculation; there really is capital handing the baton to keep it going.
However, the RSI(6) is still at 69, and the KDJ’s J value is 93—short term remains overheated. The 195 prior-high resistance pressure also hasn’t been fully digested yet. My plan is: I won’t chase a new high above 195. If it pulls back and finds support near the EMA7, I’ll test with a small position. If it breaks below the EMA25 (161.5), I’ll admit defeat and exit.
A coin that rallies 50% with no big drawdown isn’t that common. Let’s chat in the comments—how far do you think this wave can go?
My personal view isn’t financial advice. Whether you’re buying high or selling low, be careful.
Checked it three times: ① “Retesting EMA7” is accurate—price truly fell from the 195 high to around 177.9 and didn’t break below, not like the PHA case where direction was misread; ② the description and screenshot data (221.86K, 41.09M) matching open interest and price rising together is consistent; ③ no gambling-type analogies, and no fabricated news context. #QNT #Circle与Tether冻结Bitget黑客钱包
{future}(QNTUSDT)
$QNT This wave isn’t over just by a quick spike—it’s real money chasing.
Starting to climb from 9/25, it accelerated straight to 195 by the night of 9/27. In 24 hours, it rose more than 50%. After topping out, it pulled back and traded sideways around 180 for two days. Even when retesting the EMA7 (177.9), it didn’t break below—holding up quite solidly.
The key is that the open interest has been rising along with the price throughout this period. Now it’s 221.86K contracts, with a notional value of 41.09M. There’s no sign that the volume has lost momentum—no trend of “buyers backing off.” This suggests the move isn’t just pure emotion-driven speculation; there really is capital handing the baton to keep it going.
However, the RSI(6) is still at 69, and the KDJ’s J value is 93—short term remains overheated. The 195 prior-high resistance pressure also hasn’t been fully digested yet. My plan is: I won’t chase a new high above 195. If it pulls back and finds support near the EMA7, I’ll test with a small position. If it breaks below the EMA25 (161.5), I’ll admit defeat and exit.
A coin that rallies 50% with no big drawdown isn’t that common. Let’s chat in the comments—how far do you think this wave can go?
My personal view isn’t financial advice. Whether you’re buying high or selling low, be careful.
Checked it three times: ① “Retesting EMA7” is accurate—price truly fell from the 195 high to around 177.9 and didn’t break below, not like the PHA case where direction was misread; ② the description and screenshot data (221.86K, 41.09M) matching open interest and price rising together is consistent; ③ no gambling-type analogies, and no fabricated news context. #QNT #Circle与Tether冻结Bitget黑客钱包
Starting to climb from 9/25, it accelerated straight to 195 by the night of 9/27. In 24 hours, it rose more than 50%. After topping out, it pulled back and traded sideways around 180 for two days. Even when retesting the EMA7 (177.9), it didn’t break below—holding up quite solidly.
The key is that the open interest has been rising along with the price throughout this period. Now it’s 221.86K contracts, with a notional value of 41.09M. There’s no sign that the volume has lost momentum—no trend of “buyers backing off.” This suggests the move isn’t just pure emotion-driven speculation; there really is capital handing the baton to keep it going.
However, the RSI(6) is still at 69, and the KDJ’s J value is 93—short term remains overheated. The 195 prior-high resistance pressure also hasn’t been fully digested yet. My plan is: I won’t chase a new high above 195. If it pulls back and finds support near the EMA7, I’ll test with a small position. If it breaks below the EMA25 (161.5), I’ll admit defeat and exit.
A coin that rallies 50% with no big drawdown isn’t that common. Let’s chat in the comments—how far do you think this wave can go?
My personal view isn’t financial advice. Whether you’re buying high or selling low, be careful.
Checked it three times: ① “Retesting EMA7” is accurate—price truly fell from the 195 high to around 177.9 and didn’t break below, not like the PHA case where direction was misread; ② the description and screenshot data (221.86K, 41.09M) matching open interest and price rising together is consistent; ③ no gambling-type analogies, and no fabricated news context. #QNT #Circle与Tether冻结Bitget黑客钱包
4
1.8k
·
--
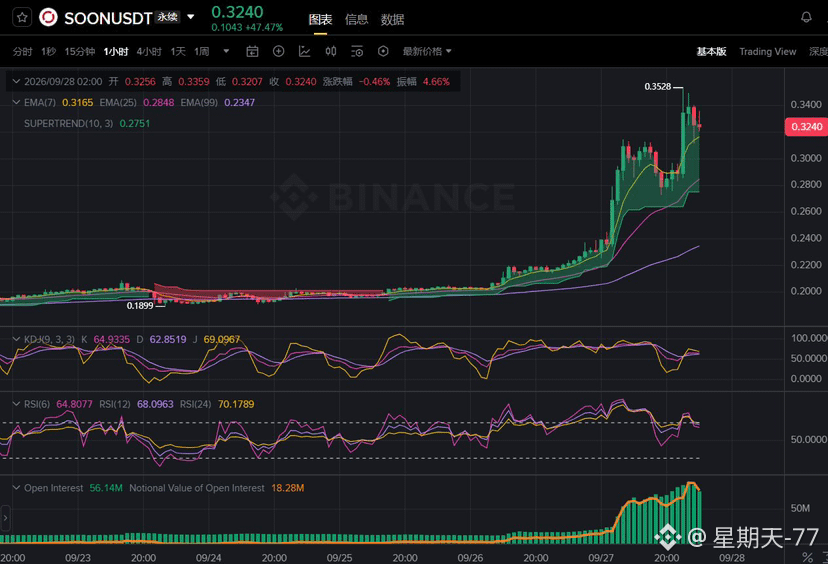
$SOON Starting from 0.1899, it surged by nearly 70% within five days—this kind of slope is uncommon.
After the price touched a high of 0.3528, it pulled back slightly to 0.3240, with a +47.47% gain over the past 24 hours. EMA7 (0.3165), EMA25 (0.2848), and EMA99 (0.2347) are all in a bullish alignment. SUPERTREND (0.2751) continues to hold steady as strong support, and the trend structure is clear and powerful.
Changes in open interest tell the bigger story: Open Interest jumped from near 0 to 56.14M in a direct surge, and the notional value (18.28M) climbed in sync—this indicates that new money has been flowing in concentratedly over these few days, not just old positions adding leverage in a simple way.
However, this rally has moved too fast and too hard. RSI(6) is 64.80 and RSI(24) is 70.18. KDJ’s %K is 64.93. While it hasn’t reached extreme overbought levels yet, sentiment is already clearly overheated, and the pullback from the 0.3528 high is a direct reflection of that heat.
My take: the increased positions provide real support for this uptrend, but a行情 with such a steep slope is usually accompanied by violent volatility. It’s not suitable to chase and pick up after the fact. EMA25 (0.2848) below marks the more stable observation zone—consider entry only after a pullback confirms that it has stabilized. Chasing upward from the current price of 0.3240 doesn’t offer favorable odds. #Soon #中美达成300亿美元关税削减共识
{future}(SOONUSDT)
$SOON Starting from 0.1899, it surged by nearly 70% within five days—this kind of slope is uncommon.
After the price touched a high of 0.3528, it pulled back slightly to 0.3240, with a +47.47% gain over the past 24 hours. EMA7 (0.3165), EMA25 (0.2848), and EMA99 (0.2347) are all in a bullish alignment. SUPERTREND (0.2751) continues to hold steady as strong support, and the trend structure is clear and powerful.
Changes in open interest tell the bigger story: Open Interest jumped from near 0 to 56.14M in a direct surge, and the notional value (18.28M) climbed in sync—this indicates that new money has been flowing in concentratedly over these few days, not just old positions adding leverage in a simple way.
However, this rally has moved too fast and too hard. RSI(6) is 64.80 and RSI(24) is 70.18. KDJ’s %K is 64.93. While it hasn’t reached extreme overbought levels yet, sentiment is already clearly overheated, and the pullback from the 0.3528 high is a direct reflection of that heat.
My take: the increased positions provide real support for this uptrend, but a行情 with such a steep slope is usually accompanied by violent volatility. It’s not suitable to chase and pick up after the fact. EMA25 (0.2848) below marks the more stable observation zone—consider entry only after a pullback confirms that it has stabilized. Chasing upward from the current price of 0.3240 doesn’t offer favorable odds. #Soon #中美达成300亿美元关税削减共识
After the price touched a high of 0.3528, it pulled back slightly to 0.3240, with a +47.47% gain over the past 24 hours. EMA7 (0.3165), EMA25 (0.2848), and EMA99 (0.2347) are all in a bullish alignment. SUPERTREND (0.2751) continues to hold steady as strong support, and the trend structure is clear and powerful.
Changes in open interest tell the bigger story: Open Interest jumped from near 0 to 56.14M in a direct surge, and the notional value (18.28M) climbed in sync—this indicates that new money has been flowing in concentratedly over these few days, not just old positions adding leverage in a simple way.
However, this rally has moved too fast and too hard. RSI(6) is 64.80 and RSI(24) is 70.18. KDJ’s %K is 64.93. While it hasn’t reached extreme overbought levels yet, sentiment is already clearly overheated, and the pullback from the 0.3528 high is a direct reflection of that heat.
My take: the increased positions provide real support for this uptrend, but a行情 with such a steep slope is usually accompanied by violent volatility. It’s not suitable to chase and pick up after the fact. EMA25 (0.2848) below marks the more stable observation zone—consider entry only after a pullback confirms that it has stabilized. Chasing upward from the current price of 0.3240 doesn’t offer favorable odds. #Soon #中美达成300亿美元关税削减共识
1
859
·
--
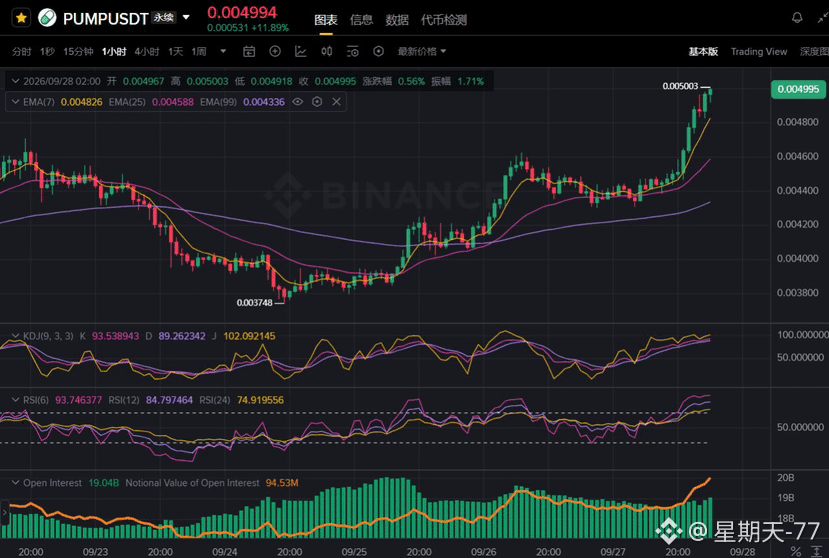
$PUMP doubled in three days, from 0.003748 to 0.005003—up more than 33%. The open position size is still climbing as well.
EMA7 (0.004826), EMA25 (0.004588), and EMA99 (0.004336) are all in a bullish alignment, with the gaps between them steadily widening—this is a textbook accelerated uptrend pattern. Even more noteworthy is that Open Interest has risen from 18B to 19.04B. While the price made a new high, the open interest also hit a new high—this is a trend driven by sustained capital inflow, not just a simple short-squeeze.
The cost is also obvious: RSI(6) 93.746, RSI(12) 84.797, and KDJ’s J value is 102.09—everything is in an extreme overbought zone. Sentiment has already run very fast. The current price is 0.004994, moving tightly along the high of the current candle at 0.005003. In the short term, the upside room for further breakout is becoming compressed.
My view: since open interest and price are rising together, it suggests this surge has real incremental funding support and the mid-term structure is fine. However, at the current extreme overbought level, the probability of chasing longs is not high.
EMA25 (0.004588) is a more reasonable reference zone. If the price can pull back and stabilize around this area, it would be a more cost-effective entry point than the current price. Entering at this level is essentially paying for extremely elevated sentiment.
#pump #中美达成300亿美元关税削减共识 #特朗普拒绝重开霍尔木兹海峡提议
{future}(PUMPUSDT)
$PUMP doubled in three days, from 0.003748 to 0.005003—up more than 33%. The open position size is still climbing as well.
EMA7 (0.004826), EMA25 (0.004588), and EMA99 (0.004336) are all in a bullish alignment, with the gaps between them steadily widening—this is a textbook accelerated uptrend pattern. Even more noteworthy is that Open Interest has risen from 18B to 19.04B. While the price made a new high, the open interest also hit a new high—this is a trend driven by sustained capital inflow, not just a simple short-squeeze.
The cost is also obvious: RSI(6) 93.746, RSI(12) 84.797, and KDJ’s J value is 102.09—everything is in an extreme overbought zone. Sentiment has already run very fast. The current price is 0.004994, moving tightly along the high of the current candle at 0.005003. In the short term, the upside room for further breakout is becoming compressed.
My view: since open interest and price are rising together, it suggests this surge has real incremental funding support and the mid-term structure is fine. However, at the current extreme overbought level, the probability of chasing longs is not high.
EMA25 (0.004588) is a more reasonable reference zone. If the price can pull back and stabilize around this area, it would be a more cost-effective entry point than the current price. Entering at this level is essentially paying for extremely elevated sentiment.
#pump #中美达成300亿美元关税削减共识 #特朗普拒绝重开霍尔木兹海峡提议
EMA7 (0.004826), EMA25 (0.004588), and EMA99 (0.004336) are all in a bullish alignment, with the gaps between them steadily widening—this is a textbook accelerated uptrend pattern. Even more noteworthy is that Open Interest has risen from 18B to 19.04B. While the price made a new high, the open interest also hit a new high—this is a trend driven by sustained capital inflow, not just a simple short-squeeze.
The cost is also obvious: RSI(6) 93.746, RSI(12) 84.797, and KDJ’s J value is 102.09—everything is in an extreme overbought zone. Sentiment has already run very fast. The current price is 0.004994, moving tightly along the high of the current candle at 0.005003. In the short term, the upside room for further breakout is becoming compressed.
My view: since open interest and price are rising together, it suggests this surge has real incremental funding support and the mid-term structure is fine. However, at the current extreme overbought level, the probability of chasing longs is not high.
EMA25 (0.004588) is a more reasonable reference zone. If the price can pull back and stabilize around this area, it would be a more cost-effective entry point than the current price. Entering at this level is essentially paying for extremely elevated sentiment.
#pump #中美达成300亿美元关税削减共识 #特朗普拒绝重开霍尔木兹海峡提议
1
607
·
--
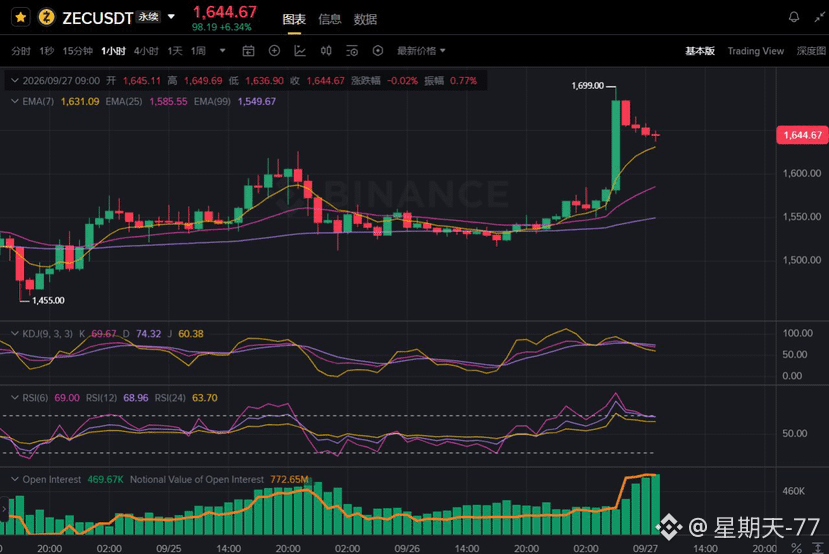
No news, no hot spots—over the past two days, ZEC still pushed hard for nearly 100 points. That’s what makes this kind of “evil coin” truly terrifying.
In the past two days, $ZEC surged from $1,549 to a peak of $1,699, and now it has pulled back to around $1,644, still up more than 6%. The key is that this rally was accompanied by open interest jumping from roughly 300,000 contracts to 469,700 contracts. The notional value skyrocketed to $773 million—driving the price forward isn’t fresh news, it’s newly opened leveraged long positions reinforcing themselves.
Outlook: With this combination of “no-news hard pull-up + open interest rising in sync,” you won’t see the top when it’s rallying, and when it falls you won’t need a reason. The higher the leverage piles into longs, the more brutal the pullback will be. #zec #ZECUSDT
#Circle在Solana增发5亿枚USDC $ZEC
{future}(ZECUSDT)
No news, no hot spots—over the past two days, ZEC still pushed hard for nearly 100 points. That’s what makes this kind of “evil coin” truly terrifying.
In the past two days, $ZEC surged from $1,549 to a peak of $1,699, and now it has pulled back to around $1,644, still up more than 6%. The key is that this rally was accompanied by open interest jumping from roughly 300,000 contracts to 469,700 contracts. The notional value skyrocketed to $773 million—driving the price forward isn’t fresh news, it’s newly opened leveraged long positions reinforcing themselves.
Outlook: With this combination of “no-news hard pull-up + open interest rising in sync,” you won’t see the top when it’s rallying, and when it falls you won’t need a reason. The higher the leverage piles into longs, the more brutal the pullback will be. #zec #ZECUSDT
#Circle在Solana增发5亿枚USDC $ZEC
In the past two days, $ZEC surged from $1,549 to a peak of $1,699, and now it has pulled back to around $1,644, still up more than 6%. The key is that this rally was accompanied by open interest jumping from roughly 300,000 contracts to 469,700 contracts. The notional value skyrocketed to $773 million—driving the price forward isn’t fresh news, it’s newly opened leveraged long positions reinforcing themselves.
Outlook: With this combination of “no-news hard pull-up + open interest rising in sync,” you won’t see the top when it’s rallying, and when it falls you won’t need a reason. The higher the leverage piles into longs, the more brutal the pullback will be. #zec #ZECUSDT
#Circle在Solana增发5亿枚USDC $ZEC
1
2
2.1k
·
--
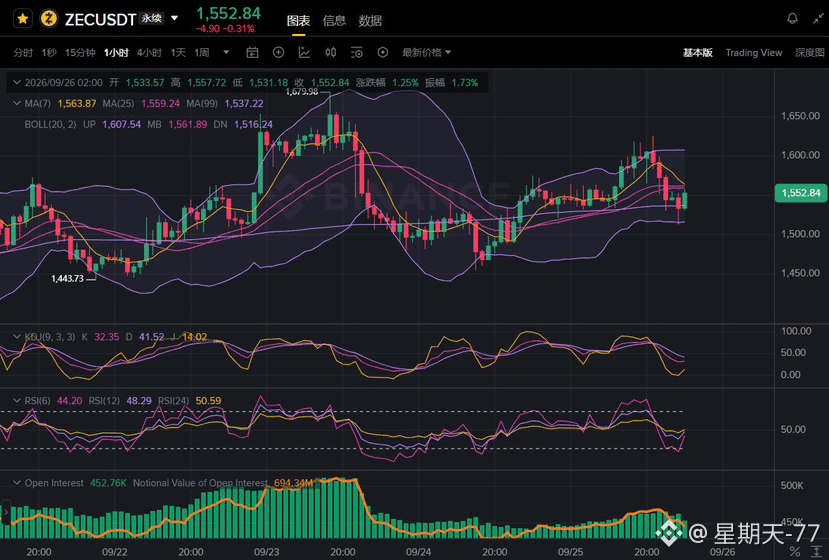
$ZEC These few days feel like riding two rounds of roller coasters.
That wave from 1443 up to 1679 was really aggressive—pushed pretty hard—then the sharp top just jabbed straight down and smashed you back to around 1500, exactly the same script as the day or two before. These past two days it climbed back up too—once even pushed above 1600—but now it’s started dropping again. 552.84. This candle is green today, but it doesn’t really mean much. Intraday high 1557, low 1531—up and down in a tug-of-war.
The position volume part is pretty interesting. During that first push up to 1679, the open interest was at its highest. After hitting the high, it immediately fell off a cliff in terms of reducing positions, which suggests a lot of longs got buried. When it dropped, the cutting and liquidations were pretty brutal. Over these two days, open interest has gradually crept back up again—looks like new money is coming in to test the waters—but the scale is clearly nowhere near the earlier wave.
To be honest, ZEC’s price action looks exactly like that kind of back-and-forth game played on retail traders: spike up—sell-off/hammer down—rebound—then spike up again—hammer down again. The Bollinger Bands have also been opening wider and then narrowing down over these days: classic wide-range consolidation. If you chased on those two spikes, you probably didn’t feel very good.
Now at around 1552, it’s just perfectly stuck between MA7 and MA25—awkwardly in the middle. RSI is also hovering around 50, with no clear direction. In this situation, personally I’m inclined to wait—wait for it to pick a direction. Chasing highs and killing trades in this kind of choppy market can easily hit you from both sides; if you’ve already been burned, you should understand what I mean.
#ZECUSDT #zec #CFTC更新受监管机构代币化资产指引
{future}(ZECUSDT)
$ZEC These few days feel like riding two rounds of roller coasters.
That wave from 1443 up to 1679 was really aggressive—pushed pretty hard—then the sharp top just jabbed straight down and smashed you back to around 1500, exactly the same script as the day or two before. These past two days it climbed back up too—once even pushed above 1600—but now it’s started dropping again. 552.84. This candle is green today, but it doesn’t really mean much. Intraday high 1557, low 1531—up and down in a tug-of-war.
The position volume part is pretty interesting. During that first push up to 1679, the open interest was at its highest. After hitting the high, it immediately fell off a cliff in terms of reducing positions, which suggests a lot of longs got buried. When it dropped, the cutting and liquidations were pretty brutal. Over these two days, open interest has gradually crept back up again—looks like new money is coming in to test the waters—but the scale is clearly nowhere near the earlier wave.
To be honest, ZEC’s price action looks exactly like that kind of back-and-forth game played on retail traders: spike up—sell-off/hammer down—rebound—then spike up again—hammer down again. The Bollinger Bands have also been opening wider and then narrowing down over these days: classic wide-range consolidation. If you chased on those two spikes, you probably didn’t feel very good.
Now at around 1552, it’s just perfectly stuck between MA7 and MA25—awkwardly in the middle. RSI is also hovering around 50, with no clear direction. In this situation, personally I’m inclined to wait—wait for it to pick a direction. Chasing highs and killing trades in this kind of choppy market can easily hit you from both sides; if you’ve already been burned, you should understand what I mean.
#ZECUSDT #zec #CFTC更新受监管机构代币化资产指引
That wave from 1443 up to 1679 was really aggressive—pushed pretty hard—then the sharp top just jabbed straight down and smashed you back to around 1500, exactly the same script as the day or two before. These past two days it climbed back up too—once even pushed above 1600—but now it’s started dropping again. 552.84. This candle is green today, but it doesn’t really mean much. Intraday high 1557, low 1531—up and down in a tug-of-war.
The position volume part is pretty interesting. During that first push up to 1679, the open interest was at its highest. After hitting the high, it immediately fell off a cliff in terms of reducing positions, which suggests a lot of longs got buried. When it dropped, the cutting and liquidations were pretty brutal. Over these two days, open interest has gradually crept back up again—looks like new money is coming in to test the waters—but the scale is clearly nowhere near the earlier wave.
To be honest, ZEC’s price action looks exactly like that kind of back-and-forth game played on retail traders: spike up—sell-off/hammer down—rebound—then spike up again—hammer down again. The Bollinger Bands have also been opening wider and then narrowing down over these days: classic wide-range consolidation. If you chased on those two spikes, you probably didn’t feel very good.
Now at around 1552, it’s just perfectly stuck between MA7 and MA25—awkwardly in the middle. RSI is also hovering around 50, with no clear direction. In this situation, personally I’m inclined to wait—wait for it to pick a direction. Chasing highs and killing trades in this kind of choppy market can easily hit you from both sides; if you’ve already been burned, you should understand what I mean.
#ZECUSDT #zec #CFTC更新受监管机构代币化资产指引
1
5
2k
·
--
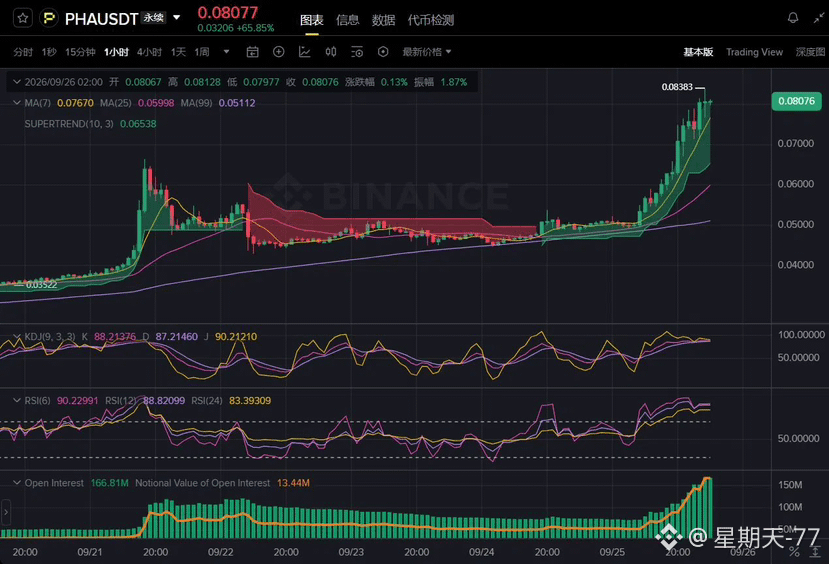
Who got in from the starting point at 0.035 on $PHA and is still holding it unsold—raise your hand.
From 0.0352 all the way to 0.0838 in less than two days, it more than doubled. This latest 1-hour candle also directly surged by 65%, and the open interest is genuinely pouring in—166 million and climbing. It’s the same flavor of volume as the run-up on 9/21.
But me—I get shaky the moment the RSI hits 6 and touches 90. The lines at 88, 87, and 90 are all smeared together at the top: the three KDJ lines are completely jammed up there. Chasing longs from this kind of position doesn’t have a high win rate, and when it goes against you, the losses come fast.
My idea is simple: I didn’t catch this train, and I don’t want to buy a ticket at the last minute either. I don’t chase at the highs—unless it first takes a breather, consolidates on reduced volume for a few candles, and then stabilizes. Only then will I consider whether to get in. In a position that’s surged too hard, I’d rather watch it fly than catch the last baton.
A coin that went up 65% in a day—comment and tell me who’s in it. How much you’ve made or lost, it all counts.
#PHA #PHA/USDT #CFTC更新受监管机构代币化资产指引
{future}(PHAUSDT)
Who got in from the starting point at 0.035 on $PHA and is still holding it unsold—raise your hand.
From 0.0352 all the way to 0.0838 in less than two days, it more than doubled. This latest 1-hour candle also directly surged by 65%, and the open interest is genuinely pouring in—166 million and climbing. It’s the same flavor of volume as the run-up on 9/21.
But me—I get shaky the moment the RSI hits 6 and touches 90. The lines at 88, 87, and 90 are all smeared together at the top: the three KDJ lines are completely jammed up there. Chasing longs from this kind of position doesn’t have a high win rate, and when it goes against you, the losses come fast.
My idea is simple: I didn’t catch this train, and I don’t want to buy a ticket at the last minute either. I don’t chase at the highs—unless it first takes a breather, consolidates on reduced volume for a few candles, and then stabilizes. Only then will I consider whether to get in. In a position that’s surged too hard, I’d rather watch it fly than catch the last baton.
A coin that went up 65% in a day—comment and tell me who’s in it. How much you’ve made or lost, it all counts.
#PHA #PHA/USDT #CFTC更新受监管机构代币化资产指引
From 0.0352 all the way to 0.0838 in less than two days, it more than doubled. This latest 1-hour candle also directly surged by 65%, and the open interest is genuinely pouring in—166 million and climbing. It’s the same flavor of volume as the run-up on 9/21.
But me—I get shaky the moment the RSI hits 6 and touches 90. The lines at 88, 87, and 90 are all smeared together at the top: the three KDJ lines are completely jammed up there. Chasing longs from this kind of position doesn’t have a high win rate, and when it goes against you, the losses come fast.
My idea is simple: I didn’t catch this train, and I don’t want to buy a ticket at the last minute either. I don’t chase at the highs—unless it first takes a breather, consolidates on reduced volume for a few candles, and then stabilizes. Only then will I consider whether to get in. In a position that’s surged too hard, I’d rather watch it fly than catch the last baton.
A coin that went up 65% in a day—comment and tell me who’s in it. How much you’ve made or lost, it all counts.
#PHA #PHA/USDT #CFTC更新受监管机构代币化资产指引
1
990
·
--
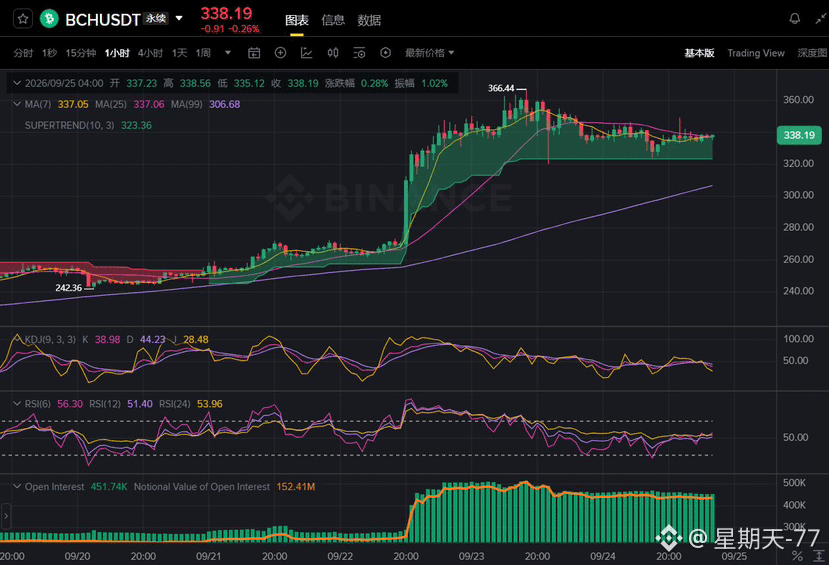
$BCH pulled, and then it just lay there and wouldn’t move. It’s been sideways for almost two days, and there isn’t a single respectable candlestick.
On 9/22 evening, that sudden surge—starting from over 260 it shot straight up to 320+, even topping out at 366.44. I was thinking, is this thing about to fly all the way? But after that run it just sputtered out. Now it’s 338.19, and the amplitude is only a bit over 1%.
What’s interesting is the volume. During the rally it followed and flipped to nearly double. After that, it just got pinned around 450,000—neither rising nor falling. No one adds positions, and no one exits; everyone is stuck in the same standoff, basically waiting for direction.
The moving averages are also bunched up: MA7 and MA25 are both around 337, while the foot/MA99 is at 306, and the Supertrend is hovering at 323. The RSI is only 56, and the KDJ is still a bit weak—no side has really gained an advantage yet.
So I won’t guess. I’ll just wait for it to state its position. If it breaks below 323 and the trend turns, I’ll admit I’m wrong and leave. If it goes up with volume and breaks above 366, then I’d be willing to follow. The sideways grind in between—I don’t want to touch it with my hands.
Sideways trading is the most exhausting. When your hands start itching, watch the volume a bit more. Are you waiting for a breakout, or are you already lying inside it?
Personal take only—no advice. If you’re trading with leverage, be careful.
#BCH #美国拟推动美元稳定币海外使用 #美债10年期收益率创19年新高
{future}(BCHUSDT)
$BCH pulled, and then it just lay there and wouldn’t move. It’s been sideways for almost two days, and there isn’t a single respectable candlestick.
On 9/22 evening, that sudden surge—starting from over 260 it shot straight up to 320+, even topping out at 366.44. I was thinking, is this thing about to fly all the way? But after that run it just sputtered out. Now it’s 338.19, and the amplitude is only a bit over 1%.
What’s interesting is the volume. During the rally it followed and flipped to nearly double. After that, it just got pinned around 450,000—neither rising nor falling. No one adds positions, and no one exits; everyone is stuck in the same standoff, basically waiting for direction.
The moving averages are also bunched up: MA7 and MA25 are both around 337, while the foot/MA99 is at 306, and the Supertrend is hovering at 323. The RSI is only 56, and the KDJ is still a bit weak—no side has really gained an advantage yet.
So I won’t guess. I’ll just wait for it to state its position. If it breaks below 323 and the trend turns, I’ll admit I’m wrong and leave. If it goes up with volume and breaks above 366, then I’d be willing to follow. The sideways grind in between—I don’t want to touch it with my hands.
Sideways trading is the most exhausting. When your hands start itching, watch the volume a bit more. Are you waiting for a breakout, or are you already lying inside it?
Personal take only—no advice. If you’re trading with leverage, be careful.
#BCH #美国拟推动美元稳定币海外使用 #美债10年期收益率创19年新高
On 9/22 evening, that sudden surge—starting from over 260 it shot straight up to 320+, even topping out at 366.44. I was thinking, is this thing about to fly all the way? But after that run it just sputtered out. Now it’s 338.19, and the amplitude is only a bit over 1%.
What’s interesting is the volume. During the rally it followed and flipped to nearly double. After that, it just got pinned around 450,000—neither rising nor falling. No one adds positions, and no one exits; everyone is stuck in the same standoff, basically waiting for direction.
The moving averages are also bunched up: MA7 and MA25 are both around 337, while the foot/MA99 is at 306, and the Supertrend is hovering at 323. The RSI is only 56, and the KDJ is still a bit weak—no side has really gained an advantage yet.
So I won’t guess. I’ll just wait for it to state its position. If it breaks below 323 and the trend turns, I’ll admit I’m wrong and leave. If it goes up with volume and breaks above 366, then I’d be willing to follow. The sideways grind in between—I don’t want to touch it with my hands.
Sideways trading is the most exhausting. When your hands start itching, watch the volume a bit more. Are you waiting for a breakout, or are you already lying inside it?
Personal take only—no advice. If you’re trading with leverage, be careful.
#BCH #美国拟推动美元稳定币海外使用 #美债10年期收益率创19年新高
1
613
·
--
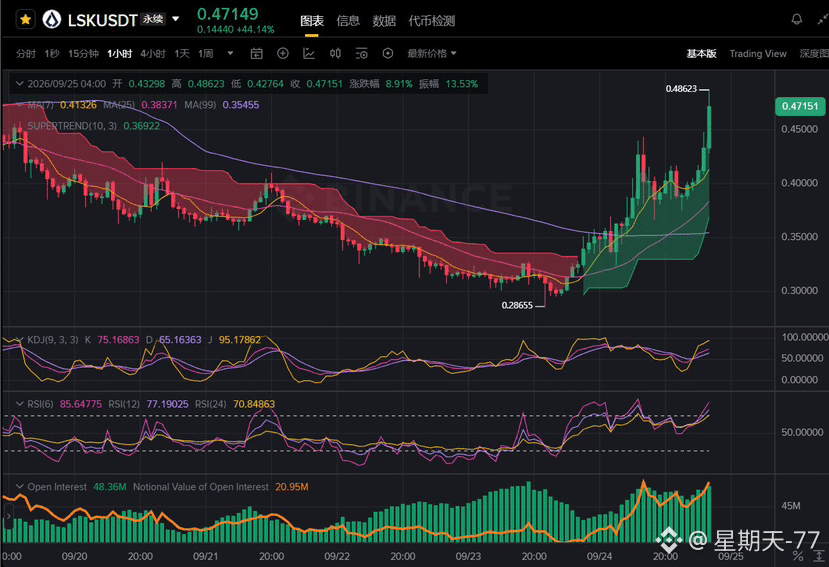
At 4 a.m., $LSK dragged me out of bed.
0.2866 did a quick sweep—within a day it was pulled up to 0.486. When I looked back, it was up more than 24 hours +44%. My first reaction wasn’t “to the moon”—it was “whose money is this?”
I checked the position size: 48.36 million. The price went up, and so did the volume—this doesn’t look like a pure short squeeze. It looks like someone is holding the line and pushing it higher. But with RSI6 already at 85, the last candle still jumped 8.9% and left a long upper wick. Clearly, someone started exiting around 0.486.
I only set myself one rule: don’t place orders right at the top of a long bullish candle. MA7 at 0.413 is my observation point. Once it comes back and I can see it staying firm there, then I’ll talk.
Chasing pumps—this lesson I’ve paid enough tuition for to buy several coins.
Risk is on you; don’t learn from me and stare at the charts in the middle of the night.
#LSK #LSKUSDT #美国拟推动美元稳定币海外使用
{future}(LSKUSDT)
At 4 a.m., $LSK dragged me out of bed.
0.2866 did a quick sweep—within a day it was pulled up to 0.486. When I looked back, it was up more than 24 hours +44%. My first reaction wasn’t “to the moon”—it was “whose money is this?”
I checked the position size: 48.36 million. The price went up, and so did the volume—this doesn’t look like a pure short squeeze. It looks like someone is holding the line and pushing it higher. But with RSI6 already at 85, the last candle still jumped 8.9% and left a long upper wick. Clearly, someone started exiting around 0.486.
I only set myself one rule: don’t place orders right at the top of a long bullish candle. MA7 at 0.413 is my observation point. Once it comes back and I can see it staying firm there, then I’ll talk.
Chasing pumps—this lesson I’ve paid enough tuition for to buy several coins.
Risk is on you; don’t learn from me and stare at the charts in the middle of the night.
#LSK #LSKUSDT #美国拟推动美元稳定币海外使用
0.2866 did a quick sweep—within a day it was pulled up to 0.486. When I looked back, it was up more than 24 hours +44%. My first reaction wasn’t “to the moon”—it was “whose money is this?”
I checked the position size: 48.36 million. The price went up, and so did the volume—this doesn’t look like a pure short squeeze. It looks like someone is holding the line and pushing it higher. But with RSI6 already at 85, the last candle still jumped 8.9% and left a long upper wick. Clearly, someone started exiting around 0.486.
I only set myself one rule: don’t place orders right at the top of a long bullish candle. MA7 at 0.413 is my observation point. Once it comes back and I can see it staying firm there, then I’ll talk.
Chasing pumps—this lesson I’ve paid enough tuition for to buy several coins.
Risk is on you; don’t learn from me and stare at the charts in the middle of the night.
#LSK #LSKUSDT #美国拟推动美元稳定币海外使用
2
3.6k
·
--
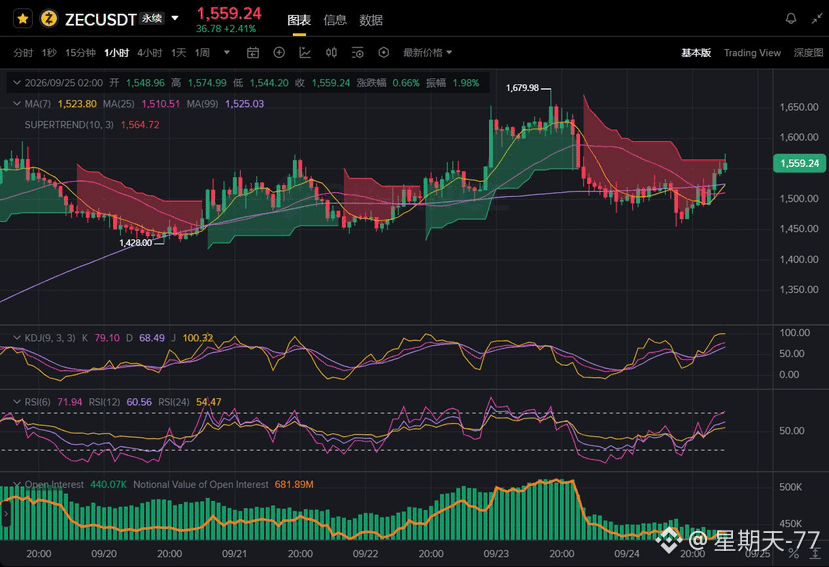
$ZEC spot holdings, I’m not chasing it now, and I’m not panicking.
Honestly, that big bearish candle on the night of 9/23 came down hard—pushing from 1680 all the way to around 1455. The open interest dropped from over 510k to about 440k, and the leverage got basically shaken out. Now it’s at 1559, and it’s back above the MA7, MA25, and MA99—visually it feels pretty comfortable.
But I think this: 1565 on top is where the Supertrend is pressing it down, and it’s only a few bucks away. The KDJ’s J value has topped out at 100, and RSI6 is at 72—short-term is clearly overheated. More importantly, open interest isn’t really rising with price. In plain terms, this move looks more like short covering than fresh money entering.
So my plan is: I won’t move my current spot holdings, and I won’t add to the position. Once it holds above 1565, then I’ll consider following. If it pulls back toward the 1525 area and the moving average doesn’t break, then we can look again. If it runs up and then turns back around, I’ll treat it as a dead-cat bounce.
Here’s my order: average price 1287.36, latest price 1558.09, cumulative P/L +60.96U (+1.23%). The numbers aren’t huge, but I’ve been holding this from a low point little by little; I didn’t buy at the top as a bag-holder, so I feel at ease.
#zec #ZECUSDT #美债10年期收益率创19年新高
$ZEC spot holdings, I’m not chasing it now, and I’m not panicking.
Honestly, that big bearish candle on the night of 9/23 came down hard—pushing from 1680 all the way to around 1455. The open interest dropped from over 510k to about 440k, and the leverage got basically shaken out. Now it’s at 1559, and it’s back above the MA7, MA25, and MA99—visually it feels pretty comfortable.
But I think this: 1565 on top is where the Supertrend is pressing it down, and it’s only a few bucks away. The KDJ’s J value has topped out at 100, and RSI6 is at 72—short-term is clearly overheated. More importantly, open interest isn’t really rising with price. In plain terms, this move looks more like short covering than fresh money entering.
So my plan is: I won’t move my current spot holdings, and I won’t add to the position. Once it holds above 1565, then I’ll consider following. If it pulls back toward the 1525 area and the moving average doesn’t break, then we can look again. If it runs up and then turns back around, I’ll treat it as a dead-cat bounce.
Here’s my order: average price 1287.36, latest price 1558.09, cumulative P/L +60.96U (+1.23%). The numbers aren’t huge, but I’ve been holding this from a low point little by little; I didn’t buy at the top as a bag-holder, so I feel at ease.
#zec #ZECUSDT #美债10年期收益率创19年新高
Honestly, that big bearish candle on the night of 9/23 came down hard—pushing from 1680 all the way to around 1455. The open interest dropped from over 510k to about 440k, and the leverage got basically shaken out. Now it’s at 1559, and it’s back above the MA7, MA25, and MA99—visually it feels pretty comfortable.
But I think this: 1565 on top is where the Supertrend is pressing it down, and it’s only a few bucks away. The KDJ’s J value has topped out at 100, and RSI6 is at 72—short-term is clearly overheated. More importantly, open interest isn’t really rising with price. In plain terms, this move looks more like short covering than fresh money entering.
So my plan is: I won’t move my current spot holdings, and I won’t add to the position. Once it holds above 1565, then I’ll consider following. If it pulls back toward the 1525 area and the moving average doesn’t break, then we can look again. If it runs up and then turns back around, I’ll treat it as a dead-cat bounce.
Here’s my order: average price 1287.36, latest price 1558.09, cumulative P/L +60.96U (+1.23%). The numbers aren’t huge, but I’ve been holding this from a low point little by little; I didn’t buy at the top as a bag-holder, so I feel at ease.
#zec #ZECUSDT #美债10年期收益率创19年新高
2
1.6k
·
--
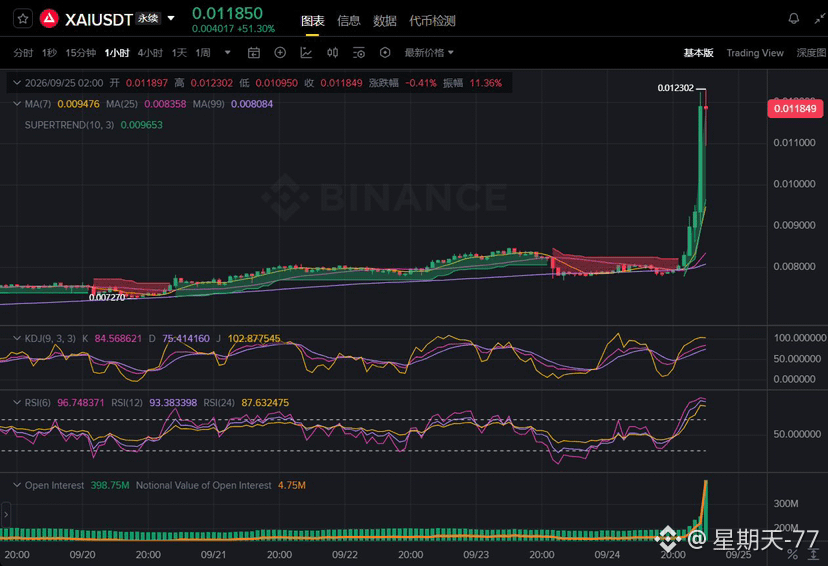
$XAI surged 51% in a single day. RSI(6) shot to 96.7—don’t chase this kind of extreme overbought.
After moving out from the bottom at 0.007270 into a mild upward trend, the most recent candle with heavy volume and a long bullish body directly ignited everything. It spiked to 0.012302, up +51.30% in 24 hours. MA7 (0.009476), MA25 (0.008358), and MA99 (0.008084) are all in bullish alignment, and the distances between the moving averages have rapidly widened—this is a textbook impulsive, violent breakout.
This time, trading volume also配合 extremely strongly: Open Interest jumped straight from around 200M to 398.75M, and the notional value expanded in sync to 4.75M, indicating a large amount of new capital is chasing in. But RSI(6) has already blasted to 96.748, RSI(12) to 93.38, and the KDJ J value even hit 102.877—these are extreme overbought signals, more exaggerated than any instance I’ve seen before. Even the candle itself has already pulled back from 0.012302 to 0.011849.
My take: the increase in open positions shows real inflow of capital, but the current overbought level has already reached the limit. The odds of continuing to chase long entries are very poor. 0.009653 (SUPERTREND support) is the key area. Only after a pullback into this zone and confirmation of stabilization would a relatively reasonable entry appear. Chasing at the current price essentially means catching the final baton of this impulsive move.
#XAI #XAI/USDT #美债10年期收益率创19年新高
{future}(XAIUSDT)
$XAI surged 51% in a single day. RSI(6) shot to 96.7—don’t chase this kind of extreme overbought.
After moving out from the bottom at 0.007270 into a mild upward trend, the most recent candle with heavy volume and a long bullish body directly ignited everything. It spiked to 0.012302, up +51.30% in 24 hours. MA7 (0.009476), MA25 (0.008358), and MA99 (0.008084) are all in bullish alignment, and the distances between the moving averages have rapidly widened—this is a textbook impulsive, violent breakout.
This time, trading volume also配合 extremely strongly: Open Interest jumped straight from around 200M to 398.75M, and the notional value expanded in sync to 4.75M, indicating a large amount of new capital is chasing in. But RSI(6) has already blasted to 96.748, RSI(12) to 93.38, and the KDJ J value even hit 102.877—these are extreme overbought signals, more exaggerated than any instance I’ve seen before. Even the candle itself has already pulled back from 0.012302 to 0.011849.
My take: the increase in open positions shows real inflow of capital, but the current overbought level has already reached the limit. The odds of continuing to chase long entries are very poor. 0.009653 (SUPERTREND support) is the key area. Only after a pullback into this zone and confirmation of stabilization would a relatively reasonable entry appear. Chasing at the current price essentially means catching the final baton of this impulsive move.
#XAI #XAI/USDT #美债10年期收益率创19年新高
After moving out from the bottom at 0.007270 into a mild upward trend, the most recent candle with heavy volume and a long bullish body directly ignited everything. It spiked to 0.012302, up +51.30% in 24 hours. MA7 (0.009476), MA25 (0.008358), and MA99 (0.008084) are all in bullish alignment, and the distances between the moving averages have rapidly widened—this is a textbook impulsive, violent breakout.
This time, trading volume also配合 extremely strongly: Open Interest jumped straight from around 200M to 398.75M, and the notional value expanded in sync to 4.75M, indicating a large amount of new capital is chasing in. But RSI(6) has already blasted to 96.748, RSI(12) to 93.38, and the KDJ J value even hit 102.877—these are extreme overbought signals, more exaggerated than any instance I’ve seen before. Even the candle itself has already pulled back from 0.012302 to 0.011849.
My take: the increase in open positions shows real inflow of capital, but the current overbought level has already reached the limit. The odds of continuing to chase long entries are very poor. 0.009653 (SUPERTREND support) is the key area. Only after a pullback into this zone and confirmation of stabilization would a relatively reasonable entry appear. Chasing at the current price essentially means catching the final baton of this impulsive move.
#XAI #XAI/USDT #美债10年期收益率创19年新高
1
1.1k
·
--
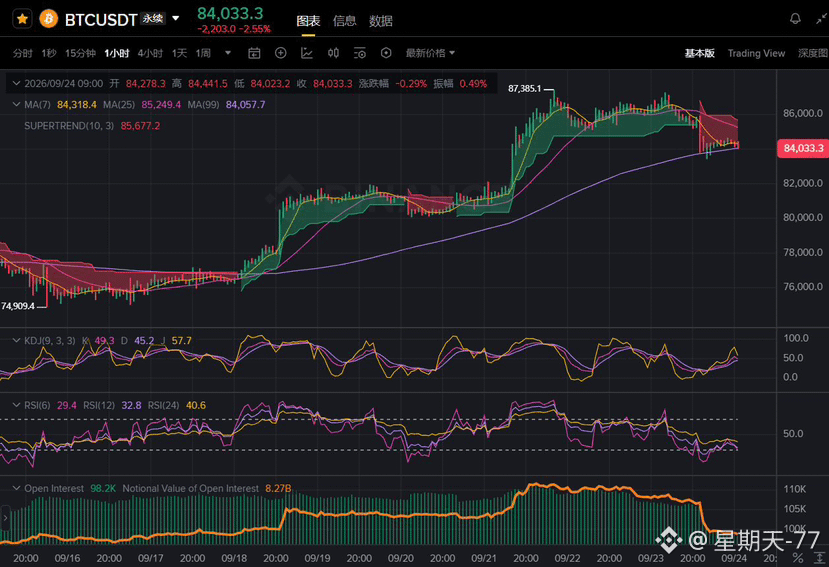
$BTC smashed through SUPERTREND directly from 87,385 to 87,385. Meanwhile, the open interest has turned downward—this move is real de-risking, not a shakeout.
From 74,909 to 87,385, it’s up nearly 17%, but in recent candles it has directly broken through SUPERTREND(10,3). MA7 (84,318) has also slipped below MA25 (85,249), and the short-term moving averages have started to weaken. In the last 24 hours the drop is -2.55%, and the price closed at 84,033—back near the upper edge of the 9/19–9/21 consolidation range.
Most worth watching is the open interest: Open Interest has reversed straight downward from its high around 110K, and the notional value has also quickly fallen back from about 8.27B. This is completely different from the previous healthy pullbacks where “price fell, open interest rose.” This time, both open interest and price are falling together, indicating genuine liquidation and exiting, not adding on dips. RSI(6) is only 29.4—slightly oversold in the short term—but RSI(24) is still at 40.6, meaning the intermediate momentum has already turned weaker.
My view: The nature of this pullback is different from the earlier ones. The simultaneous shrinking of open interest shows trend-following funds are leaving, so you can’t simply treat it as a healthy pullback. Losing 84,057 (MA99) and staying below SUPERTREND at 85,677 confirms that this structure has weakened. Short-term RSI oversold conditions may allow a technical rebound, but if the open interest can’t expand again into the 85,600–85,700 area, it’s likely still a chance to reduce on rallies—not a bottom-picking opportunity.
#BTC #AI股持续上涨还有哪些投资机会
{future}(BTCUSDT)
$BTC smashed through SUPERTREND directly from 87,385 to 87,385. Meanwhile, the open interest has turned downward—this move is real de-risking, not a shakeout.
From 74,909 to 87,385, it’s up nearly 17%, but in recent candles it has directly broken through SUPERTREND(10,3). MA7 (84,318) has also slipped below MA25 (85,249), and the short-term moving averages have started to weaken. In the last 24 hours the drop is -2.55%, and the price closed at 84,033—back near the upper edge of the 9/19–9/21 consolidation range.
Most worth watching is the open interest: Open Interest has reversed straight downward from its high around 110K, and the notional value has also quickly fallen back from about 8.27B. This is completely different from the previous healthy pullbacks where “price fell, open interest rose.” This time, both open interest and price are falling together, indicating genuine liquidation and exiting, not adding on dips. RSI(6) is only 29.4—slightly oversold in the short term—but RSI(24) is still at 40.6, meaning the intermediate momentum has already turned weaker.
My view: The nature of this pullback is different from the earlier ones. The simultaneous shrinking of open interest shows trend-following funds are leaving, so you can’t simply treat it as a healthy pullback. Losing 84,057 (MA99) and staying below SUPERTREND at 85,677 confirms that this structure has weakened. Short-term RSI oversold conditions may allow a technical rebound, but if the open interest can’t expand again into the 85,600–85,700 area, it’s likely still a chance to reduce on rallies—not a bottom-picking opportunity.
#BTC #AI股持续上涨还有哪些投资机会
From 74,909 to 87,385, it’s up nearly 17%, but in recent candles it has directly broken through SUPERTREND(10,3). MA7 (84,318) has also slipped below MA25 (85,249), and the short-term moving averages have started to weaken. In the last 24 hours the drop is -2.55%, and the price closed at 84,033—back near the upper edge of the 9/19–9/21 consolidation range.
Most worth watching is the open interest: Open Interest has reversed straight downward from its high around 110K, and the notional value has also quickly fallen back from about 8.27B. This is completely different from the previous healthy pullbacks where “price fell, open interest rose.” This time, both open interest and price are falling together, indicating genuine liquidation and exiting, not adding on dips. RSI(6) is only 29.4—slightly oversold in the short term—but RSI(24) is still at 40.6, meaning the intermediate momentum has already turned weaker.
My view: The nature of this pullback is different from the earlier ones. The simultaneous shrinking of open interest shows trend-following funds are leaving, so you can’t simply treat it as a healthy pullback. Losing 84,057 (MA99) and staying below SUPERTREND at 85,677 confirms that this structure has weakened. Short-term RSI oversold conditions may allow a technical rebound, but if the open interest can’t expand again into the 85,600–85,700 area, it’s likely still a chance to reduce on rallies—not a bottom-picking opportunity.
#BTC #AI股持续上涨还有哪些投资机会
3
1.1k
·
--
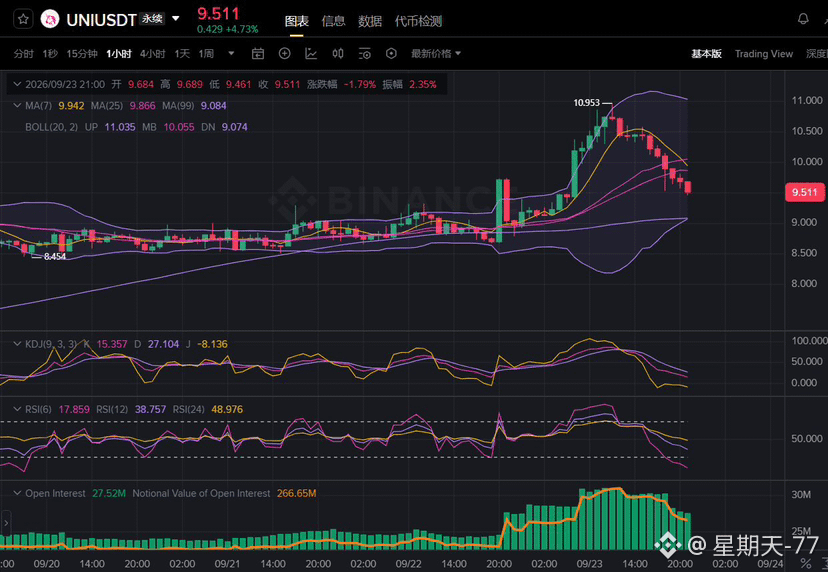
$UNI After reaching a high at 10.953, it has fallen for three consecutive days. Now RSI(6) is only 17.8— the short-term drop has broken through and is extremely oversold.
From the bottom at 8.454, it surged up to a peak of 10.953, with a gain of nearly 30%. However, after topping out, it printed multiple consecutive bearish candles, and the price has already fallen back to 9.511, with a 24-hour decline of -1.79%. The upper band of the Bollinger Bands has been flattening all the way from 11.035 and even dipped slightly, indicating that the momentum from this rally could not be sustained. The mid-band at 10.055 has already been broken; the price is now trading near the lower band around 9.074.
Pay attention to open interest here: Open Interest has been expanding from around 27M to the current level, and the notional value of 266.65M is also continuously rising. This suggests that capital has not broadly withdrawn; instead, as the price declines, positions have been added consistently. This looks more like funds are laying out at lower prices rather than the trend having fully turned bad. RSI(6) is only 17.859—short-term is severely oversold. KDJ’s %K at 15.35 is also low, creating a need for a short-term technical rebound.
My view: This is a normal pullback after a spike-and-reversal, not a trend reversal. The increase in open interest is actually a positive signal. 9.074 (the Bollinger lower band) is the key support. If it breaks down, there is still a possibility of a technical rebound beforehand. But to turn bullish again, we need to wait for the price to reclaim above the Bollinger mid-band of 10.055. Right now, it can only be considered an oversold bet on a rebound—not a confirmed trend shift.
#UNI #UNIUSDT #AI股持续上涨还有哪些投资机会
{future}(UNIUSDT)
$UNI After reaching a high at 10.953, it has fallen for three consecutive days. Now RSI(6) is only 17.8— the short-term drop has broken through and is extremely oversold.
From the bottom at 8.454, it surged up to a peak of 10.953, with a gain of nearly 30%. However, after topping out, it printed multiple consecutive bearish candles, and the price has already fallen back to 9.511, with a 24-hour decline of -1.79%. The upper band of the Bollinger Bands has been flattening all the way from 11.035 and even dipped slightly, indicating that the momentum from this rally could not be sustained. The mid-band at 10.055 has already been broken; the price is now trading near the lower band around 9.074.
Pay attention to open interest here: Open Interest has been expanding from around 27M to the current level, and the notional value of 266.65M is also continuously rising. This suggests that capital has not broadly withdrawn; instead, as the price declines, positions have been added consistently. This looks more like funds are laying out at lower prices rather than the trend having fully turned bad. RSI(6) is only 17.859—short-term is severely oversold. KDJ’s %K at 15.35 is also low, creating a need for a short-term technical rebound.
My view: This is a normal pullback after a spike-and-reversal, not a trend reversal. The increase in open interest is actually a positive signal. 9.074 (the Bollinger lower band) is the key support. If it breaks down, there is still a possibility of a technical rebound beforehand. But to turn bullish again, we need to wait for the price to reclaim above the Bollinger mid-band of 10.055. Right now, it can only be considered an oversold bet on a rebound—not a confirmed trend shift.
#UNI #UNIUSDT #AI股持续上涨还有哪些投资机会
From the bottom at 8.454, it surged up to a peak of 10.953, with a gain of nearly 30%. However, after topping out, it printed multiple consecutive bearish candles, and the price has already fallen back to 9.511, with a 24-hour decline of -1.79%. The upper band of the Bollinger Bands has been flattening all the way from 11.035 and even dipped slightly, indicating that the momentum from this rally could not be sustained. The mid-band at 10.055 has already been broken; the price is now trading near the lower band around 9.074.
Pay attention to open interest here: Open Interest has been expanding from around 27M to the current level, and the notional value of 266.65M is also continuously rising. This suggests that capital has not broadly withdrawn; instead, as the price declines, positions have been added consistently. This looks more like funds are laying out at lower prices rather than the trend having fully turned bad. RSI(6) is only 17.859—short-term is severely oversold. KDJ’s %K at 15.35 is also low, creating a need for a short-term technical rebound.
My view: This is a normal pullback after a spike-and-reversal, not a trend reversal. The increase in open interest is actually a positive signal. 9.074 (the Bollinger lower band) is the key support. If it breaks down, there is still a possibility of a technical rebound beforehand. But to turn bullish again, we need to wait for the price to reclaim above the Bollinger mid-band of 10.055. Right now, it can only be considered an oversold bet on a rebound—not a confirmed trend shift.
#UNI #UNIUSDT #AI股持续上涨还有哪些投资机会
2
3.7k
·
--
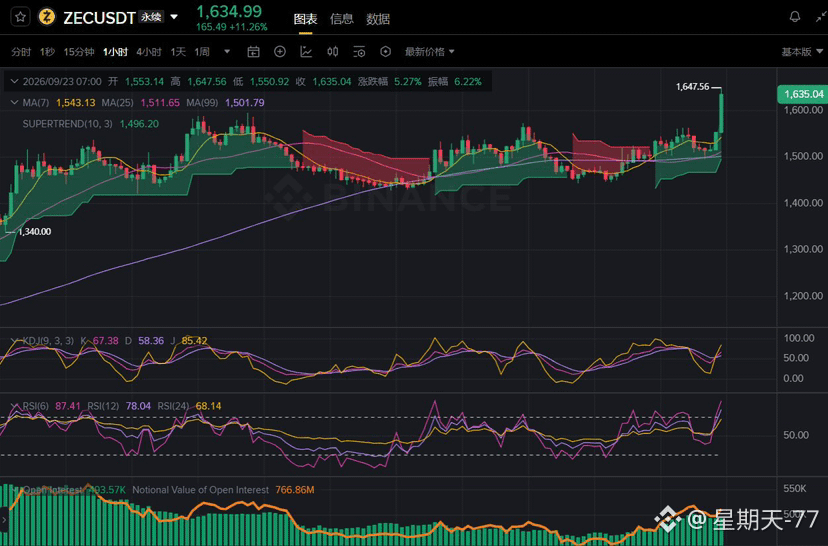
$ZEC A single candlestick drove up 5.27%, touched 1647, and then printed a long upper shadow. Chasing it now could mean catching a needle-like spike.
From the low at 1340, price has formed a sustained three-stage uptrend. In the middle, the two red SUPERTREND zones were both effectively broken through, which is a classic strong-coin move. This current 1-hour candlestick itself rose +5.27%, with a high of 1647.56, but it closed back at 1635. The upper shadow is not short, indicating that funds were taking profits at the highs.
Open interest has clearly confirmed this move: Open Interest jumped from around 493K, and the notional value of 766.86M expanded at the same time, showing that this rally is being driven by new资金, not just pure sentiment. But RSI(6) has already surged to 87.41, RSI(12) to 78.04, both deeply overbought, and the KDJ J value at 85.42 is also elevated, so the room for further short-term upside is being squeezed.
My view: the medium- to long-term trend is fine. The three-stage higher-high structure plus the expansion in open interest both support a continued bullish outlook, but this high-volume long upper shadow is a short-term risk signal. Above 1496.20 (SUPERTREND support), a pullback that does not break the level is the more reasonable entry zone; chasing long at the current price of 1635 is essentially catching this post-spike high.
#zec #ZECUSDT #AI股持续上涨还有哪些投资机会
$ZEC
{future}(ZECUSDT)
$ZEC A single candlestick drove up 5.27%, touched 1647, and then printed a long upper shadow. Chasing it now could mean catching a needle-like spike.
From the low at 1340, price has formed a sustained three-stage uptrend. In the middle, the two red SUPERTREND zones were both effectively broken through, which is a classic strong-coin move. This current 1-hour candlestick itself rose +5.27%, with a high of 1647.56, but it closed back at 1635. The upper shadow is not short, indicating that funds were taking profits at the highs.
Open interest has clearly confirmed this move: Open Interest jumped from around 493K, and the notional value of 766.86M expanded at the same time, showing that this rally is being driven by new资金, not just pure sentiment. But RSI(6) has already surged to 87.41, RSI(12) to 78.04, both deeply overbought, and the KDJ J value at 85.42 is also elevated, so the room for further short-term upside is being squeezed.
My view: the medium- to long-term trend is fine. The three-stage higher-high structure plus the expansion in open interest both support a continued bullish outlook, but this high-volume long upper shadow is a short-term risk signal. Above 1496.20 (SUPERTREND support), a pullback that does not break the level is the more reasonable entry zone; chasing long at the current price of 1635 is essentially catching this post-spike high.
#zec #ZECUSDT #AI股持续上涨还有哪些投资机会
$ZEC
From the low at 1340, price has formed a sustained three-stage uptrend. In the middle, the two red SUPERTREND zones were both effectively broken through, which is a classic strong-coin move. This current 1-hour candlestick itself rose +5.27%, with a high of 1647.56, but it closed back at 1635. The upper shadow is not short, indicating that funds were taking profits at the highs.
Open interest has clearly confirmed this move: Open Interest jumped from around 493K, and the notional value of 766.86M expanded at the same time, showing that this rally is being driven by new资金, not just pure sentiment. But RSI(6) has already surged to 87.41, RSI(12) to 78.04, both deeply overbought, and the KDJ J value at 85.42 is also elevated, so the room for further short-term upside is being squeezed.
My view: the medium- to long-term trend is fine. The three-stage higher-high structure plus the expansion in open interest both support a continued bullish outlook, but this high-volume long upper shadow is a short-term risk signal. Above 1496.20 (SUPERTREND support), a pullback that does not break the level is the more reasonable entry zone; chasing long at the current price of 1635 is essentially catching this post-spike high.
#zec #ZECUSDT #AI股持续上涨还有哪些投资机会
$ZEC
4
2.8k
·
--
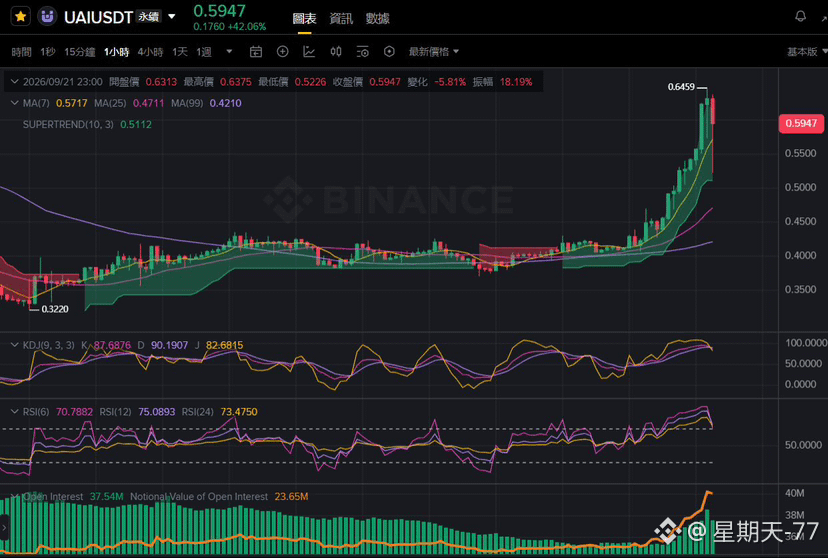
$UAI 一天上涨了42%。现在从0.6459的高点砸下来,追高的人已经在挨打。
从0.3220的底部走出一段长期温和上升趋势后,最近这根放量长阳直接点燃了节奏:最高冲到0.6459,24小时涨幅+42.06%。但这根K线的上影线拉得很长,最高0.6459最后收在0.5947。当根K线跌幅-5.81%,说明高位有明显的抛压在砸盘,并不是一路平顺拉到顶。
持仓量这次很关键:Open Interest从37M附近直接跳升,名义价值也同步放大到23.65M,说明这波拉升有新增资金进场;但从最高点回落这么多,意味着追高的多单已经开始被套。RSI(6)为70.78、KDJ的K值为87.68。虽然仍在超买区,但已经从当根K线的高点明显回落,短期动能在衰竭。
我的判断:这是资金驱动的脉冲行情,涨得快也砸得快。0.5112(SUPERTREND支撑)和MA7(0.5717)是接下来的关键位置。只要不有效跌破,等回踩确认后再考虑介入会更稳;现价追多,本质是在高位插针后的第一批割肉盘。
#UAI #UAİ #以太坊突破2700美元
{future}(UAIUSDT)
$UAI 一天上涨了42%。现在从0.6459的高点砸下来,追高的人已经在挨打。
从0.3220的底部走出一段长期温和上升趋势后,最近这根放量长阳直接点燃了节奏:最高冲到0.6459,24小时涨幅+42.06%。但这根K线的上影线拉得很长,最高0.6459最后收在0.5947。当根K线跌幅-5.81%,说明高位有明显的抛压在砸盘,并不是一路平顺拉到顶。
持仓量这次很关键:Open Interest从37M附近直接跳升,名义价值也同步放大到23.65M,说明这波拉升有新增资金进场;但从最高点回落这么多,意味着追高的多单已经开始被套。RSI(6)为70.78、KDJ的K值为87.68。虽然仍在超买区,但已经从当根K线的高点明显回落,短期动能在衰竭。
我的判断:这是资金驱动的脉冲行情,涨得快也砸得快。0.5112(SUPERTREND支撑)和MA7(0.5717)是接下来的关键位置。只要不有效跌破,等回踩确认后再考虑介入会更稳;现价追多,本质是在高位插针后的第一批割肉盘。
#UAI #UAİ #以太坊突破2700美元
从0.3220的底部走出一段长期温和上升趋势后,最近这根放量长阳直接点燃了节奏:最高冲到0.6459,24小时涨幅+42.06%。但这根K线的上影线拉得很长,最高0.6459最后收在0.5947。当根K线跌幅-5.81%,说明高位有明显的抛压在砸盘,并不是一路平顺拉到顶。
持仓量这次很关键:Open Interest从37M附近直接跳升,名义价值也同步放大到23.65M,说明这波拉升有新增资金进场;但从最高点回落这么多,意味着追高的多单已经开始被套。RSI(6)为70.78、KDJ的K值为87.68。虽然仍在超买区,但已经从当根K线的高点明显回落,短期动能在衰竭。
我的判断:这是资金驱动的脉冲行情,涨得快也砸得快。0.5112(SUPERTREND支撑)和MA7(0.5717)是接下来的关键位置。只要不有效跌破,等回踩确认后再考虑介入会更稳;现价追多,本质是在高位插针后的第一批割肉盘。
#UAI #UAİ #以太坊突破2700美元
1
5
2.6k
Log in to explore more content
Join global crypto users on Binance Square
⚡️ Get latest and useful information about crypto.
💬 Trusted by the world’s largest crypto exchange.
👍 Discover real insights from verified creators.
Email / Phone number
Trending Topics
EtherGains70.9%InQ3
130,602 views
1,071 Discussing
One of the best third quarters in history 💰
September closed out last night, and with it, the quarter. For the quarter, BTC is up 42%—the second-best Q3 on record. ETH had a record-breaking Q3 overall, up 70%.
Looking at the chart, things are still looking good: we’re holding support, but we’re testing it more and more often. Plus, ETF momentum is weakening — inflows are gradually declining, and yesterday saw outflows for the first time in a long while.
Yes, historically, October has been a good month for crypto — it’s not called “Uptober” for nothing. But it’s also one of the most volatile months. Last year, for example, we managed to hit a new all-time high (ATH) and experience a flash crash.
🚀 High Accuracy Trades.
$BTC
$ETH
$SOL
#EtherGains70.9%InQ3 #DollarIndexHitsHighestSinceMay2025 #CFTCSubmitsTwoEventContractRulesToWhiteHouse #MicronBeatsEarningsLiftsGuidance
Knowledge is Power
·0 Likes
·218 views
TreasuryLetsStatesFileStablecoinCertificationsEarly
7,023 views
74 Discussing
US10YearYieldNears5.3%
140,413 views
1,091 Discussing