

币盈社区–程运升
514 Posts

币盈社区–程运升
Report
Block User
2010年从事于黄金外汇操盘分析,黄金分析师,2015年开始研究数字货币,近12年币圈经历,擅长波段操作,有着丰富的操盘经验和实战理论,想及时把握行情机会动向,公众号:A币盈。
Frequent Trader
6.9 Years
1 Following
1.5K+ Followers
794 Liked
Posts
·
--
Bearish
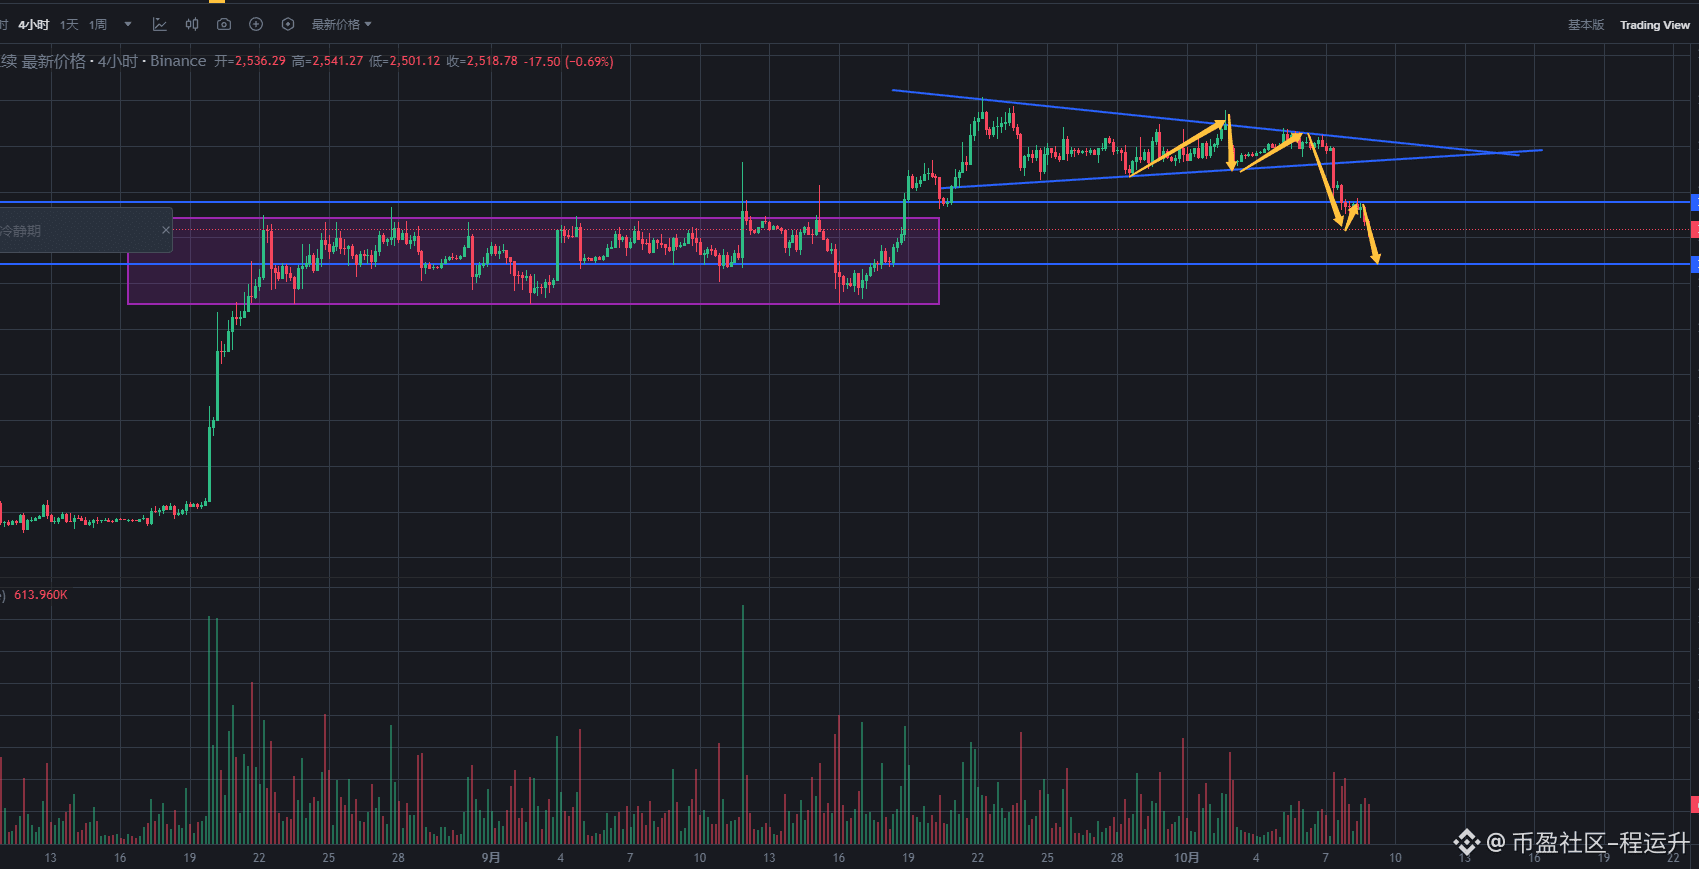
$The chart trend arrives as expected: short the big coin 83100, take profit at 81000, and score 2100 points. Also short Ethereum at 2579, exit at 2430, and take home 150 points.$BTC #以太坊现货ETF单日净流出1.61亿美元 #
$The chart trend arrives as expected: short the big coin 83100, take profit at 81000, and score 2100 points. Also short Ethereum at 2579, exit at 2430, and take home 150 points.$BTC #以太坊现货ETF单日净流出1.61亿美元 #
2
2
1.3k
·
--
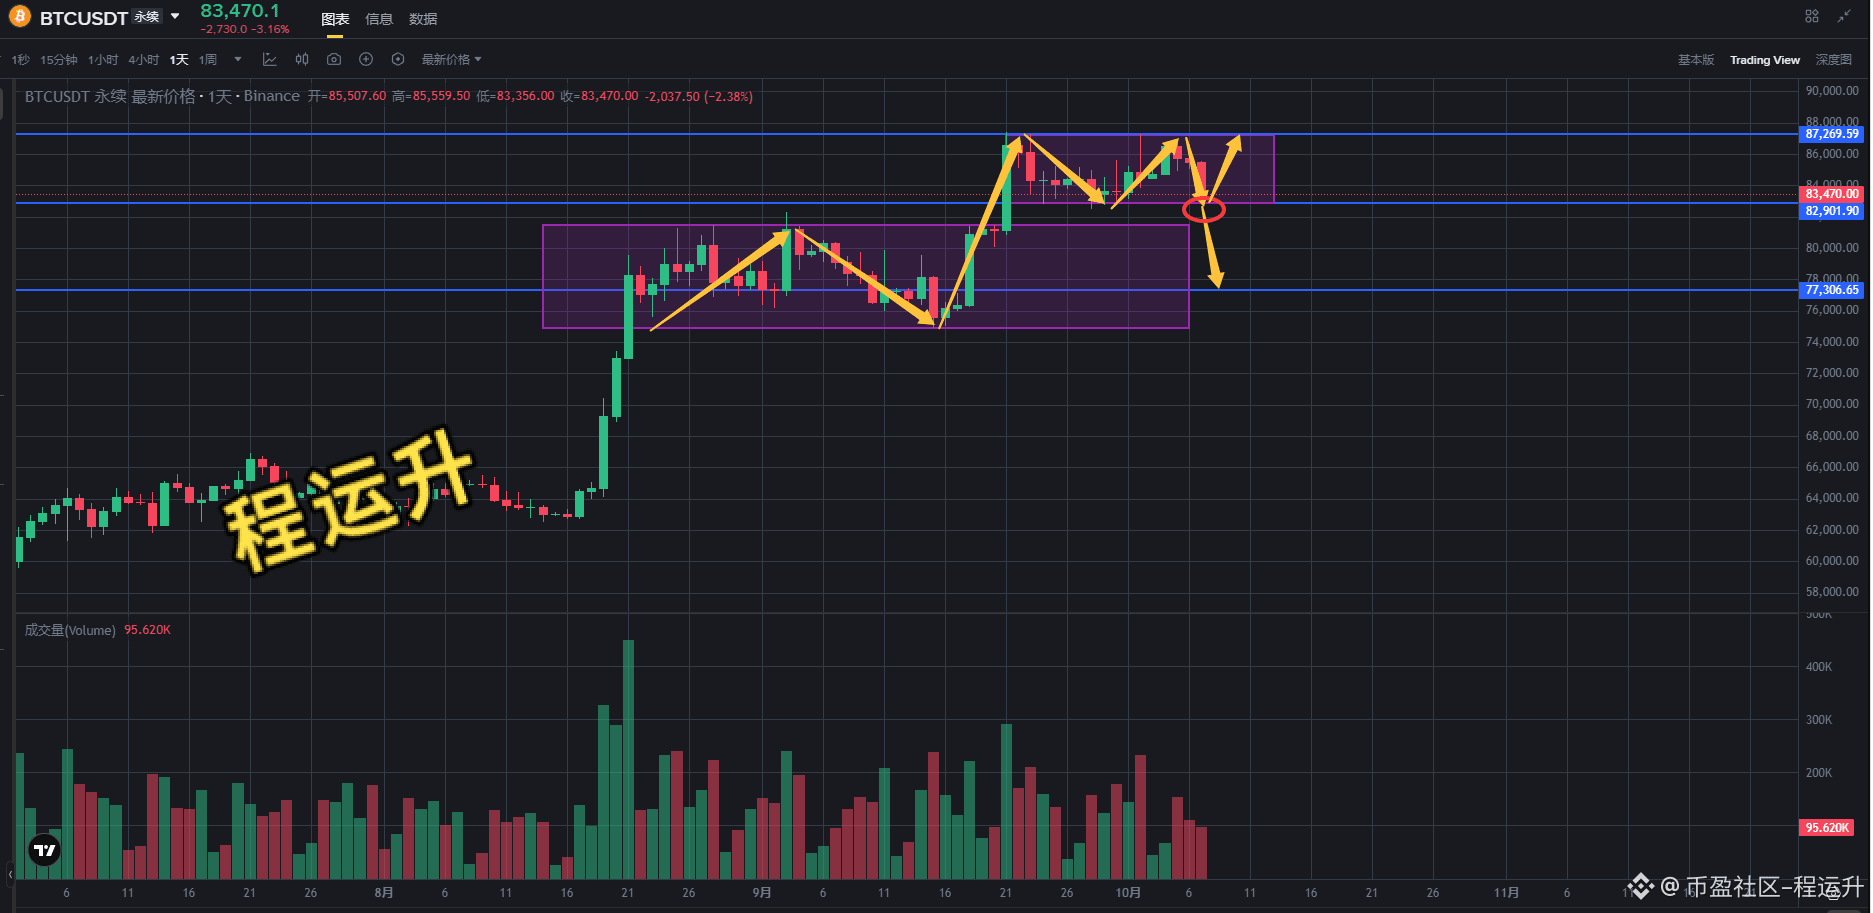
BTC bears have the upper hand in the short term, with price pulling back after moving sideways at elevated levels.
From a chart-pattern perspective, after surging above 88,000 earlier, price entered a wide trading range (purple box).
Watch the previous high near 86,000 as resistance at the upper boundary;
Short-term support is at 82,900, with major support at the lower boundary of 77,300.
Volume expanded during the earlier rally, but has contracted during the recent pullback.
If price breaks below 82,900, the next target is strong support at 77,300.
If 82,900 holds, price may rebound to test resistance at 86,000.
Last night, price failed to break through resistance near 87,300, so the bullish strategy was not triggered.
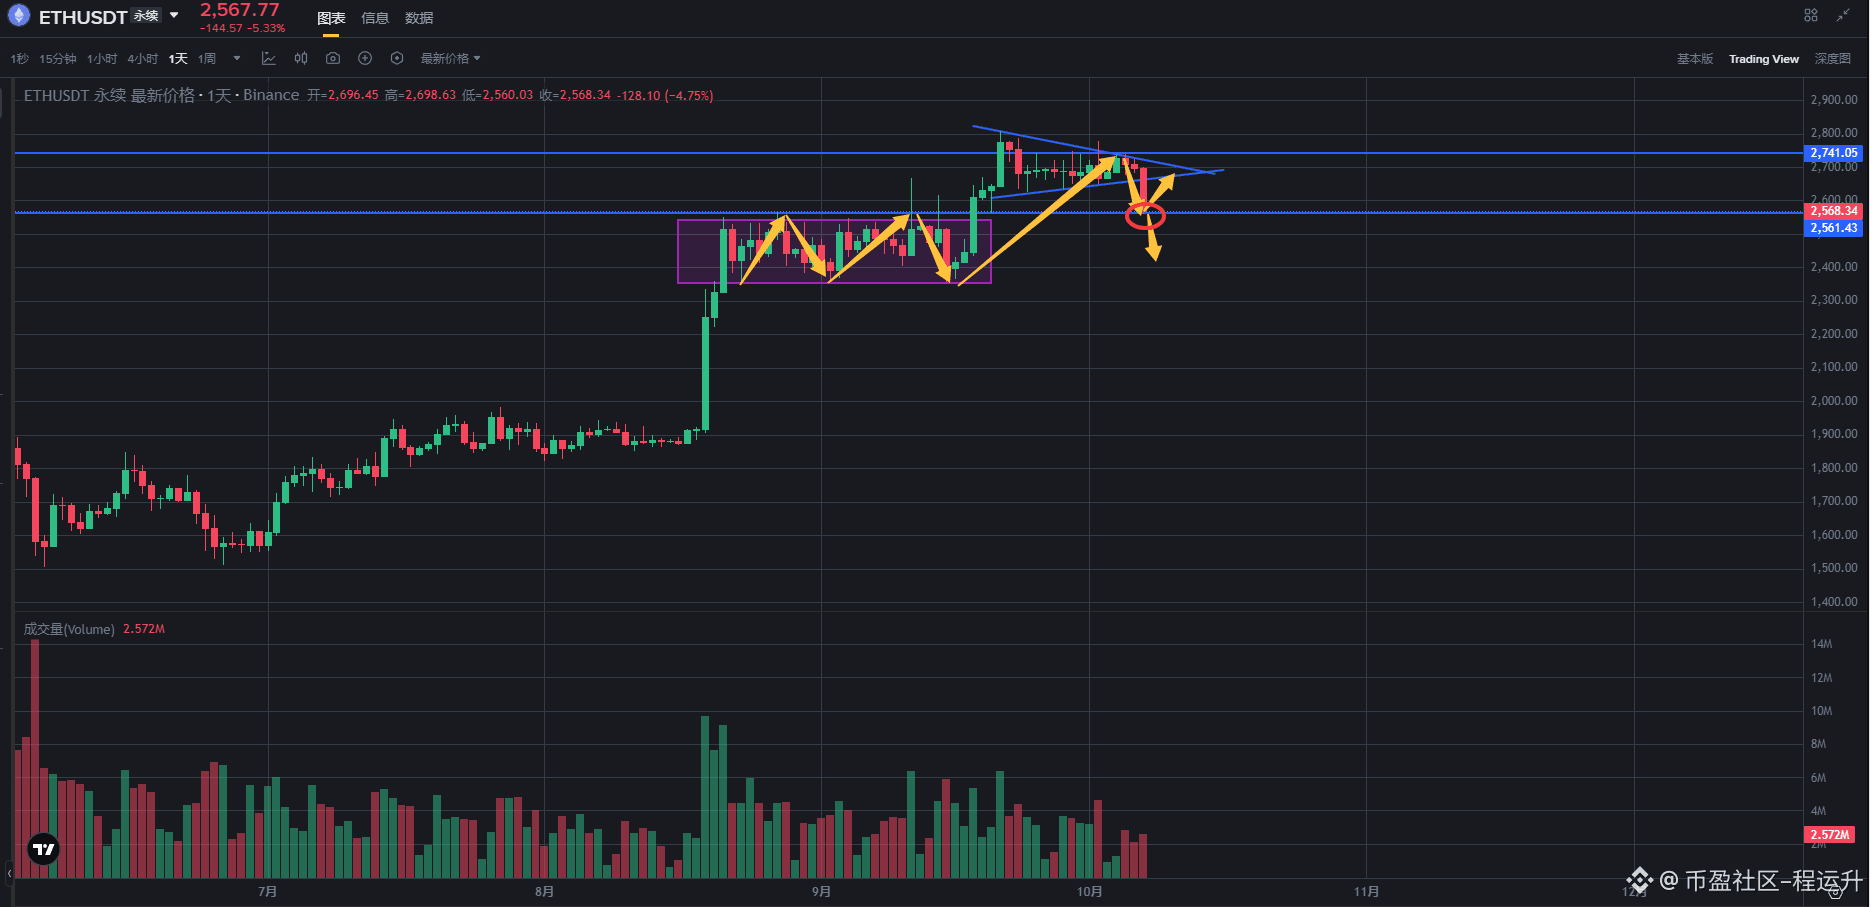
ETH bears are strong in the short term, with price pulling back after a breakdown from elevated levels.
From a chart-pattern perspective, after the earlier surge, price formed an elevated consolidation zone (purple box) and a descending channel (blue diagonal lines). The current candlestick has broken below the lower boundary of the consolidation zone.
Short-term resistance is at 2,611.43 (the bottom of the range / lower channel line); strong resistance is near 2,700, with major support around 2,400.
The current breakdown is accompanied by an increase in volume. The red circle marks the breakdown point:
If price fails to reclaim 2,611 on a rebound, the next target is support at 2,400.
If price rises above 2,611, it will return to the range and may rebound to test 2,700.
#BTC走势分析 #ETH走势分析 $BTC
1
1.2k
·
--
Bullish
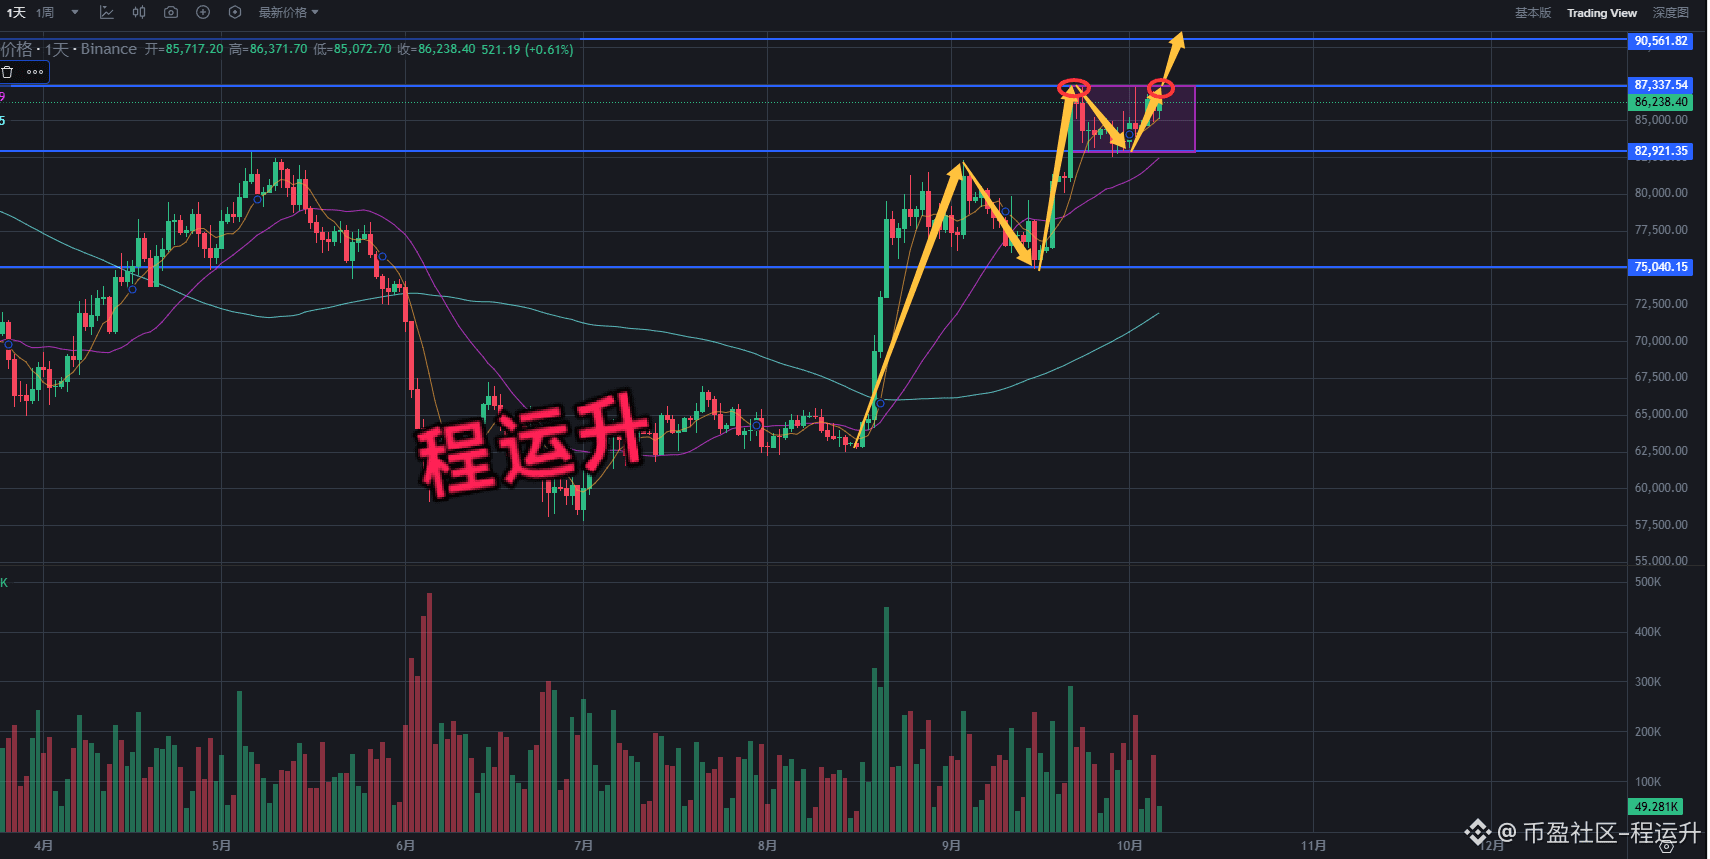
Bitcoin is currently consolidating at elevated levels on the daily chart. The medium- to long-term bullish trend remains intact, while the short term faces resistance from the previous high.
Key resistance above: 87,337 (strong resistance at the previous high).
Short-term support below is at 85,238, with additional horizontal support at 83,000.
Based on the chart pattern and trading volume, price has formed a converging consolidation below a secondary high, with volume contracting compared with the main rally. The chart indicates a potential upside breakout after further sideways consolidation.
If price breaks above 87,337 with strong volume and holds there, the next target is 90,500. For now, the bulls have the upper hand.
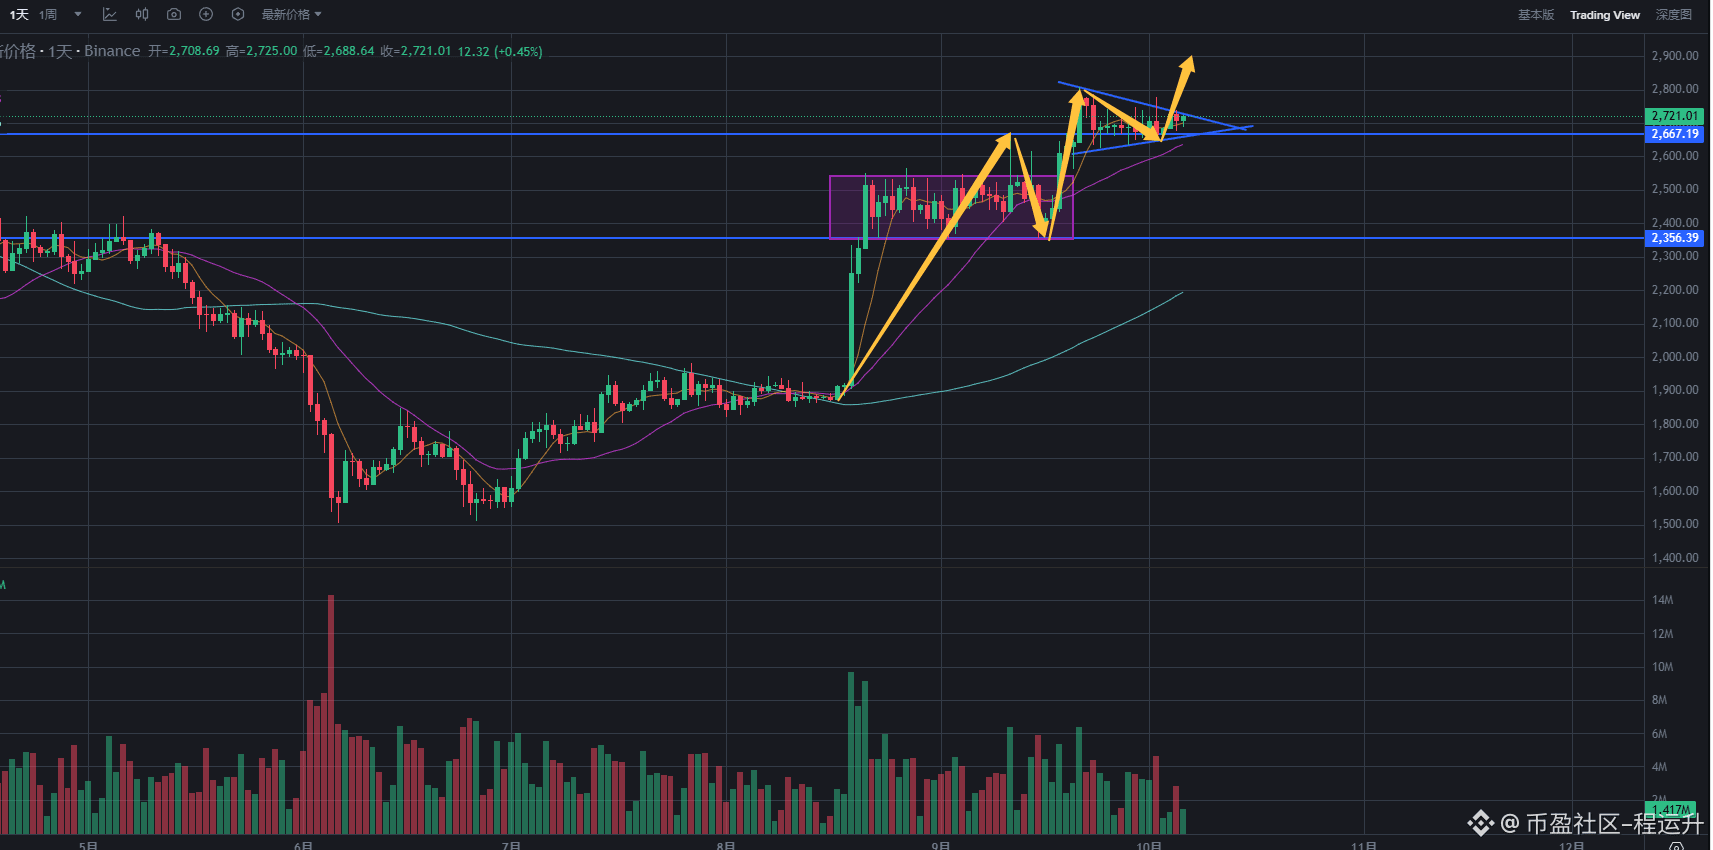
On Ethereum’s daily chart, price is consolidating in a converging triangle at elevated levels, with the moving averages in bullish alignment as it builds momentum ahead of a potential breakout.
Key resistance levels above: 2,800 and 2,886; trendline support below is near 2,667.
In terms of price action and volume, following the main rally, price has consolidated on declining volume toward the apex of the triangle. A pullback followed by another move higher is expected. A high-volume break above 2,800 would put the price near 2,900.
#BTC走势分析 #ETH走势分析 $BTC
1
762
·
--
Bearish
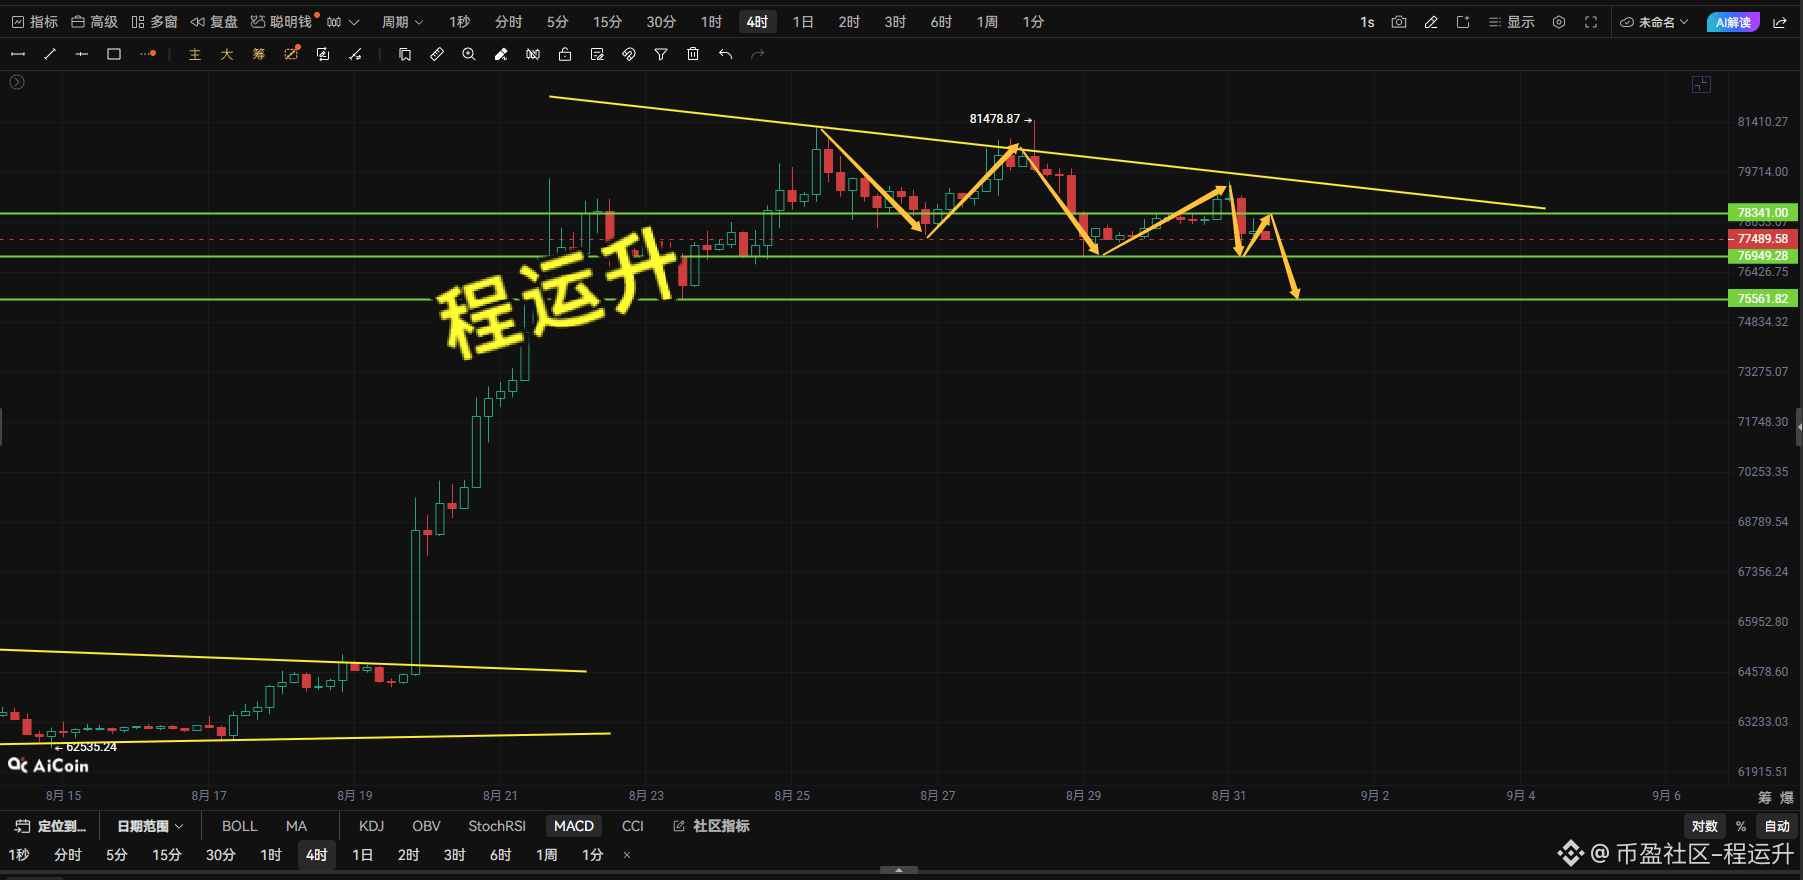
Judging by Bitcoin’s current trend over the past 4 hours:
The market has pulled back from a high level, and short-term breakdown suggests a bearish outlook.
After the price set a new high at 81,478, it formed a descending triangle consolidation pattern. Currently, the recent K-line highs are gradually moving lower, which is a clear bearish signal.
Resistance to watch is 78,330. If the price rebounds to this level, it may be a good spot to short. Support below lies around 77,000. Further down, watch the prior low at 75,550.
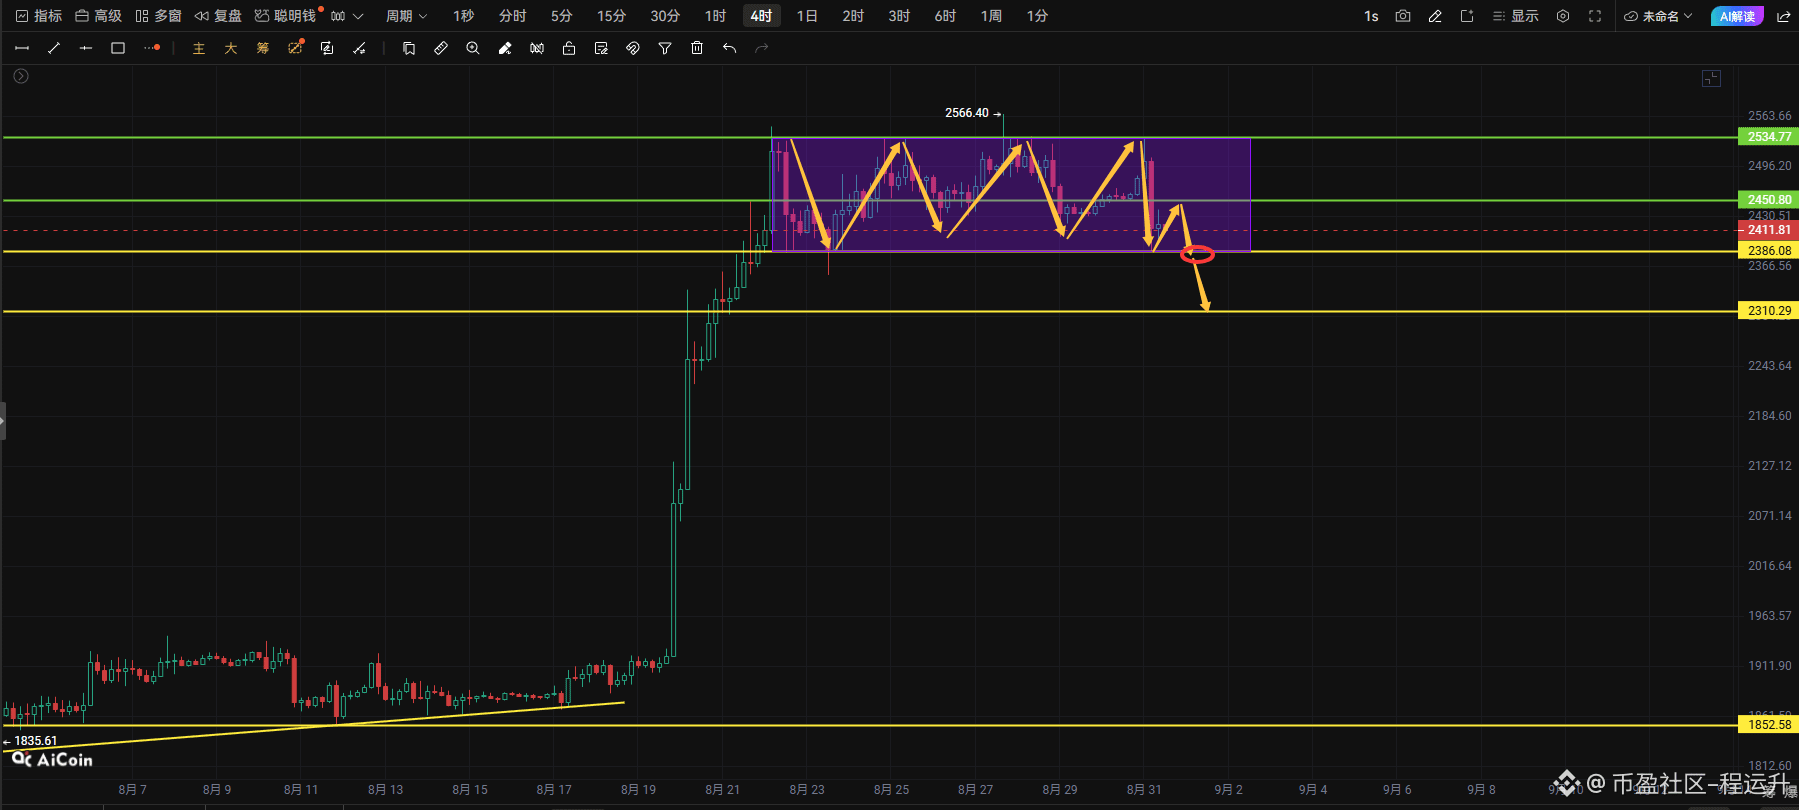
Ethereum is currently trading in a high-range box consolidation. It is expected to gradually break down. After a sharp rally, ETH entered high-level sideways trading, forming a clear rectangular consolidation range.
Resistance to watch is at the 2,450 level. It is suggested that a rebound to this point could be used to short. Support at the lower edge of the range is at 2,385; once 2,385 is broken, it is expected to move directly toward around 2,310. Risk management: defend around 2,490.#BTC走势分析 #ETH走势分析
2
370
·
--
Bearish
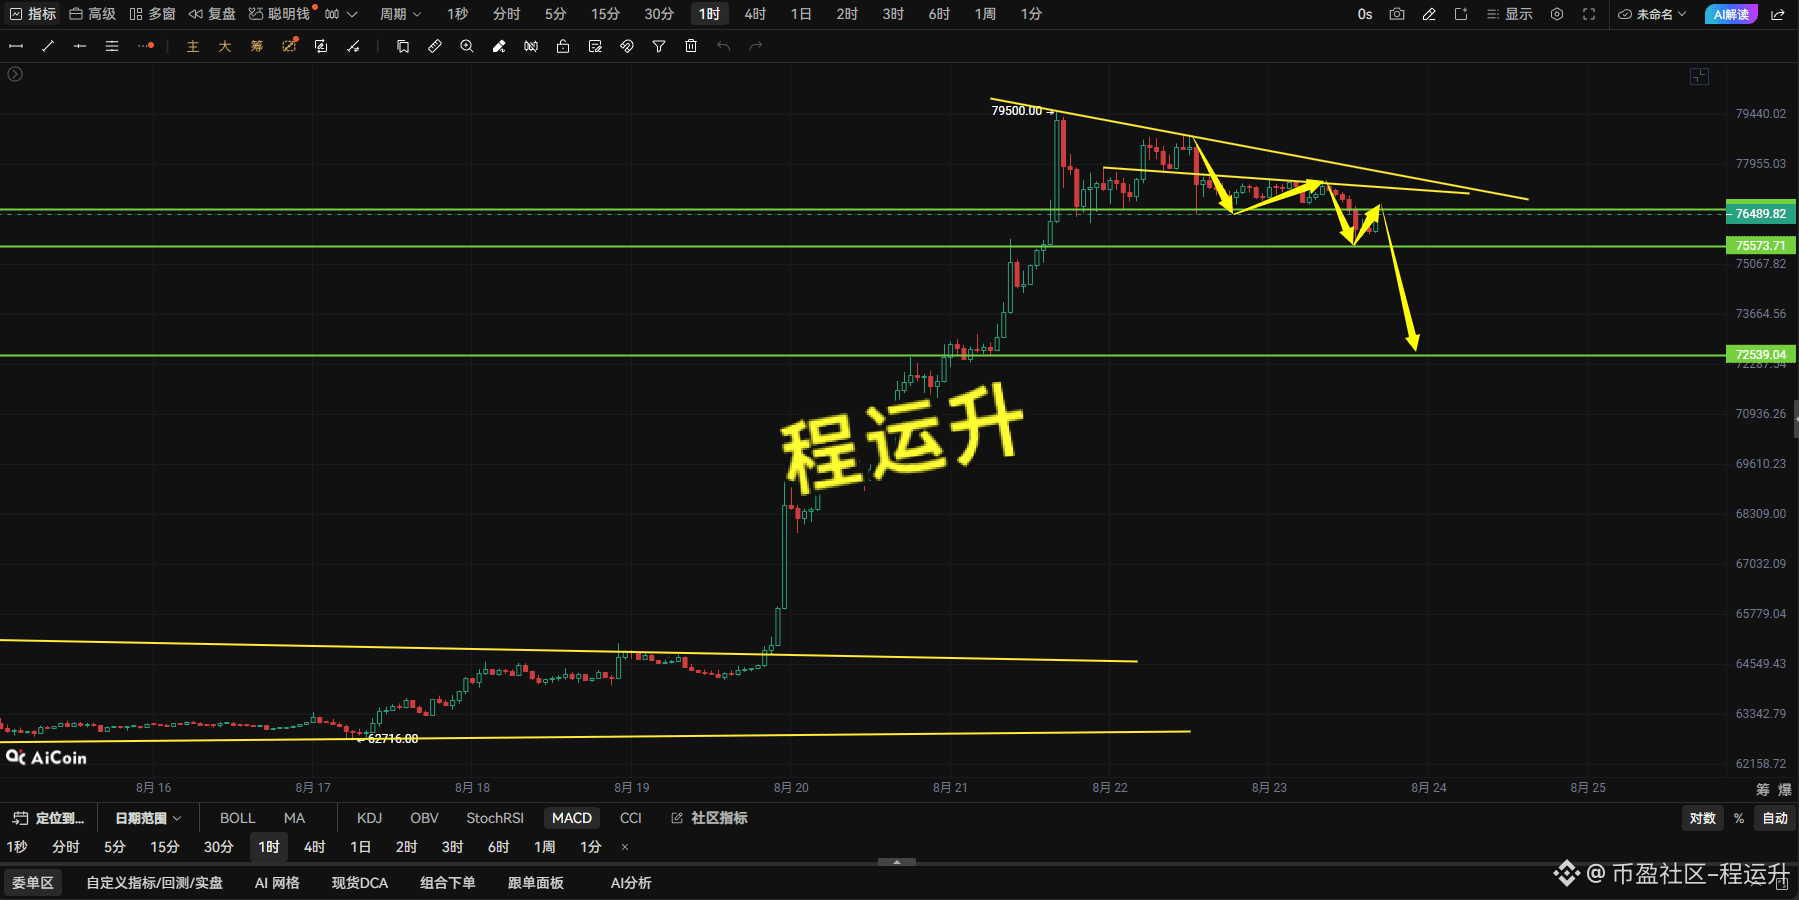
After Bitcoin surged sharply earlier and topped at 79,500, it is currently in a typical downward channel. The recent highs keep getting lower, and the market is consolidating and moving down in a range; in the short term, bears have the upper hand.
At the moment, the rebound is relatively weak. Support to watch is 75,550. For trading, it is suggested to short around 76,800, with a target of 72,500 and a stop-loss at 77,550.
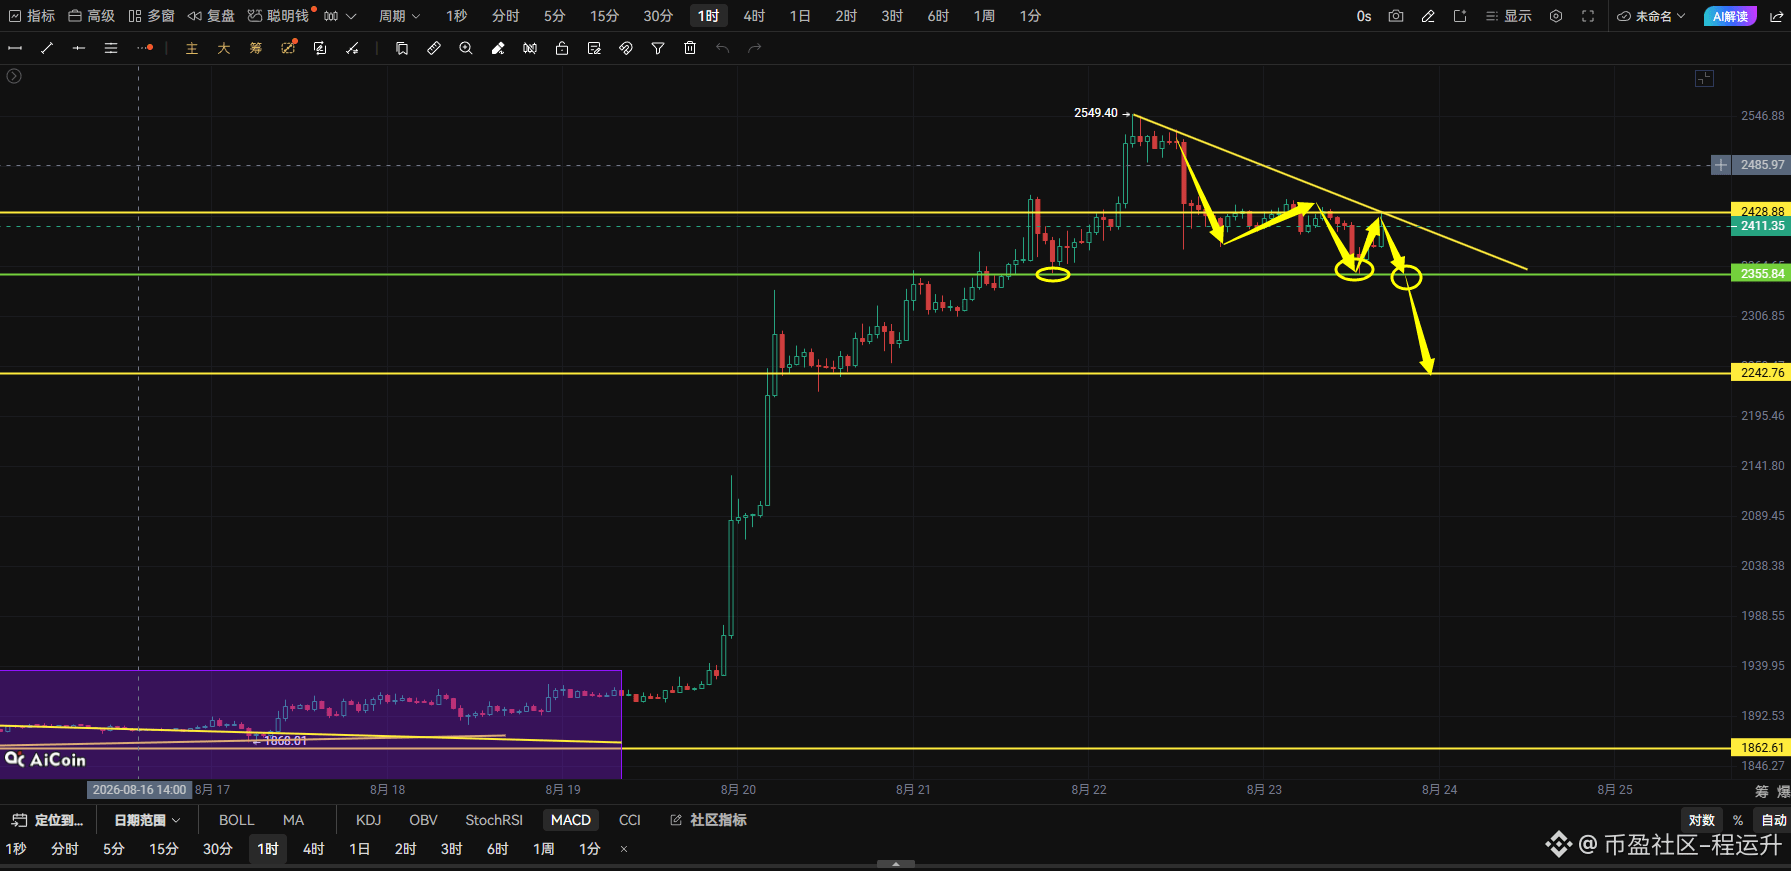
Ethereum’s overall trend is similar to Bitcoin’s. It is currently under pressure around the 2,430 area near the descending trendline. The rebound has shown a spike at this level.
Right now, price is gradually falling. Support below to watch is 2,355. For positioning, you can short directly at 2,411, take profit at 2,250, and place a stop at 2,455,#BTC走势分析 #ETH走势分析
2
1.5k
·
--
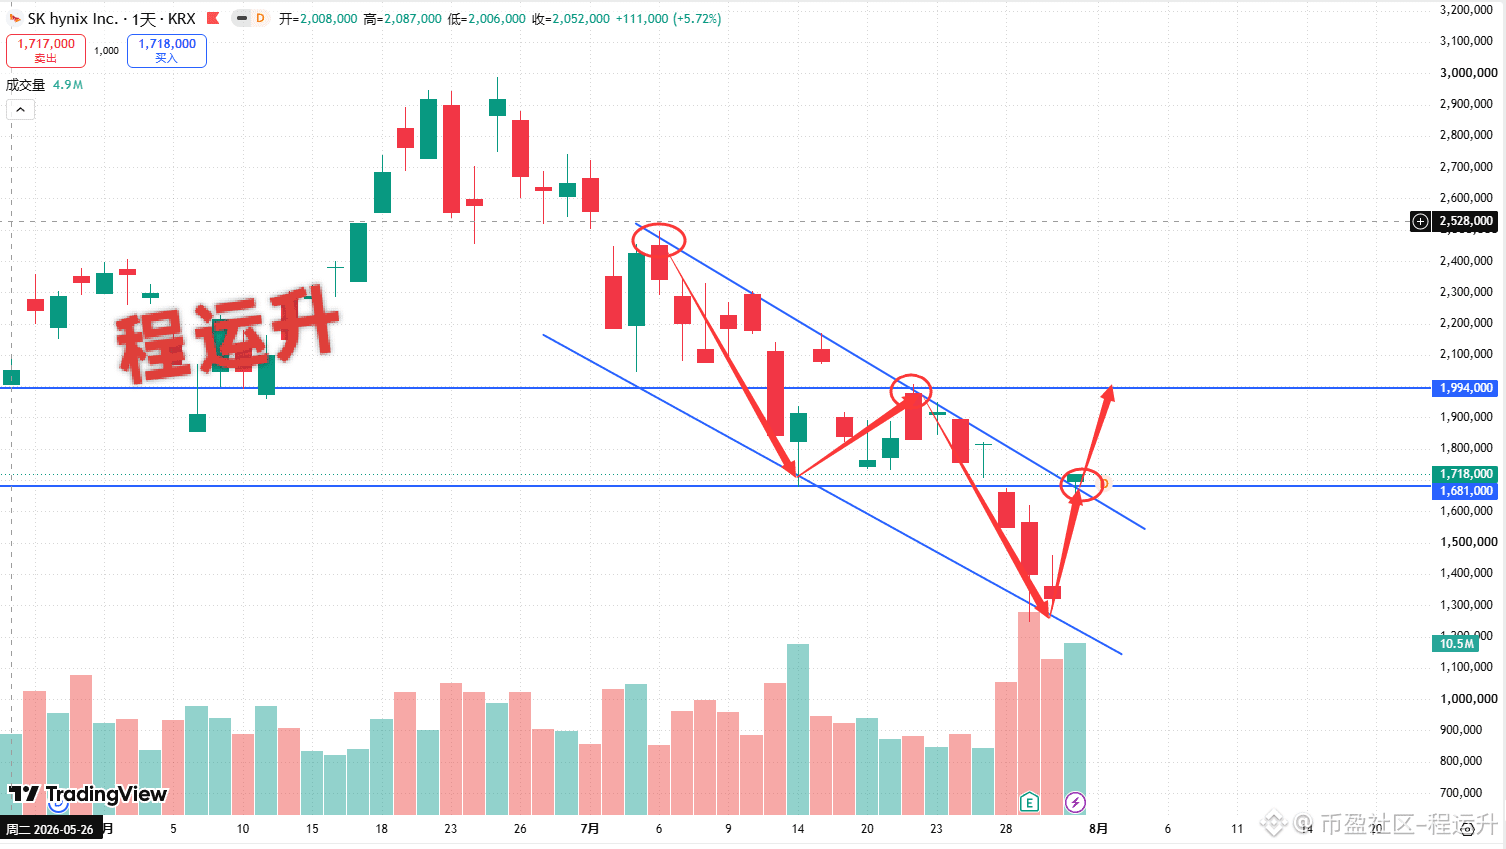
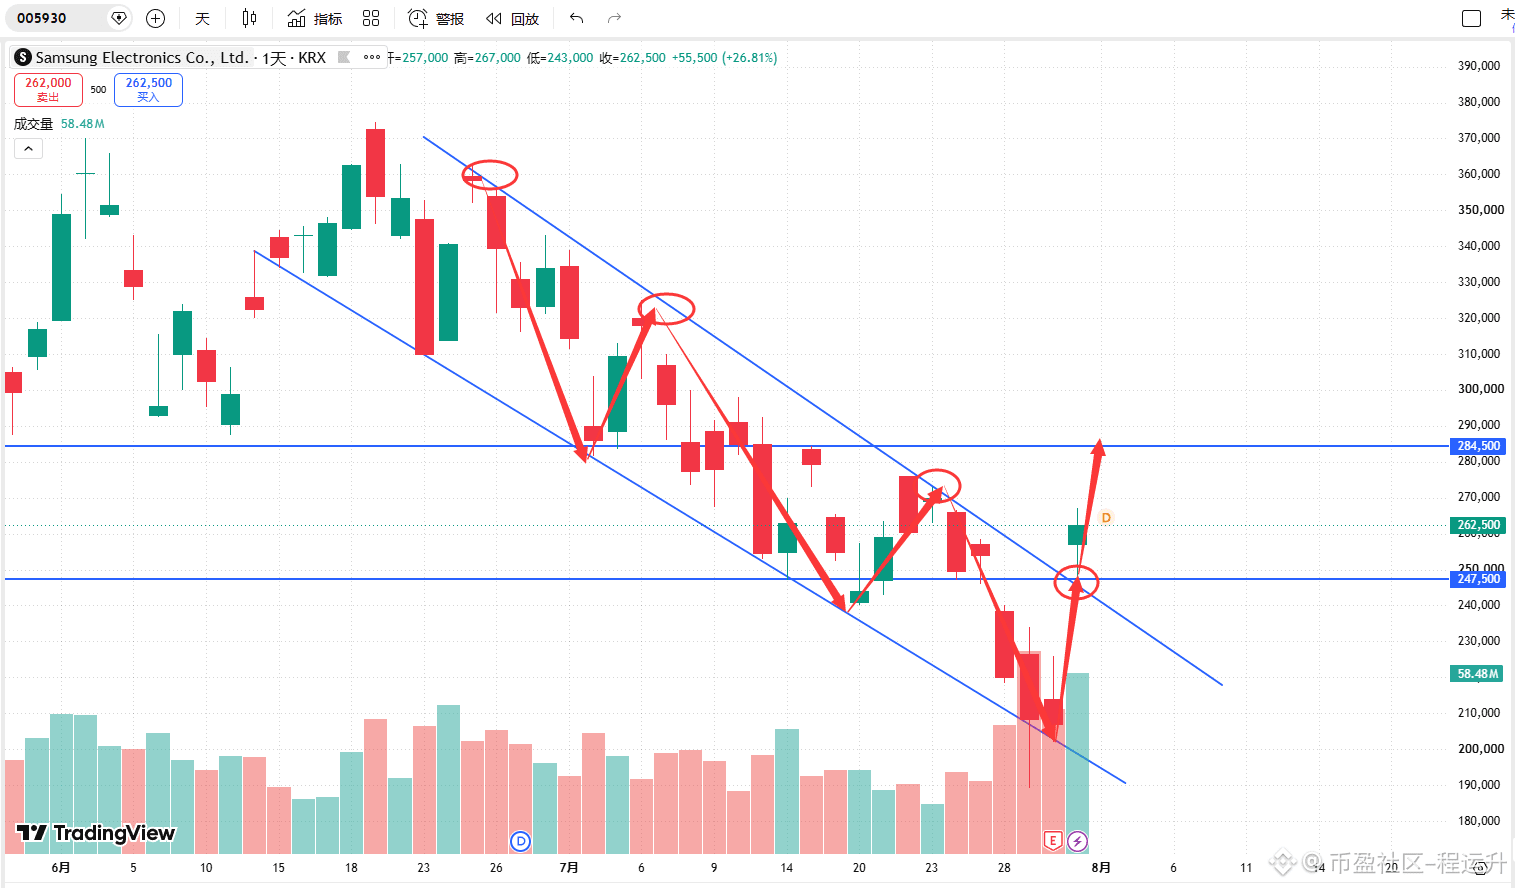
SK hynix Skhy and Samsung Electronics have both surged strongly, breaking through the descending channel with a sharp rally. For SK hynix, look for resistance around 1,994,000 won, and for Samsung Electronics, watch level 284500. Going forward, it is expected to test these levels. $SKHYNIX #Samsung #SKHy
SK hynix Skhy and Samsung Electronics have both surged strongly, breaking through the descending channel with a sharp rally. For SK hynix, look for resistance around 1,994,000 won, and for Samsung Electronics, watch level 284500. Going forward, it is expected to test these levels. $SKHYNIX #Samsung #SKHy
2
590
·
--
Bearish
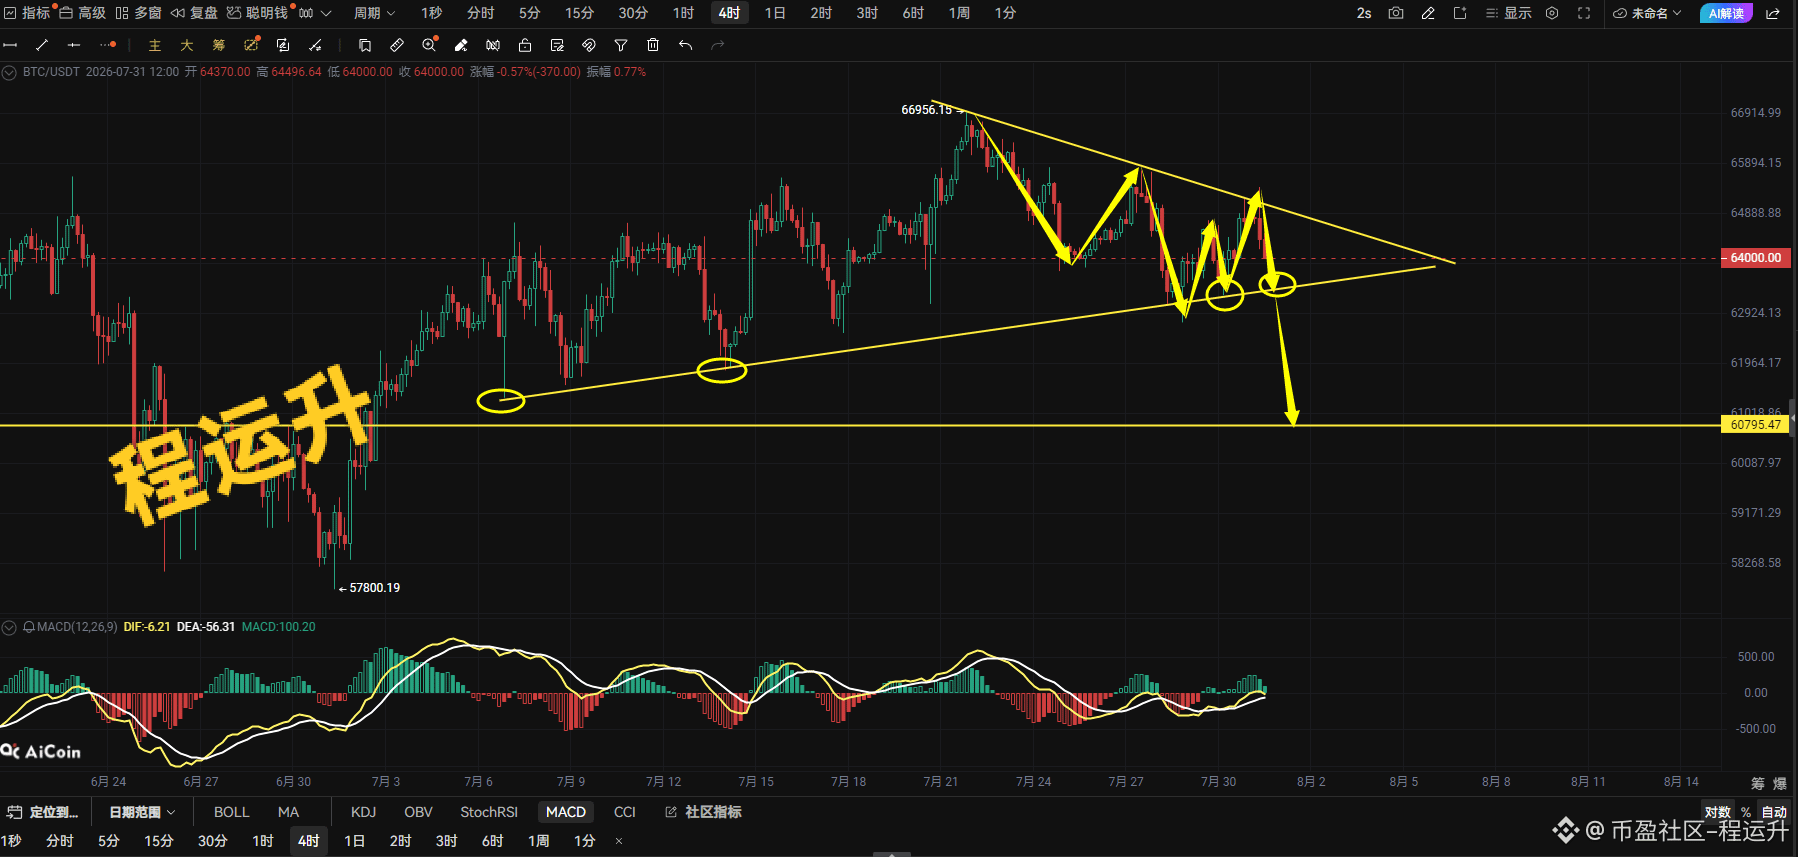
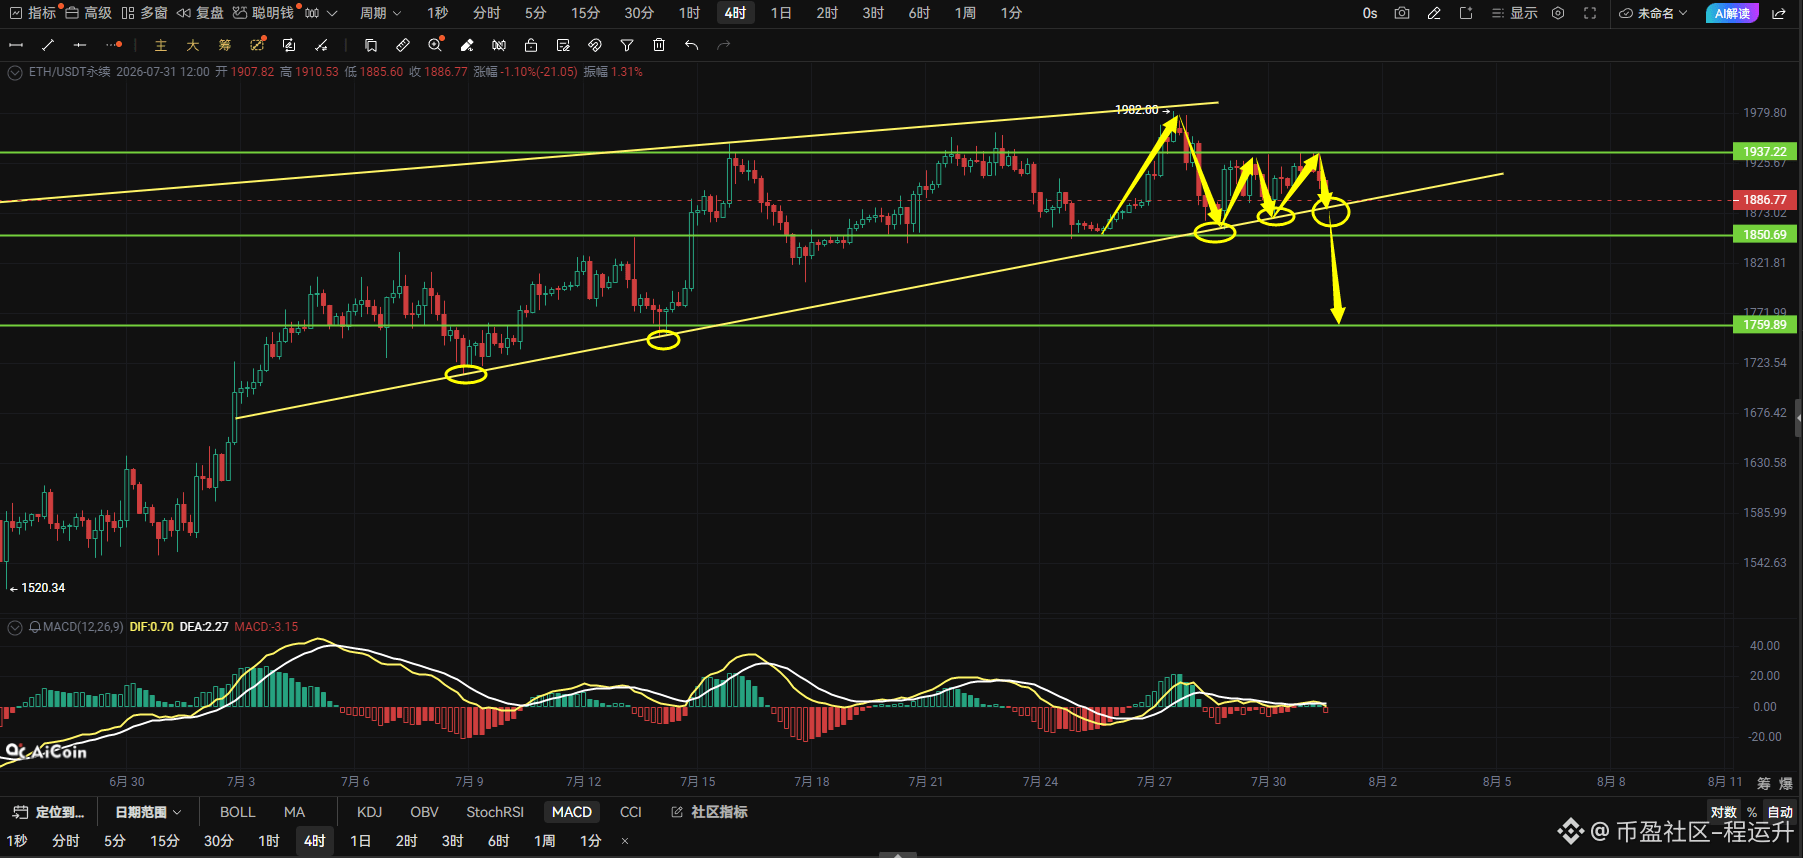
After Bitcoin has pulled back from its peak, it formed a downward trend line and an upward support line. It is currently trading within a converging triangular range, and is expected to soon break out of the consolidation zone.
In the short term, it is forming a falling triangle and declining: the highs are gradually moving lower. Near 63,400, watch the uptrend support line. For trades, if it breaks below 64,000, you can go short directly, with the target around the 60,767 support level.
Ethereum’s overall trend is consistent with Bitcoin. It is currently about to break out of an ascending channel and has formed an ascending triangle pattern. If it breaks below the ascending trendline support at 1,880, further watch the 1,850 support area. If it breaks further down, continue to watch support around 1,760.#BTC走势分析 #ETH走势分析
1
487
·
--
Bearish
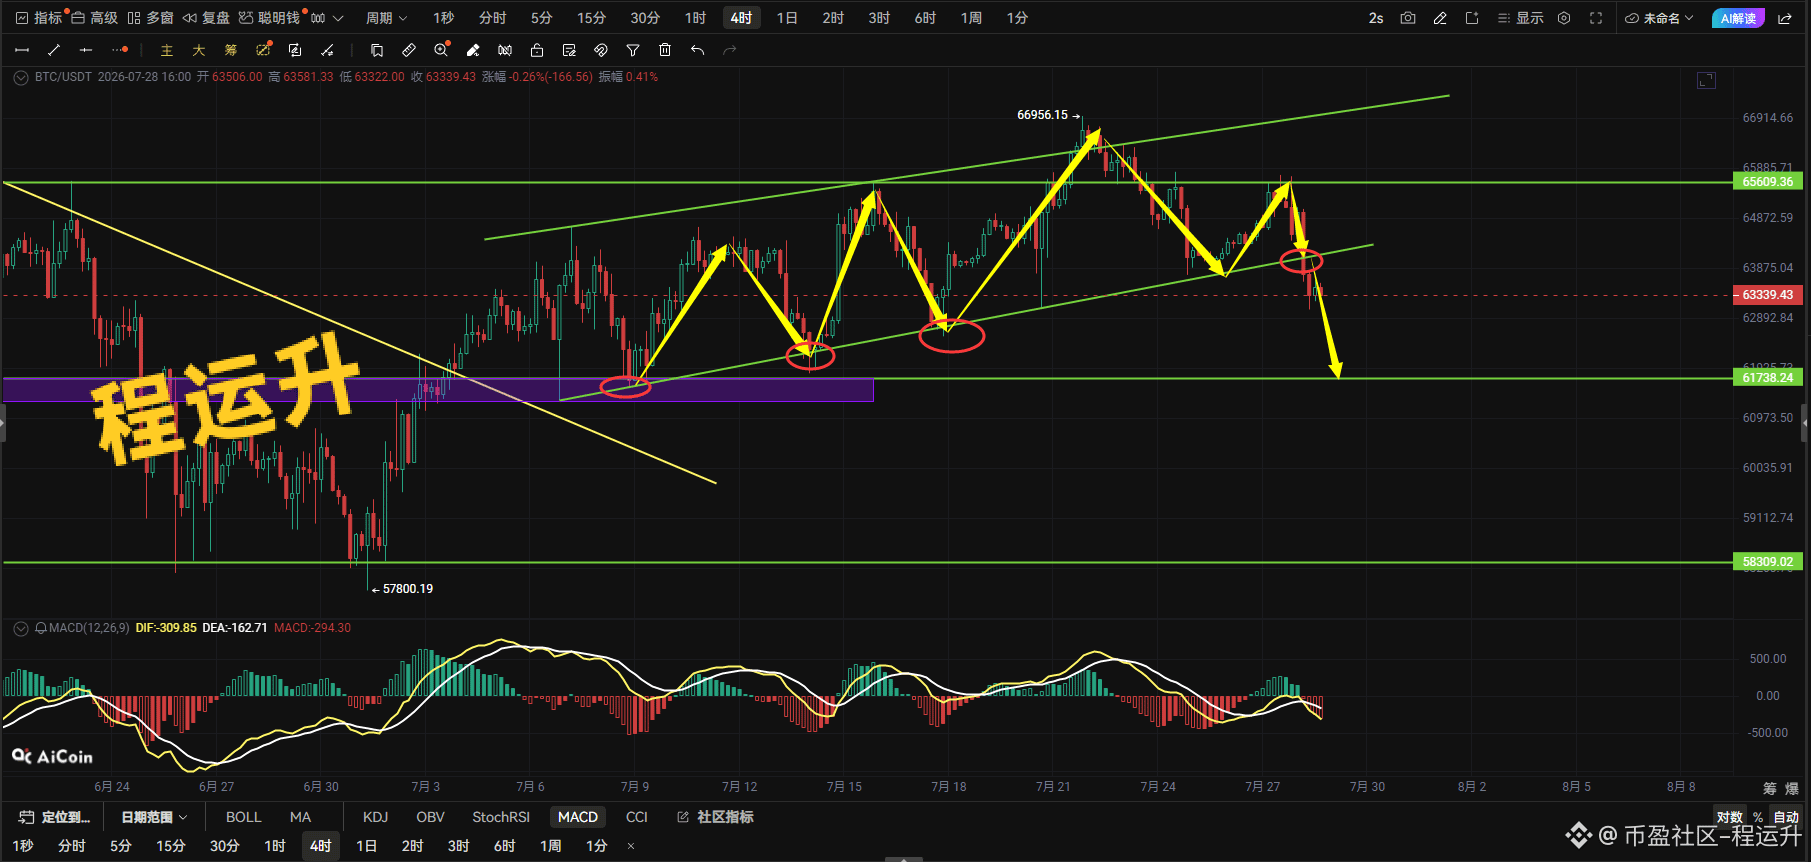
Bitcoin surged to a high yesterday, then oscillated and pulled back. Recently, the K-line has fallen below the lower boundary support of the previous ascending channel. Near-term price action is bearish, and it is expected to move downward to find support.
The MACD indicator is hovering around the zero line and shows bearish momentum. The red histogram bars have widened into negative territory, indicating that on the 4-hour timeframe, the bears are currently in control.
On the downside, the key support to watch is the horizontal support in the purple high-density trading area around 61,700. In terms of trading, it is recommended to focus on short positions. You can consider entering shorts around 64,000, aiming for 61,800. Set protection/stop-loss at 64,500.
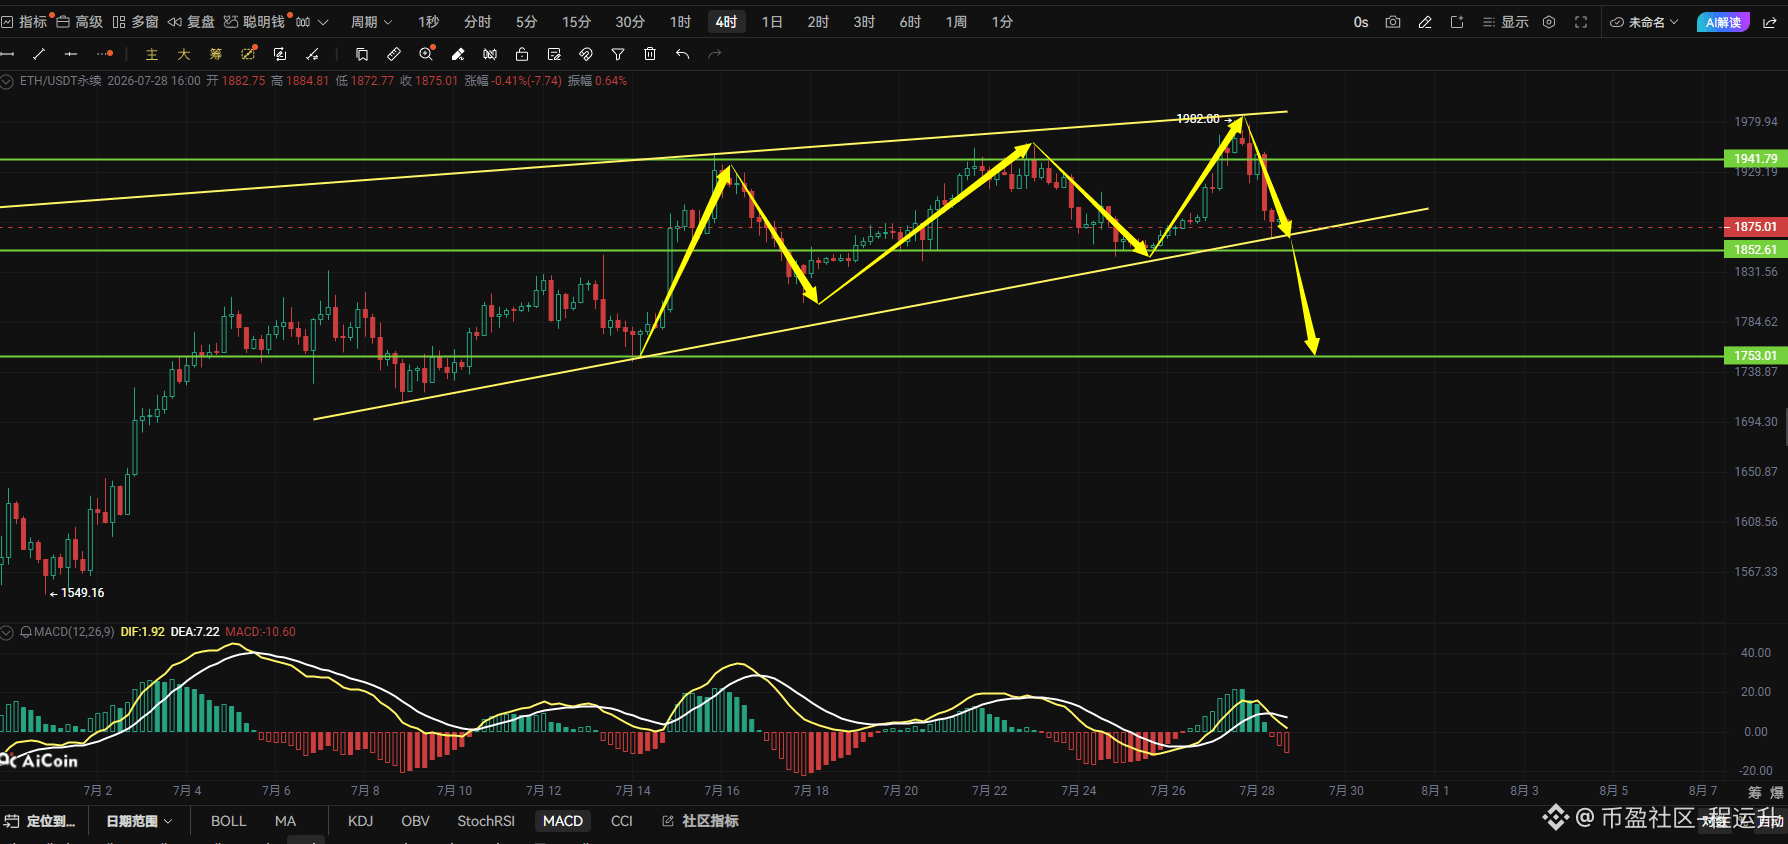
Ethereum’s overall trend is consistent with Bitcoin’s. It is expected to soon break down from the ascending triangle pattern. In the short term, after breaking below the 1,850 support level, it may drop to around 1,760.#BTC走势分析 #ETH走势分析 .
1
385
·
--
Bullish
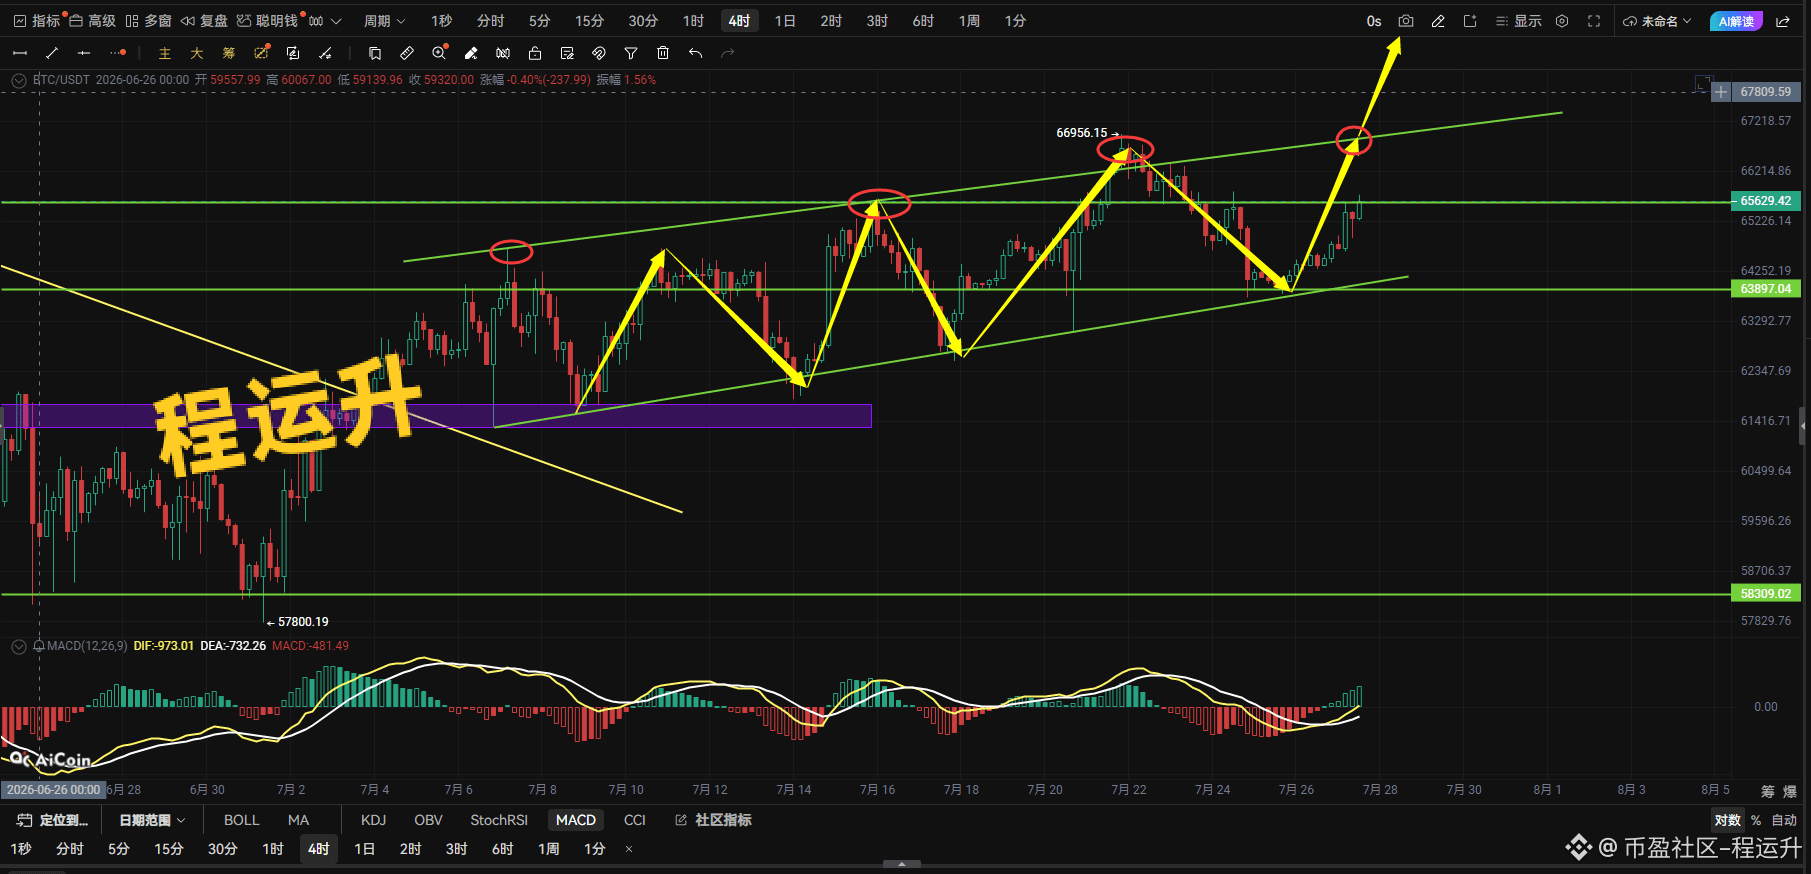
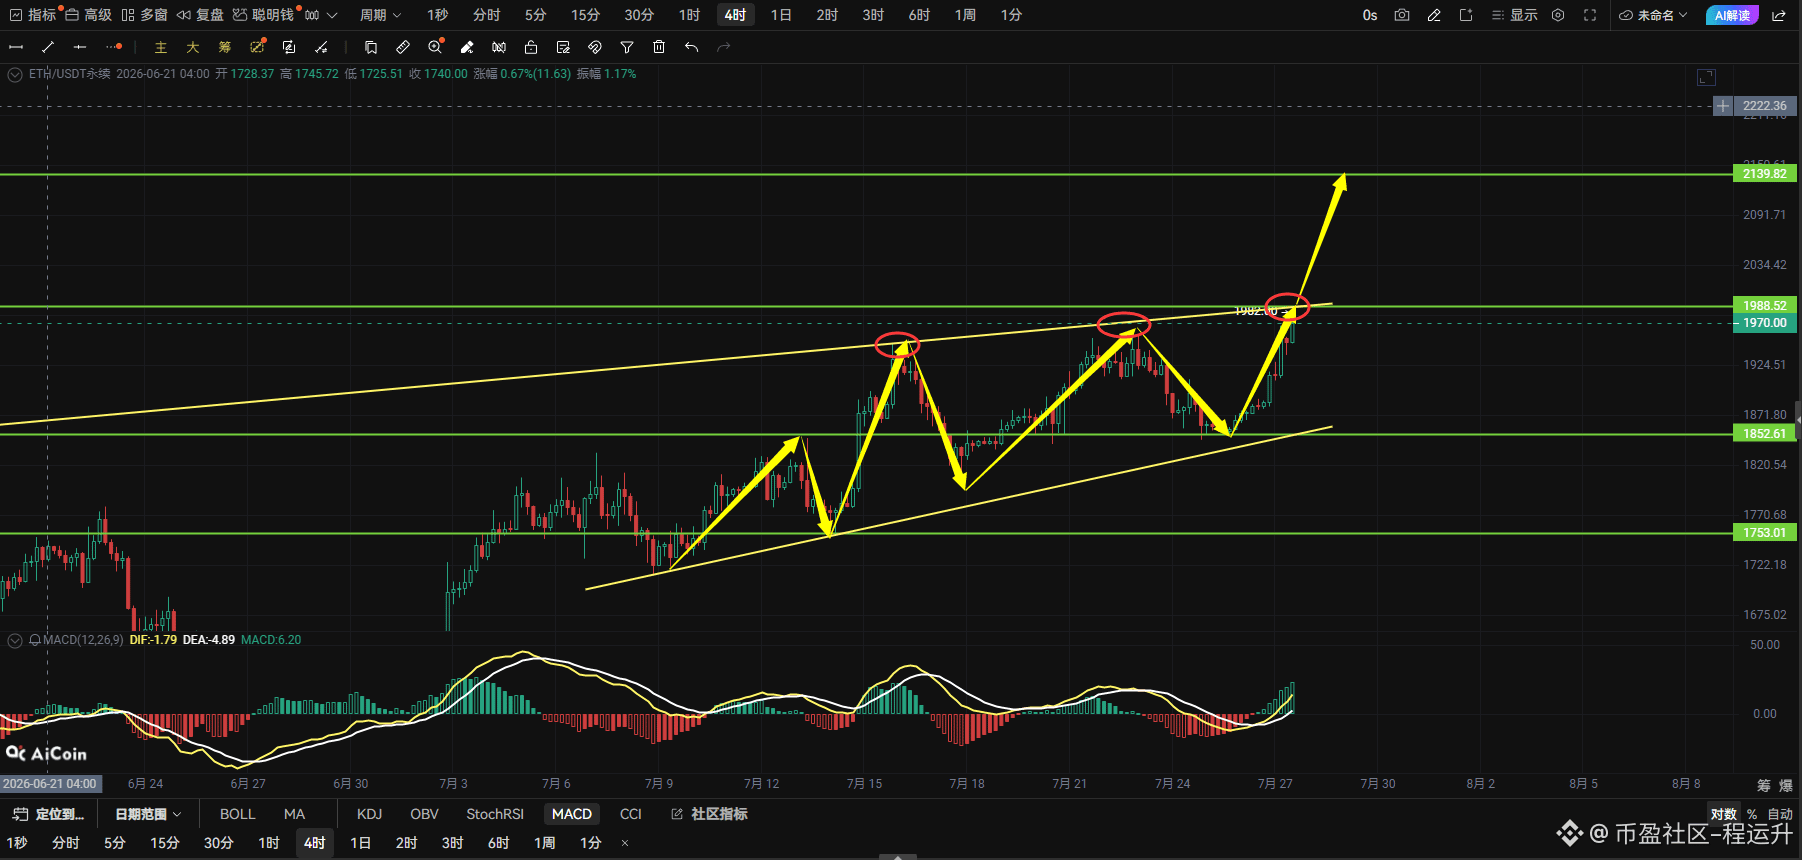
Bitcoin is currently in an upward channel. Overall, it forms an ascending triangle pattern and gradually fluctuates while moving higher: the lows are gradually rising, and the price is running along the upper edge of the channel.
Recently, after pulling back to the lower-band support area, it rebounded quickly. It is now approaching the resistance near the previous high, around 66,900–67,800.
For the upside, the key focus is resistance at the rising trendline near 66,900.
For the downside, support to watch is 63,800–64,200 at the lower edge of the channel—horizontal support.
The MACD shows signs of repair and strengthening. In the short term it is slightly bullish, but if it fails to break above the previous high, it may continue trading in a consolidation range within the channel.
For BTC, the short-term trend is relatively strong and it is trading along the rising channel. Watch whether it can break through and hold above the 66,900 resistance; if it breaks out, bulls may target 70,000.
Ethereum’s overall走势 is similar to BTC. On the upside, focus on the suppression from the ascending trendline near 1988. If it breaks through, go long directly, with upside toward 2139. For defense, the level is 1940#BTC走势分析 #ETH走势分析 .
1
516
·
--
Bullish
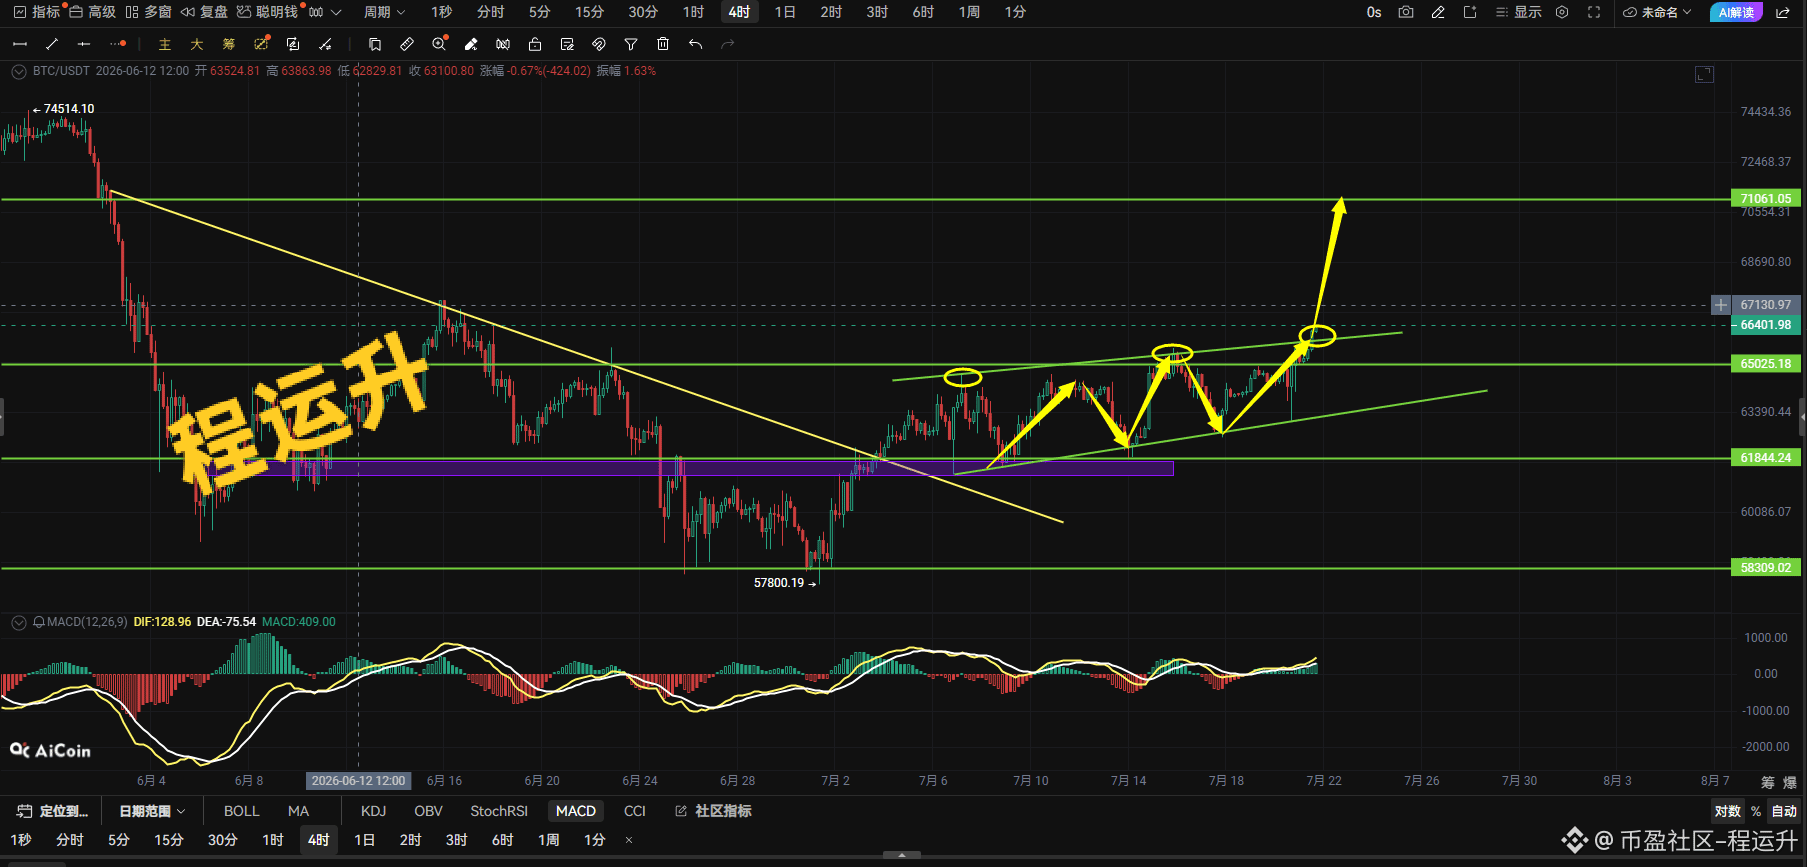
Bitcoin has already broken through the ascending channel. The key resistance at 65,900 has been decisively breached and is stabilizing. Overall, it is maintaining an ascending triangle pattern and gradually moving upward. The MACD bullish energy histogram is gradually increasing. In the short term, the first target for the bulls is expected to be around 68,200, and the second target is around 70,000.
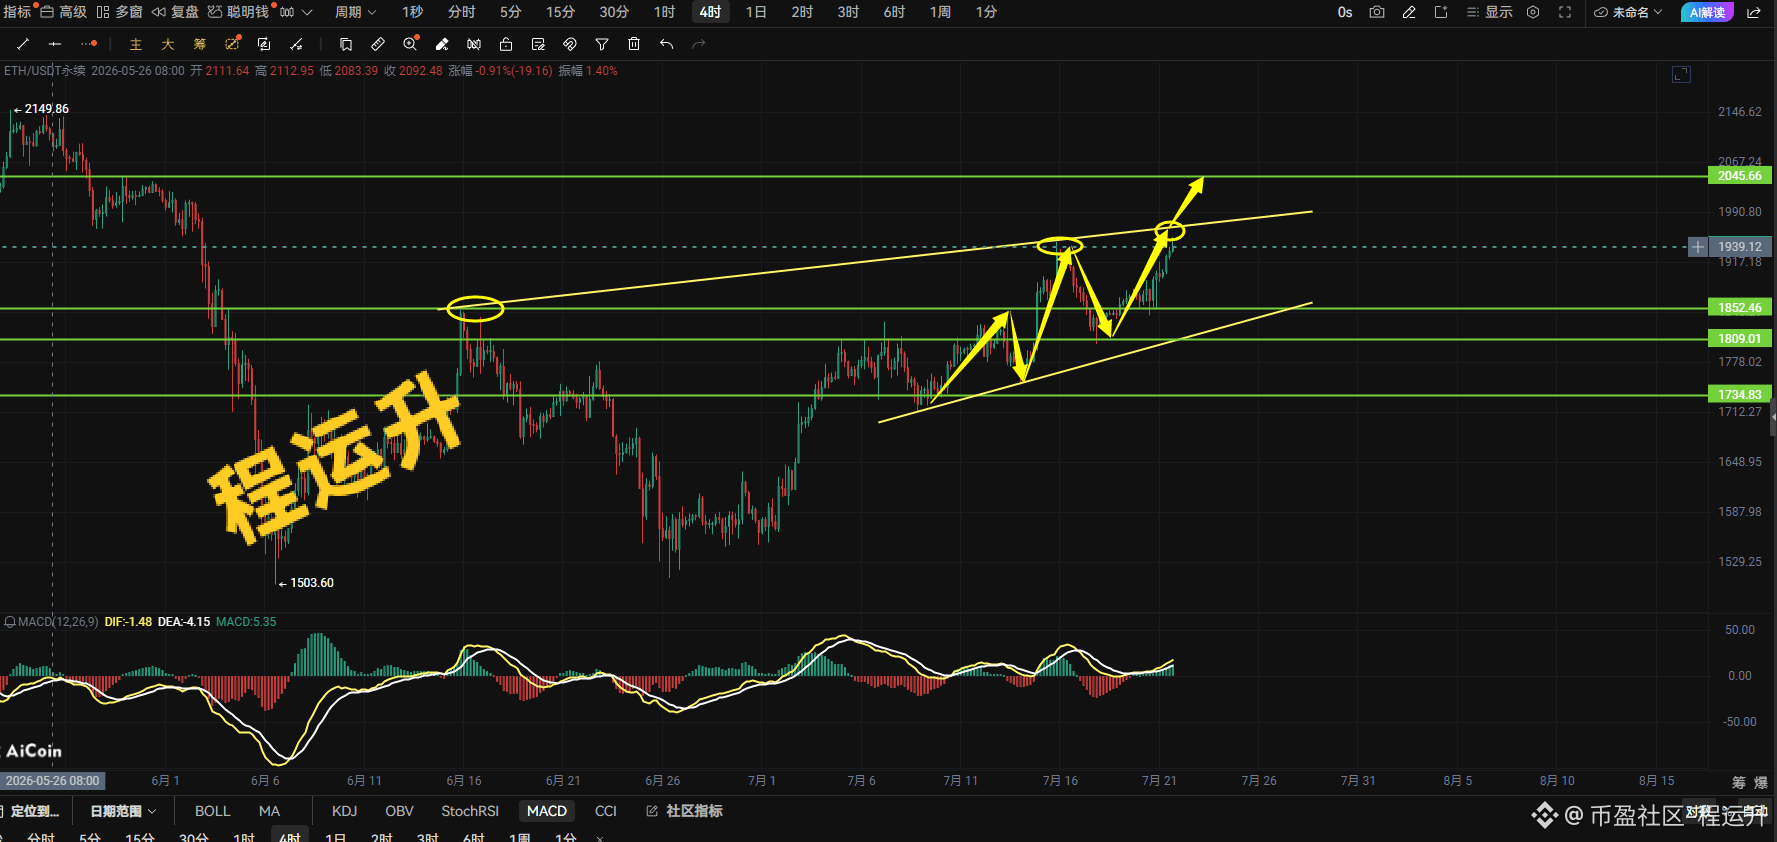
Ethereum’s overall price action follows that of Bitcoin. In the short term, watch the 1,970 ascending trendline overhead for resistance. If it breaks the first target, look for 2,045; the second target is at 2,139.#BTC走势分析 #ETH走势分析 .
Ethereum’s overall price action follows that of Bitcoin. In the short term, watch the 1,970 ascending trendline overhead for resistance. If it breaks the first target, look for 2,045; the second target is at 2,139.#BTC走势分析 #ETH走势分析 .
1
491
·
--
Bearish
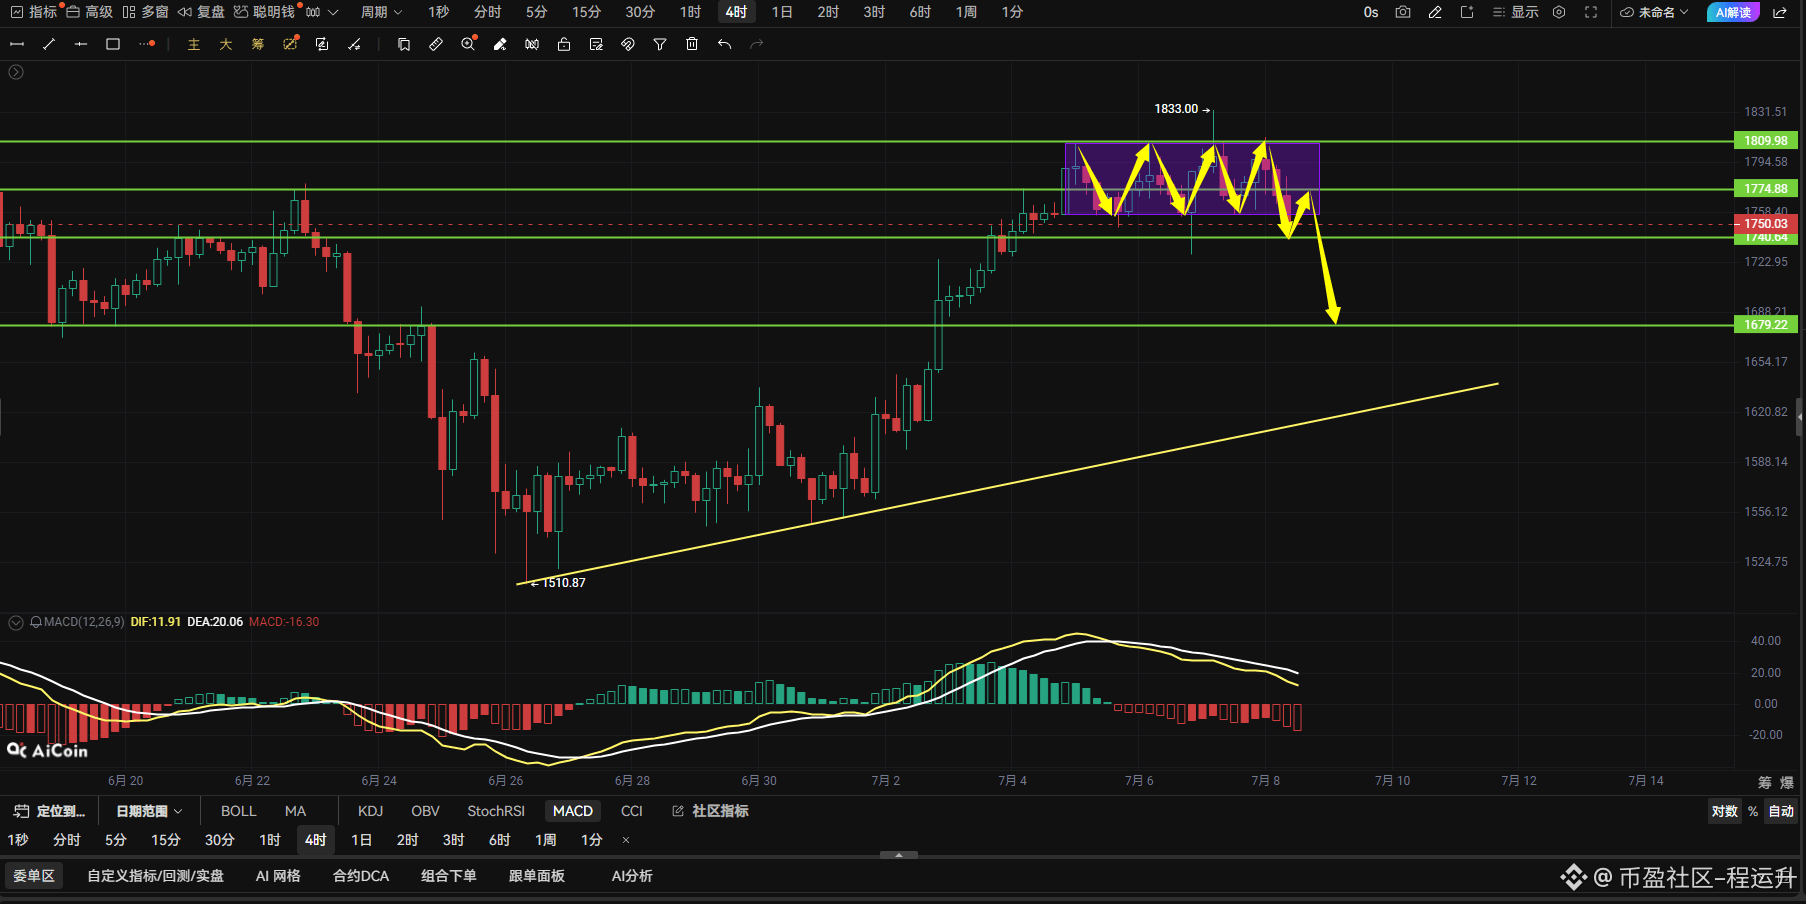
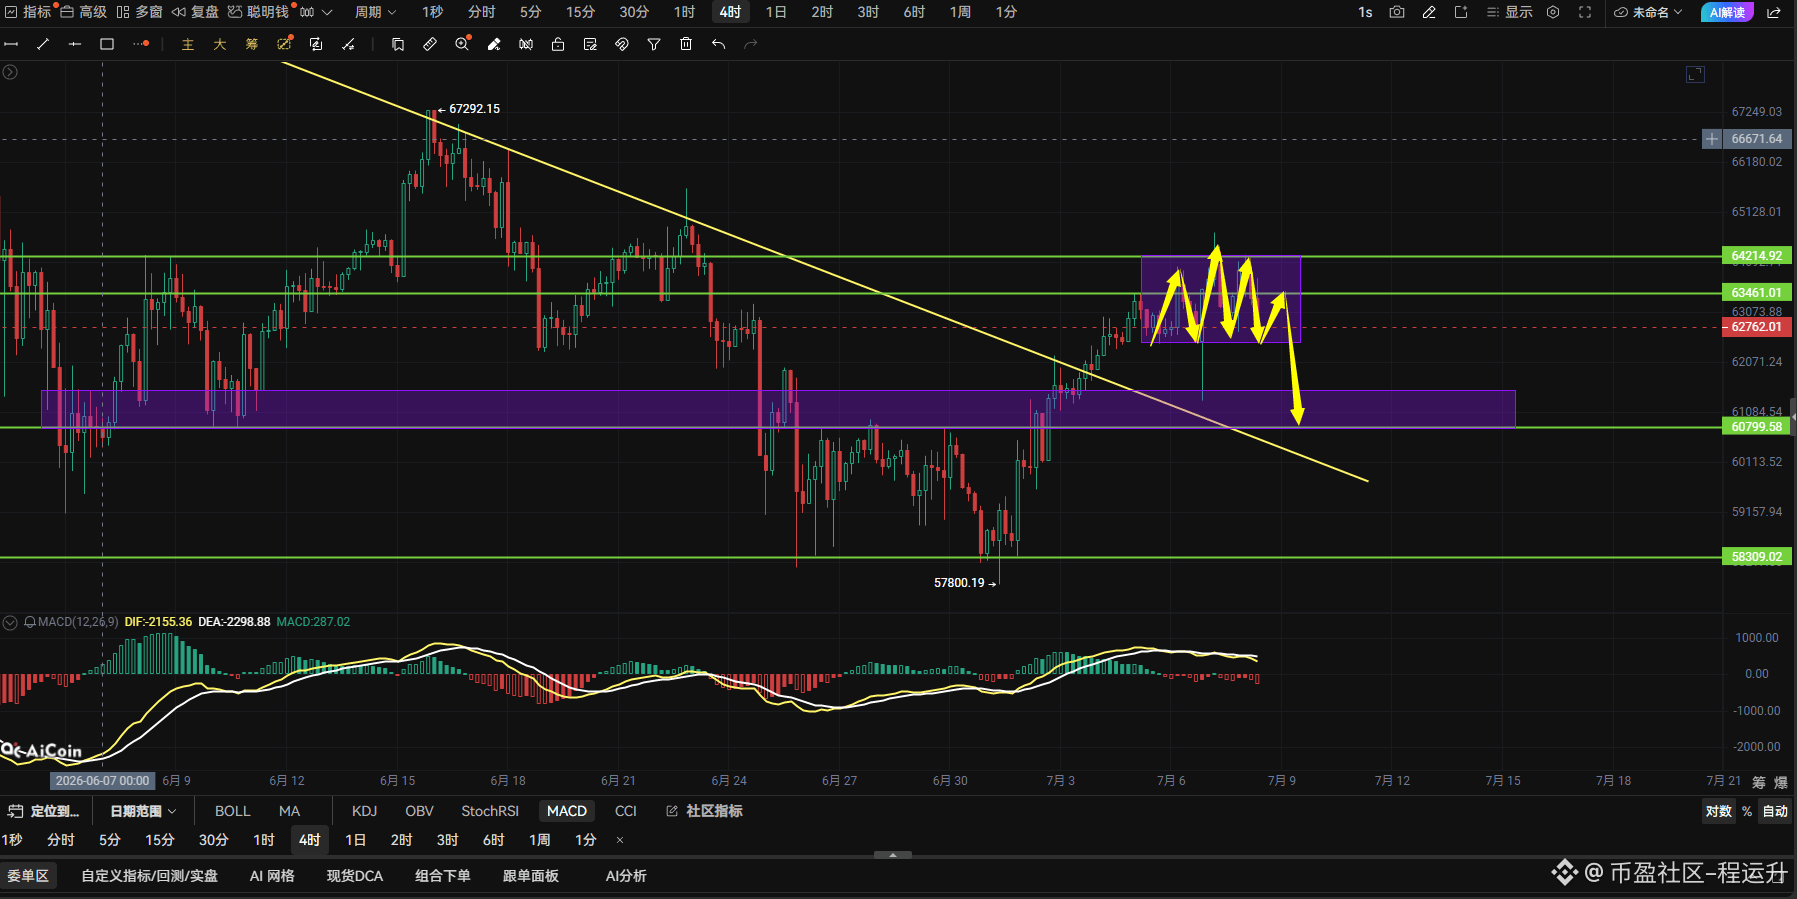
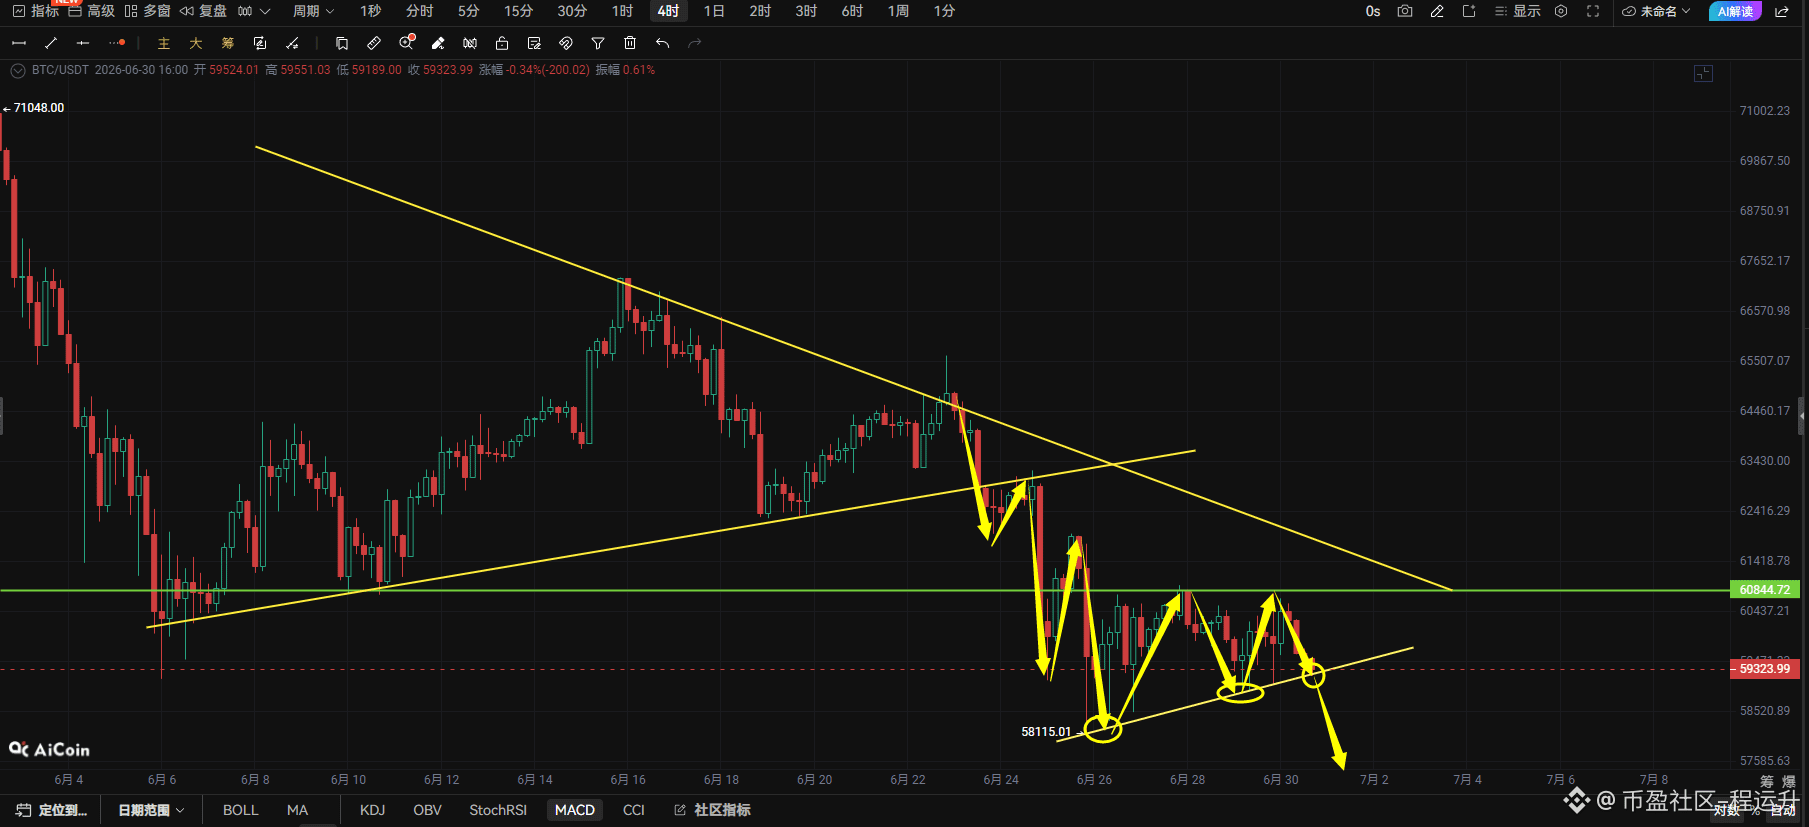
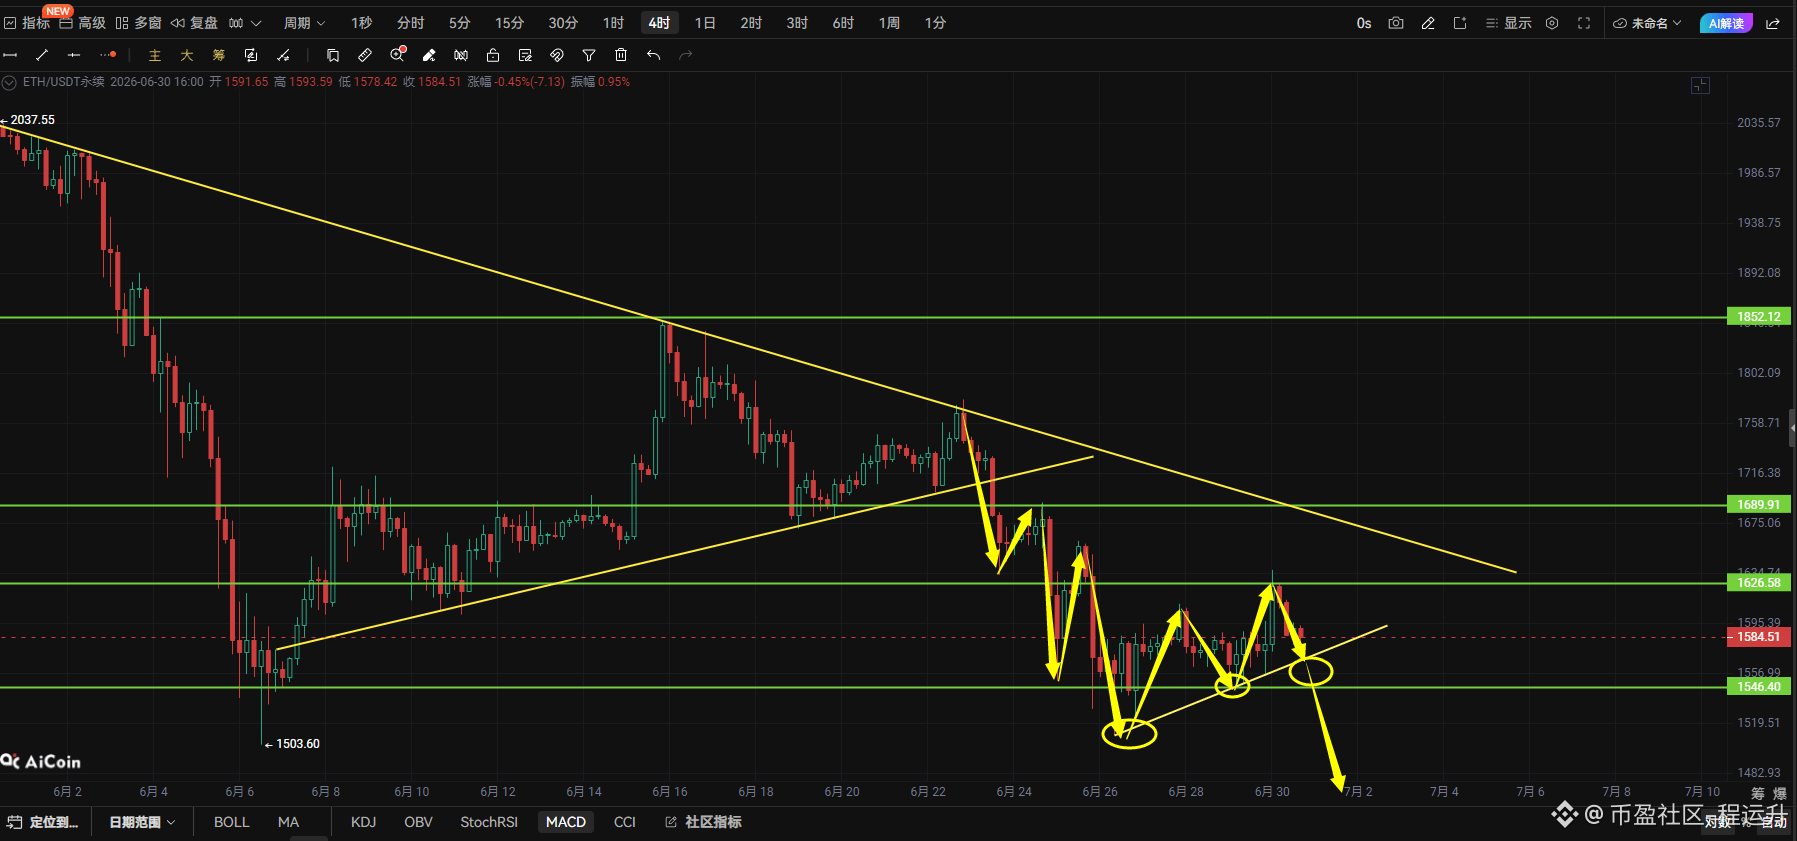
Bitcoin and Ethereum break through the range-bound box area; on the rebound you can short!
BTC reference strategy:
Enter a short at 63400, take profit at 60800, stop loss at 64000
ETH reference strategy:
Enter a short at 1780, take profit at 1658, stop loss at 1820#美国对伊朗发动新一轮打击 #BTC #ETH
Bitcoin and Ethereum break through the range-bound box area; on the rebound you can short!
BTC reference strategy:
Enter a short at 63400, take profit at 60800, stop loss at 64000
ETH reference strategy:
Enter a short at 1780, take profit at 1658, stop loss at 1820#美国对伊朗发动新一轮打击 #BTC #ETH
BTC reference strategy:
Enter a short at 63400, take profit at 60800, stop loss at 64000
ETH reference strategy:
Enter a short at 1780, take profit at 1658, stop loss at 1820#美国对伊朗发动新一轮打击 #BTC #ETH
1
461
·
--
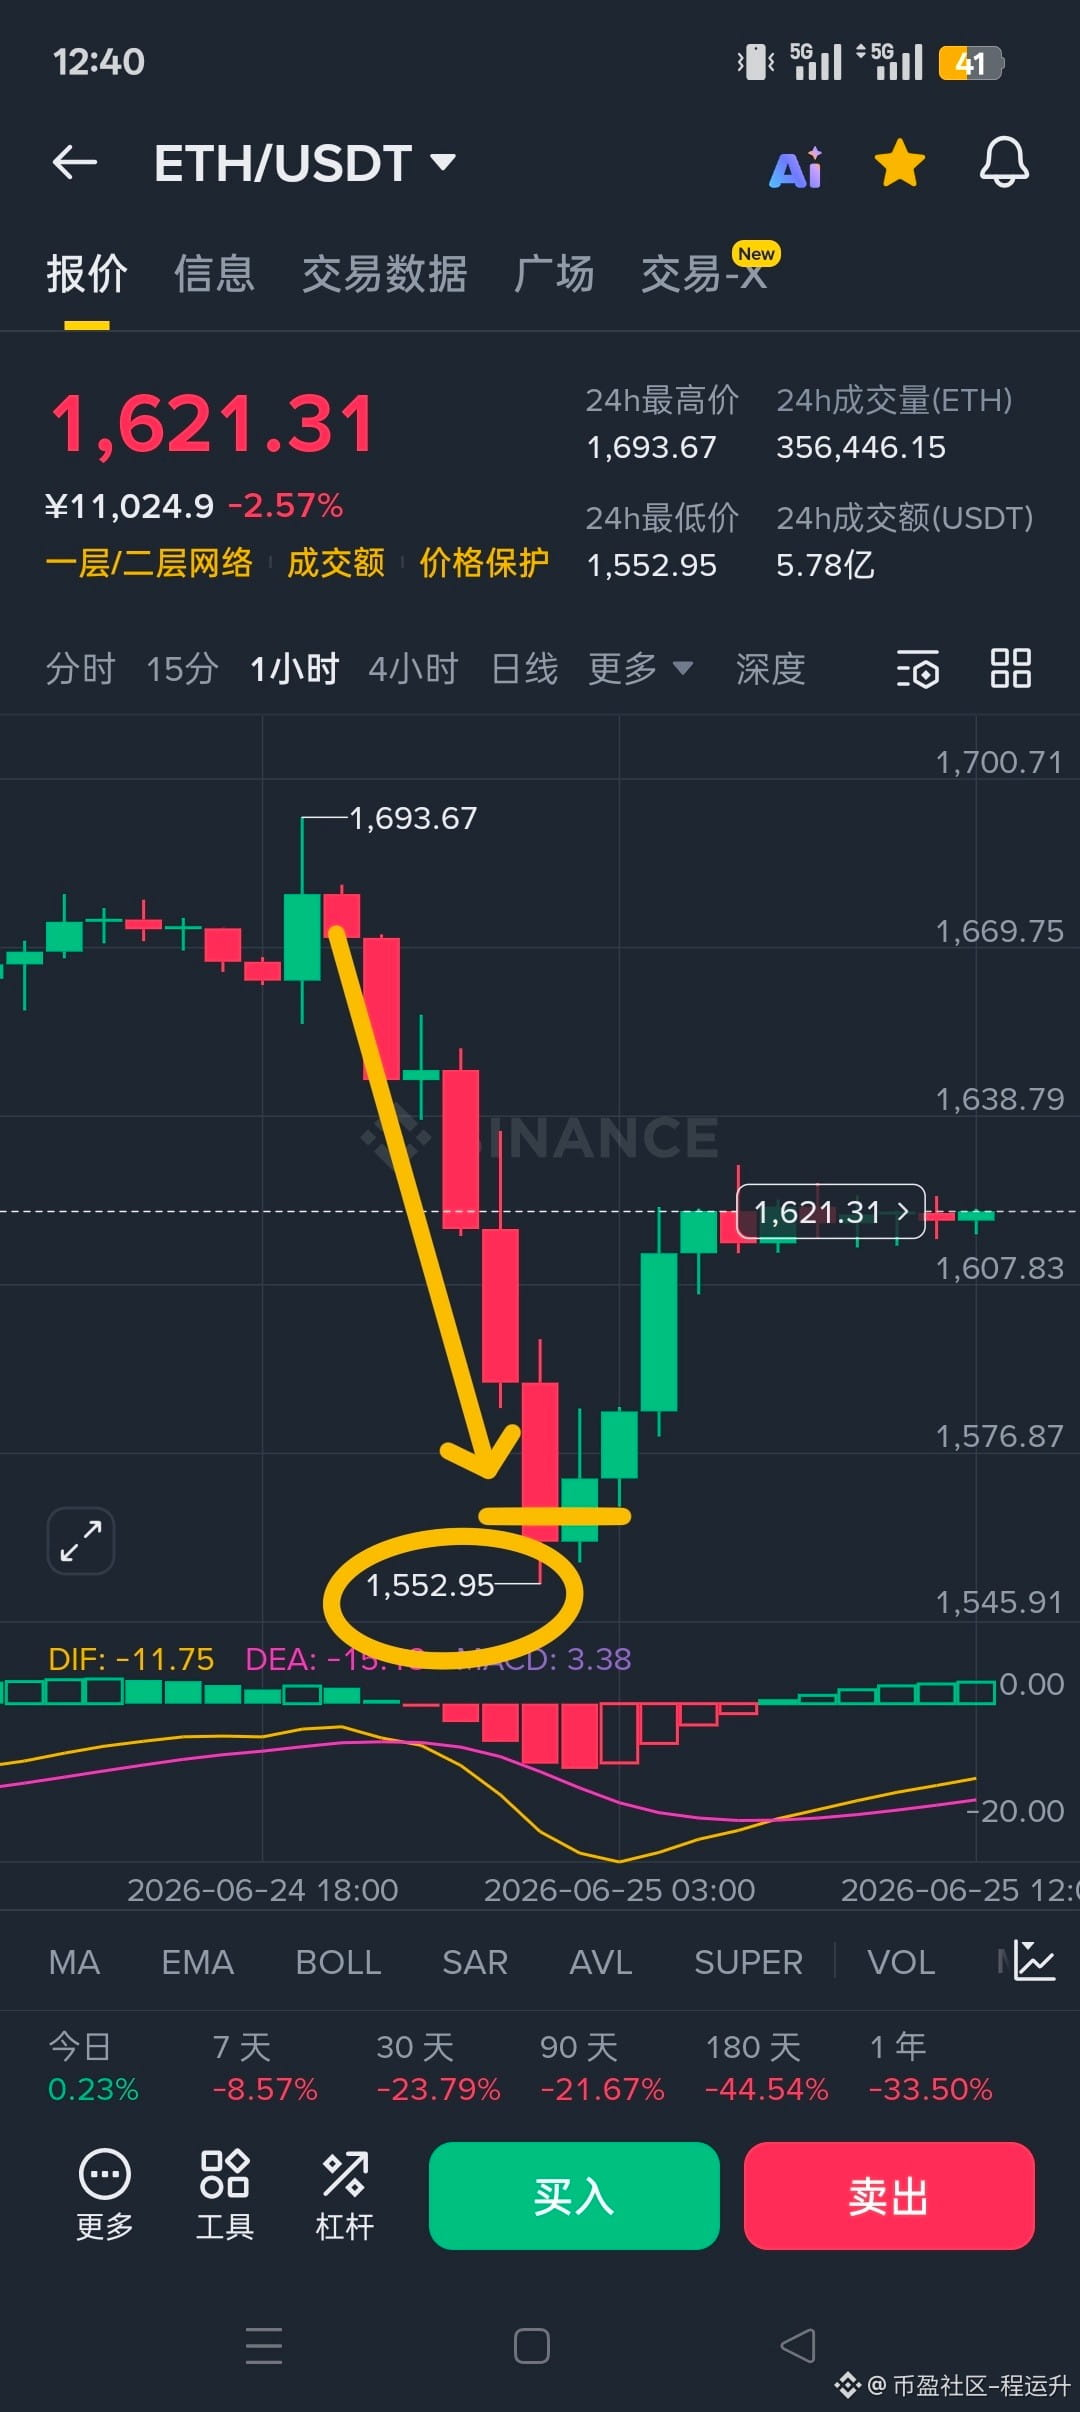
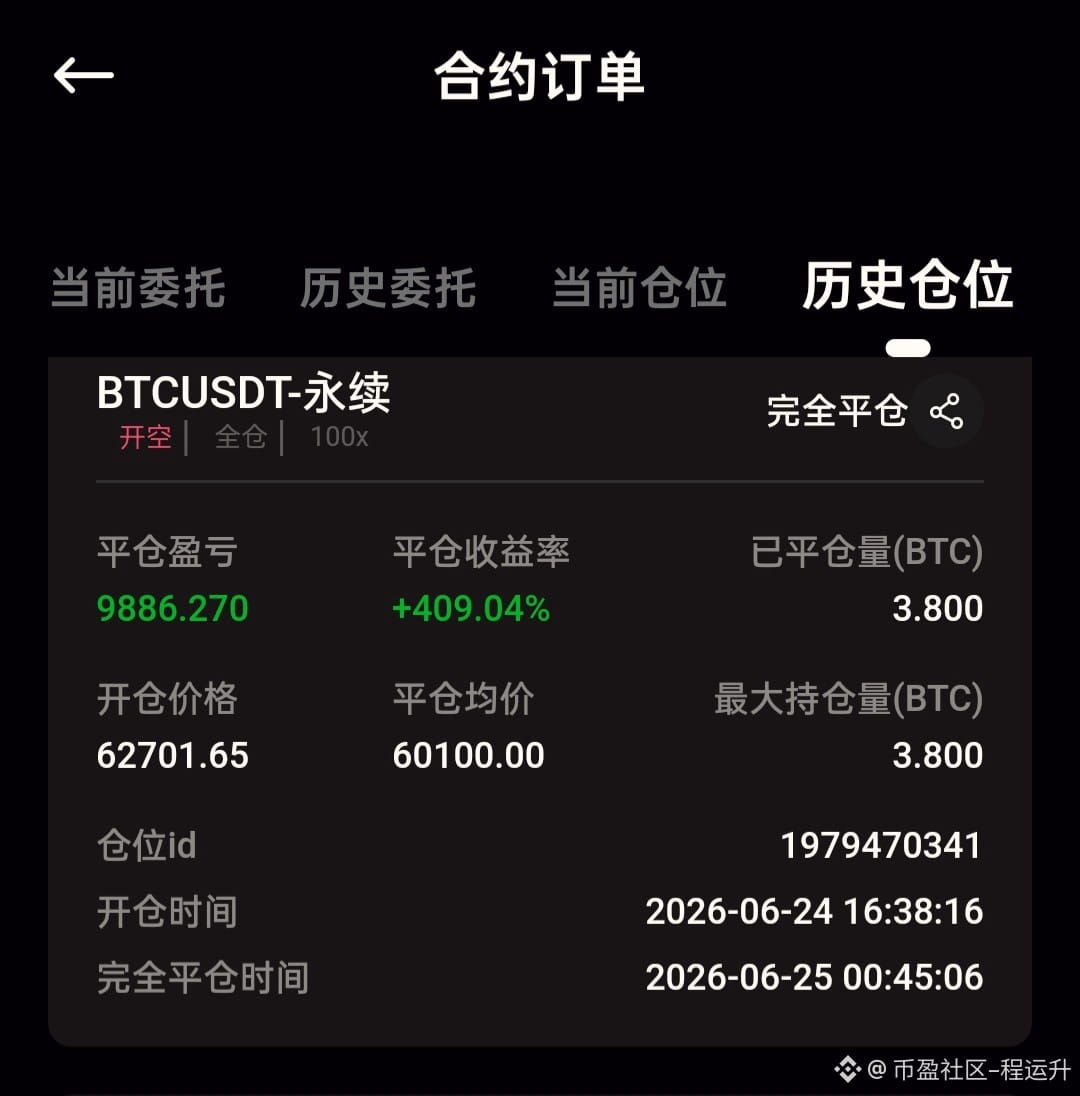
The short strategy I gave for BTC and ETH the day before yesterday was spot on, and I took profits early this morning. Friends who followed along and held on could grab some decent gains.
When trading, it’s crucial to pick your entry points wisely. The BTC and ETH markets aren't going to be smooth sailing; they’re all over the place with spikes and sideways action. If you're not tech-savvy and your mindset is off, blindly trading frequently will only lead to losses.
Trading is all about steady progress; sometimes you can't rush the process.
If you want to seize market opportunities and get a slice of the pie in this brutal market, and you’re struggling to manage it on your own, consider leveraging your strengths—sometimes it’s about working smarter, not harder. #BTC #ETH

1
520
·
--
Bearish
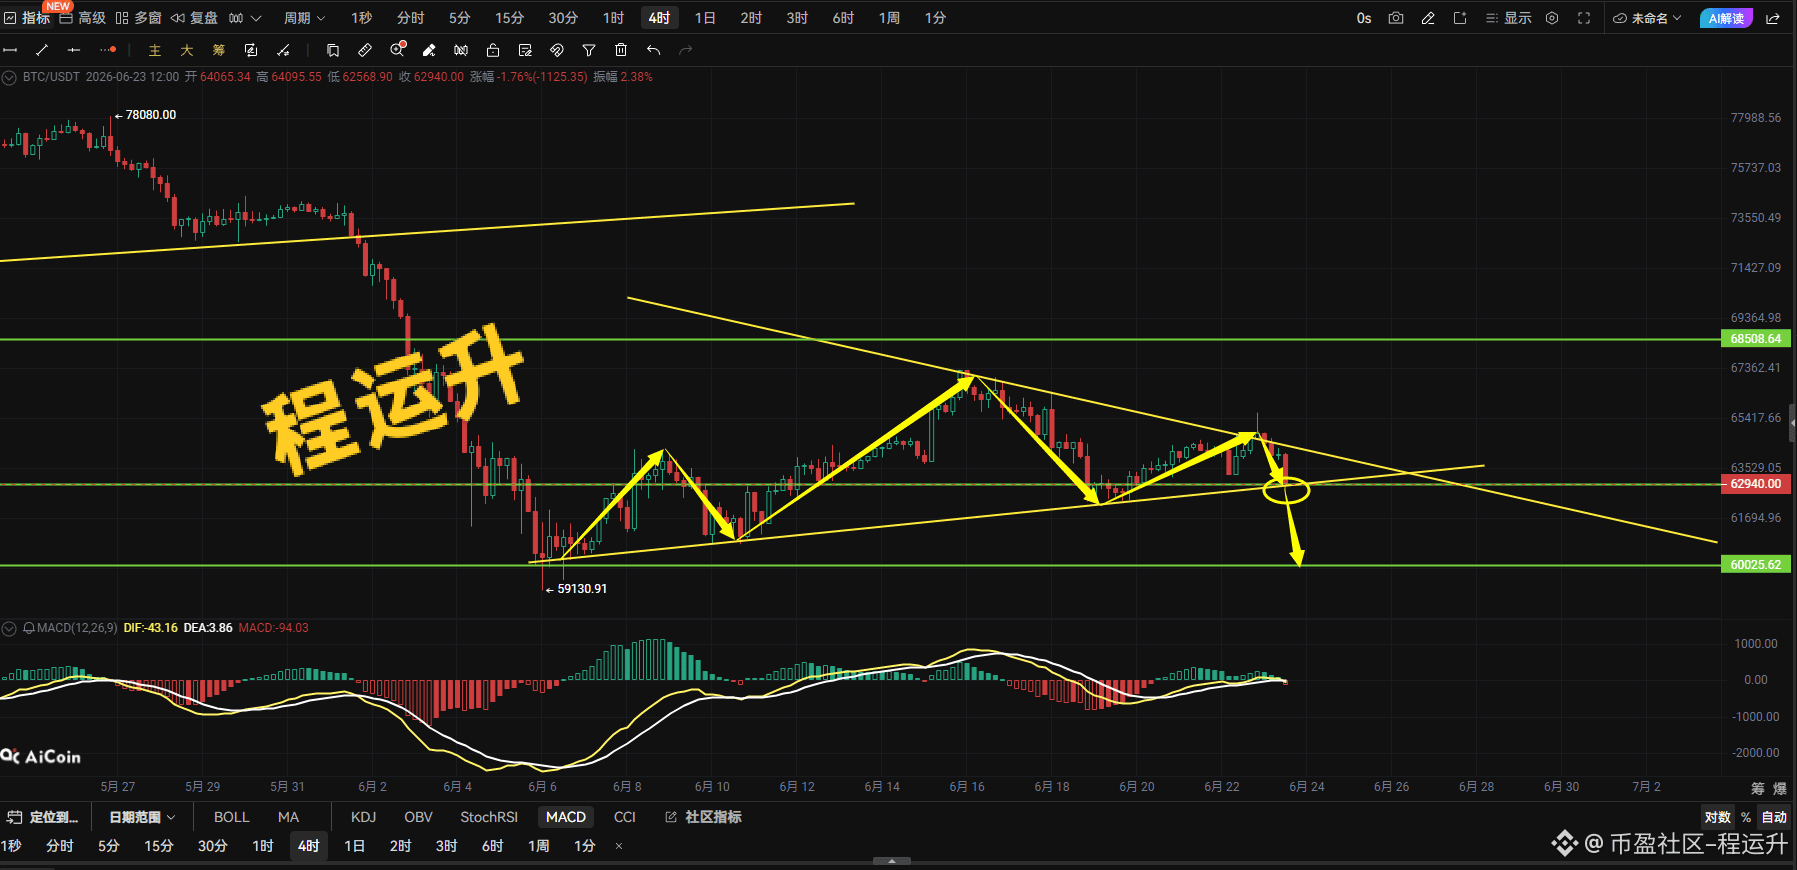
BTC trading strategy:
Short around 63000, take profit at 60100, stop loss at 63600.
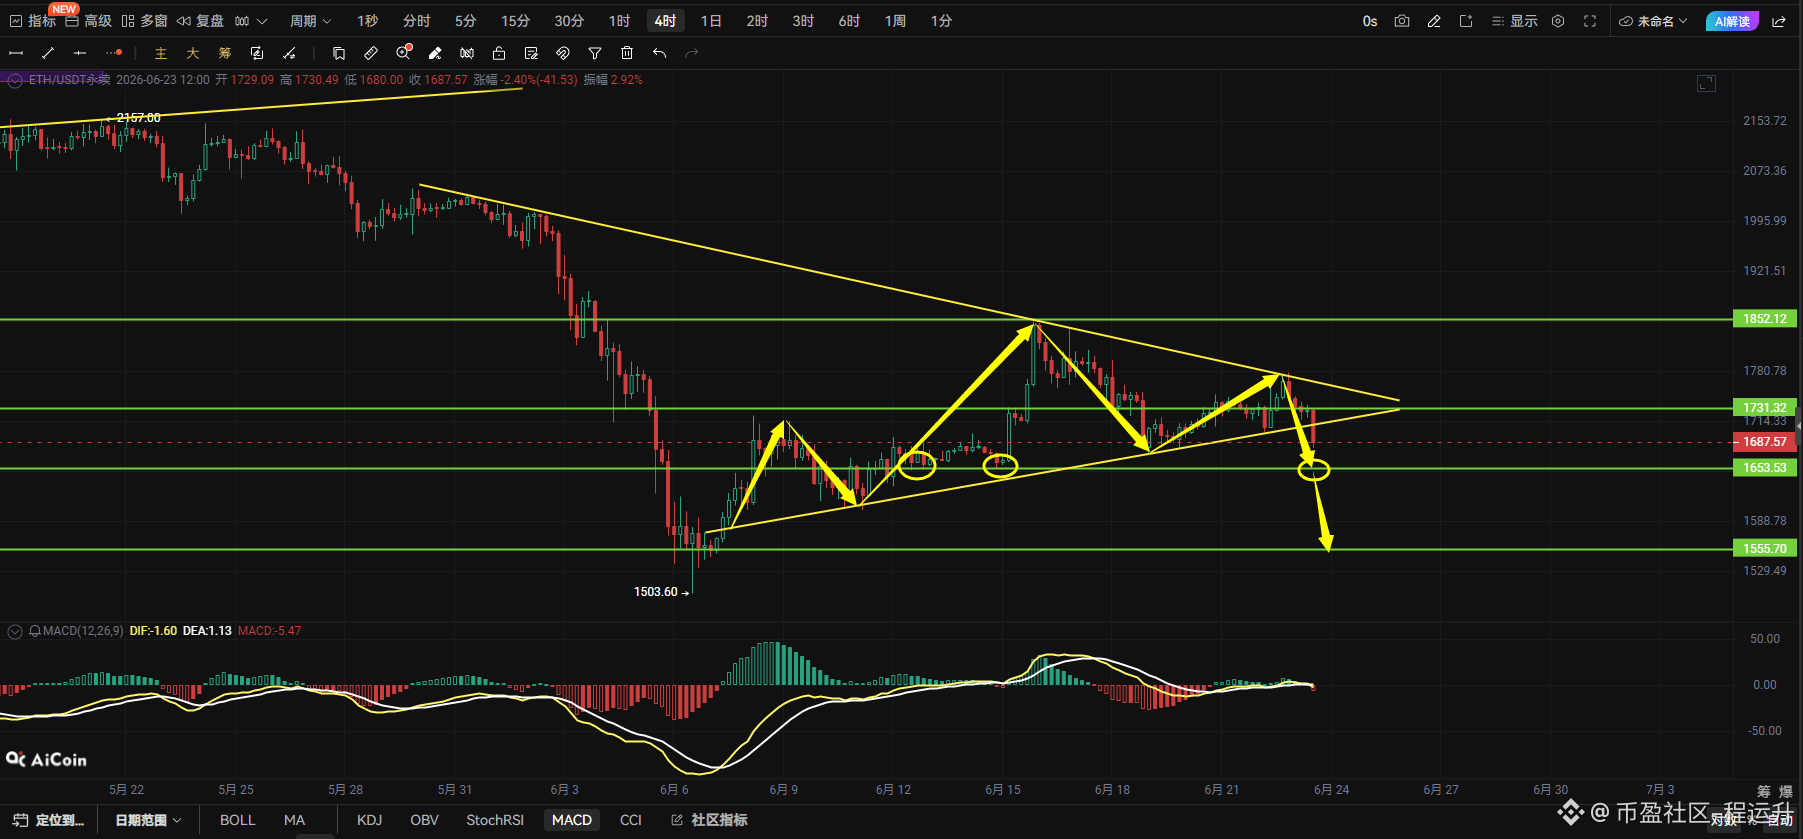
ETH trading strategy:
Short around 1682, take profit at 1556, stop loss at 1720#BTC走势分析 .
BTC trading strategy:
Short around 63000, take profit at 60100, stop loss at 63600.
ETH trading strategy:
Short around 1682, take profit at 1556, stop loss at 1720#BTC走势分析 .
Short around 63000, take profit at 60100, stop loss at 63600.
ETH trading strategy:
Short around 1682, take profit at 1556, stop loss at 1720#BTC走势分析 .
1
1
735
·
--
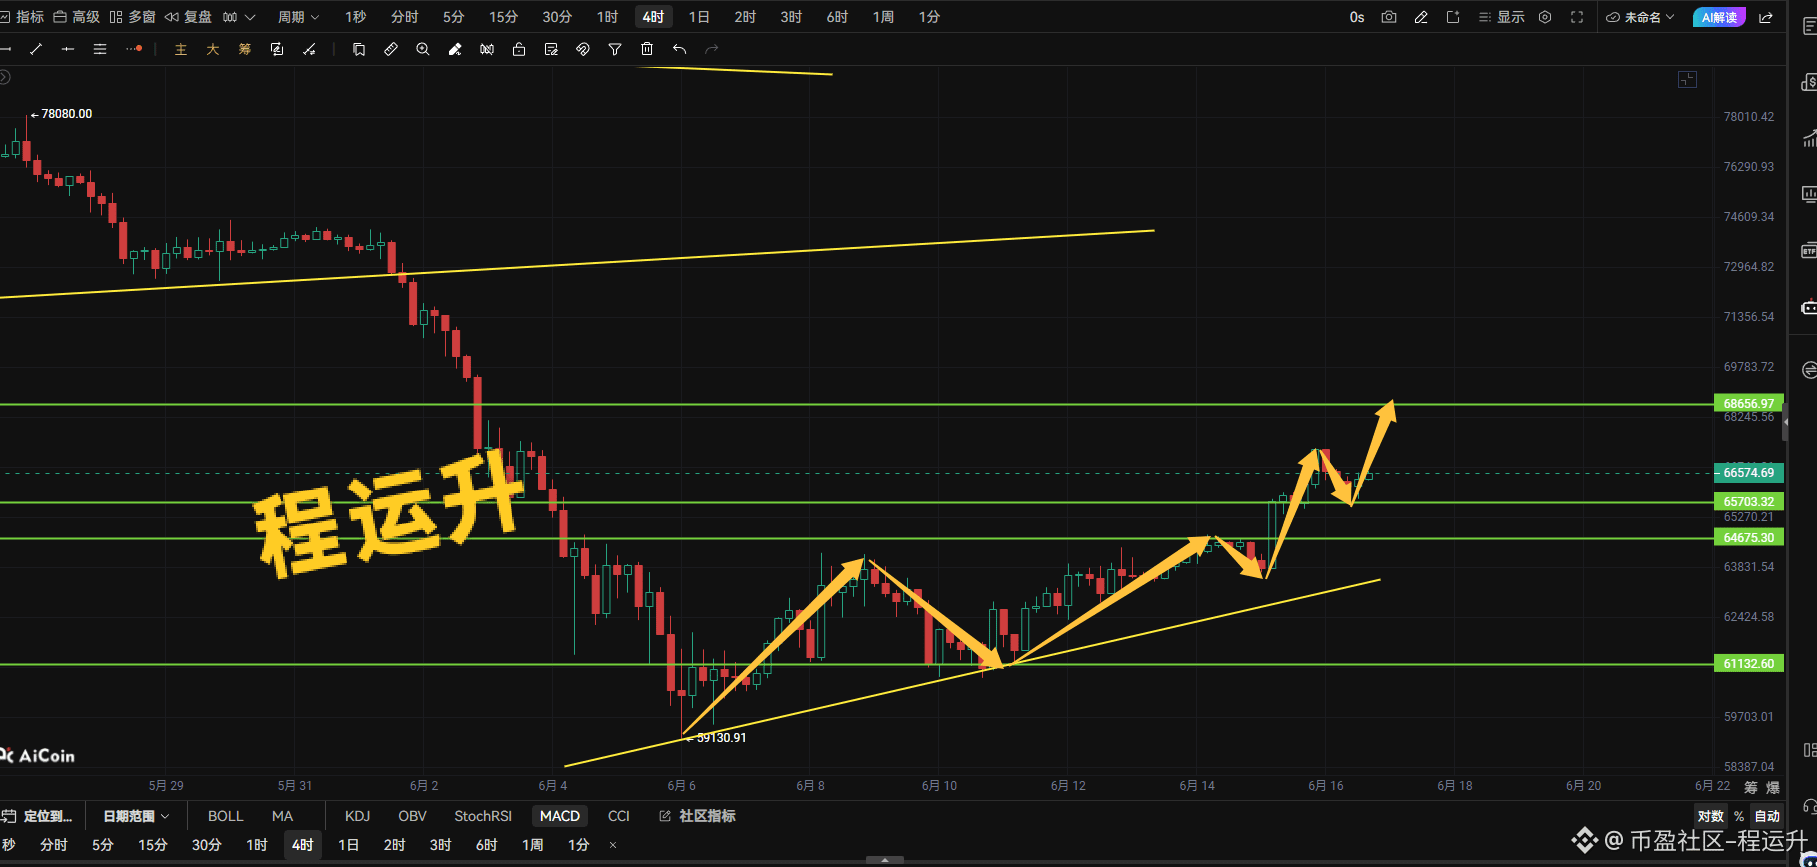
Bitcoin and Ethereum have been on a tear these past couple of days mainly due to easing geopolitical risks.
So for the short term, there’s no continuation of the downtrend, with the US and Iran reaching a peace framework agreement and the Strait of Hormuz set to reopen.
Oil prices have plummeted → inflation worries have cooled → expectations for Fed rate cuts are rising, and global risk appetite is warming up, leading to capital flowing back into the stock market and crypto.
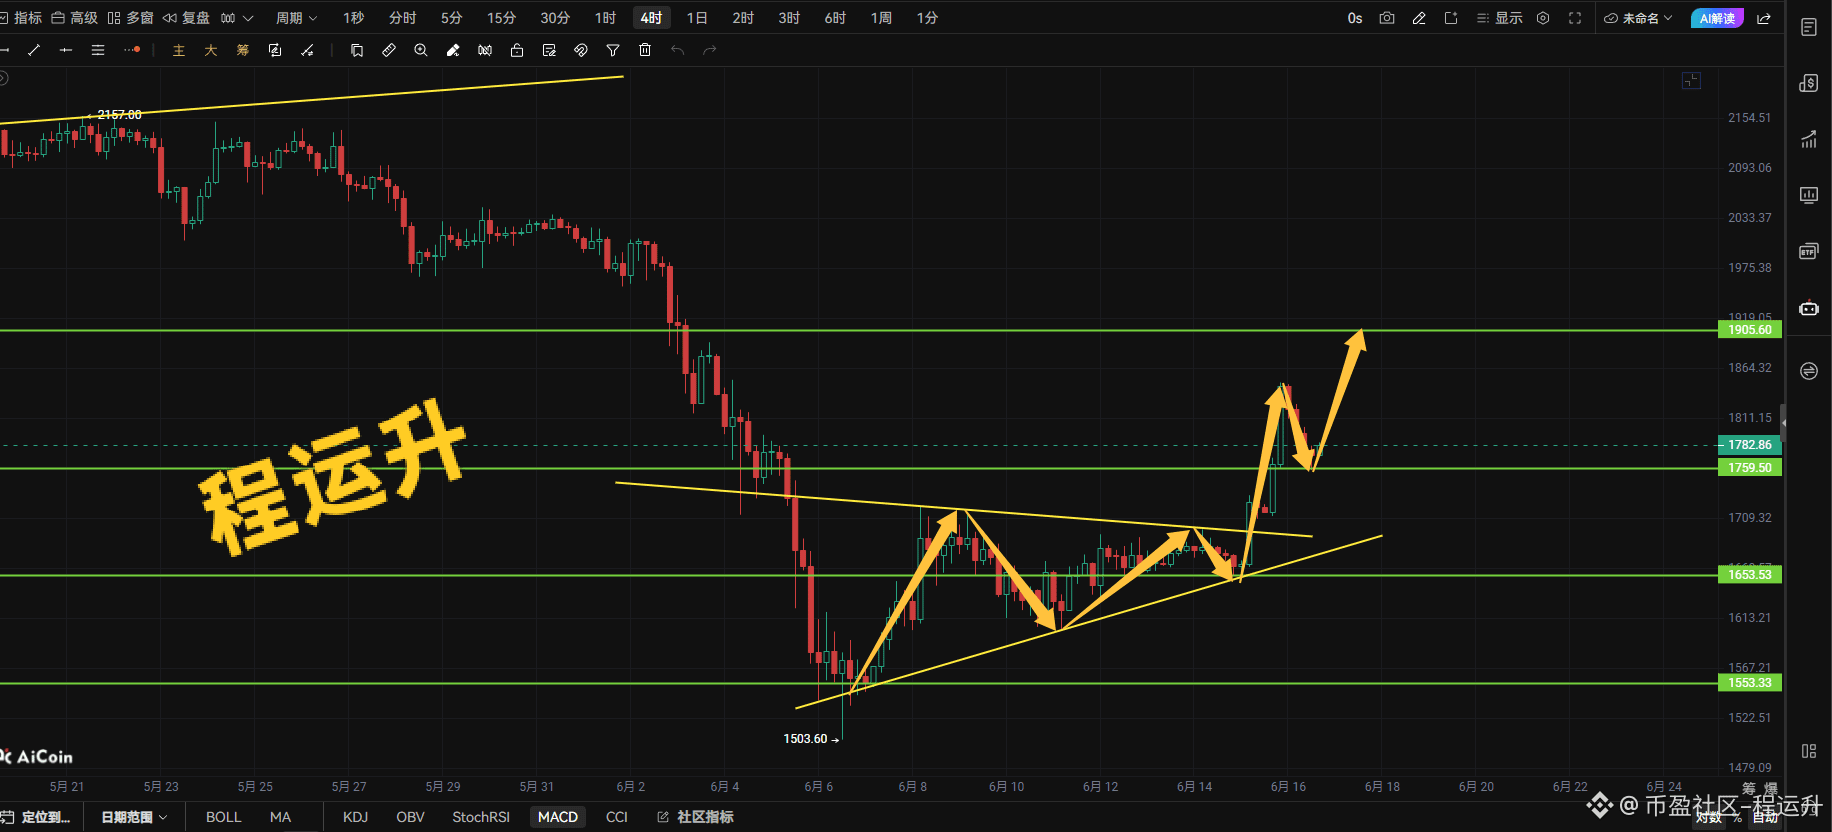
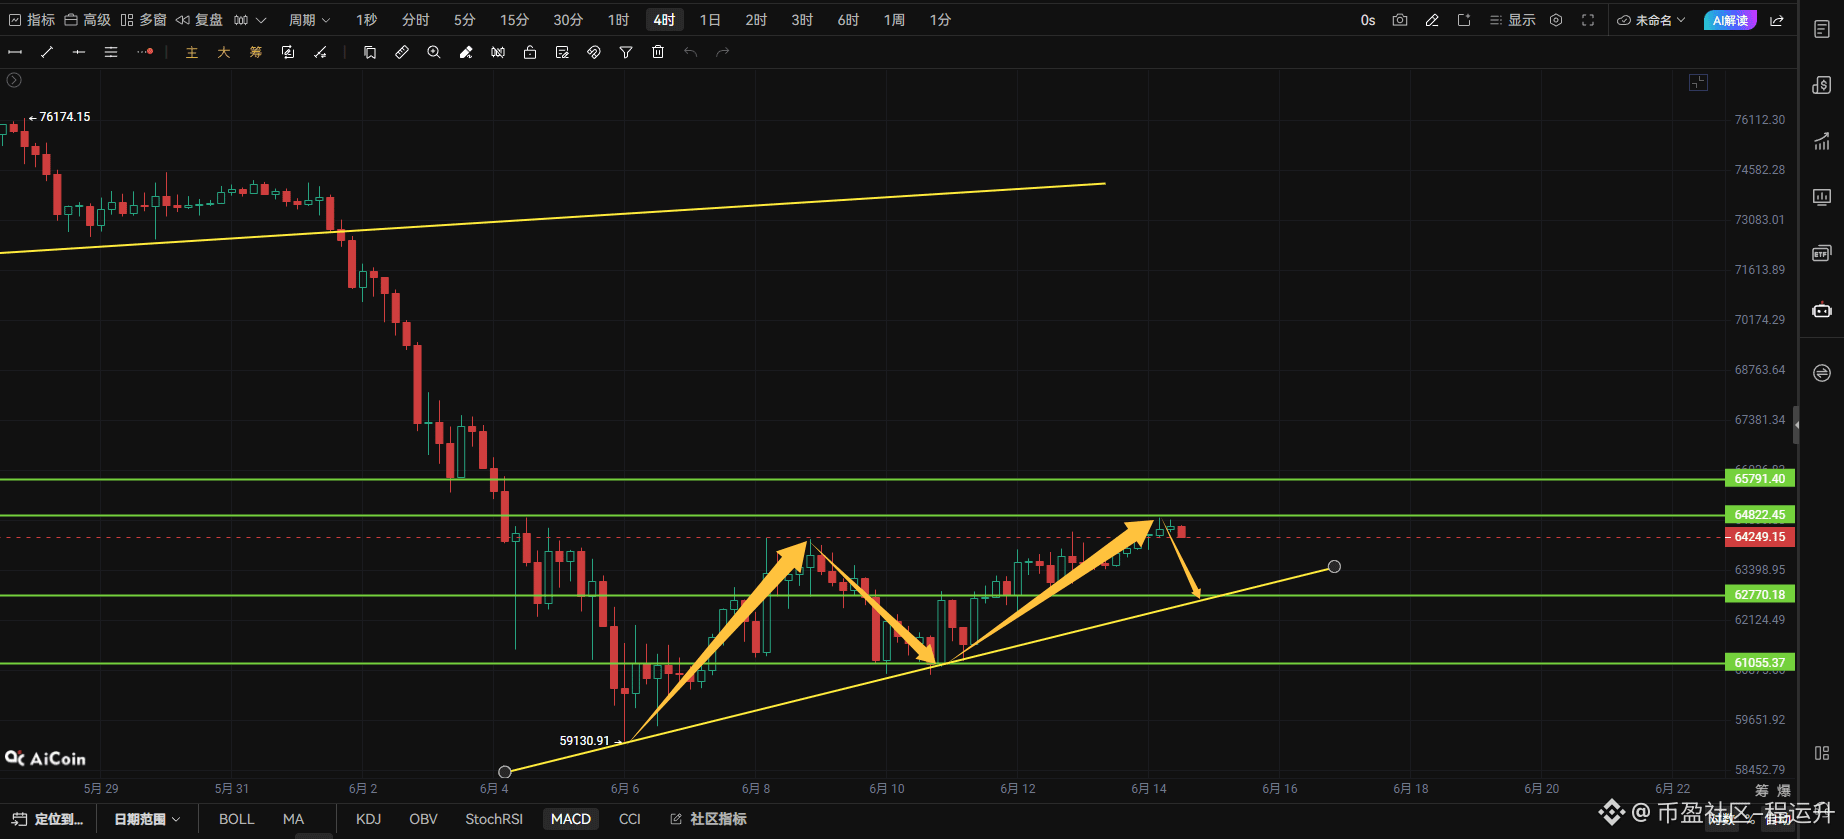
Currently, Bitcoin is forming an ascending triangle, with a pullback finding support around 65500, and it’s now gradually climbing. It's already held above 66000, so I suggest going long at 66100, with targets up at 68500 and a stop at 65500.
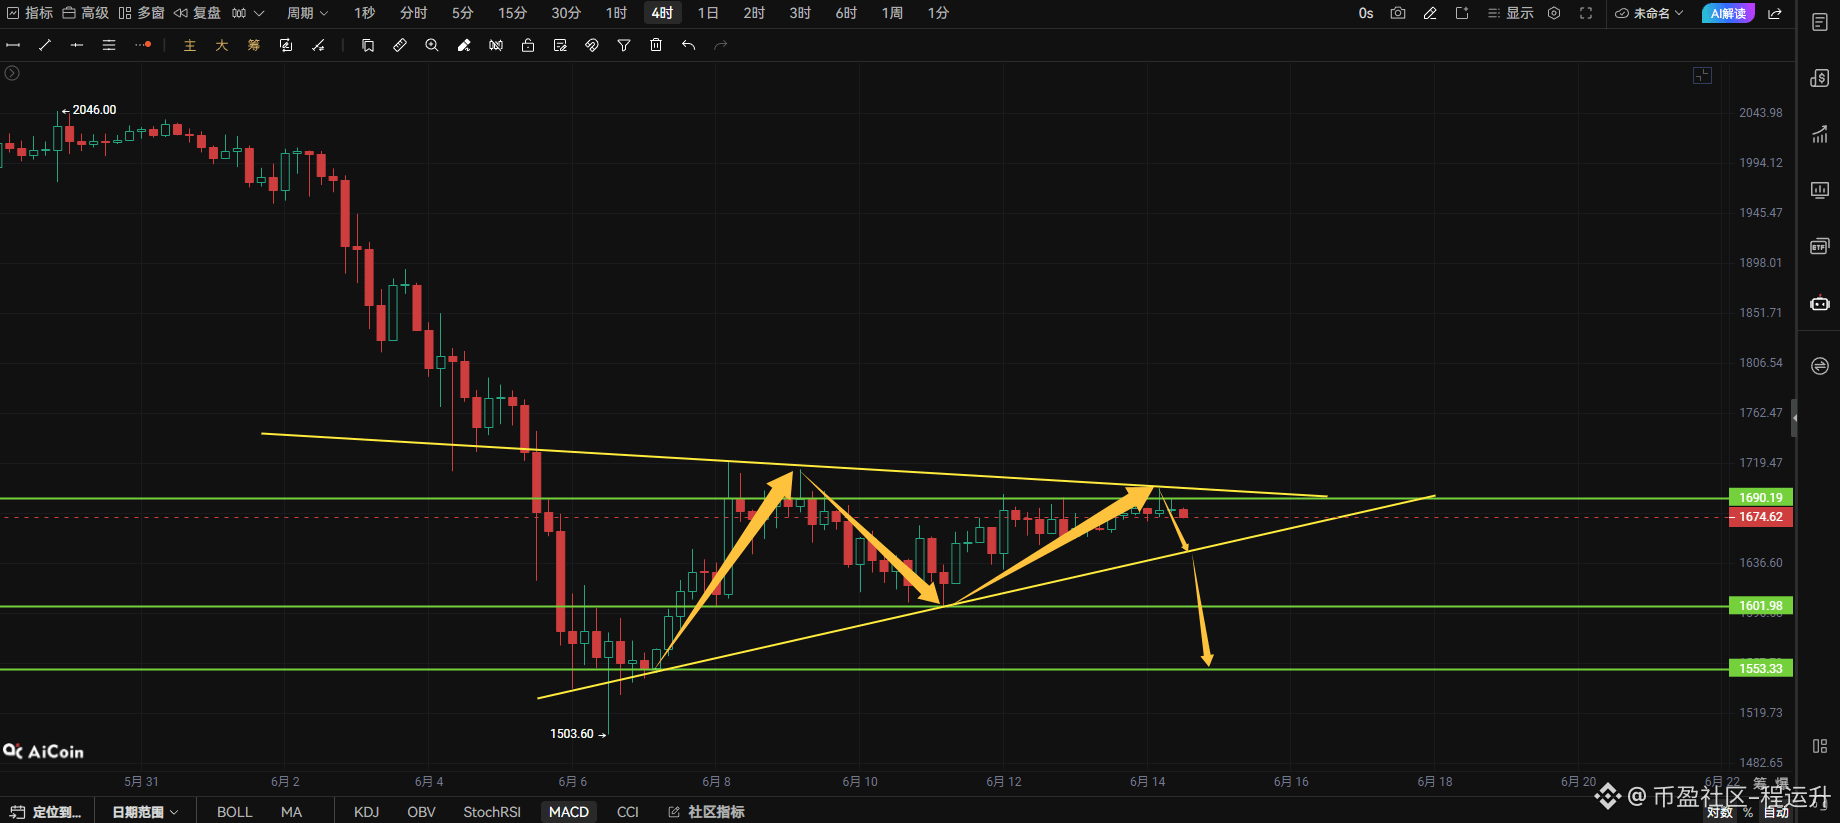
Ethereum has broken out of the triangular convergence zone, the pullback is in place, and the upward trend is clear. You can enter long at 1765, targeting 1905, with a stop loss at 1720.
375
·
--
Bullish
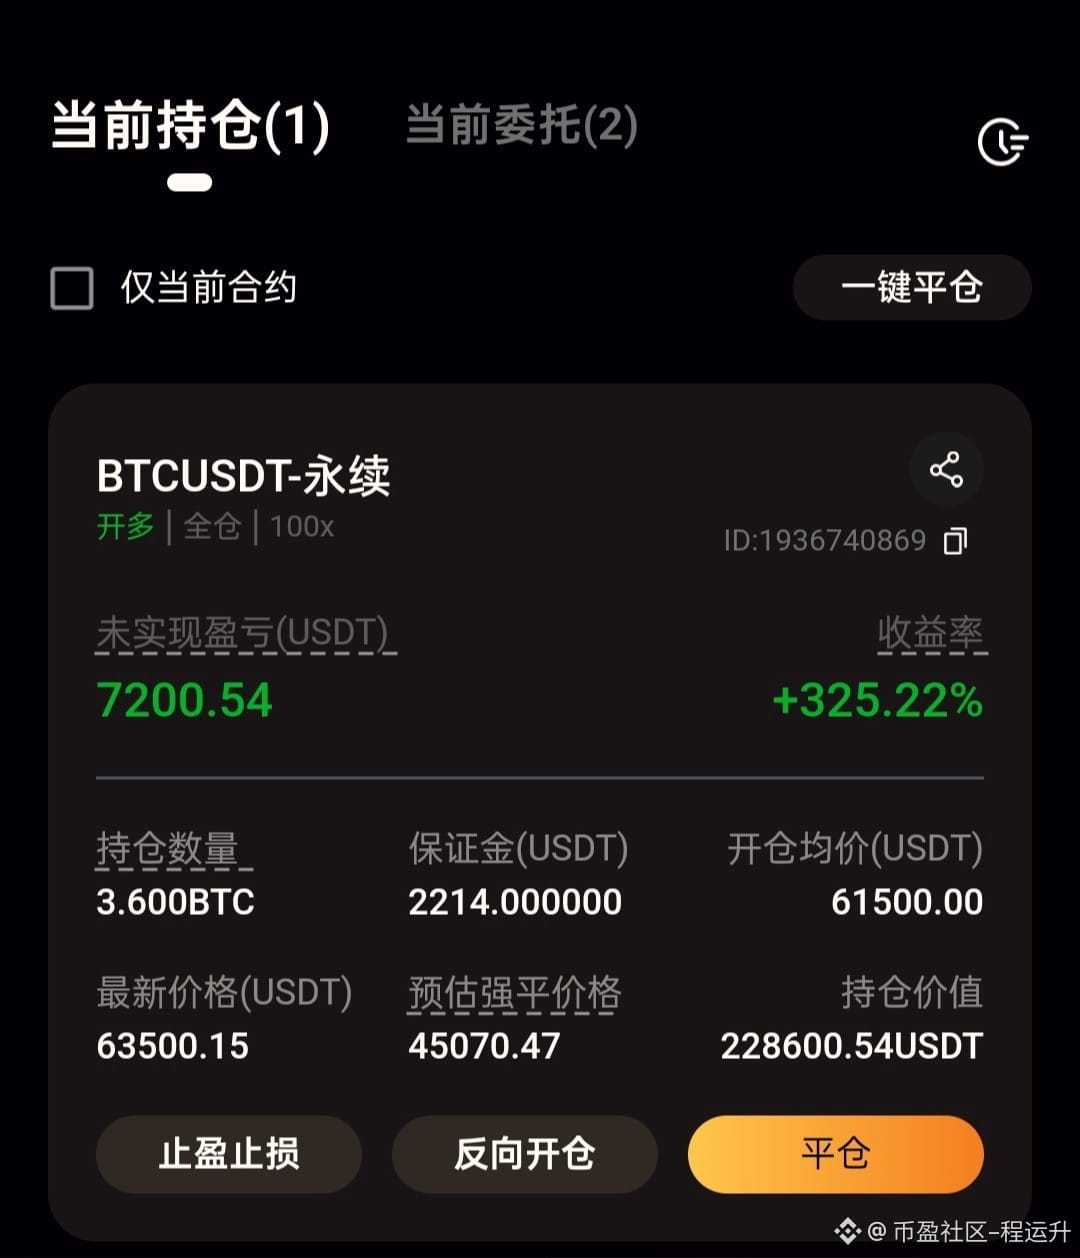
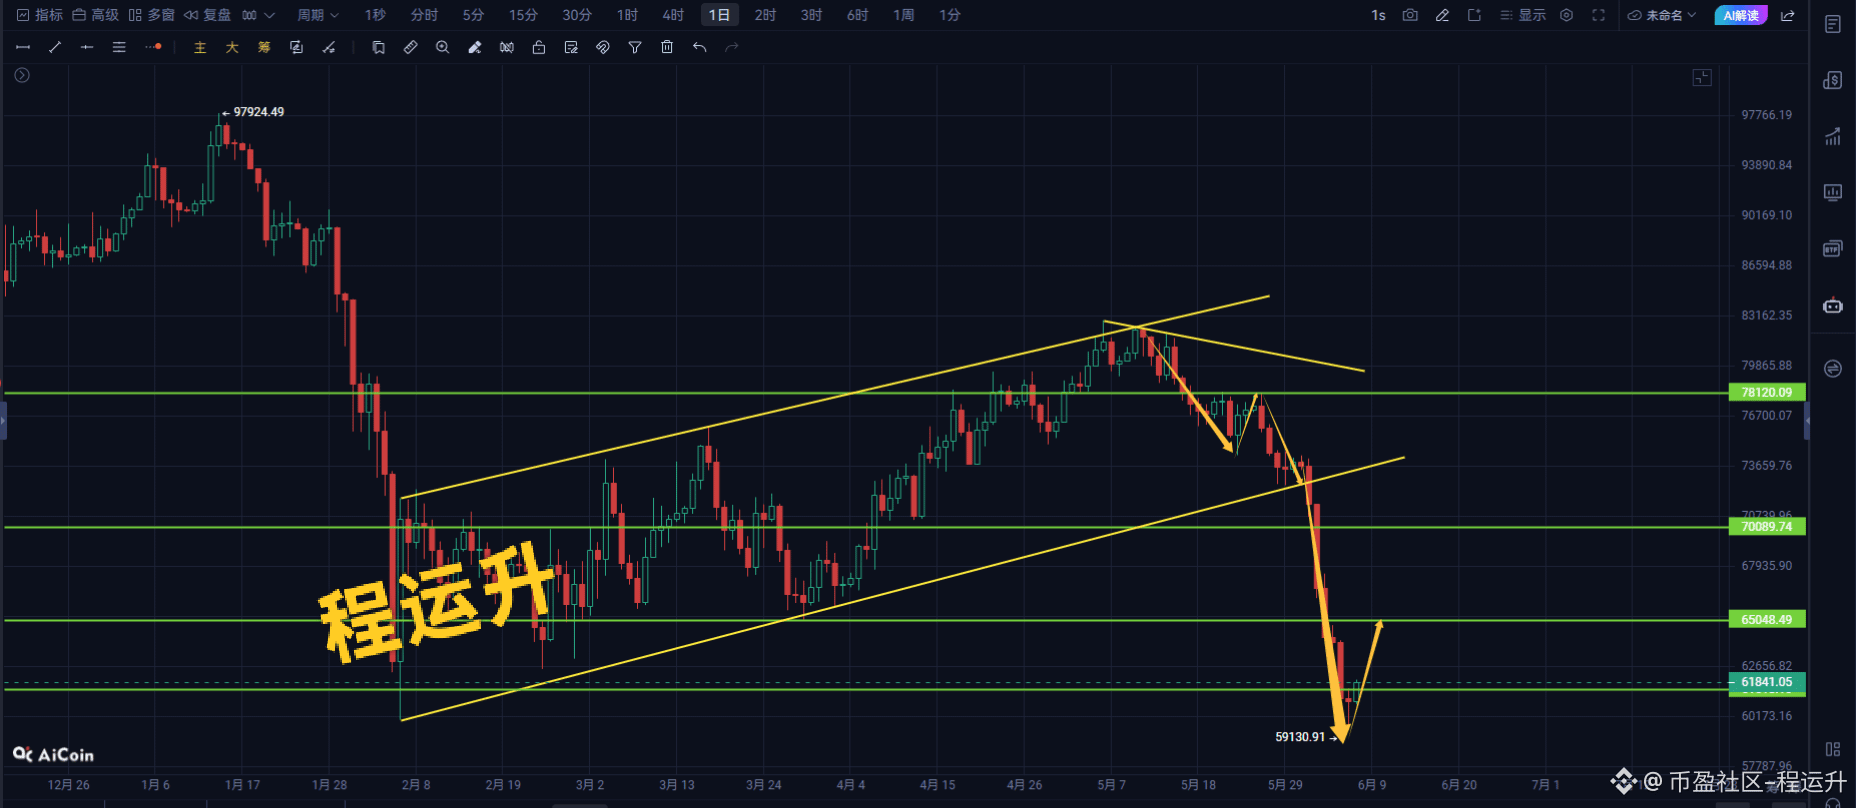
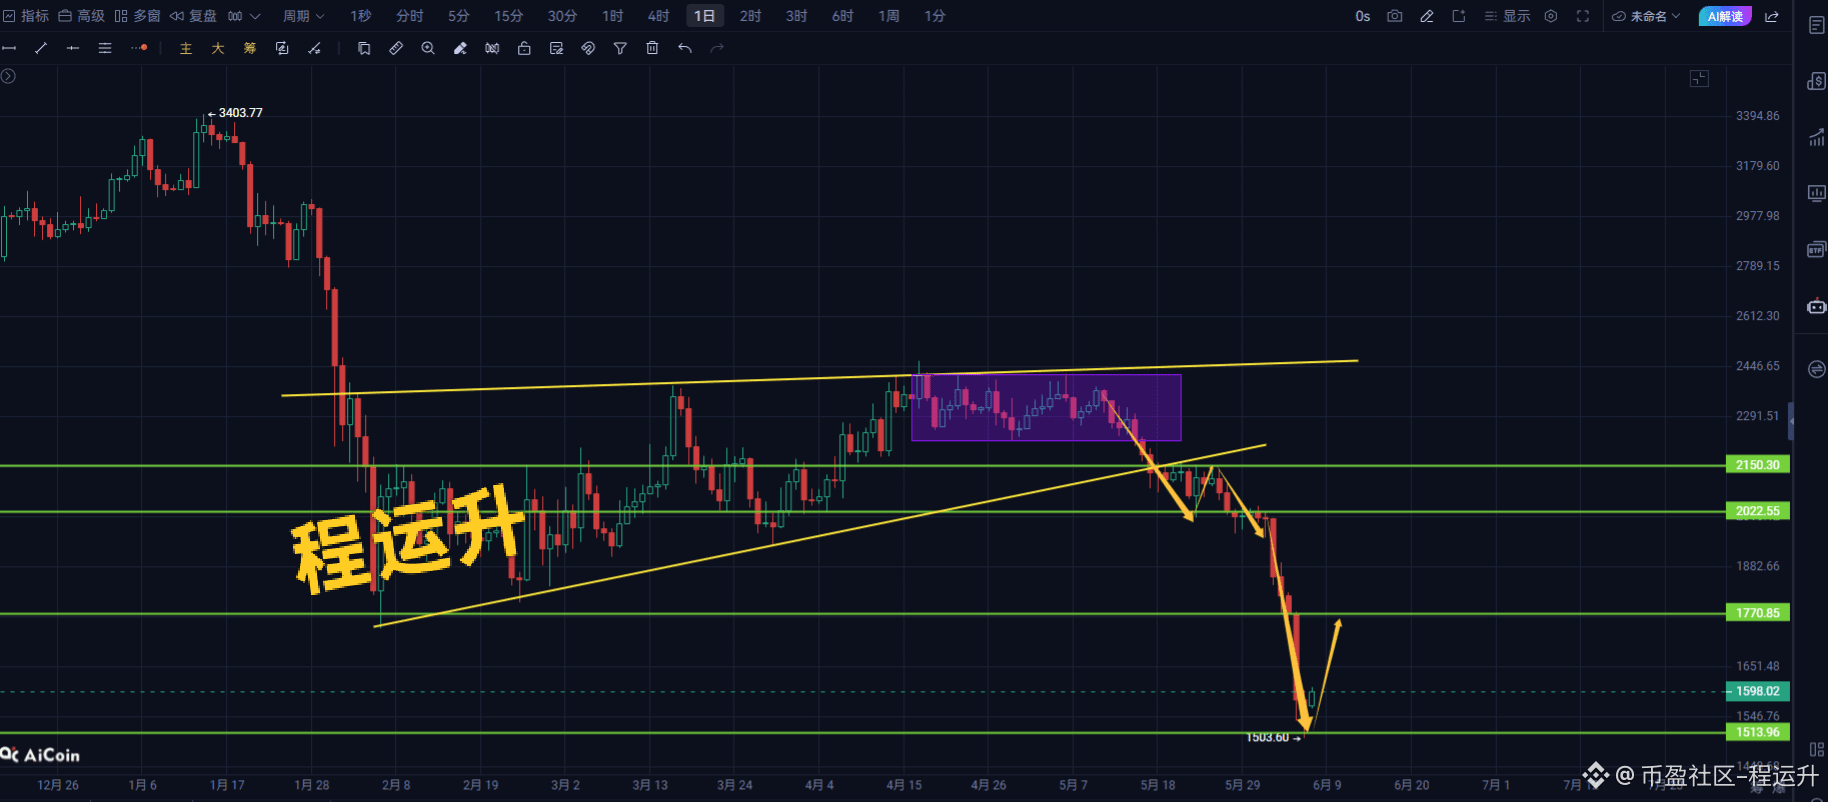
Yesterday's long strategy for BTC and ETH was spot on again. I nailed the entry for BTC, and I'm currently in profit. If you're playing it safe, you can cash out half your position and let the rest ride toward the target!
In trading, it's all about picking the right entry points. The BTC and ETH market isn't always smooth sailing; it can whip back and forth like a pendulum. If you don’t understand the tech and have a shaky mindset, frequent blind trades will just lead to losses.
Trading is all about a steady progression; sometimes you can't rush the process.
If you want to grab a slice of this tough market and you're constantly losing, you might want to leverage your strategy—thinking smart is better than just working hard! #比特币反弹突破6.3万美元

2
434
·
--
Bearish
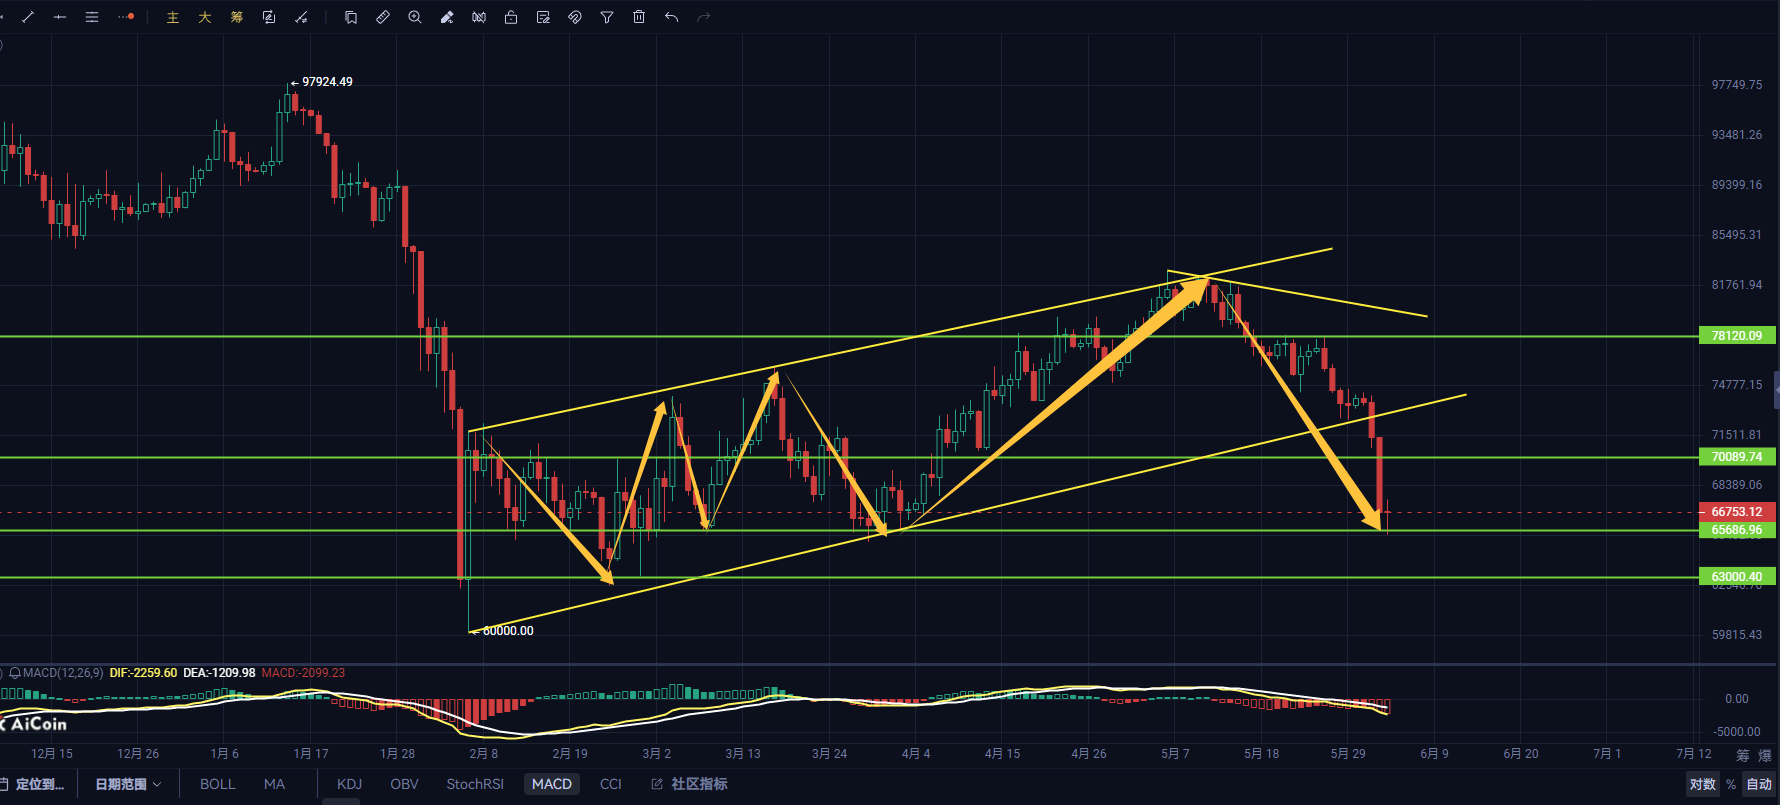
Bitcoin is currently eyeing support around 65500; if it breaks that, we’ll continue to slide down, with further attention on the 63000 level for support. Ethereum at 1815 is facing a solid support; if that level breaks, we could see a further drop.
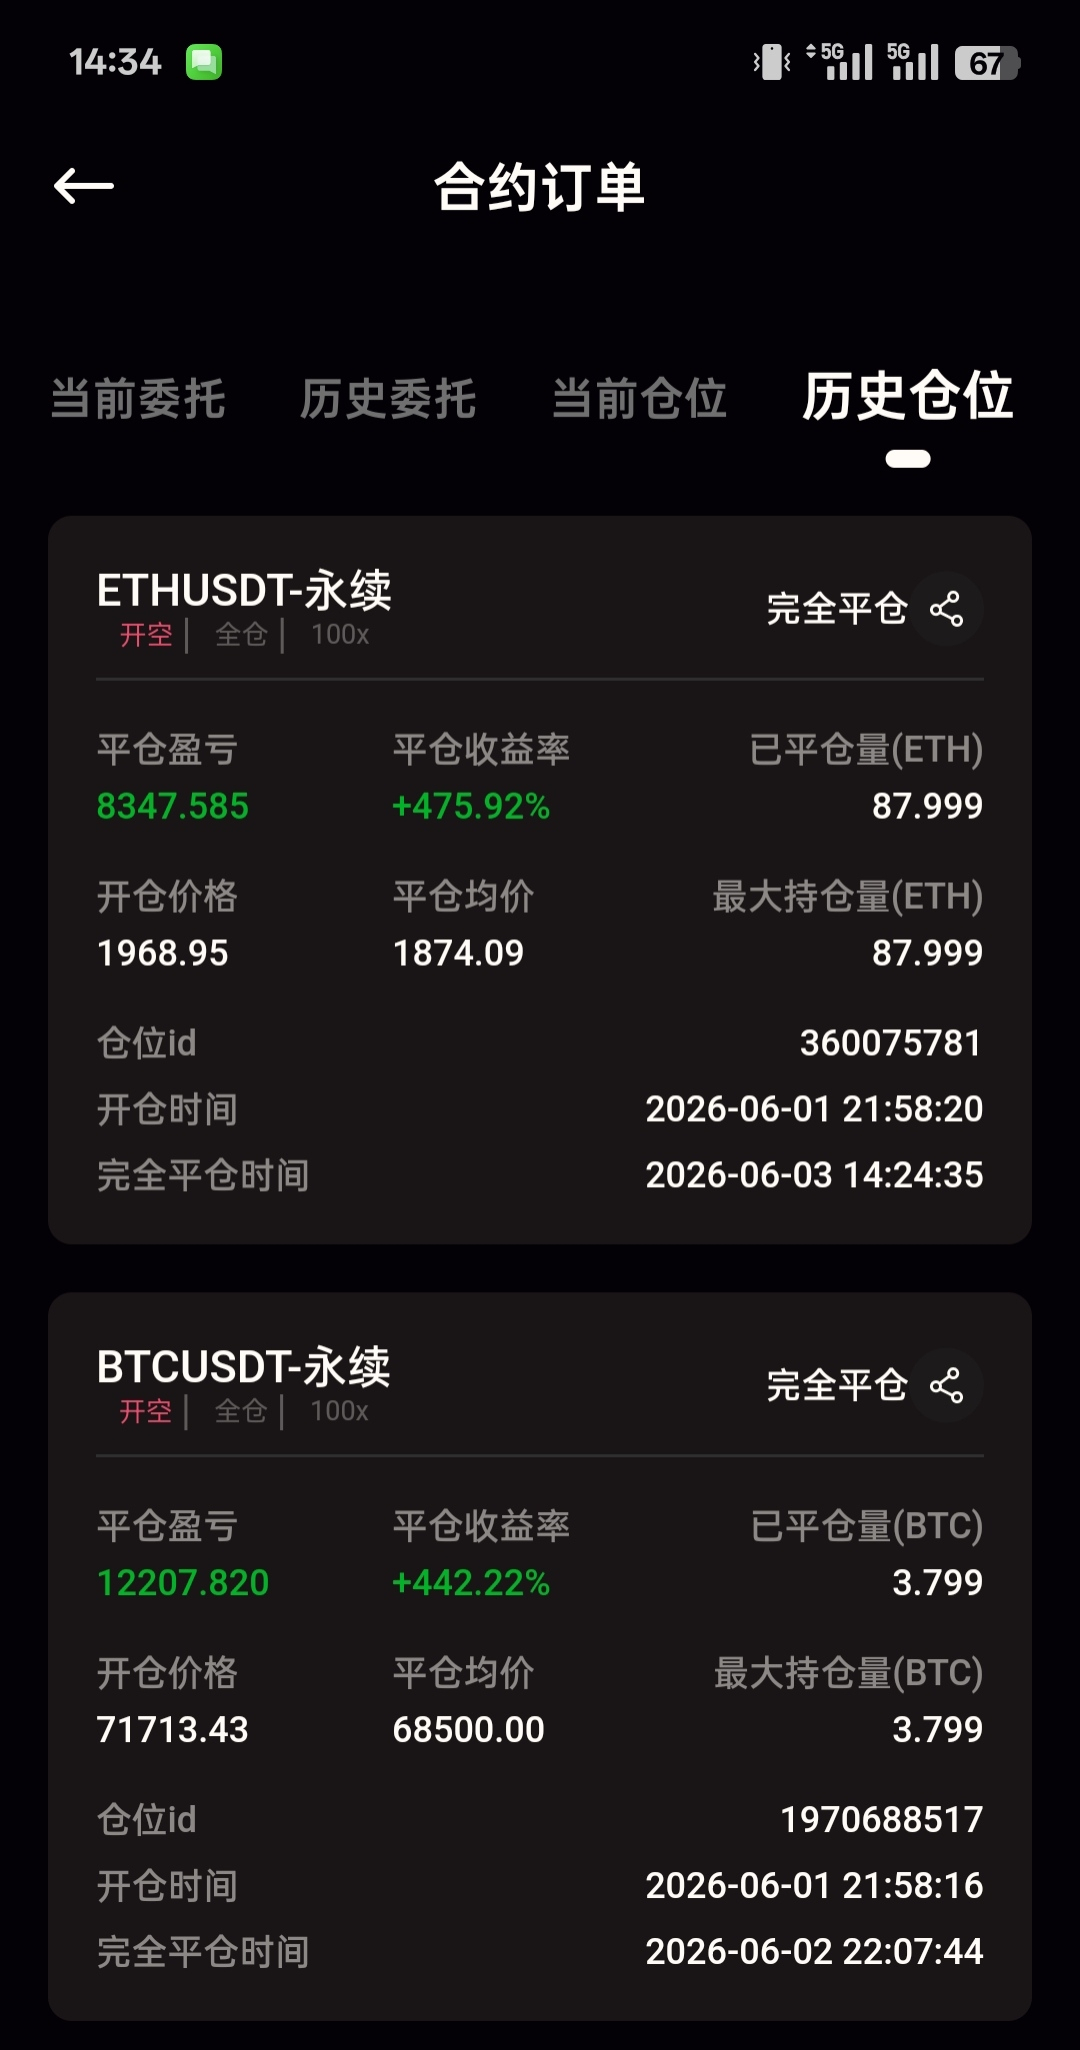
Previously, I shared a short strategy for Bitcoin and Ethereum; Bitcoin hit the take profit perfectly, and Ethereum was spot on. Although I exited early, those who followed closely could pocket some decent profits.
When trading, it’s crucial to find the right entry points. The Bitcoin and Ethereum markets are not going to be smooth sailing; expect some whipsaws and sideways action. Those who don’t understand the technicals and have a poor mindset can end up making blind, frequent trades, which usually leads to losses.
The goal in trading is to have a steady progress; sometimes you can’t be too eager for quick wins.
If you want to grab a piece of the pie in this brutal market, and if you're struggling and often in the red, you might want to leverage your efforts by choosing wisely instead of just working hard. #BTC走势分析 #ETH trend analysis

1
1.3k
·
--
Bearish
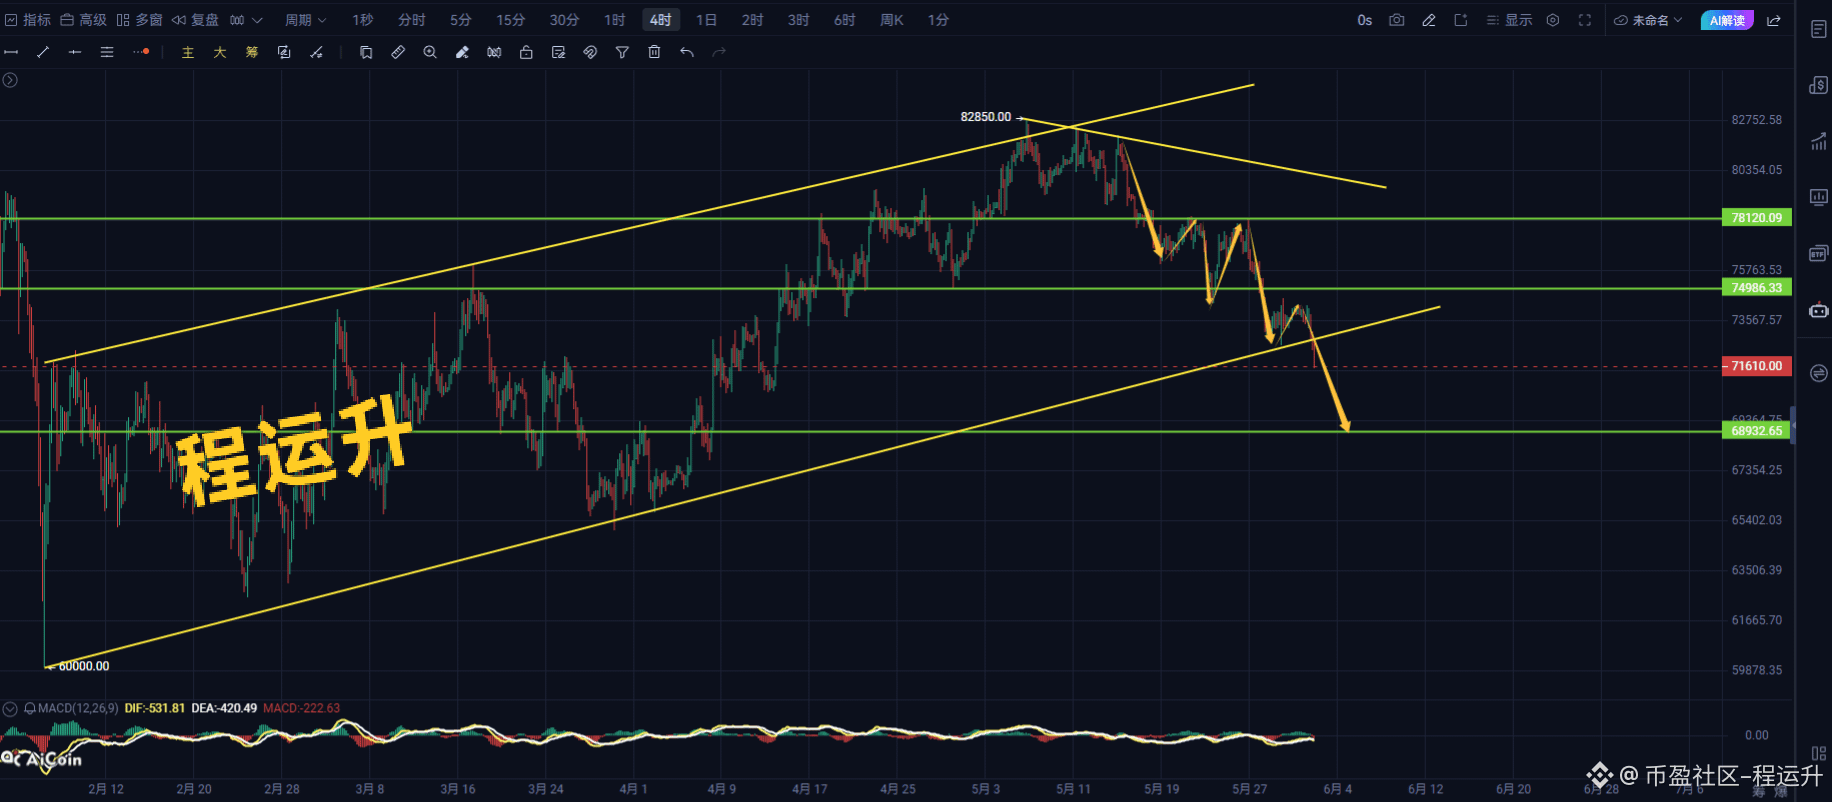
btc reference strategy:
Enter a short around 72000, take profit at 68500, stop loss at 72650.
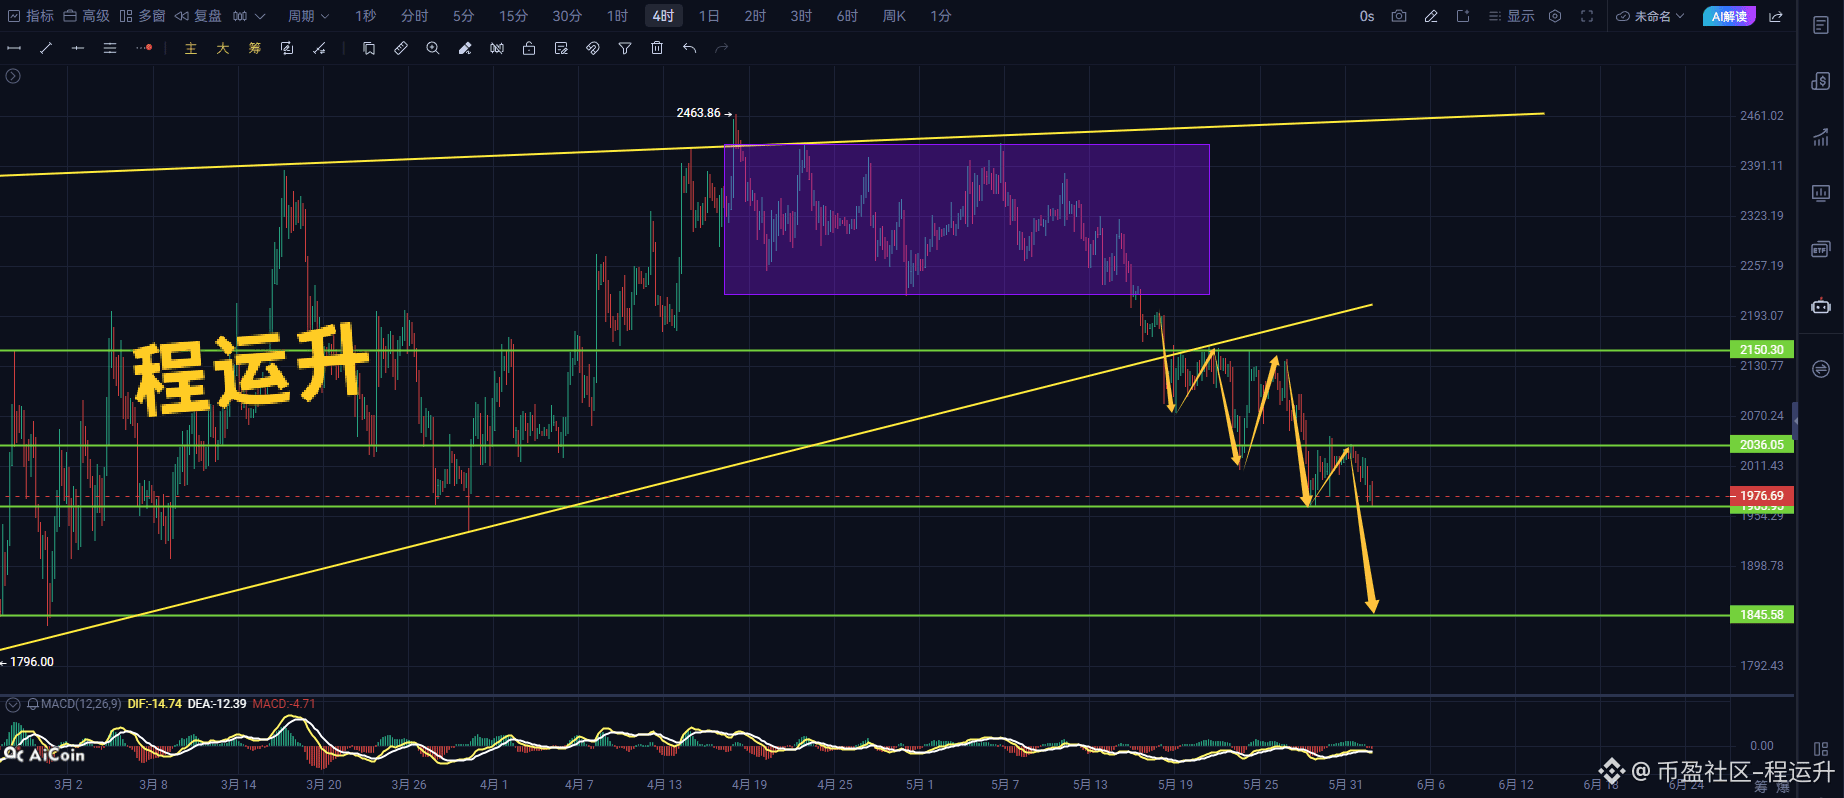
eth reference strategy:
Enter a short around 1970, take profit at 1815, stop loss at 2025#BTC走势分析 #ETH trend analysis.
btc reference strategy:
Enter a short around 72000, take profit at 68500, stop loss at 72650.
eth reference strategy:
Enter a short around 1970, take profit at 1815, stop loss at 2025#BTC走势分析 #ETH trend analysis.
Enter a short around 72000, take profit at 68500, stop loss at 72650.
eth reference strategy:
Enter a short around 1970, take profit at 1815, stop loss at 2025#BTC走势分析 #ETH trend analysis.
1
1
725
Log in to explore more content
Join global crypto users on Binance Square
⚡️ Get latest and useful information about crypto.
💬 Trusted by the world’s largest crypto exchange.
👍 Discover real insights from verified creators.
Email / Phone number