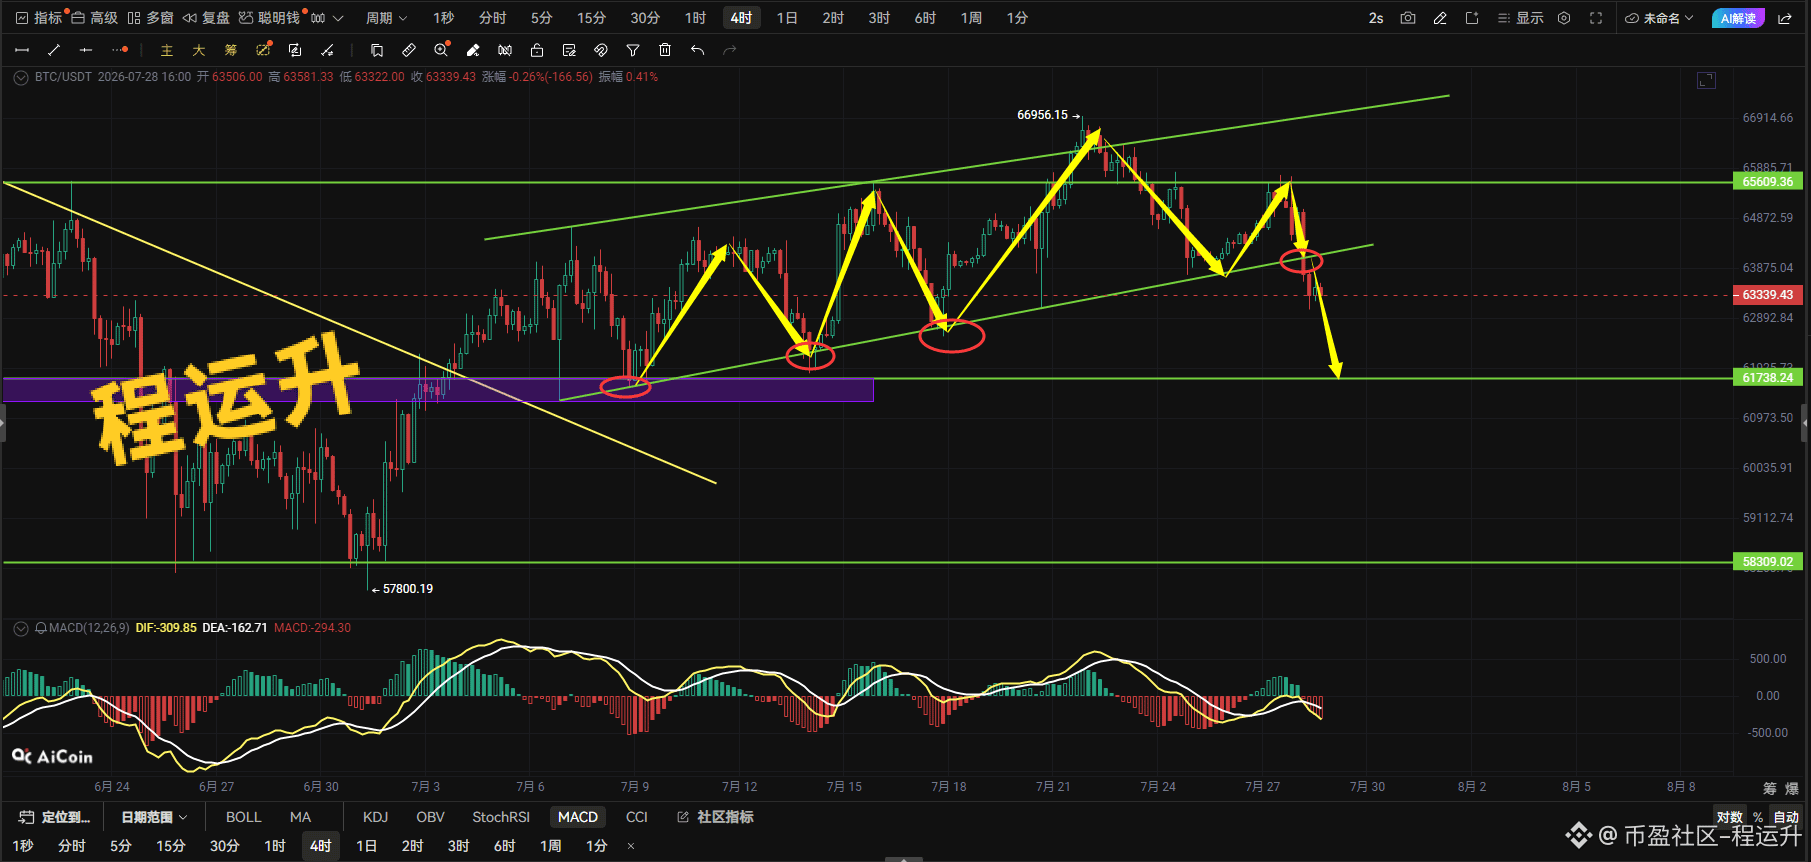
Bitcoin surged to a high yesterday, then oscillated and pulled back. Recently, the K-line has fallen below the lower boundary support of the previous ascending channel. Near-term price action is bearish, and it is expected to move downward to find support.
The MACD indicator is hovering around the zero line and shows bearish momentum. The red histogram bars have widened into negative territory, indicating that on the 4-hour timeframe, the bears are currently in control.
On the downside, the key support to watch is the horizontal support in the purple high-density trading area around 61,700. In terms of trading, it is recommended to focus on short positions. You can consider entering shorts around 64,000, aiming for 61,800. Set protection/stop-loss at 64,500.
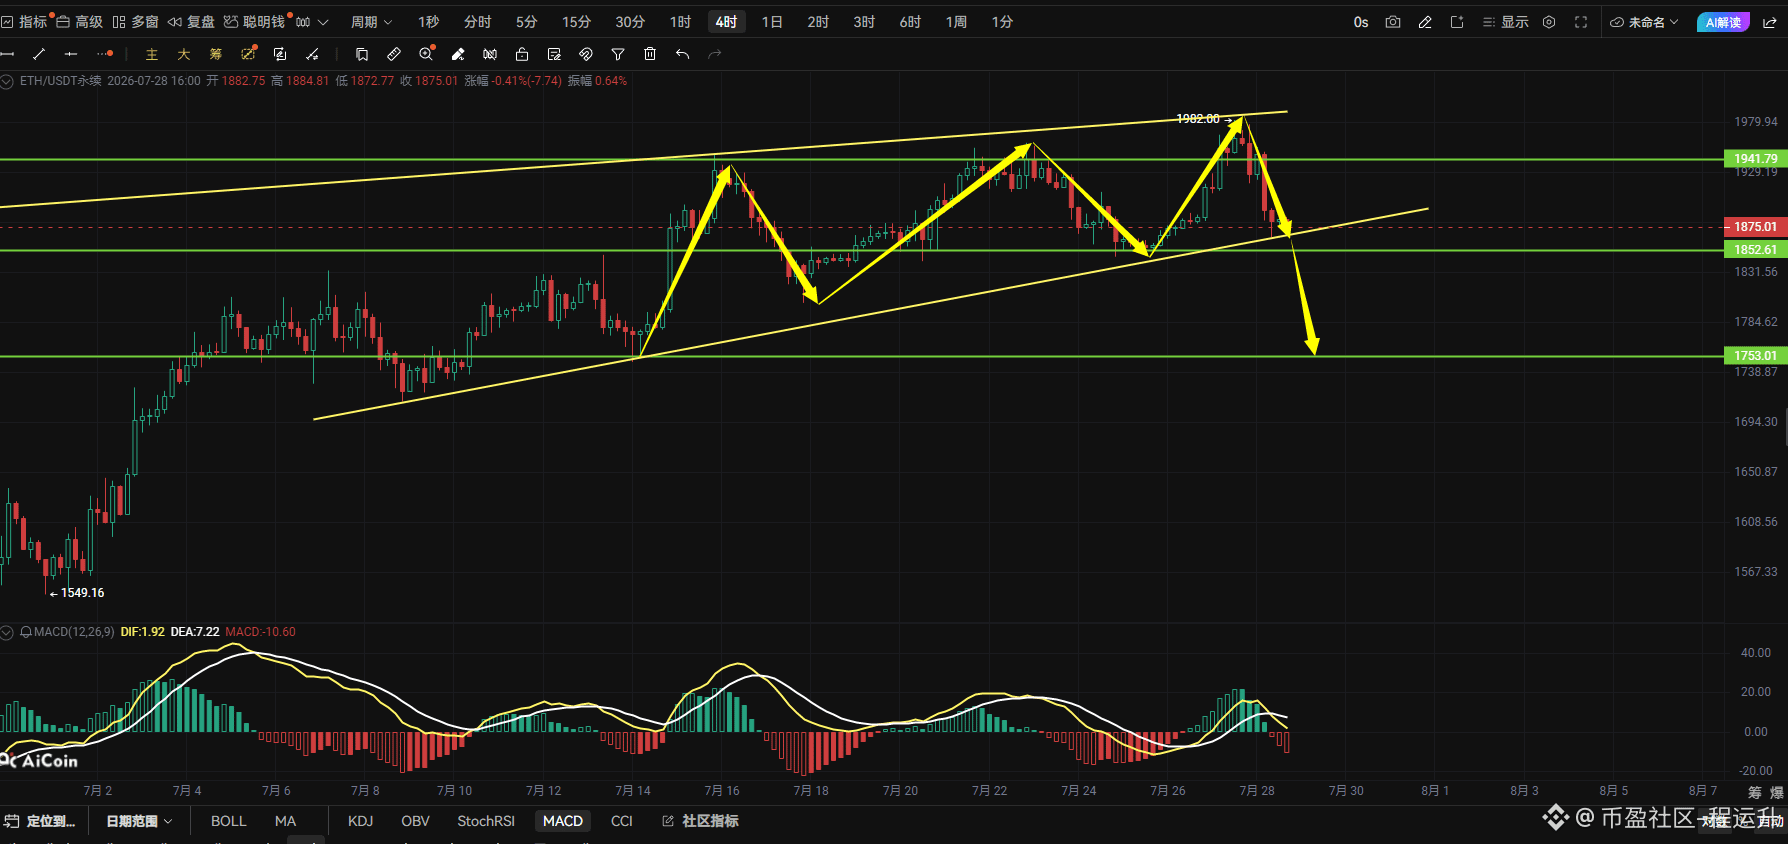
Ethereum’s overall trend is consistent with Bitcoin’s. It is expected to soon break down from the ascending triangle pattern. In the short term, after breaking below the 1,850 support level, it may drop to around 1,760.#BTC走势分析 #ETH走势分析 .
The MACD indicator is hovering around the zero line and shows bearish momentum. The red histogram bars have widened into negative territory, indicating that on the 4-hour timeframe, the bears are currently in control.
On the downside, the key support to watch is the horizontal support in the purple high-density trading area around 61,700. In terms of trading, it is recommended to focus on short positions. You can consider entering shorts around 64,000, aiming for 61,800. Set protection/stop-loss at 64,500.
Ethereum’s overall trend is consistent with Bitcoin’s. It is expected to soon break down from the ascending triangle pattern. In the short term, after breaking below the 1,850 support level, it may drop to around 1,760.#BTC走势分析 #ETH走势分析 .