
桀-1688
3.8k Posts

桀-1688
 Square Verified
Report
Block User
盯盘不追高,数据说人话。关注我,用数据拆行情,用白话讲市场。
High-Frequency Trader
9.1 Years
106 Following
11.3K+ Followers
2.4K+ Liked
Posts
·
--
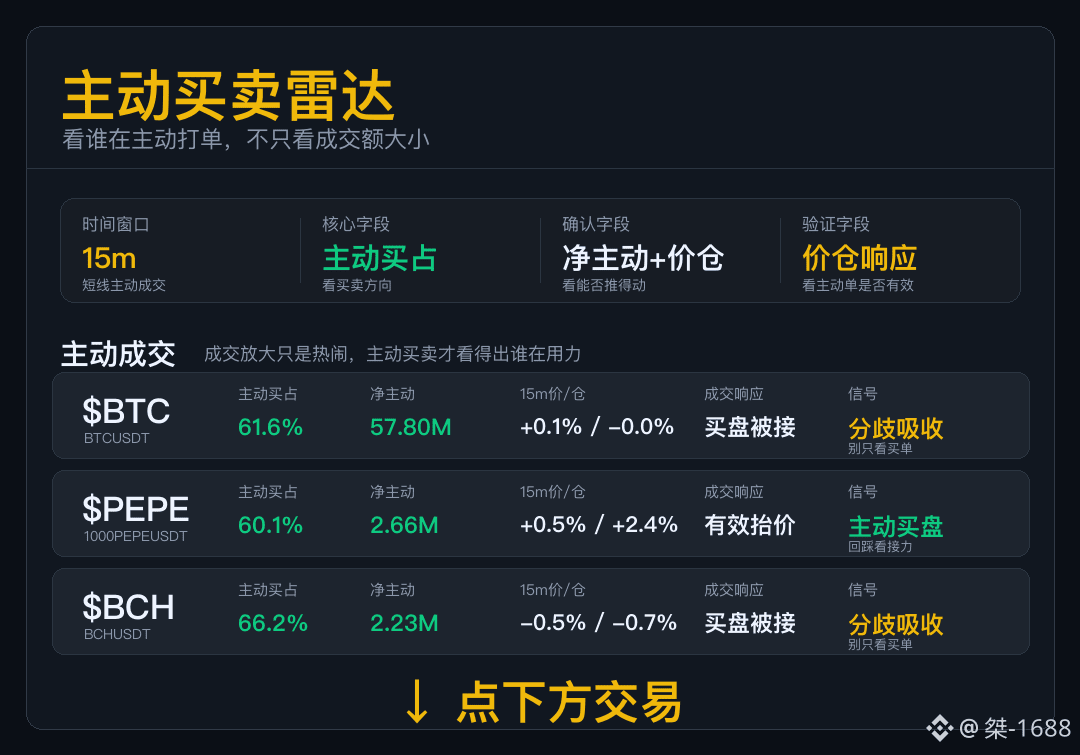
Active Trading Radar
Don’t just look at the trading volume. Today, we mainly want to see whether aggressive orders can push the order book.
$BTC : The buyer used buy-side volume but didn’t get any distance (price movement). The cost-effectiveness of continuing to chase higher is decreasing.
$PEPE : The active buy orders can push the price up, and the supply (price levels) also responds; next, we’ll watch whether the buy-side holds up when there’s a pullback.
$BCH : Buy order size is dominant, but the price is still moving sideways. The sell-side willingness to offer is more worth paying attention to.
The buy-side direction isn’t weak, but each coin has a different response. It’s cleaner to check order acceptance (liquidity/continuation) coin by coin.
Active Trading Radar
Don’t just look at the trading volume. Today, we mainly want to see whether aggressive orders can push the order book.
$BTC : The buyer used buy-side volume but didn’t get any distance (price movement). The cost-effectiveness of continuing to chase higher is decreasing.
$PEPE : The active buy orders can push the price up, and the supply (price levels) also responds; next, we’ll watch whether the buy-side holds up when there’s a pullback.
$BCH : Buy order size is dominant, but the price is still moving sideways. The sell-side willingness to offer is more worth paying attention to.
The buy-side direction isn’t weak, but each coin has a different response. It’s cleaner to check order acceptance (liquidity/continuation) coin by coin.
Don’t just look at the trading volume. Today, we mainly want to see whether aggressive orders can push the order book.
$BTC : The buyer used buy-side volume but didn’t get any distance (price movement). The cost-effectiveness of continuing to chase higher is decreasing.
$PEPE : The active buy orders can push the price up, and the supply (price levels) also responds; next, we’ll watch whether the buy-side holds up when there’s a pullback.
$BCH : Buy order size is dominant, but the price is still moving sideways. The sell-side willingness to offer is more worth paying attention to.
The buy-side direction isn’t weak, but each coin has a different response. It’s cleaner to check order acceptance (liquidity/continuation) coin by coin.
285
·
--
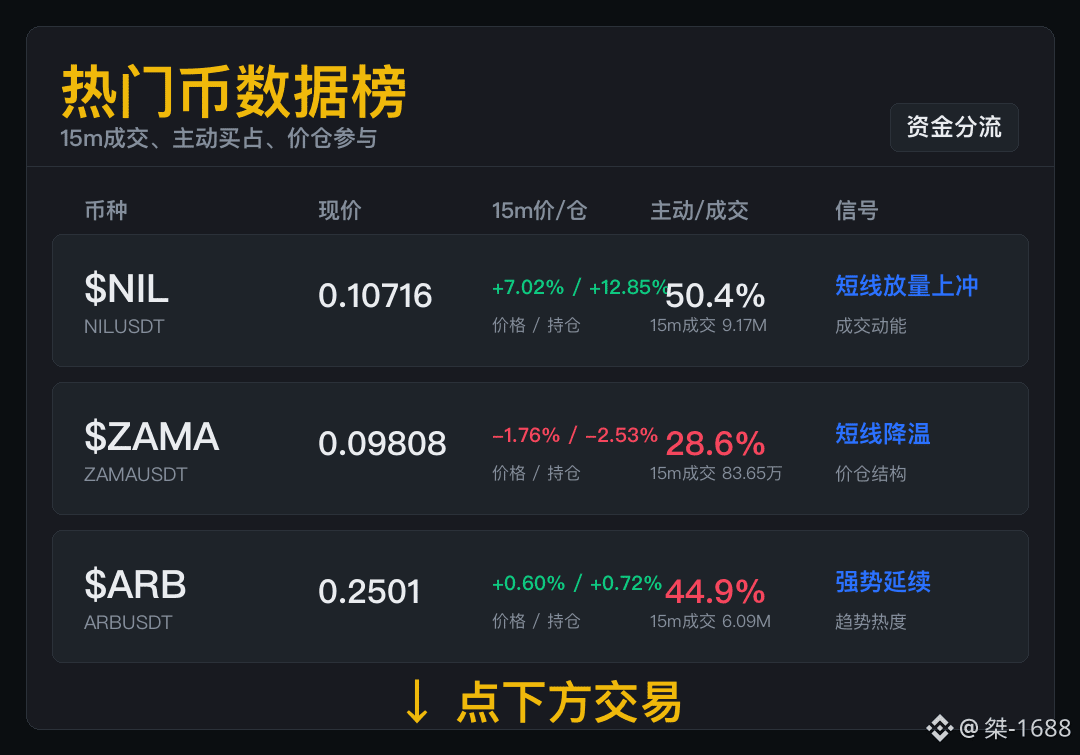
This isn’t a top-gainers leaderboard; it’s about pulling out the money trail first.
$NIL 15m成交 9.17M, price positioning +7.02% / +12.85%, and for the short term the level of participation matters more than simply looking at whether price is up or down. The crowd likes the drama—traders first check whether there are real trades behind the buzz. Being popular isn’t the answer, but popularity brings attention, and there may also be trading opportunities.
$ZAMA 15m成交 83.65万, price positioning -1.76% / -2.53%, and for the short term the level of participation matters more than simply looking at whether price is up or down. Don’t rush if you missed the move; once the heat cools down, you usually get a clearer position. What this market setup fears most is when you see it strong over the last 24h, then you chase—only to end up at the short-term pullback as momentum fades.
$ARB 15m成交 6.09M, price positioning +0.60% / +0.72%, and for the short term the level of participation matters more than simply looking at whether price is up or down. When it dips, there are people willing to take it; that’s healthier than continuously forcing a hard push. This kind of setup is driven by real participants—not some obscure coin randomly jumping on its own.
This isn’t a top-gainers leaderboard; it’s about pulling out the money trail first.
$NIL 15m成交 9.17M, price positioning +7.02% / +12.85%, and for the short term the level of participation matters more than simply looking at whether price is up or down. The crowd likes the drama—traders first check whether there are real trades behind the buzz. Being popular isn’t the answer, but popularity brings attention, and there may also be trading opportunities.
$ZAMA 15m成交 83.65万, price positioning -1.76% / -2.53%, and for the short term the level of participation matters more than simply looking at whether price is up or down. Don’t rush if you missed the move; once the heat cools down, you usually get a clearer position. What this market setup fears most is when you see it strong over the last 24h, then you chase—only to end up at the short-term pullback as momentum fades.
$ARB 15m成交 6.09M, price positioning +0.60% / +0.72%, and for the short term the level of participation matters more than simply looking at whether price is up or down. When it dips, there are people willing to take it; that’s healthier than continuously forcing a hard push. This kind of setup is driven by real participants—not some obscure coin randomly jumping on its own.
$NIL 15m成交 9.17M, price positioning +7.02% / +12.85%, and for the short term the level of participation matters more than simply looking at whether price is up or down. The crowd likes the drama—traders first check whether there are real trades behind the buzz. Being popular isn’t the answer, but popularity brings attention, and there may also be trading opportunities.
$ZAMA 15m成交 83.65万, price positioning -1.76% / -2.53%, and for the short term the level of participation matters more than simply looking at whether price is up or down. Don’t rush if you missed the move; once the heat cools down, you usually get a clearer position. What this market setup fears most is when you see it strong over the last 24h, then you chase—only to end up at the short-term pullback as momentum fades.
$ARB 15m成交 6.09M, price positioning +0.60% / +0.72%, and for the short term the level of participation matters more than simply looking at whether price is up or down. When it dips, there are people willing to take it; that’s healthier than continuously forcing a hard push. This kind of setup is driven by real participants—not some obscure coin randomly jumping on its own.
679
·
--
Morning Session Trader Radar
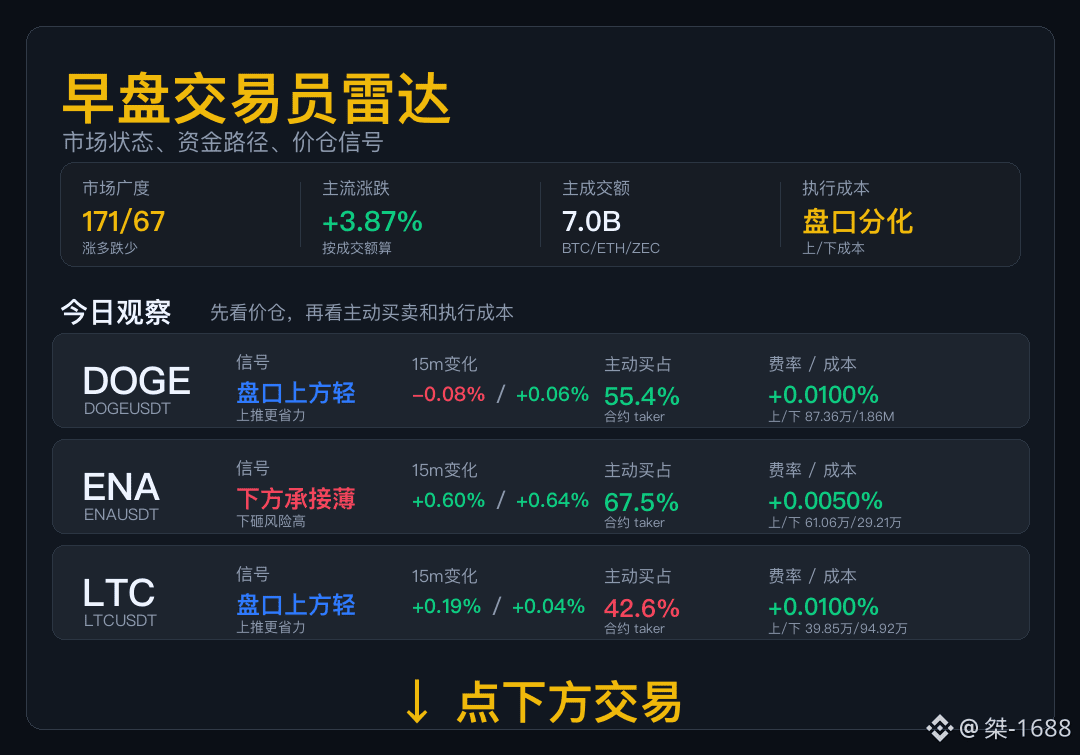
In the early hours, don’t chase the excitement—see whether the money is clustering in a few specific lines.
Market status: Binance USDT spot 171 up / 67 down. The majors are +3.87% overall, with total turnover around 7.0B. Market breadth is leaning strong—more gainers than losers. The major volume-weighted gain/loss is also above the zero line.
Capital path: This set isn’t about who looks hottest, but about who pushes up with the least effort and dumps with lower risk.
$DOGE The structural signal still isn’t firm enough—first see whether volume can keep following through. Don’t judge based on heat alone.
$ENA The follow-through below isn’t thick, and the 15m price/position is +0.60%/+0.64%. If it continues to weaken, don’t catch it just because it’s already down a lot.
$LTC The order book shows upside room, but what’s truly useful is continuous buy orders. If active buying—which is 42.6%—goes down, then downgrade it first.
Morning Session Trader Radar
In the early hours, don’t chase the excitement—see whether the money is clustering in a few specific lines.
Market status: Binance USDT spot 171 up / 67 down. The majors are +3.87% overall, with total turnover around 7.0B. Market breadth is leaning strong—more gainers than losers. The major volume-weighted gain/loss is also above the zero line.
Capital path: This set isn’t about who looks hottest, but about who pushes up with the least effort and dumps with lower risk.
$DOGE The structural signal still isn’t firm enough—first see whether volume can keep following through. Don’t judge based on heat alone.
$ENA The follow-through below isn’t thick, and the 15m price/position is +0.60%/+0.64%. If it continues to weaken, don’t catch it just because it’s already down a lot.
$LTC The order book shows upside room, but what’s truly useful is continuous buy orders. If active buying—which is 42.6%—goes down, then downgrade it first.
In the early hours, don’t chase the excitement—see whether the money is clustering in a few specific lines.
Market status: Binance USDT spot 171 up / 67 down. The majors are +3.87% overall, with total turnover around 7.0B. Market breadth is leaning strong—more gainers than losers. The major volume-weighted gain/loss is also above the zero line.
Capital path: This set isn’t about who looks hottest, but about who pushes up with the least effort and dumps with lower risk.
$DOGE The structural signal still isn’t firm enough—first see whether volume can keep following through. Don’t judge based on heat alone.
$ENA The follow-through below isn’t thick, and the 15m price/position is +0.60%/+0.64%. If it continues to weaken, don’t catch it just because it’s already down a lot.
$LTC The order book shows upside room, but what’s truly useful is continuous buy orders. If active buying—which is 42.6%—goes down, then downgrade it first.
73
·
--
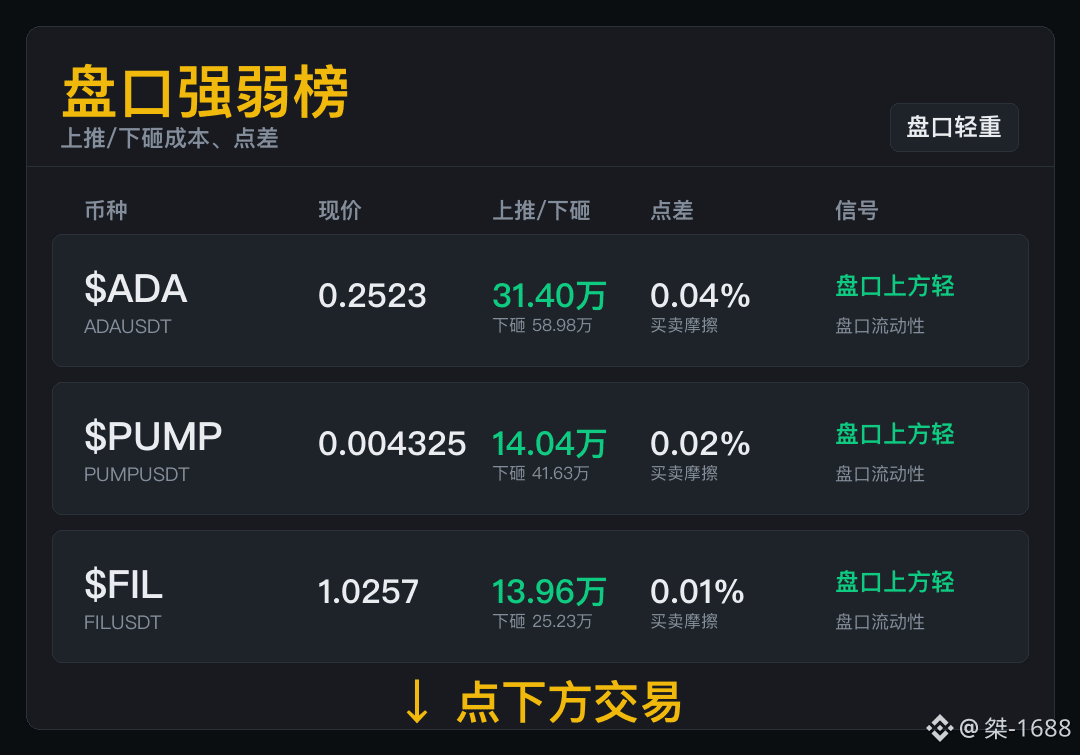
No need to tell a story about the order book—thin and thick liquidity already have the risk written into it.
On <$ADA >, prices push up 0.3140 million and get slammed down 0.5898 million, with a spread of 0.04%. The thinness above is just the road conditions; whether you can drive through depends on whether the buy side follows through. If you want to participate, first look at the aggressive buy orders. If the book is thin but there’s no buy pressure, it’s easy to make a wasted trip.
For <$PUMP >, the order-book conditions to check are three items: push up 0.1404 million, slam down 0.4163 million, and a spread of 0.02%. Those who are already in position should look for a pullback and get “caught” there—only then does the advantage of that order-book level become real. If the spread doesn’t widen and the trades keep coming continuously, that’s when you know people are truly walking this path.
For <$FIL >, the order-book conditions to check are three items: push up 0.1396 million, slam down 0.2523 million, and a spread of 0.01%. Missing the first move doesn’t matter—what matters more is the trading during the second leg. Light pressure overhead is just a condition; aggressive trading is the result.
No need to tell a story about the order book—thin and thick liquidity already have the risk written into it.
On <$ADA >, prices push up 0.3140 million and get slammed down 0.5898 million, with a spread of 0.04%. The thinness above is just the road conditions; whether you can drive through depends on whether the buy side follows through. If you want to participate, first look at the aggressive buy orders. If the book is thin but there’s no buy pressure, it’s easy to make a wasted trip.
For <$PUMP >, the order-book conditions to check are three items: push up 0.1404 million, slam down 0.4163 million, and a spread of 0.02%. Those who are already in position should look for a pullback and get “caught” there—only then does the advantage of that order-book level become real. If the spread doesn’t widen and the trades keep coming continuously, that’s when you know people are truly walking this path.
For <$FIL >, the order-book conditions to check are three items: push up 0.1396 million, slam down 0.2523 million, and a spread of 0.01%. Missing the first move doesn’t matter—what matters more is the trading during the second leg. Light pressure overhead is just a condition; aggressive trading is the result.
On <$ADA >, prices push up 0.3140 million and get slammed down 0.5898 million, with a spread of 0.04%. The thinness above is just the road conditions; whether you can drive through depends on whether the buy side follows through. If you want to participate, first look at the aggressive buy orders. If the book is thin but there’s no buy pressure, it’s easy to make a wasted trip.
For <$PUMP >, the order-book conditions to check are three items: push up 0.1404 million, slam down 0.4163 million, and a spread of 0.02%. Those who are already in position should look for a pullback and get “caught” there—only then does the advantage of that order-book level become real. If the spread doesn’t widen and the trades keep coming continuously, that’s when you know people are truly walking this path.
For <$FIL >, the order-book conditions to check are three items: push up 0.1396 million, slam down 0.2523 million, and a spread of 0.01%. Missing the first move doesn’t matter—what matters more is the trading during the second leg. Light pressure overhead is just a condition; aggressive trading is the result.
714
·
--
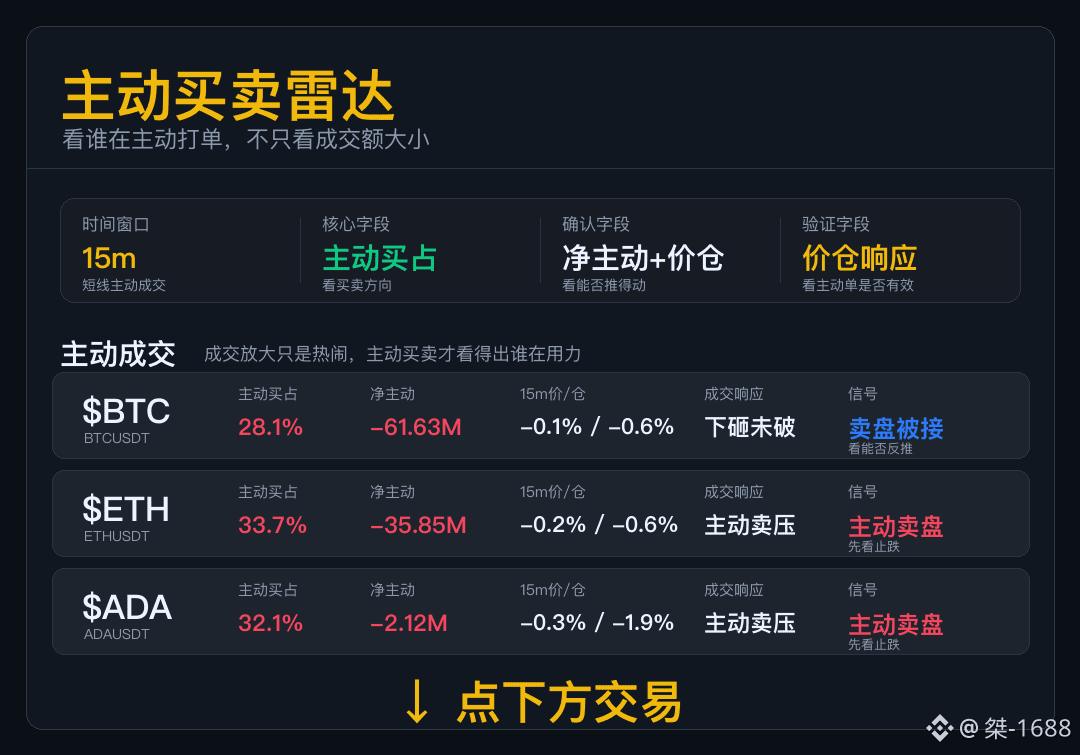
Active Buy/Sell Radar
Don’t just look at the trading volume—today, this set mainly checks whether the active orders can push the market.
$BTC has an advantage in active sell orders, yet the price hasn’t been pushed down; passive buy orders below are absorbing the sell pressure.
$ETH ’s sell orders aren’t just sitting there to scare people—they’ve already been executed into the trades. First, watch when the buy side comes back.
$ADA ’s active sell pressure has already been打出. If you want a rebound, you’ll first need to see the buy side retake the momentum.
The sellers are putting in effort, but the support varies from coin to coin—don’t read one table as only one direction.
Active Buy/Sell Radar
Don’t just look at the trading volume—today, this set mainly checks whether the active orders can push the market.
$BTC has an advantage in active sell orders, yet the price hasn’t been pushed down; passive buy orders below are absorbing the sell pressure.
$ETH ’s sell orders aren’t just sitting there to scare people—they’ve already been executed into the trades. First, watch when the buy side comes back.
$ADA ’s active sell pressure has already been打出. If you want a rebound, you’ll first need to see the buy side retake the momentum.
The sellers are putting in effort, but the support varies from coin to coin—don’t read one table as only one direction.
Don’t just look at the trading volume—today, this set mainly checks whether the active orders can push the market.
$BTC has an advantage in active sell orders, yet the price hasn’t been pushed down; passive buy orders below are absorbing the sell pressure.
$ETH ’s sell orders aren’t just sitting there to scare people—they’ve already been executed into the trades. First, watch when the buy side comes back.
$ADA ’s active sell pressure has already been打出. If you want a rebound, you’ll first need to see the buy side retake the momentum.
The sellers are putting in effort, but the support varies from coin to coin—don’t read one table as only one direction.
105
·
--
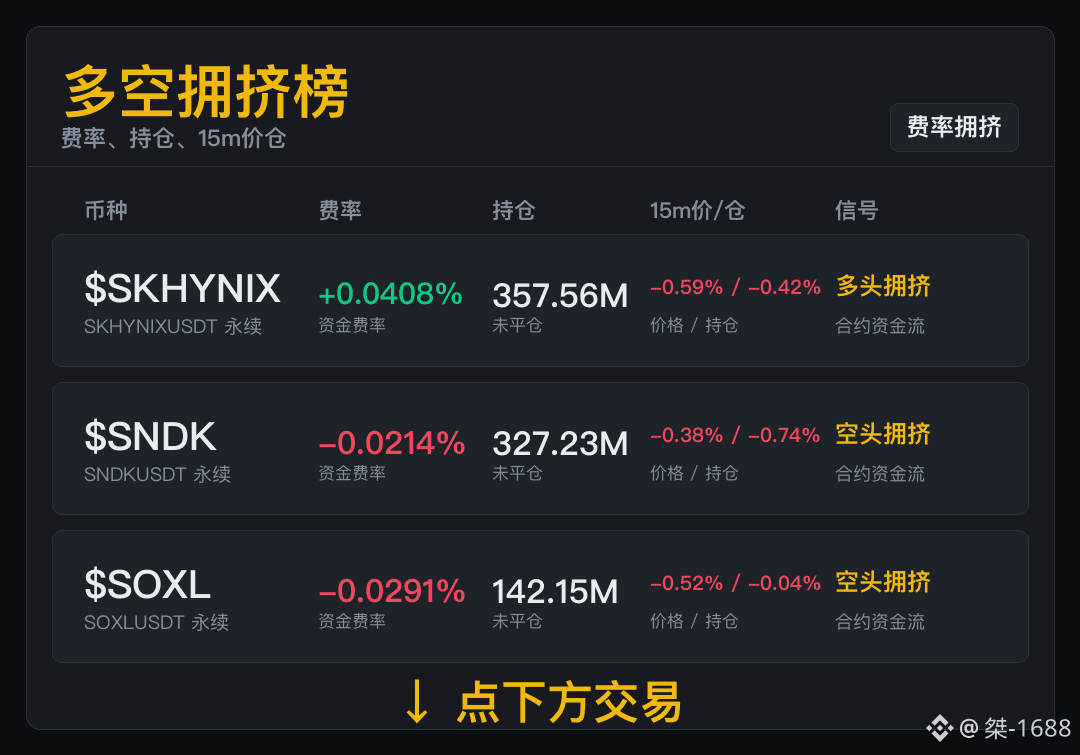
Is the long/short market hot? The fee rate will show up first.
$SKHYNIX fee rate +0.0408%, positions 357.56M, 15m price position -0.59% / -0.42%. If you want to go long, first cool down the heat—when the fee rate is hot, it’s easiest to get “educated.” Everyone is crowded on the long side, so the order book is more likely to wash out the impatient sellers first.
$SNDK fee rate -0.0214% in line with positions 327.23M. In this case, the key is whether the position size continues to build. For those chasing shorts, first see if it can still break; if it can’t break, don’t hard-battle against your own cost basis. This isn’t to say a reversal happens right away—the short side isn’t as comfortable anymore.
$SOXL when things get crowded, look at three things: fee rate -0.0291%, positions 142.15M, 15m price position -0.52% / -0.04%. If you want to catch a rebound, first look at volume. The first drop-stopping only means the sell pressure has slowed. A negative fee rate is the short side’s bill—the longer it lingers, the more uncomfortable it becomes.
Is the long/short market hot? The fee rate will show up first.
$SKHYNIX fee rate +0.0408%, positions 357.56M, 15m price position -0.59% / -0.42%. If you want to go long, first cool down the heat—when the fee rate is hot, it’s easiest to get “educated.” Everyone is crowded on the long side, so the order book is more likely to wash out the impatient sellers first.
$SNDK fee rate -0.0214% in line with positions 327.23M. In this case, the key is whether the position size continues to build. For those chasing shorts, first see if it can still break; if it can’t break, don’t hard-battle against your own cost basis. This isn’t to say a reversal happens right away—the short side isn’t as comfortable anymore.
$SOXL when things get crowded, look at three things: fee rate -0.0291%, positions 142.15M, 15m price position -0.52% / -0.04%. If you want to catch a rebound, first look at volume. The first drop-stopping only means the sell pressure has slowed. A negative fee rate is the short side’s bill—the longer it lingers, the more uncomfortable it becomes.
$SKHYNIX fee rate +0.0408%, positions 357.56M, 15m price position -0.59% / -0.42%. If you want to go long, first cool down the heat—when the fee rate is hot, it’s easiest to get “educated.” Everyone is crowded on the long side, so the order book is more likely to wash out the impatient sellers first.
$SNDK fee rate -0.0214% in line with positions 327.23M. In this case, the key is whether the position size continues to build. For those chasing shorts, first see if it can still break; if it can’t break, don’t hard-battle against your own cost basis. This isn’t to say a reversal happens right away—the short side isn’t as comfortable anymore.
$SOXL when things get crowded, look at three things: fee rate -0.0291%, positions 142.15M, 15m price position -0.52% / -0.04%. If you want to catch a rebound, first look at volume. The first drop-stopping only means the sell pressure has slowed. A negative fee rate is the short side’s bill—the longer it lingers, the more uncomfortable it becomes.
770
·
--
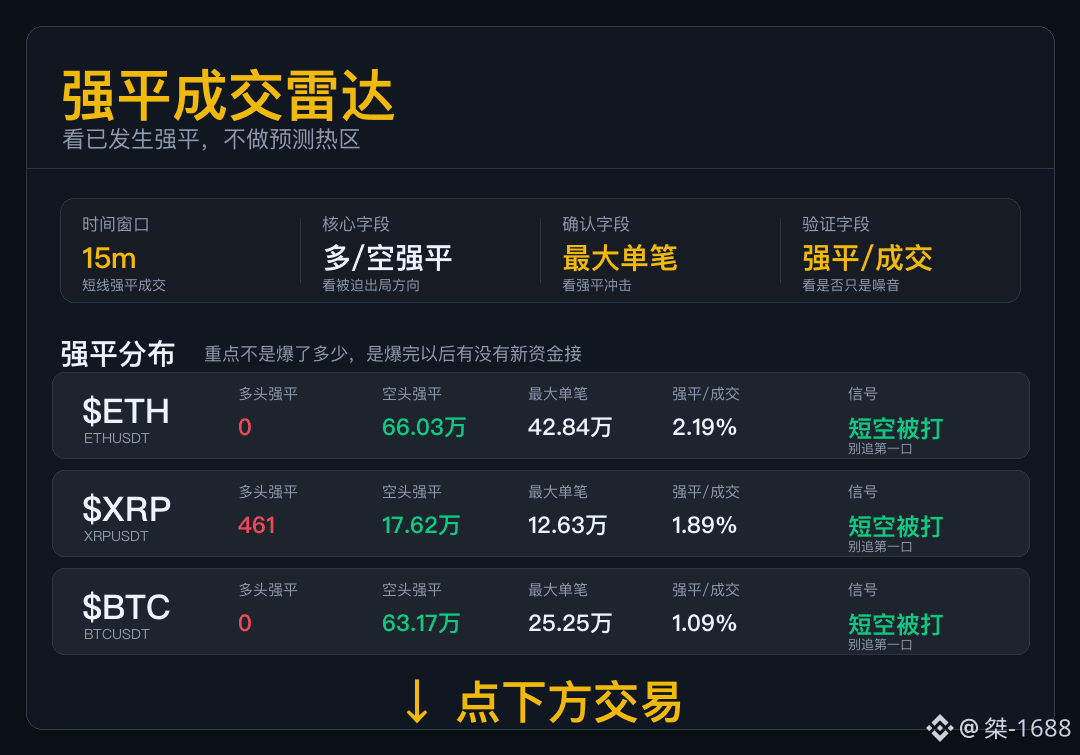
Strong liquidation and position-forced radar
For data like “strong liquidation/forced covering,” first look at who is being pushed out.
$ETH 15m The short liquidation is clearly higher than the long side—leveraged short positions are being forced to buy back.
$XRP The short liquidation amount has the upper hand, and the covering orders have already become part of the trades in this interval.
$BTC This segment is mainly shorts passively covering—don’t mistake the squeezed-out speed directly as a trend.
After liquidation ends, there may still be active buy orders; only then can the price continue to be pushed higher.
Strong liquidation and position-forced radar
For data like “strong liquidation/forced covering,” first look at who is being pushed out.
$ETH 15m The short liquidation is clearly higher than the long side—leveraged short positions are being forced to buy back.
$XRP The short liquidation amount has the upper hand, and the covering orders have already become part of the trades in this interval.
$BTC This segment is mainly shorts passively covering—don’t mistake the squeezed-out speed directly as a trend.
After liquidation ends, there may still be active buy orders; only then can the price continue to be pushed higher.
For data like “strong liquidation/forced covering,” first look at who is being pushed out.
$ETH 15m The short liquidation is clearly higher than the long side—leveraged short positions are being forced to buy back.
$XRP The short liquidation amount has the upper hand, and the covering orders have already become part of the trades in this interval.
$BTC This segment is mainly shorts passively covering—don’t mistake the squeezed-out speed directly as a trend.
After liquidation ends, there may still be active buy orders; only then can the price continue to be pushed higher.
483
·
--
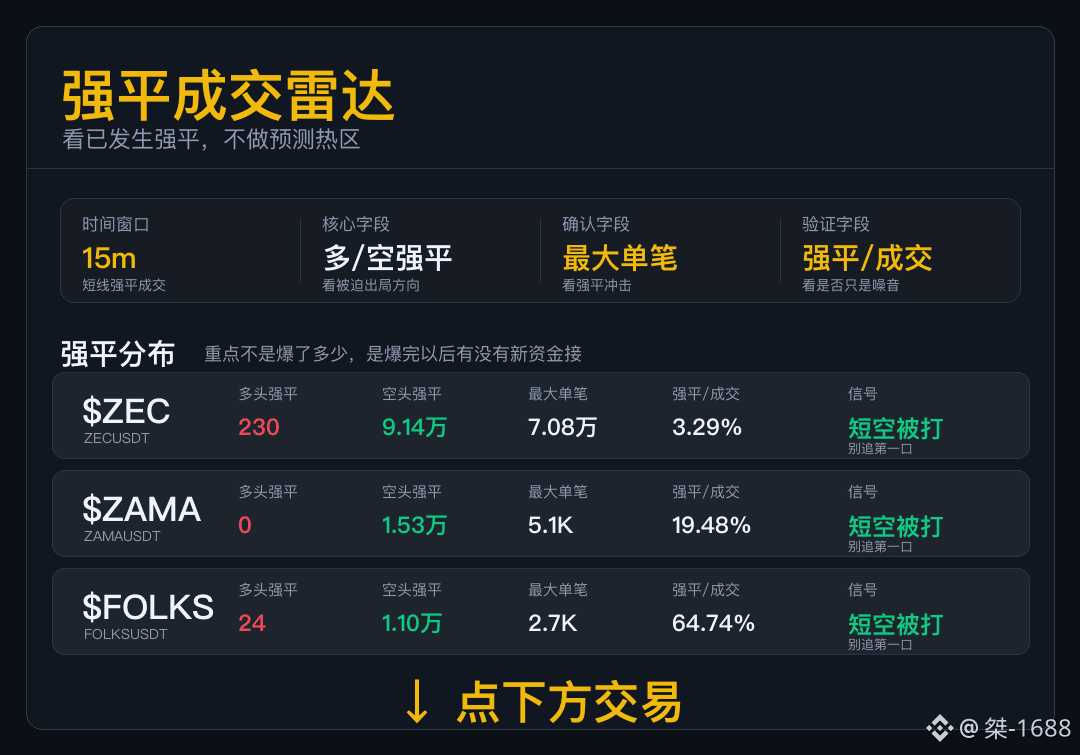
Strong liquidation and forced covering radar
For data like “strong liquidation”, first look at who is being forced out.
$ZEC : Short-sellers’ forced liquidation amount is in the lead, and covering orders have become part of the trading volume for this segment.
$ZAMA : Forced short-seller liquidation provided fuel for the rebound, but the real continuation depends on whether subsequent trading picks up and connects.
$FOLKS : There is more forced liquidation by short-sellers; it feels more like short positions being knocked and forced out. Don’t rush to chase the first move—only if the pullback can hold does it indicate that someone continues to take over.
Forced short-covering boosted the pace; if there’s no follow-through later, it’s easy for the rally to exhaust and then fall back.
Strong liquidation and forced covering radar
For data like “strong liquidation”, first look at who is being forced out.
$ZEC : Short-sellers’ forced liquidation amount is in the lead, and covering orders have become part of the trading volume for this segment.
$ZAMA : Forced short-seller liquidation provided fuel for the rebound, but the real continuation depends on whether subsequent trading picks up and connects.
$FOLKS : There is more forced liquidation by short-sellers; it feels more like short positions being knocked and forced out. Don’t rush to chase the first move—only if the pullback can hold does it indicate that someone continues to take over.
Forced short-covering boosted the pace; if there’s no follow-through later, it’s easy for the rally to exhaust and then fall back.
For data like “strong liquidation”, first look at who is being forced out.
$ZEC : Short-sellers’ forced liquidation amount is in the lead, and covering orders have become part of the trading volume for this segment.
$ZAMA : Forced short-seller liquidation provided fuel for the rebound, but the real continuation depends on whether subsequent trading picks up and connects.
$FOLKS : There is more forced liquidation by short-sellers; it feels more like short positions being knocked and forced out. Don’t rush to chase the first move—only if the pullback can hold does it indicate that someone continues to take over.
Forced short-covering boosted the pace; if there’s no follow-through later, it’s easy for the rally to exhaust and then fall back.
727
·
--
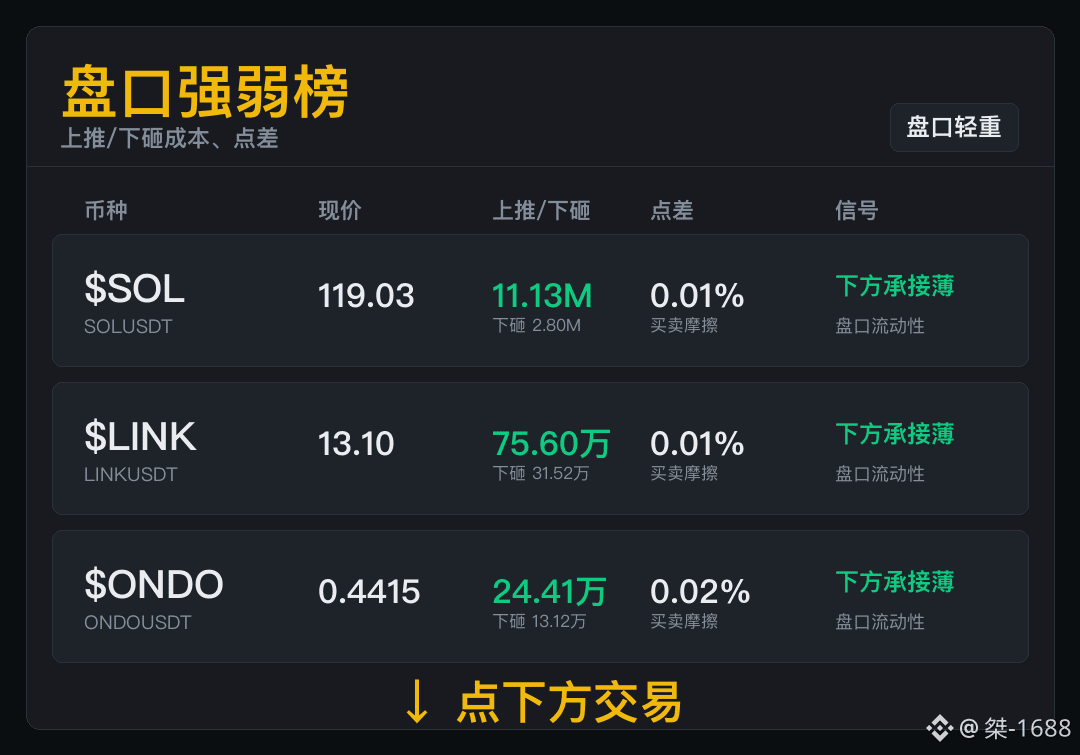
Can the price move? The order book leaks first.
$SOL pushed up 11.13M and smashed down 2.80M, with a spread of 0.01%. Don’t get too excited, short sellers either—thin order books often pull in both directions. Below isn’t that solid; don’t just look at the surface excitement.
$LINK , looking at the order book conditions in three aspects: push up 0.7560M, smash down 0.3152M, and a spread of 0.01%. When the book is thin on the bottom, the worst fear is that you still think you can stop-loss calmly. For this kind of market, if you trade it, do it lightly—don’t pretend you can hold up.
$ONDO spot traded 32.22M; the cost of push up / smash down is 0.2441M / 0.1312M. In a market with limited exit routes, having a smaller position is the advantage. It can still rise, but with narrow exit routes, don’t act like you’re brave with your position size.
Can the price move? The order book leaks first.
$SOL pushed up 11.13M and smashed down 2.80M, with a spread of 0.01%. Don’t get too excited, short sellers either—thin order books often pull in both directions. Below isn’t that solid; don’t just look at the surface excitement.
$LINK , looking at the order book conditions in three aspects: push up 0.7560M, smash down 0.3152M, and a spread of 0.01%. When the book is thin on the bottom, the worst fear is that you still think you can stop-loss calmly. For this kind of market, if you trade it, do it lightly—don’t pretend you can hold up.
$ONDO spot traded 32.22M; the cost of push up / smash down is 0.2441M / 0.1312M. In a market with limited exit routes, having a smaller position is the advantage. It can still rise, but with narrow exit routes, don’t act like you’re brave with your position size.
$SOL pushed up 11.13M and smashed down 2.80M, with a spread of 0.01%. Don’t get too excited, short sellers either—thin order books often pull in both directions. Below isn’t that solid; don’t just look at the surface excitement.
$LINK , looking at the order book conditions in three aspects: push up 0.7560M, smash down 0.3152M, and a spread of 0.01%. When the book is thin on the bottom, the worst fear is that you still think you can stop-loss calmly. For this kind of market, if you trade it, do it lightly—don’t pretend you can hold up.
$ONDO spot traded 32.22M; the cost of push up / smash down is 0.2441M / 0.1312M. In a market with limited exit routes, having a smaller position is the advantage. It can still rise, but with narrow exit routes, don’t act like you’re brave with your position size.
1
601
·
--
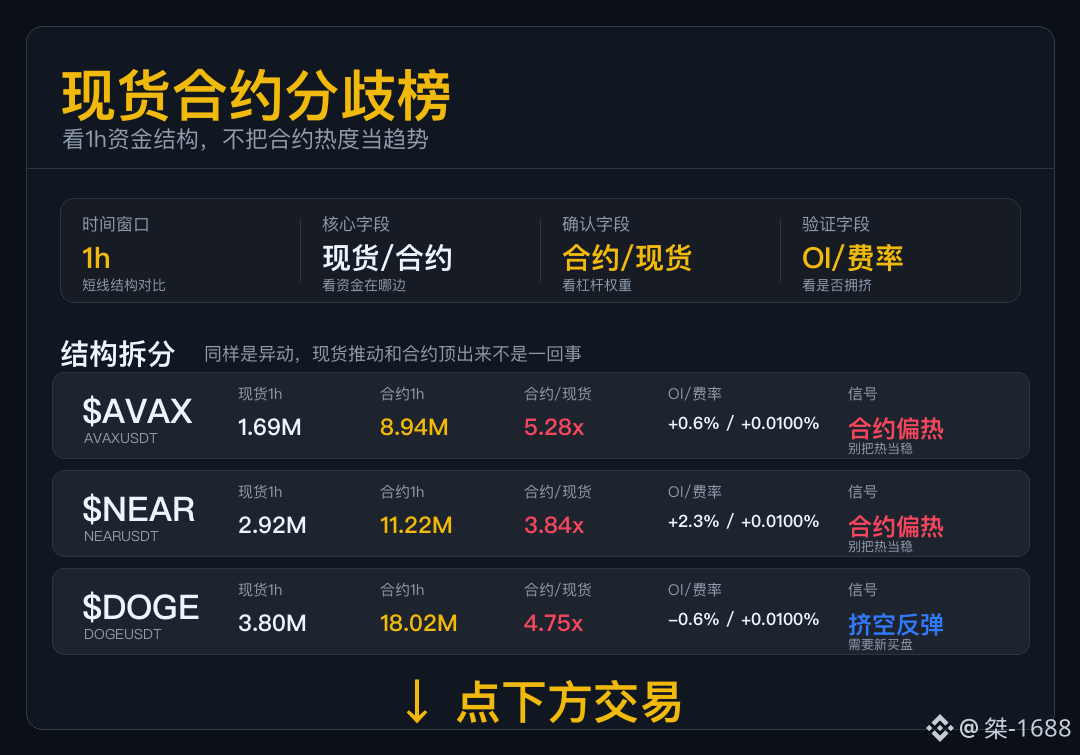
Spot Contract Divergence Leaderboard
In the last 1 hour, first break down the funding sources: is it spot that’s keeping up, or are contracts fighting for the pace?
$AVAX : the contract side is hotter, with a heavier leveraged feel. This setup can surge, but it’s not suitable to chase purely based on upside %; adding spot volume is more critical.
$NEAR : contract trading volume first expands, so the order book will be more sensitive. If spot doesn’t add volume, the experience of chasing higher prices will be poor.
$DOGE : the short side retreat helps explain this speed, but to keep moving, it still depends on whether spot and new positions add volume.
Leveraged trading moves fast, but differentiation also happens fast—don’t treat every symbol as the same kind of strength.
Spot Contract Divergence Leaderboard
In the last 1 hour, first break down the funding sources: is it spot that’s keeping up, or are contracts fighting for the pace?
$AVAX : the contract side is hotter, with a heavier leveraged feel. This setup can surge, but it’s not suitable to chase purely based on upside %; adding spot volume is more critical.
$NEAR : contract trading volume first expands, so the order book will be more sensitive. If spot doesn’t add volume, the experience of chasing higher prices will be poor.
$DOGE : the short side retreat helps explain this speed, but to keep moving, it still depends on whether spot and new positions add volume.
Leveraged trading moves fast, but differentiation also happens fast—don’t treat every symbol as the same kind of strength.
In the last 1 hour, first break down the funding sources: is it spot that’s keeping up, or are contracts fighting for the pace?
$AVAX : the contract side is hotter, with a heavier leveraged feel. This setup can surge, but it’s not suitable to chase purely based on upside %; adding spot volume is more critical.
$NEAR : contract trading volume first expands, so the order book will be more sensitive. If spot doesn’t add volume, the experience of chasing higher prices will be poor.
$DOGE : the short side retreat helps explain this speed, but to keep moving, it still depends on whether spot and new positions add volume.
Leveraged trading moves fast, but differentiation also happens fast—don’t treat every symbol as the same kind of strength.
564
·
--
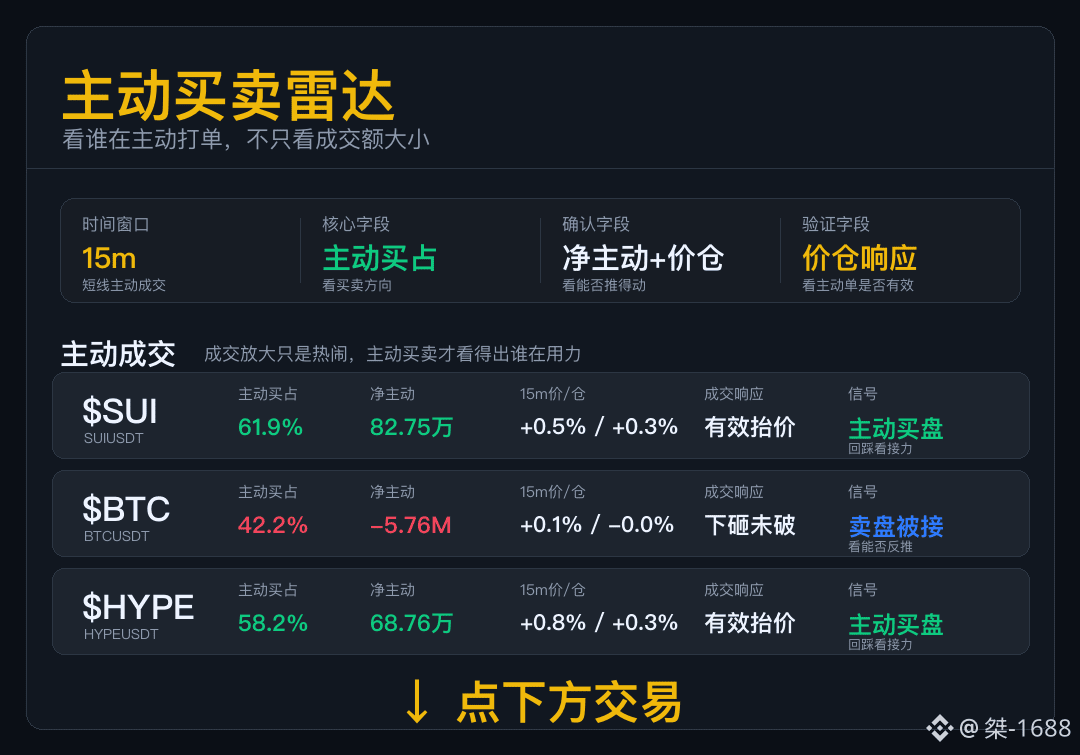
Active Buy/Sell Radar
Don’t just look at trading volume/turnover—today this set mainly focuses on whether the active orders can push the price action.
$SUI : Active buys have the upper hand. The price and order book position don’t show any obvious divergence. Next, watch for a secondary surge in volume—not the first burst of momentum.
$BTC : After the sell pressure was pushed out, it didn’t continue to break. That suggests the buy-side support is still there. When chasing shorts in this kind of tape, be careful about a rebound.
$HYPE : The active buy side is dominant, and the price responds positively. In this segment, the efficiency of pushing price is relatively high.
This set isn’t the same script—coin by coin, watch who can push the market price, and who gets absorbed/supported.
Active Buy/Sell Radar
Don’t just look at trading volume/turnover—today this set mainly focuses on whether the active orders can push the price action.
$SUI : Active buys have the upper hand. The price and order book position don’t show any obvious divergence. Next, watch for a secondary surge in volume—not the first burst of momentum.
$BTC : After the sell pressure was pushed out, it didn’t continue to break. That suggests the buy-side support is still there. When chasing shorts in this kind of tape, be careful about a rebound.
$HYPE : The active buy side is dominant, and the price responds positively. In this segment, the efficiency of pushing price is relatively high.
This set isn’t the same script—coin by coin, watch who can push the market price, and who gets absorbed/supported.
Don’t just look at trading volume/turnover—today this set mainly focuses on whether the active orders can push the price action.
$SUI : Active buys have the upper hand. The price and order book position don’t show any obvious divergence. Next, watch for a secondary surge in volume—not the first burst of momentum.
$BTC : After the sell pressure was pushed out, it didn’t continue to break. That suggests the buy-side support is still there. When chasing shorts in this kind of tape, be careful about a rebound.
$HYPE : The active buy side is dominant, and the price responds positively. In this segment, the efficiency of pushing price is relatively high.
This set isn’t the same script—coin by coin, watch who can push the market price, and who gets absorbed/supported.
436
·
--
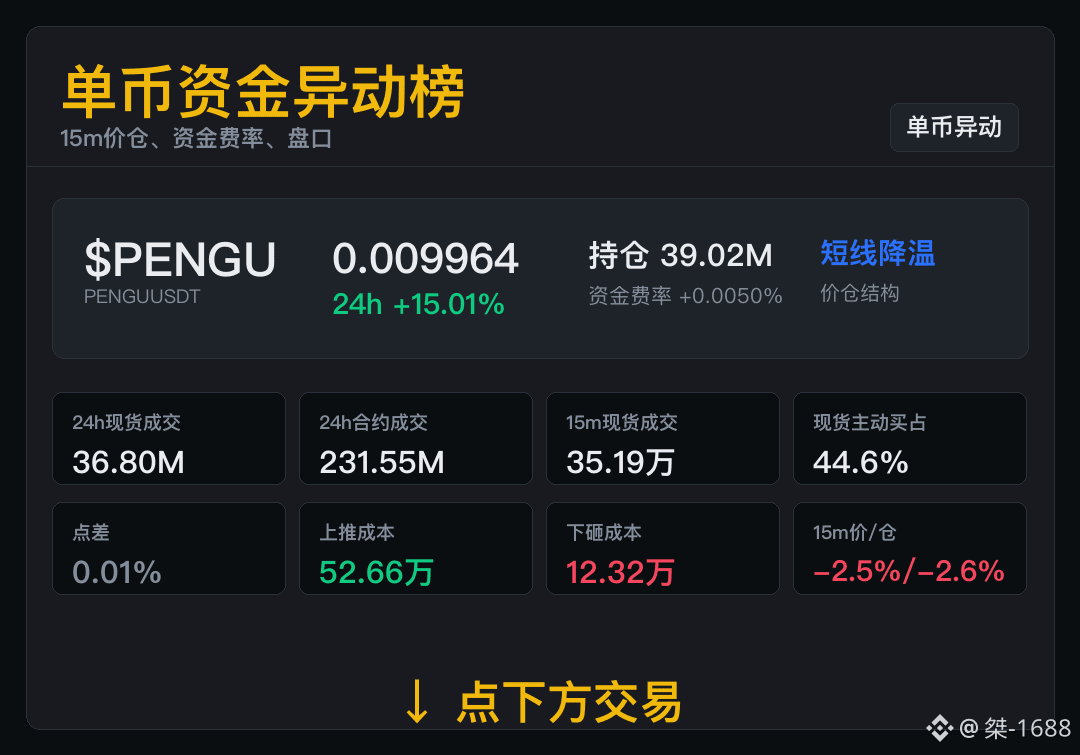
$PENGU price warehouse synchronization downward; in the next round, first see whether trading volume can recover.
15m price -2.52%, 15m open positions -2.57%; spot trading 36.80M, futures trading 231.55M.
Open interest and price are both decreasing, and short-term games are cooling down.
Going forward, focus on whether trading volume rebounds; if volume and momentum do not recover, maintain a downgrade.
$PENGU price warehouse synchronization downward; in the next round, first see whether trading volume can recover.
15m price -2.52%, 15m open positions -2.57%; spot trading 36.80M, futures trading 231.55M.
Open interest and price are both decreasing, and short-term games are cooling down.
Going forward, focus on whether trading volume rebounds; if volume and momentum do not recover, maintain a downgrade.
15m price -2.52%, 15m open positions -2.57%; spot trading 36.80M, futures trading 231.55M.
Open interest and price are both decreasing, and short-term games are cooling down.
Going forward, focus on whether trading volume rebounds; if volume and momentum do not recover, maintain a downgrade.
207
·
--
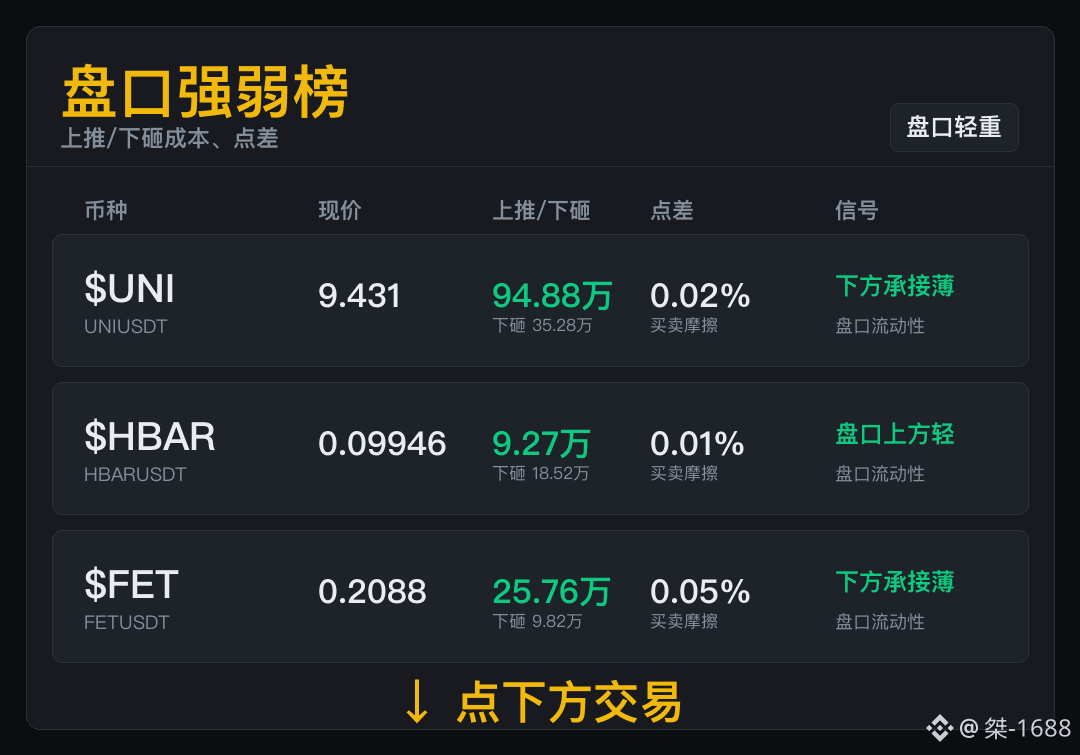
When the order book thickness changes, the trading difficulty changes.
For $UNI , assess the three aspects of the order book conditions: pushing up at 940,000, selling down at 352,800, and a spread of 0.02%. If you’re going long, think about your stop-loss first—don’t wait until the price starts dropping to panic. Thin liquidity isn’t meant to scare you; it’s a reminder not to treat drawdowns as a small matter.
For $HBAR , the spread is 0.01%. The push-up cost is 92,700. First, see whether the成交 (trades) can be picked up. If you want to get involved, wait for a pullback and how the market reacts—don’t just watch that one moment of a breakout. Being “easier to push up” just means the execution cost is low; whether it can stay stable still depends on whether the pullback has volume to absorb it.
For $FET , spot trading volume is 23.54M. The push-up / sell-down costs are 257,600 / 98,200. Before chasing higher, check whether the lower levels’ trading can hold. If it can’t, the drawdown will look worse than what the chart shows. “Thinness below” isn’t a story—it means your exit cost will look even uglier.
When the order book thickness changes, the trading difficulty changes.
For $UNI , assess the three aspects of the order book conditions: pushing up at 940,000, selling down at 352,800, and a spread of 0.02%. If you’re going long, think about your stop-loss first—don’t wait until the price starts dropping to panic. Thin liquidity isn’t meant to scare you; it’s a reminder not to treat drawdowns as a small matter.
For $HBAR , the spread is 0.01%. The push-up cost is 92,700. First, see whether the成交 (trades) can be picked up. If you want to get involved, wait for a pullback and how the market reacts—don’t just watch that one moment of a breakout. Being “easier to push up” just means the execution cost is low; whether it can stay stable still depends on whether the pullback has volume to absorb it.
For $FET , spot trading volume is 23.54M. The push-up / sell-down costs are 257,600 / 98,200. Before chasing higher, check whether the lower levels’ trading can hold. If it can’t, the drawdown will look worse than what the chart shows. “Thinness below” isn’t a story—it means your exit cost will look even uglier.
For $UNI , assess the three aspects of the order book conditions: pushing up at 940,000, selling down at 352,800, and a spread of 0.02%. If you’re going long, think about your stop-loss first—don’t wait until the price starts dropping to panic. Thin liquidity isn’t meant to scare you; it’s a reminder not to treat drawdowns as a small matter.
For $HBAR , the spread is 0.01%. The push-up cost is 92,700. First, see whether the成交 (trades) can be picked up. If you want to get involved, wait for a pullback and how the market reacts—don’t just watch that one moment of a breakout. Being “easier to push up” just means the execution cost is low; whether it can stay stable still depends on whether the pullback has volume to absorb it.
For $FET , spot trading volume is 23.54M. The push-up / sell-down costs are 257,600 / 98,200. Before chasing higher, check whether the lower levels’ trading can hold. If it can’t, the drawdown will look worse than what the chart shows. “Thinness below” isn’t a story—it means your exit cost will look even uglier.
508
·
--
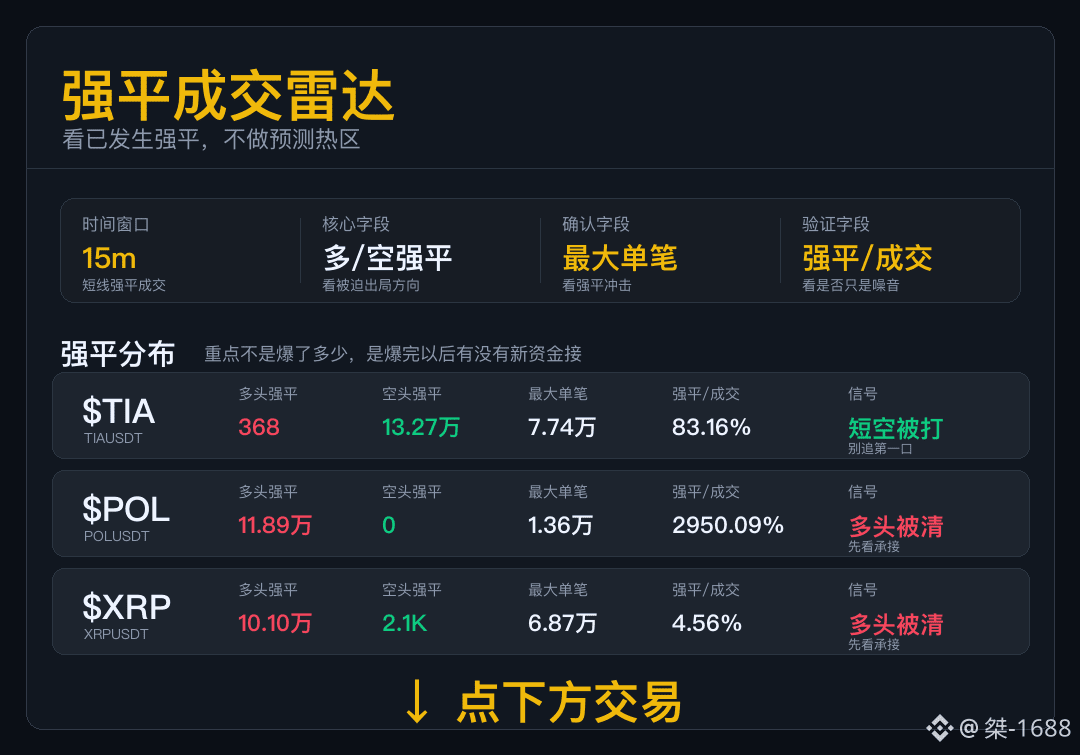
Strong Guoqing Intersect Radar
For data like this, first see who is being forced out.
$TIA short sellers have been squeezed into a tighter group; momentum/velocity is already there. Next, watch whether the pullback is supported by funds.
$POL long liquidation indicates that leverage was washed out in an earlier round. Whether it can stabilize depends on the follow-through after the liquidation.
When long liquidation is led by $XRP , don’t rush to buy the first time. First, after everything is cleared, see who comes in to take over.
Some longs are liquidated, and some shorts are squeezed—don’t combine them into a single market direction.
Strong Guoqing Intersect Radar
For data like this, first see who is being forced out.
$TIA short sellers have been squeezed into a tighter group; momentum/velocity is already there. Next, watch whether the pullback is supported by funds.
$POL long liquidation indicates that leverage was washed out in an earlier round. Whether it can stabilize depends on the follow-through after the liquidation.
When long liquidation is led by $XRP , don’t rush to buy the first time. First, after everything is cleared, see who comes in to take over.
Some longs are liquidated, and some shorts are squeezed—don’t combine them into a single market direction.
For data like this, first see who is being forced out.
$TIA short sellers have been squeezed into a tighter group; momentum/velocity is already there. Next, watch whether the pullback is supported by funds.
$POL long liquidation indicates that leverage was washed out in an earlier round. Whether it can stabilize depends on the follow-through after the liquidation.
When long liquidation is led by $XRP , don’t rush to buy the first time. First, after everything is cleared, see who comes in to take over.
Some longs are liquidated, and some shorts are squeezed—don’t combine them into a single market direction.
486
·
--
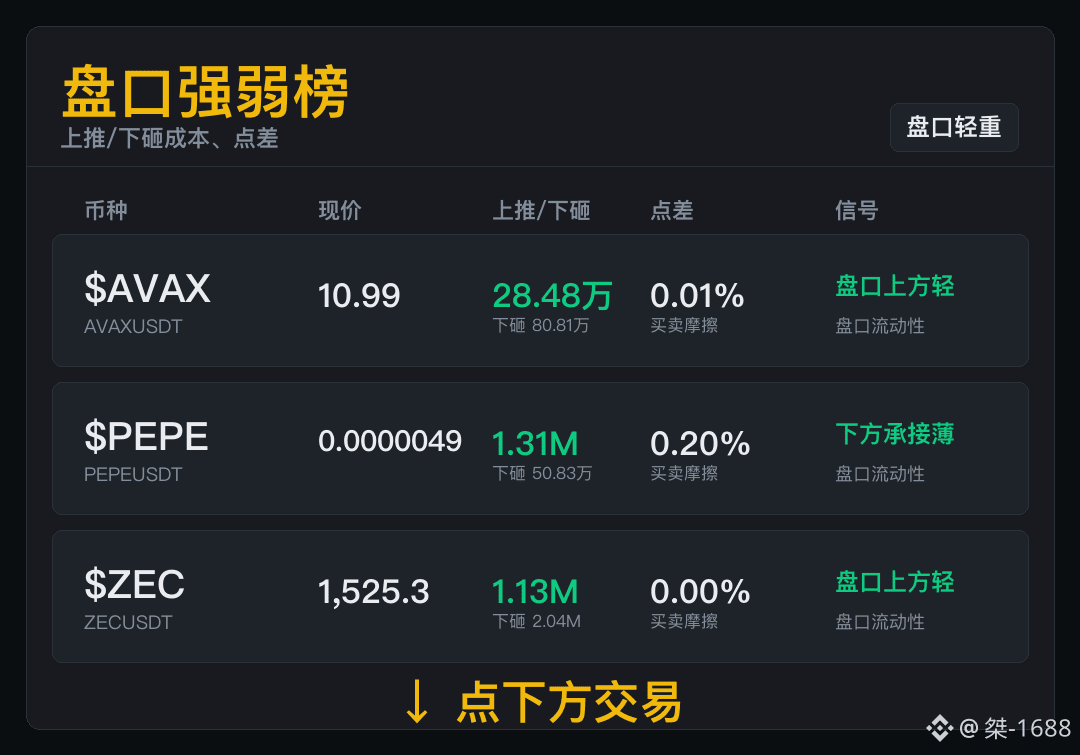
Order book strength affects short-term execution. Even if your direction is right, you still can’t ignore the exit plan.
$AVAX spread 0.01%, push-up cost 284,800. First, see whether the trade can be picked up seamlessly. What the order book gives you is execution conditions—not a guaranteed ticket. Don’t only look at the thinness on top; if the bid side stops, even a thin order book will sweep back and forth.
$PEPE push-up 1.31M, sell-down 508,300, spread 0.20%. For those trying to chase, first look for your way out—don’t only stare at whether it can surge from the top. At this kind of position, don’t just think about up or down; first figure out whether your exit can go smoothly.
$ZEC push-up 1.13M, sell-down 2.04M, spread 0.00%. If you already hold, focus on the actual execution: as long as trades keep coming, the structure is what carries continuation value. Being able to push through is only the first layer. A pullback needs support to truly count as having landed.
Order book strength affects short-term execution. Even if your direction is right, you still can’t ignore the exit plan.
$AVAX spread 0.01%, push-up cost 284,800. First, see whether the trade can be picked up seamlessly. What the order book gives you is execution conditions—not a guaranteed ticket. Don’t only look at the thinness on top; if the bid side stops, even a thin order book will sweep back and forth.
$PEPE push-up 1.31M, sell-down 508,300, spread 0.20%. For those trying to chase, first look for your way out—don’t only stare at whether it can surge from the top. At this kind of position, don’t just think about up or down; first figure out whether your exit can go smoothly.
$ZEC push-up 1.13M, sell-down 2.04M, spread 0.00%. If you already hold, focus on the actual execution: as long as trades keep coming, the structure is what carries continuation value. Being able to push through is only the first layer. A pullback needs support to truly count as having landed.
$AVAX spread 0.01%, push-up cost 284,800. First, see whether the trade can be picked up seamlessly. What the order book gives you is execution conditions—not a guaranteed ticket. Don’t only look at the thinness on top; if the bid side stops, even a thin order book will sweep back and forth.
$PEPE push-up 1.31M, sell-down 508,300, spread 0.20%. For those trying to chase, first look for your way out—don’t only stare at whether it can surge from the top. At this kind of position, don’t just think about up or down; first figure out whether your exit can go smoothly.
$ZEC push-up 1.13M, sell-down 2.04M, spread 0.00%. If you already hold, focus on the actual execution: as long as trades keep coming, the structure is what carries continuation value. Being able to push through is only the first layer. A pullback needs support to truly count as having landed.
382
·
--
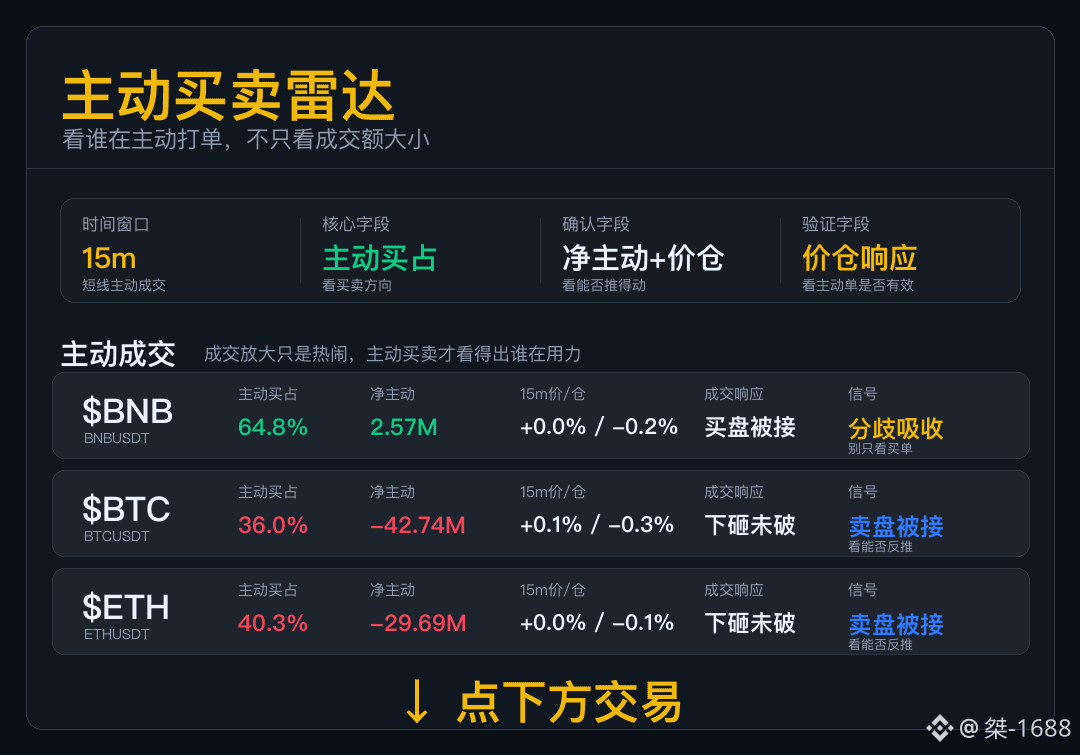
Active Buy/Sell Radar
Don’t just look at the turnover. Today, this set mainly focuses on whether aggressive orders can push the price action.
After a buy order is put out at $BNB , it doesn’t follow through to expand the results. This kind of order book is especially afraid of people chasing into the point of divergence.
After sell-side pressure at $BTC is absorbed, the short-term focus is not on continuing to hit it down, but on whether the buy side can take over.
Market sell orders at $ETH keep appearing, but the price still holds sideways—this indicates that buyers below are willing to accept.
Both sides are acting. Don’t make one combined judgment—check price by price whether there’s follow-through/response.
Active Buy/Sell Radar
Don’t just look at the turnover. Today, this set mainly focuses on whether aggressive orders can push the price action.
After a buy order is put out at $BNB , it doesn’t follow through to expand the results. This kind of order book is especially afraid of people chasing into the point of divergence.
After sell-side pressure at $BTC is absorbed, the short-term focus is not on continuing to hit it down, but on whether the buy side can take over.
Market sell orders at $ETH keep appearing, but the price still holds sideways—this indicates that buyers below are willing to accept.
Both sides are acting. Don’t make one combined judgment—check price by price whether there’s follow-through/response.
Don’t just look at the turnover. Today, this set mainly focuses on whether aggressive orders can push the price action.
After a buy order is put out at $BNB , it doesn’t follow through to expand the results. This kind of order book is especially afraid of people chasing into the point of divergence.
After sell-side pressure at $BTC is absorbed, the short-term focus is not on continuing to hit it down, but on whether the buy side can take over.
Market sell orders at $ETH keep appearing, but the price still holds sideways—this indicates that buyers below are willing to accept.
Both sides are acting. Don’t make one combined judgment—check price by price whether there’s follow-through/response.
1
167
·
--
A-Formation Liquidation Radar
For data like this, first see who is being forced out.
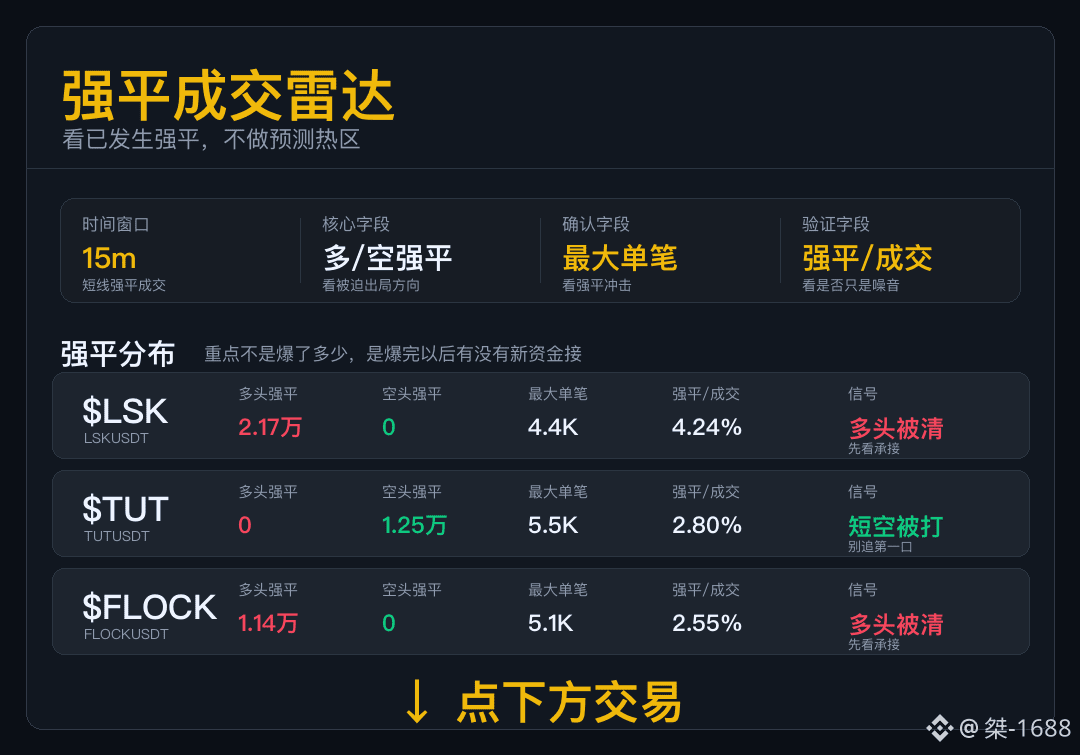
$LSK : There are more passive exits by long positions. For the market to stabilize again, subsequent active buy-side demand needs to reappear.
$TUT : What gets cleared mainly are short positions. The higher the proportion of long liquidations, the easier it is for price to surge—because the clearing and amplification effect is stronger.
$FLOCK : When long liquidations are led, don’t rush to buy on the first attempt. First, see who steps in after the clearing is completed.
Some longs are being liquidated; some shorts are being squeezed. Don’t merge that into a single market direction.
A-Formation Liquidation Radar
For data like this, first see who is being forced out.
$LSK : There are more passive exits by long positions. For the market to stabilize again, subsequent active buy-side demand needs to reappear.
$TUT : What gets cleared mainly are short positions. The higher the proportion of long liquidations, the easier it is for price to surge—because the clearing and amplification effect is stronger.
$FLOCK : When long liquidations are led, don’t rush to buy on the first attempt. First, see who steps in after the clearing is completed.
Some longs are being liquidated; some shorts are being squeezed. Don’t merge that into a single market direction.
For data like this, first see who is being forced out.
$LSK : There are more passive exits by long positions. For the market to stabilize again, subsequent active buy-side demand needs to reappear.
$TUT : What gets cleared mainly are short positions. The higher the proportion of long liquidations, the easier it is for price to surge—because the clearing and amplification effect is stronger.
$FLOCK : When long liquidations are led, don’t rush to buy on the first attempt. First, see who steps in after the clearing is completed.
Some longs are being liquidated; some shorts are being squeezed. Don’t merge that into a single market direction.
495
·
--
Many short-term trades suffer losses; it’s not about judgment—it’s about execution.
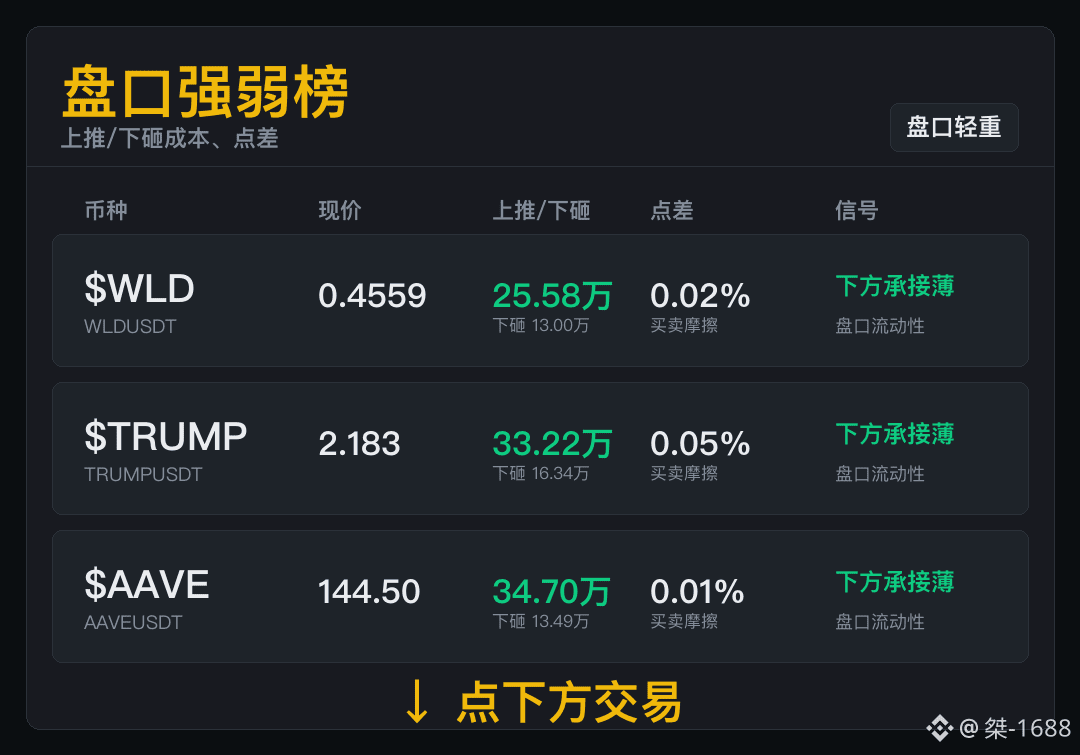
$WLD spot trades: 40.75M成交. Cost for pushing up / smashing down: 25.58万 / 13.00万. The thinness on the lower side is not a bearish conclusion, but it will magnify mistakes. When the downside is not thick, before you chase in, first think through how you’ll get out if you’re wrong.
$TRUMP order book conditions—look at three things: push up 33.22万, smash down 16.34万, and the spread is 0.05%. Thin support does not mean it will immediately fall, but it makes stop-losses and exits more demanding to time. It looks lively, but when it truly drops, maybe no one will be waiting for you.
$AAVE for execution, first look at the costs above and below: push up 34.70万, smash down 13.49万, spread 0.01%. This kind of market isn’t scary to watch—what’s scary is going in heavy and being unwilling to exit when you’ve misread it. Thin on the bottom is not a story; after sell orders appear, pullbacks will reflect to the price faster.
Many short-term trades suffer losses; it’s not about judgment—it’s about execution.
$WLD spot trades: 40.75M成交. Cost for pushing up / smashing down: 25.58万 / 13.00万. The thinness on the lower side is not a bearish conclusion, but it will magnify mistakes. When the downside is not thick, before you chase in, first think through how you’ll get out if you’re wrong.
$TRUMP order book conditions—look at three things: push up 33.22万, smash down 16.34万, and the spread is 0.05%. Thin support does not mean it will immediately fall, but it makes stop-losses and exits more demanding to time. It looks lively, but when it truly drops, maybe no one will be waiting for you.
$AAVE for execution, first look at the costs above and below: push up 34.70万, smash down 13.49万, spread 0.01%. This kind of market isn’t scary to watch—what’s scary is going in heavy and being unwilling to exit when you’ve misread it. Thin on the bottom is not a story; after sell orders appear, pullbacks will reflect to the price faster.
$WLD spot trades: 40.75M成交. Cost for pushing up / smashing down: 25.58万 / 13.00万. The thinness on the lower side is not a bearish conclusion, but it will magnify mistakes. When the downside is not thick, before you chase in, first think through how you’ll get out if you’re wrong.
$TRUMP order book conditions—look at three things: push up 33.22万, smash down 16.34万, and the spread is 0.05%. Thin support does not mean it will immediately fall, but it makes stop-losses and exits more demanding to time. It looks lively, but when it truly drops, maybe no one will be waiting for you.
$AAVE for execution, first look at the costs above and below: push up 34.70万, smash down 13.49万, spread 0.01%. This kind of market isn’t scary to watch—what’s scary is going in heavy and being unwilling to exit when you’ve misread it. Thin on the bottom is not a story; after sell orders appear, pullbacks will reflect to the price faster.
442
·
--
Don’t get shaken by one-screen price swings—first check which coins the funds are actually putting force behind.
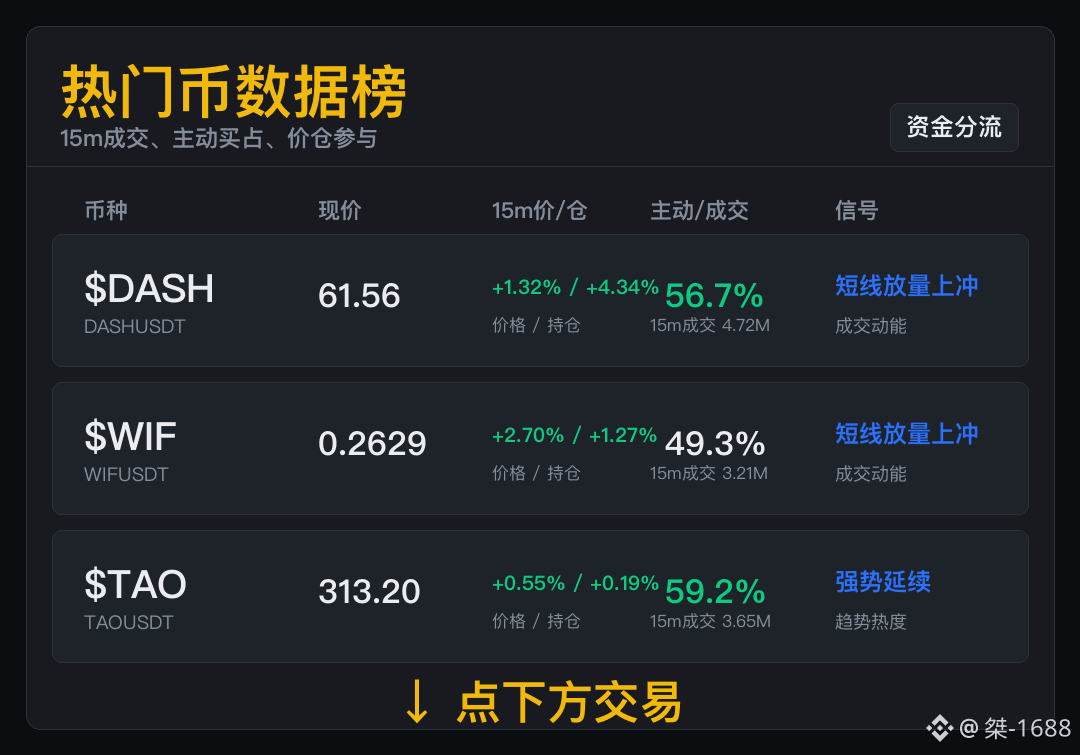
$DASH 15m traded 4.72M, price position +1.32% / +4.34%; for short-term participation, whether there’s involvement matters more than just looking at up or down.
You can watch popular coins, but don’t let the hype press the button for you. It’s not a dead coin—this is worth keeping an eye on, but it doesn’t mean you can recklessly chase.
$WIF 15m traded 3.21M, active buying accounts for 49.3%, price position +2.70% / +1.27%. You can keep an eye on popular coins, but don’t let the emotions in the crowd make the decision for you. Hype is the ticket in; continued trading is the next checkpoint.
$TAO 15m traded 3.65M, active buying accounts for 59.2%, price position +0.55% / +0.19%. This kind of market has attention, but attention doesn’t mean you can乱追 (recklessly chase) without thinking. It’s not that an unpopular coin is just randomly jumping—at least someone is actually trading it.
Don’t get shaken by one-screen price swings—first check which coins the funds are actually putting force behind.
$DASH 15m traded 4.72M, price position +1.32% / +4.34%; for short-term participation, whether there’s involvement matters more than just looking at up or down.
You can watch popular coins, but don’t let the hype press the button for you. It’s not a dead coin—this is worth keeping an eye on, but it doesn’t mean you can recklessly chase.
$WIF 15m traded 3.21M, active buying accounts for 49.3%, price position +2.70% / +1.27%. You can keep an eye on popular coins, but don’t let the emotions in the crowd make the decision for you. Hype is the ticket in; continued trading is the next checkpoint.
$TAO 15m traded 3.65M, active buying accounts for 59.2%, price position +0.55% / +0.19%. This kind of market has attention, but attention doesn’t mean you can乱追 (recklessly chase) without thinking. It’s not that an unpopular coin is just randomly jumping—at least someone is actually trading it.
$DASH 15m traded 4.72M, price position +1.32% / +4.34%; for short-term participation, whether there’s involvement matters more than just looking at up or down.
You can watch popular coins, but don’t let the hype press the button for you. It’s not a dead coin—this is worth keeping an eye on, but it doesn’t mean you can recklessly chase.
$WIF 15m traded 3.21M, active buying accounts for 49.3%, price position +2.70% / +1.27%. You can keep an eye on popular coins, but don’t let the emotions in the crowd make the decision for you. Hype is the ticket in; continued trading is the next checkpoint.
$TAO 15m traded 3.65M, active buying accounts for 59.2%, price position +0.55% / +0.19%. This kind of market has attention, but attention doesn’t mean you can乱追 (recklessly chase) without thinking. It’s not that an unpopular coin is just randomly jumping—at least someone is actually trading it.
339
·
--
$NEAR 15m price declines, positions shrink, and short-term momentum continues to cool.
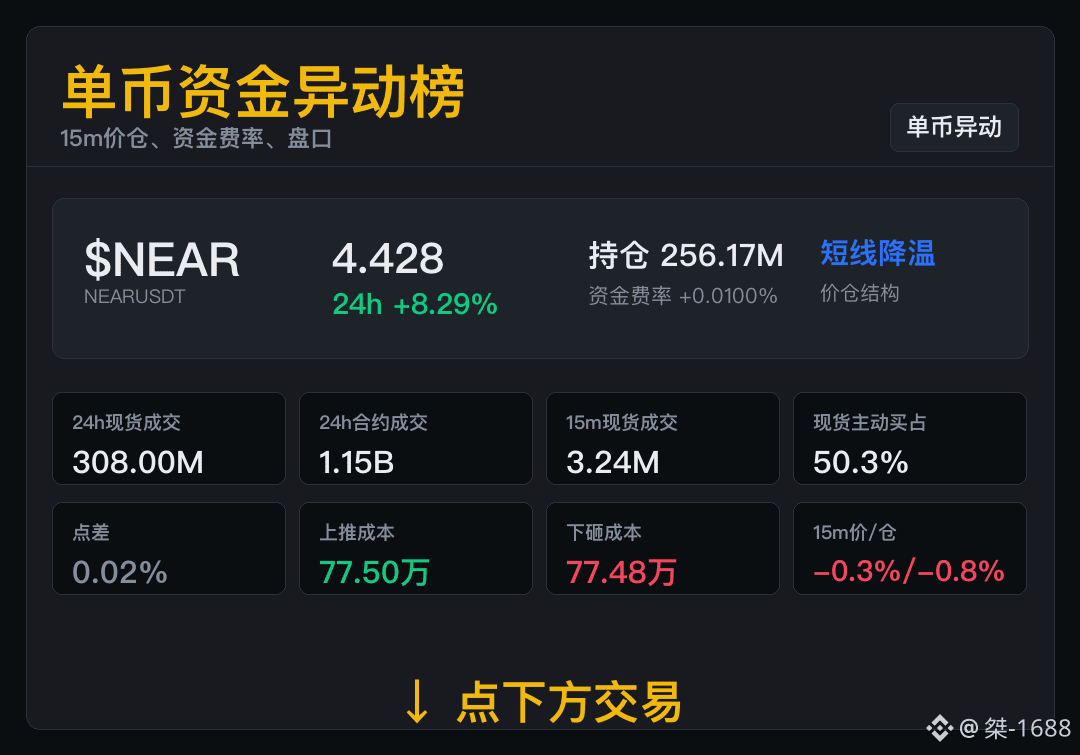
15m spot volume: 3.24M; 15m price: -0.34%; 15m positions: -0.82%.
Price and positions are both falling, and short-term follow-through is decreasing.
Next, first check whether positions stop declining, then confirm whether trading volume rebounds.
$NEAR 15m price declines, positions shrink, and short-term momentum continues to cool.
15m spot volume: 3.24M; 15m price: -0.34%; 15m positions: -0.82%.
Price and positions are both falling, and short-term follow-through is decreasing.
Next, first check whether positions stop declining, then confirm whether trading volume rebounds.
15m spot volume: 3.24M; 15m price: -0.34%; 15m positions: -0.82%.
Price and positions are both falling, and short-term follow-through is decreasing.
Next, first check whether positions stop declining, then confirm whether trading volume rebounds.
55
Log in to explore more content
Join global crypto users on Binance Square
⚡️ Get latest and useful information about crypto.
💬 Trusted by the world’s largest crypto exchange.
👍 Discover real insights from verified creators.
Email / Phone number
Trending Topics
AIStocksWhatNext
502,933 views
3,697 Discussing
Share & Win Traffic Reward in our Trending Hashtag Campaign
✨Topic: What Other Investment Opportunities Remain as AI Stocks Keep Rising?
👉How to Join:
Publish a short post or article with hashtag #AIStocksWhatNext
Share whether you’re bullish or bearish, and post your AI stock holdings or trade — using the trade widget may improve your eligibility.
You can also strengthen your post by sharing data or charts, and avoiding AI-generated images.
✍️Create content based on the below angles:
- Nvidia says chip sales will double next year, and top AI companies keep hitting record revenue, the compute spend behind it is just as staggering. Is AI demand really taking off? And how long can it last? AI stocks are up across the board. Is this a real breakout, or just a short-term bounce?
- Industry leaders are calling to slow down AI development, while Trump plans to build an “AI Force”, claiming AI could account for 25% of U.S. GDP in the future. Whose side are you on? Will state-level backing be a long-term win for AI stocks?
- Are you buying AI stocks? Share your AI-related trade/holdings with our trade sharing widget.
⏰Campaign Period:
- 2026-09-22 7:00 - 2026-09-24 4:00 UTC
🎁Reward:
- Qualified posts that comply with the above guidelines and contain more than 100 words will be reviewed and may receive a random traffic boost of 500 to 3,000 views. You will receive a notification from your feed secretary if your post is selected.
- Get a chance to have your article featured on Binance Square Official
Need ideas for your post? Visit the topic page #AIStocksWhatNext or the Square Guide on How to Post for Better Reach.
Binance Square Official
·424 Likes
·1.1M views
BitcoinTops$87KAtEightMonthHigh
645 views
27 Discussing
ZECBreaksAbove$1600AtRecordHigh
268 views
11 Discussing