

HiSeven
3.1k Posts

HiSeven
 Square Verified
Report
Block User

Live Trader
Open Trade

BNB Holder
High-Frequency Trader
4.5 Years
399 Following
39.7K+ Followers
21.3K+ Liked
1 Badges
Posts
Portfolio
All
Quotes
Videos
Live
·
--
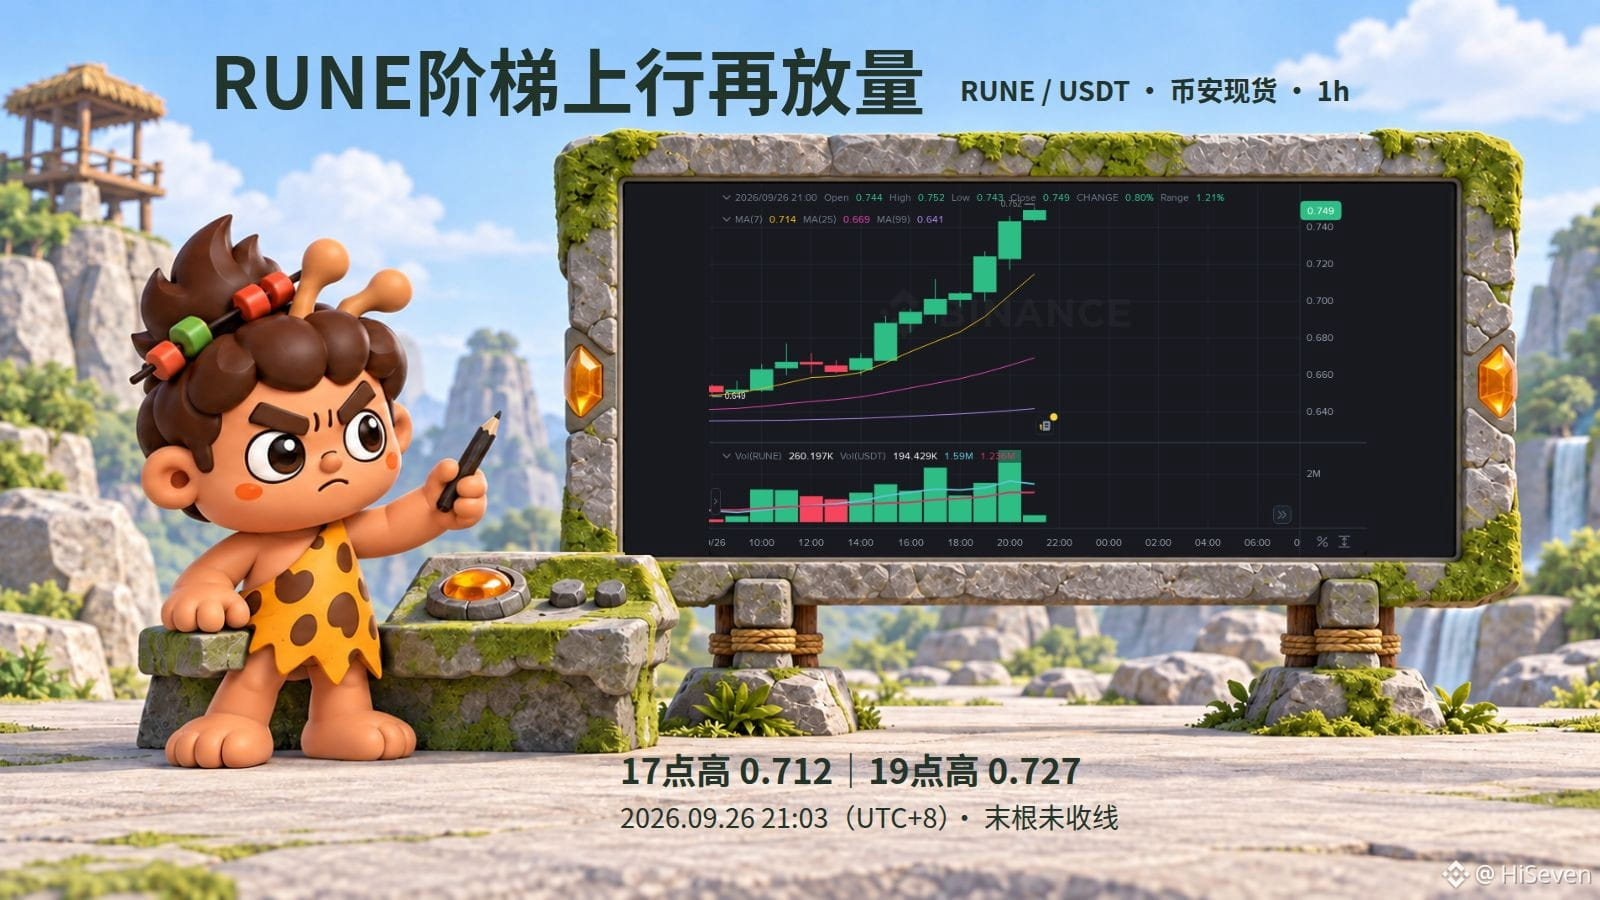
$RUNE After stepping up and then releasing more volume, the next thing to watch is whether the previous high can turn into support and continuation—rather than only focusing on the size of the day’s rise.
On Binance spot’s 1-hour chart, the closes from 15:00 to 20:00 (Beijing time) step upward one by one. The 19:00 close is at 0.724, clearing the 17:00 high of 0.712; at 20:00 it closes again at 0.743, with trading volume increasing by about 85% versus 19:00. As price moves up, volume is able to keep up again—this gives grounds for continued observation. But an increase in volume does not necessarily mean net inflow.
The next verification for a bullish outlook: whether a pullback to around the 19:00 high near 0.727 can hold, and whether it can then close higher again. If the hourly close falls back below the 17:00 high of 0.712, this breakout-continuation thesis is invalid. After a sharp surge, the pullback could become larger; any retracement that hasn’t happened yet should not be written as confirmation.
Open the RUNE行情 and track whether the previous high transitions into support. This is only for spot-condition observation, with no displayed real-position holdings.
Source: Binance spot, collected 21:03 on Sep 26 (UTC+8), and the last candle is not yet closed.
https://www.binance.com/en/trade/RUNE_USDT?type=spot
$RUNE After stepping up and then releasing more volume, the next thing to watch is whether the previous high can turn into support and continuation—rather than only focusing on the size of the day’s rise.
On Binance spot’s 1-hour chart, the closes from 15:00 to 20:00 (Beijing time) step upward one by one. The 19:00 close is at 0.724, clearing the 17:00 high of 0.712; at 20:00 it closes again at 0.743, with trading volume increasing by about 85% versus 19:00. As price moves up, volume is able to keep up again—this gives grounds for continued observation. But an increase in volume does not necessarily mean net inflow.
The next verification for a bullish outlook: whether a pullback to around the 19:00 high near 0.727 can hold, and whether it can then close higher again. If the hourly close falls back below the 17:00 high of 0.712, this breakout-continuation thesis is invalid. After a sharp surge, the pullback could become larger; any retracement that hasn’t happened yet should not be written as confirmation.
Open the RUNE行情 and track whether the previous high transitions into support. This is only for spot-condition observation, with no displayed real-position holdings.
Source: Binance spot, collected 21:03 on Sep 26 (UTC+8), and the last candle is not yet closed.
https://www.binance.com/en/trade/RUNE_USDT?type=spot
On Binance spot’s 1-hour chart, the closes from 15:00 to 20:00 (Beijing time) step upward one by one. The 19:00 close is at 0.724, clearing the 17:00 high of 0.712; at 20:00 it closes again at 0.743, with trading volume increasing by about 85% versus 19:00. As price moves up, volume is able to keep up again—this gives grounds for continued observation. But an increase in volume does not necessarily mean net inflow.
The next verification for a bullish outlook: whether a pullback to around the 19:00 high near 0.727 can hold, and whether it can then close higher again. If the hourly close falls back below the 17:00 high of 0.712, this breakout-continuation thesis is invalid. After a sharp surge, the pullback could become larger; any retracement that hasn’t happened yet should not be written as confirmation.
Open the RUNE行情 and track whether the previous high transitions into support. This is only for spot-condition observation, with no displayed real-position holdings.
Source: Binance spot, collected 21:03 on Sep 26 (UTC+8), and the last candle is not yet closed.
https://www.binance.com/en/trade/RUNE_USDT?type=spot
115
·
--
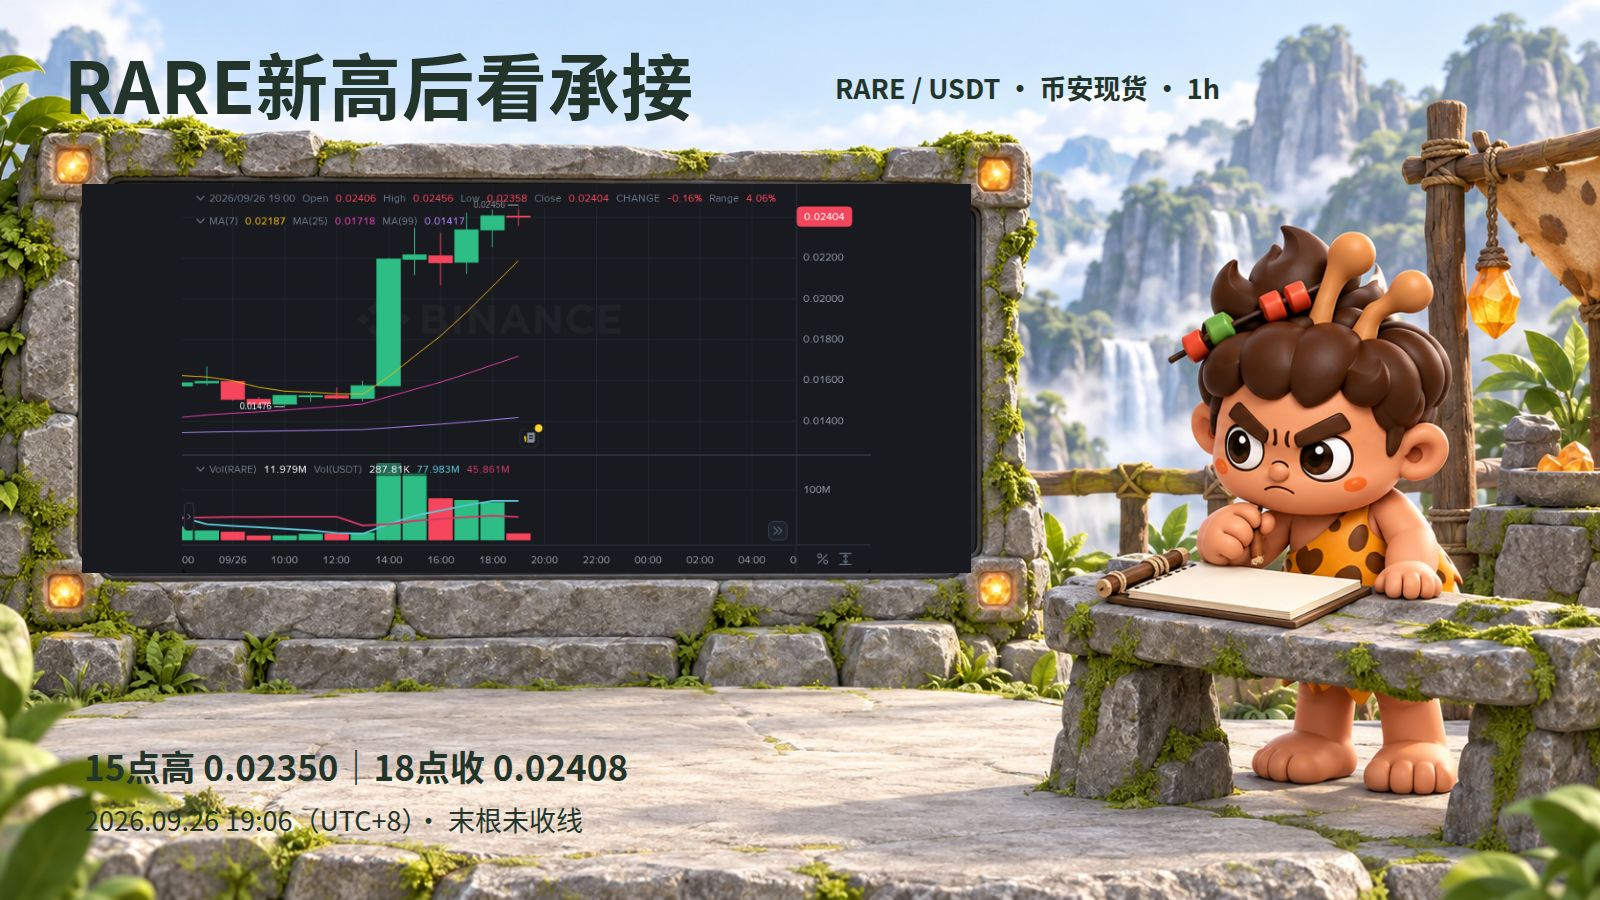
$RARE 18 After the close, price broke above the afternoon pre-high; the second leg continues to be worth watching. The key is whether the pre-high can turn into a continuation/holding support—chasing higher still lacks sufficient volume and needs confirmation.
On Binance spot’s 1-hour chart, there was a volume surge at 14:00, pushing up; at 15:00 it spiked to 0.02350. After pulling back, the candles at 17:00 and 18:00 closed progressively higher. At 18:00 it closed at 0.02408, and the consolidation hasn’t yet broken the upward structure.
However, the volume at 18:00 was only about 49% of the volume at 14:00. Although price has been lifted, volume hasn’t accelerated—so it can’t be treated as a fresh breakout with a new surge in volume.
Watch whether 0.02350 can be retested and held. Then see if the following 1-hour candles can rise and close with increased volume above the 18:00 high of 0.02440. Intraday wicks that pierce through don’t count. If the 1-hour close falls back below 0.02350, first invalidate/cancel this breakout continuation outlook. RARE has a Binance monitoring tag, so volatility and risk are higher.
Source: Binance spot, collected Sep 26 at 19:06 (UTC+8). Structure analysis uses already-closed candles; the last candle in the chart is not yet closed. For market observation only.
https://www.binance.com/en/trade/RARE_USDT?type=spot
$RARE 18 After the close, price broke above the afternoon pre-high; the second leg continues to be worth watching. The key is whether the pre-high can turn into a continuation/holding support—chasing higher still lacks sufficient volume and needs confirmation.
On Binance spot’s 1-hour chart, there was a volume surge at 14:00, pushing up; at 15:00 it spiked to 0.02350. After pulling back, the candles at 17:00 and 18:00 closed progressively higher. At 18:00 it closed at 0.02408, and the consolidation hasn’t yet broken the upward structure.
However, the volume at 18:00 was only about 49% of the volume at 14:00. Although price has been lifted, volume hasn’t accelerated—so it can’t be treated as a fresh breakout with a new surge in volume.
Watch whether 0.02350 can be retested and held. Then see if the following 1-hour candles can rise and close with increased volume above the 18:00 high of 0.02440. Intraday wicks that pierce through don’t count. If the 1-hour close falls back below 0.02350, first invalidate/cancel this breakout continuation outlook. RARE has a Binance monitoring tag, so volatility and risk are higher.
Source: Binance spot, collected Sep 26 at 19:06 (UTC+8). Structure analysis uses already-closed candles; the last candle in the chart is not yet closed. For market observation only.
https://www.binance.com/en/trade/RARE_USDT?type=spot
On Binance spot’s 1-hour chart, there was a volume surge at 14:00, pushing up; at 15:00 it spiked to 0.02350. After pulling back, the candles at 17:00 and 18:00 closed progressively higher. At 18:00 it closed at 0.02408, and the consolidation hasn’t yet broken the upward structure.
However, the volume at 18:00 was only about 49% of the volume at 14:00. Although price has been lifted, volume hasn’t accelerated—so it can’t be treated as a fresh breakout with a new surge in volume.
Watch whether 0.02350 can be retested and held. Then see if the following 1-hour candles can rise and close with increased volume above the 18:00 high of 0.02440. Intraday wicks that pierce through don’t count. If the 1-hour close falls back below 0.02350, first invalidate/cancel this breakout continuation outlook. RARE has a Binance monitoring tag, so volatility and risk are higher.
Source: Binance spot, collected Sep 26 at 19:06 (UTC+8). Structure analysis uses already-closed candles; the last candle in the chart is not yet closed. For market observation only.
https://www.binance.com/en/trade/RARE_USDT?type=spot
48
·
--
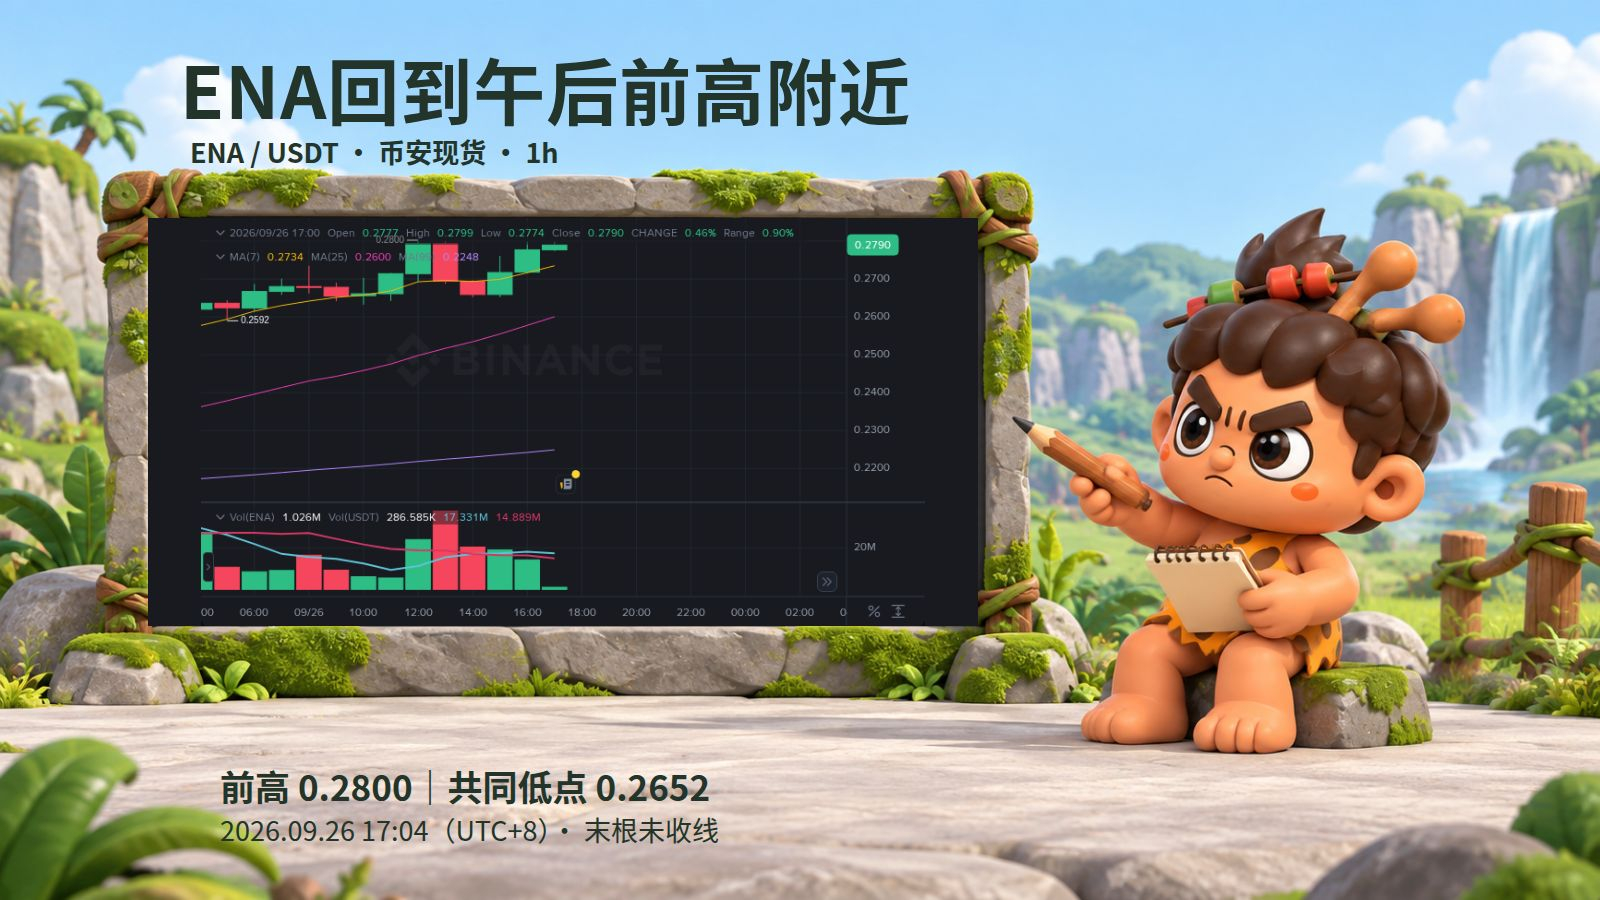
$ENA rebounded 4.4% in two hours, and now it’s back to test the prior high in the afternoon. At 17:00, this one-hour candle briefly touched 0.2807 during the session and crossed above 0.2800, but it hasn’t closed yet. The opportunity to catch the repair is worth following; the breakout still needs confirmation.
On Binance’s spot 1-hour chart, at 12:00 and 13:00 price twice touched 0.2800, then pulled back. At 14:00 and 15:00, they left a common low at 0.2652. From 15:00 to 16:00, candles closed higher consecutively, and the 16:00 candle closed at 0.2777, indicating that after this dip, there truly has been a price repair.
But volume didn’t keep up: at 16:00, the trading volume was only about 38% of the volume of the pullback candle at 13:00. A low-volume rebound can continue, but it may also face resistance again around the old high. For now, it can’t be called a volume-backed breakout.
Next, pay more attention to an hourly close above 0.2800, followed by a pullback that holds, with volume picking up. If it breaks down again below the 0.2652 low that was tested twice, this repair logic would fail. Open the ENA market, and first see whether the previous high can turn from resistance into support; don’t treat the day’s rise as confirmation.
Source: Binance spot https://www.binance.com/en/trade/ENA_USDT?type=spot
Collected at 17:04 on Sep 26 (UTC+8). The structural analysis uses already-closed 1-hour candlesticks; intraday updates were verified up to the time of publishing, and the last candle in the chart is not yet closed. For market observation only.
$ENA rebounded 4.4% in two hours, and now it’s back to test the prior high in the afternoon. At 17:00, this one-hour candle briefly touched 0.2807 during the session and crossed above 0.2800, but it hasn’t closed yet. The opportunity to catch the repair is worth following; the breakout still needs confirmation.
On Binance’s spot 1-hour chart, at 12:00 and 13:00 price twice touched 0.2800, then pulled back. At 14:00 and 15:00, they left a common low at 0.2652. From 15:00 to 16:00, candles closed higher consecutively, and the 16:00 candle closed at 0.2777, indicating that after this dip, there truly has been a price repair.
But volume didn’t keep up: at 16:00, the trading volume was only about 38% of the volume of the pullback candle at 13:00. A low-volume rebound can continue, but it may also face resistance again around the old high. For now, it can’t be called a volume-backed breakout.
Next, pay more attention to an hourly close above 0.2800, followed by a pullback that holds, with volume picking up. If it breaks down again below the 0.2652 low that was tested twice, this repair logic would fail. Open the ENA market, and first see whether the previous high can turn from resistance into support; don’t treat the day’s rise as confirmation.
Source: Binance spot https://www.binance.com/en/trade/ENA_USDT?type=spot
Collected at 17:04 on Sep 26 (UTC+8). The structural analysis uses already-closed 1-hour candlesticks; intraday updates were verified up to the time of publishing, and the last candle in the chart is not yet closed. For market observation only.
On Binance’s spot 1-hour chart, at 12:00 and 13:00 price twice touched 0.2800, then pulled back. At 14:00 and 15:00, they left a common low at 0.2652. From 15:00 to 16:00, candles closed higher consecutively, and the 16:00 candle closed at 0.2777, indicating that after this dip, there truly has been a price repair.
But volume didn’t keep up: at 16:00, the trading volume was only about 38% of the volume of the pullback candle at 13:00. A low-volume rebound can continue, but it may also face resistance again around the old high. For now, it can’t be called a volume-backed breakout.
Next, pay more attention to an hourly close above 0.2800, followed by a pullback that holds, with volume picking up. If it breaks down again below the 0.2652 low that was tested twice, this repair logic would fail. Open the ENA market, and first see whether the previous high can turn from resistance into support; don’t treat the day’s rise as confirmation.
Source: Binance spot https://www.binance.com/en/trade/ENA_USDT?type=spot
Collected at 17:04 on Sep 26 (UTC+8). The structural analysis uses already-closed 1-hour candlesticks; intraday updates were verified up to the time of publishing, and the last candle in the chart is not yet closed. For market observation only.
95
·
--
$2Z rose about 23% in two hours, and volume surged with acceleration—worth tracking, but the first pullback hasn’t come yet.
On Binance spot, the 1-hour candle at 13:00 closed at 0.06131, breaking above the morning consolidation range. At 14:00 it continued to close higher, reaching 0.07048, with volume about 6.2 times that of the previous hour. Two consecutive pushing candles provide more follow-through clues than a single spike.
Meanwhile, Bitcoin’s two corresponding 1-hour candles both closed lower, so 2Z’s strength is temporarily independent of the broader market.
Bullish-biased watch: look for the next round of pullback. After a contraction/sideways consolidation, if the next hour’s close moves back above the consolidation high, that would be new evidence for continuation. For now, the 14:00 close price can’t be called support directly. If the 1-hour close falls back below 0.06131 (the 13:00 high), this acceleration structure will be clearly damaged; if there’s increased-volume selling with a drop, the bullish strength call should be withdrawn earlier.
It carries a Seed tag, and after a sharp surge, the retracement could happen quickly. Open the 1-hour chart, wait for confirmation/absorption first, and don’t simply chase the move based on the percentage gain.
Source: Binance 2Z/USDT spot and the public 1-hour lines; collected at 15:04 on Sep 26 (UTC+8), the 15:00 line was not yet closed. Market entry: https://www.binance.com/en/trade/2Z_USDT?type=spot
$2Z rose about 23% in two hours, and volume surged with acceleration—worth tracking, but the first pullback hasn’t come yet.
On Binance spot, the 1-hour candle at 13:00 closed at 0.06131, breaking above the morning consolidation range. At 14:00 it continued to close higher, reaching 0.07048, with volume about 6.2 times that of the previous hour. Two consecutive pushing candles provide more follow-through clues than a single spike.
Meanwhile, Bitcoin’s two corresponding 1-hour candles both closed lower, so 2Z’s strength is temporarily independent of the broader market.
Bullish-biased watch: look for the next round of pullback. After a contraction/sideways consolidation, if the next hour’s close moves back above the consolidation high, that would be new evidence for continuation. For now, the 14:00 close price can’t be called support directly. If the 1-hour close falls back below 0.06131 (the 13:00 high), this acceleration structure will be clearly damaged; if there’s increased-volume selling with a drop, the bullish strength call should be withdrawn earlier.
It carries a Seed tag, and after a sharp surge, the retracement could happen quickly. Open the 1-hour chart, wait for confirmation/absorption first, and don’t simply chase the move based on the percentage gain.
Source: Binance 2Z/USDT spot and the public 1-hour lines; collected at 15:04 on Sep 26 (UTC+8), the 15:00 line was not yet closed. Market entry: https://www.binance.com/en/trade/2Z_USDT?type=spot
On Binance spot, the 1-hour candle at 13:00 closed at 0.06131, breaking above the morning consolidation range. At 14:00 it continued to close higher, reaching 0.07048, with volume about 6.2 times that of the previous hour. Two consecutive pushing candles provide more follow-through clues than a single spike.
Meanwhile, Bitcoin’s two corresponding 1-hour candles both closed lower, so 2Z’s strength is temporarily independent of the broader market.
Bullish-biased watch: look for the next round of pullback. After a contraction/sideways consolidation, if the next hour’s close moves back above the consolidation high, that would be new evidence for continuation. For now, the 14:00 close price can’t be called support directly. If the 1-hour close falls back below 0.06131 (the 13:00 high), this acceleration structure will be clearly damaged; if there’s increased-volume selling with a drop, the bullish strength call should be withdrawn earlier.
It carries a Seed tag, and after a sharp surge, the retracement could happen quickly. Open the 1-hour chart, wait for confirmation/absorption first, and don’t simply chase the move based on the percentage gain.
Source: Binance 2Z/USDT spot and the public 1-hour lines; collected at 15:04 on Sep 26 (UTC+8), the 15:00 line was not yet closed. Market entry: https://www.binance.com/en/trade/2Z_USDT?type=spot

1
269
·
--
$AERO 连续两小时回踩同一低点,拉升后的承接值得跟踪,偏多观察暂时保留。
币安现货北京时间10点这根小时线,成交量约为前一小时3倍,收盘越过早间整理区。随后11、12点都下探0.8789,没有继续刷新低点;12点收回0.8947,成交量降至10点的约40%。放量抬升后缩量整理,比只看24小时涨幅更有参考价值,但缩量也意味着上攻力度还没确认。
接下来盯0.8789能否守住,再看能否放量收越11点高点0.9015。若小时收盘跌破共同低点,当前承接判断失效;只摸到上沿又回落,不算突破。打开AERO现货1小时图,重点跟这两处变化,别把高位整理当成必涨。
来源:币安现货原生图与公开K线接口;9月26日13:07(UTC+8)采集,13点尚未收线。
https://www.binance.com/en/trade/AERO_USDT?type=spot
$AERO 连续两小时回踩同一低点,拉升后的承接值得跟踪,偏多观察暂时保留。
币安现货北京时间10点这根小时线,成交量约为前一小时3倍,收盘越过早间整理区。随后11、12点都下探0.8789,没有继续刷新低点;12点收回0.8947,成交量降至10点的约40%。放量抬升后缩量整理,比只看24小时涨幅更有参考价值,但缩量也意味着上攻力度还没确认。
接下来盯0.8789能否守住,再看能否放量收越11点高点0.9015。若小时收盘跌破共同低点,当前承接判断失效;只摸到上沿又回落,不算突破。打开AERO现货1小时图,重点跟这两处变化,别把高位整理当成必涨。
来源:币安现货原生图与公开K线接口;9月26日13:07(UTC+8)采集,13点尚未收线。
https://www.binance.com/en/trade/AERO_USDT?type=spot
币安现货北京时间10点这根小时线,成交量约为前一小时3倍,收盘越过早间整理区。随后11、12点都下探0.8789,没有继续刷新低点;12点收回0.8947,成交量降至10点的约40%。放量抬升后缩量整理,比只看24小时涨幅更有参考价值,但缩量也意味着上攻力度还没确认。
接下来盯0.8789能否守住,再看能否放量收越11点高点0.9015。若小时收盘跌破共同低点,当前承接判断失效;只摸到上沿又回落,不算突破。打开AERO现货1小时图,重点跟这两处变化,别把高位整理当成必涨。
来源:币安现货原生图与公开K线接口;9月26日13:07(UTC+8)采集,13点尚未收线。
https://www.binance.com/en/trade/AERO_USDT?type=spot

1
239
·
--
After a sharp drop at $MUBARAK 10, it recovered most of the decline, so it can be placed on the repair watchlist, but a long lower shadow does not yet mean support has been firmly established.
In Binance spot 1-hour charts, the closes from 5 to 7 o'clock were gradually higher, and 8 o'clock continued to push up; however, at 10 o'clock it retraced to 0.05325, close to the 5 o'clock low of 0.05317, then recovered to 0.05648. This rebound makes the lower edge of the morning consolidation range still worth watching, and there is no need to chase price just by looking at the gainers list.
The trading volume at 10 o'clock was about 41% of that at 8 o'clock, but higher than at 9 o'clock, indicating that the pullback also came with increased trading, so it cannot be directly called a "low-volume shakeout." As of publication, the price was about 0.05590, still below the 7 o'clock high of 0.05624, so secondary support has not yet been confirmed.
A bullish repair requires a move back above 0.05624 and holding it during subsequent retests; if the hourly close falls below 0.05317, abandon this repair logic. This coin retraces quickly, so first save these two observation levels, then watch the next candlestick close.
Source: Binance spot public hourly chart; chart captured at September 26, 11:07, the latest candle had not yet closed; all times are UTC+8.
https://www.binance.com/en/trade/MUBARAK_USDT?type=spot
After a sharp drop at $MUBARAK 10, it recovered most of the decline, so it can be placed on the repair watchlist, but a long lower shadow does not yet mean support has been firmly established.
In Binance spot 1-hour charts, the closes from 5 to 7 o'clock were gradually higher, and 8 o'clock continued to push up; however, at 10 o'clock it retraced to 0.05325, close to the 5 o'clock low of 0.05317, then recovered to 0.05648. This rebound makes the lower edge of the morning consolidation range still worth watching, and there is no need to chase price just by looking at the gainers list.
The trading volume at 10 o'clock was about 41% of that at 8 o'clock, but higher than at 9 o'clock, indicating that the pullback also came with increased trading, so it cannot be directly called a "low-volume shakeout." As of publication, the price was about 0.05590, still below the 7 o'clock high of 0.05624, so secondary support has not yet been confirmed.
A bullish repair requires a move back above 0.05624 and holding it during subsequent retests; if the hourly close falls below 0.05317, abandon this repair logic. This coin retraces quickly, so first save these two observation levels, then watch the next candlestick close.
Source: Binance spot public hourly chart; chart captured at September 26, 11:07, the latest candle had not yet closed; all times are UTC+8.
https://www.binance.com/en/trade/MUBARAK_USDT?type=spot
In Binance spot 1-hour charts, the closes from 5 to 7 o'clock were gradually higher, and 8 o'clock continued to push up; however, at 10 o'clock it retraced to 0.05325, close to the 5 o'clock low of 0.05317, then recovered to 0.05648. This rebound makes the lower edge of the morning consolidation range still worth watching, and there is no need to chase price just by looking at the gainers list.
The trading volume at 10 o'clock was about 41% of that at 8 o'clock, but higher than at 9 o'clock, indicating that the pullback also came with increased trading, so it cannot be directly called a "low-volume shakeout." As of publication, the price was about 0.05590, still below the 7 o'clock high of 0.05624, so secondary support has not yet been confirmed.
A bullish repair requires a move back above 0.05624 and holding it during subsequent retests; if the hourly close falls below 0.05317, abandon this repair logic. This coin retraces quickly, so first save these two observation levels, then watch the next candlestick close.
Source: Binance spot public hourly chart; chart captured at September 26, 11:07, the latest candle had not yet closed; all times are UTC+8.
https://www.binance.com/en/trade/MUBARAK_USDT?type=spot

96
·
--
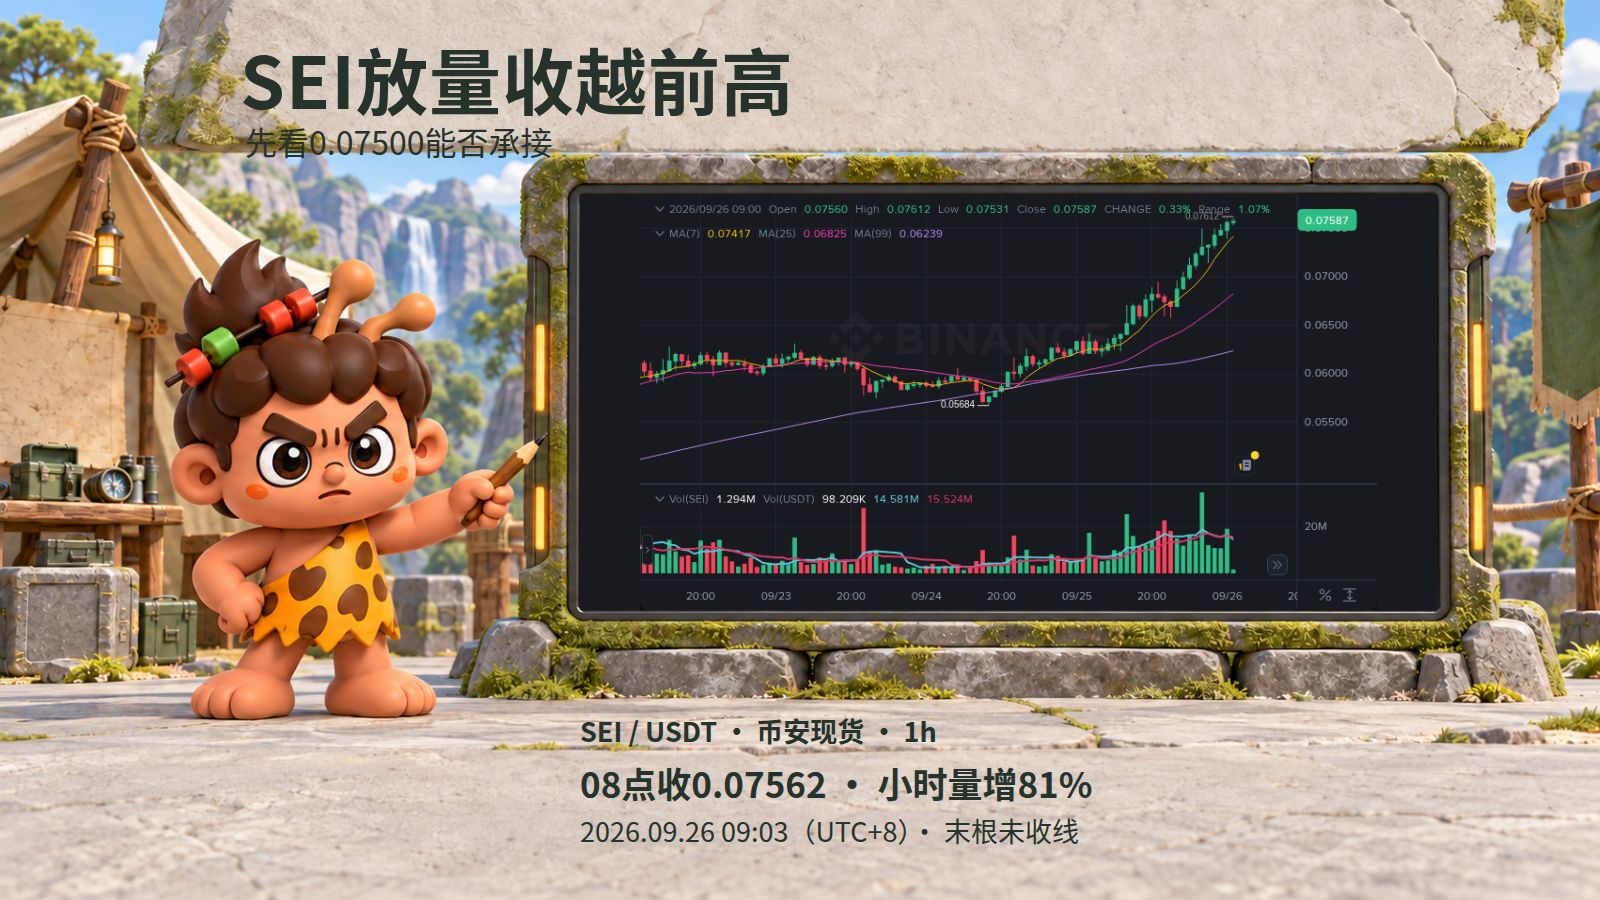
$SEI 8 points: this hourly candle closed above the pre-dawn high and the uptrend is worth following, but first wait to see if it can hold a pullback at 0.07500.
Binance spot: at 4:00 it surged to 0.07500 and then fell back; from 5:00 to 7:00 the close gradually moved higher. At 8:00 it closed at 0.07562, and it also broke above the 7:00 high of 0.07544. This time isn’t just a wick that touched higher— the close itself crossed through.
At 8:00, the trading volume increased by about 81% compared with 7:00, but it’s still lower than the volume during the attempt high at 4:00. The breakout has additional volume to support it, but it still can’t be directly taken as confirmation of an accelerating move.
Next, watch the area around 0.07500: after the pullback, if the hourly close holds, then continue to observe with a bullish bias. If it falls back and keeps failing to reclaim the level, then the prior high turning into support won’t have been established—withdraw the continuation assumption. After a run of consecutive gains, chasing prices often leads to getting hit by a pullback.
Open the SEI spot 1-hour chart and track the next pullback. Don’t treat an unclosed candle as confirmation.
Source: Binance spot native chart and public candlesticks; captured at 09:03 on Sep 26 (UTC+8).
https://www.binance.com/en/trade/SEI_USDT?type=spot
$SEI 8 points: this hourly candle closed above the pre-dawn high and the uptrend is worth following, but first wait to see if it can hold a pullback at 0.07500.
Binance spot: at 4:00 it surged to 0.07500 and then fell back; from 5:00 to 7:00 the close gradually moved higher. At 8:00 it closed at 0.07562, and it also broke above the 7:00 high of 0.07544. This time isn’t just a wick that touched higher— the close itself crossed through.
At 8:00, the trading volume increased by about 81% compared with 7:00, but it’s still lower than the volume during the attempt high at 4:00. The breakout has additional volume to support it, but it still can’t be directly taken as confirmation of an accelerating move.
Next, watch the area around 0.07500: after the pullback, if the hourly close holds, then continue to observe with a bullish bias. If it falls back and keeps failing to reclaim the level, then the prior high turning into support won’t have been established—withdraw the continuation assumption. After a run of consecutive gains, chasing prices often leads to getting hit by a pullback.
Open the SEI spot 1-hour chart and track the next pullback. Don’t treat an unclosed candle as confirmation.
Source: Binance spot native chart and public candlesticks; captured at 09:03 on Sep 26 (UTC+8).
https://www.binance.com/en/trade/SEI_USDT?type=spot
Binance spot: at 4:00 it surged to 0.07500 and then fell back; from 5:00 to 7:00 the close gradually moved higher. At 8:00 it closed at 0.07562, and it also broke above the 7:00 high of 0.07544. This time isn’t just a wick that touched higher— the close itself crossed through.
At 8:00, the trading volume increased by about 81% compared with 7:00, but it’s still lower than the volume during the attempt high at 4:00. The breakout has additional volume to support it, but it still can’t be directly taken as confirmation of an accelerating move.
Next, watch the area around 0.07500: after the pullback, if the hourly close holds, then continue to observe with a bullish bias. If it falls back and keeps failing to reclaim the level, then the prior high turning into support won’t have been established—withdraw the continuation assumption. After a run of consecutive gains, chasing prices often leads to getting hit by a pullback.
Open the SEI spot 1-hour chart and track the next pullback. Don’t treat an unclosed candle as confirmation.
Source: Binance spot native chart and public candlesticks; captured at 09:03 on Sep 26 (UTC+8).
https://www.binance.com/en/trade/SEI_USDT?type=spot
167
·
--
$PLUME After two consecutive hourly candles close above the previous evening’s high, at 22:00 the volume nearly doubles. What’s more worth watching in this round isn’t just the 24-hour price increase, but the continuation after the breakout with expanding volume.
On Binance spot: the 19:00 high is 0.01900. By 20:00 it hasn’t closed through yet; at 21:00 it closes at 0.01927; at 22:00 it closes further up to 0.01989. The latter hour’s trading volume is 1.99 times the prior hour. When the price is lifted higher there is matching activity, but higher volume doesn’t necessarily mean net inflow.
Next, the focus is on whether the previous high can hold and transition: after a pullback, if the hourly close can stay above 0.01900, and then with another volume expansion it closes above the 22:00 high of 0.01997, the continuation would be more convincing. If it falls back below 0.01900, first revoke the judgment of a continuation breakout. Since the price is already some distance from the previous high, chasing gains carries a risk of giveback.
Open the chart to observe the subsequent candle closes; don’t treat an intrahour spike before the candle closes as confirmation.
Source: Binance spot 1h, collected at 23:03 on Sep 25 (UTC+8).
https://www.binance.com/en/trade/PLUME_USDT?type=spot
$PLUME After two consecutive hourly candles close above the previous evening’s high, at 22:00 the volume nearly doubles. What’s more worth watching in this round isn’t just the 24-hour price increase, but the continuation after the breakout with expanding volume.
On Binance spot: the 19:00 high is 0.01900. By 20:00 it hasn’t closed through yet; at 21:00 it closes at 0.01927; at 22:00 it closes further up to 0.01989. The latter hour’s trading volume is 1.99 times the prior hour. When the price is lifted higher there is matching activity, but higher volume doesn’t necessarily mean net inflow.
Next, the focus is on whether the previous high can hold and transition: after a pullback, if the hourly close can stay above 0.01900, and then with another volume expansion it closes above the 22:00 high of 0.01997, the continuation would be more convincing. If it falls back below 0.01900, first revoke the judgment of a continuation breakout. Since the price is already some distance from the previous high, chasing gains carries a risk of giveback.
Open the chart to observe the subsequent candle closes; don’t treat an intrahour spike before the candle closes as confirmation.
Source: Binance spot 1h, collected at 23:03 on Sep 25 (UTC+8).
https://www.binance.com/en/trade/PLUME_USDT?type=spot
On Binance spot: the 19:00 high is 0.01900. By 20:00 it hasn’t closed through yet; at 21:00 it closes at 0.01927; at 22:00 it closes further up to 0.01989. The latter hour’s trading volume is 1.99 times the prior hour. When the price is lifted higher there is matching activity, but higher volume doesn’t necessarily mean net inflow.
Next, the focus is on whether the previous high can hold and transition: after a pullback, if the hourly close can stay above 0.01900, and then with another volume expansion it closes above the 22:00 high of 0.01997, the continuation would be more convincing. If it falls back below 0.01900, first revoke the judgment of a continuation breakout. Since the price is already some distance from the previous high, chasing gains carries a risk of giveback.
Open the chart to observe the subsequent candle closes; don’t treat an intrahour spike before the candle closes as confirmation.
Source: Binance spot 1h, collected at 23:03 on Sep 25 (UTC+8).
https://www.binance.com/en/trade/PLUME_USDT?type=spot

2
255
·
--
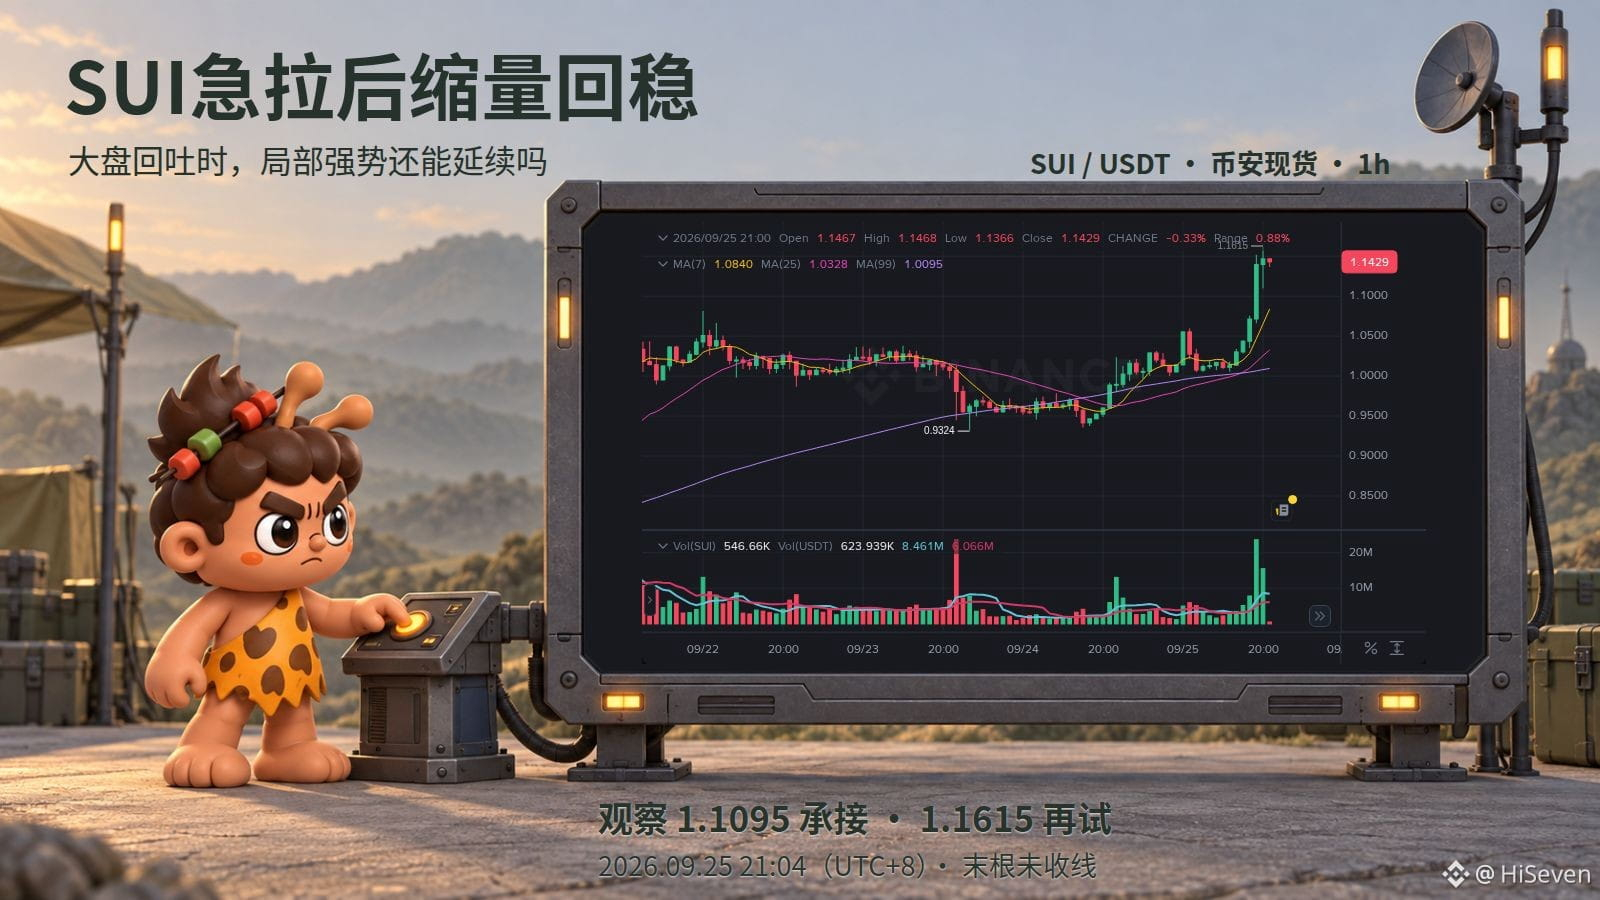
$SUI After the strong pullback, the volume has shrunk and the market has stabilized. Tonight, what’s more worth watching is the strength during a pullback, not chasing that big bullish candle.
On Binance spot at 19:00, this hourly candle rose 6.36%; at 20:00 it briefly dipped, but it closed at 1.1467, higher than the previous hour’s close. Volume fell to 66% of the prior hour’s level. For now, there hasn’t been any volume surge selling to smash back into the breakout area. Compared with the same hour, Bitcoin closed lower, while SUI preserved more of its upside—so local relative strength is still there.
Bias: bullish—watch to see if it can continue. First, see whether the dip low at 20:00 around 1.1095 can hold. Then, watch whether volume can cooperate to retest 1.1615. The latter is only a newly formed hourly high; it’s not yet a confirmed breakout. If subsequent hourly candles close below 1.1095 and fail to reclaim it, then the “stabilizing” view should be withdrawn—we should not automatically treat low-volume stability as reluctance to sell.
You can save these two observation conditions and then open the chart to verify. After small-cap coins急拉 (a fast surge), the amplitude tends to be large. This article is for spot observation only, with no position or performance endorsement.
Source: Binance SUI/USDT spot 1-hour candlestick chart and public API; sampled at 21:04 on Sep 25 (UTC+8); the 21:00 line had not closed.
https://www.binance.com/en/trade/SUI_USDT?type=spot
$SUI After the strong pullback, the volume has shrunk and the market has stabilized. Tonight, what’s more worth watching is the strength during a pullback, not chasing that big bullish candle.
On Binance spot at 19:00, this hourly candle rose 6.36%; at 20:00 it briefly dipped, but it closed at 1.1467, higher than the previous hour’s close. Volume fell to 66% of the prior hour’s level. For now, there hasn’t been any volume surge selling to smash back into the breakout area. Compared with the same hour, Bitcoin closed lower, while SUI preserved more of its upside—so local relative strength is still there.
Bias: bullish—watch to see if it can continue. First, see whether the dip low at 20:00 around 1.1095 can hold. Then, watch whether volume can cooperate to retest 1.1615. The latter is only a newly formed hourly high; it’s not yet a confirmed breakout. If subsequent hourly candles close below 1.1095 and fail to reclaim it, then the “stabilizing” view should be withdrawn—we should not automatically treat low-volume stability as reluctance to sell.
You can save these two observation conditions and then open the chart to verify. After small-cap coins急拉 (a fast surge), the amplitude tends to be large. This article is for spot observation only, with no position or performance endorsement.
Source: Binance SUI/USDT spot 1-hour candlestick chart and public API; sampled at 21:04 on Sep 25 (UTC+8); the 21:00 line had not closed.
https://www.binance.com/en/trade/SUI_USDT?type=spot
On Binance spot at 19:00, this hourly candle rose 6.36%; at 20:00 it briefly dipped, but it closed at 1.1467, higher than the previous hour’s close. Volume fell to 66% of the prior hour’s level. For now, there hasn’t been any volume surge selling to smash back into the breakout area. Compared with the same hour, Bitcoin closed lower, while SUI preserved more of its upside—so local relative strength is still there.
Bias: bullish—watch to see if it can continue. First, see whether the dip low at 20:00 around 1.1095 can hold. Then, watch whether volume can cooperate to retest 1.1615. The latter is only a newly formed hourly high; it’s not yet a confirmed breakout. If subsequent hourly candles close below 1.1095 and fail to reclaim it, then the “stabilizing” view should be withdrawn—we should not automatically treat low-volume stability as reluctance to sell.
You can save these two observation conditions and then open the chart to verify. After small-cap coins急拉 (a fast surge), the amplitude tends to be large. This article is for spot observation only, with no position or performance endorsement.
Source: Binance SUI/USDT spot 1-hour candlestick chart and public API; sampled at 21:04 on Sep 25 (UTC+8); the 21:00 line had not closed.
https://www.binance.com/en/trade/SUI_USDT?type=spot
1
106
·
--
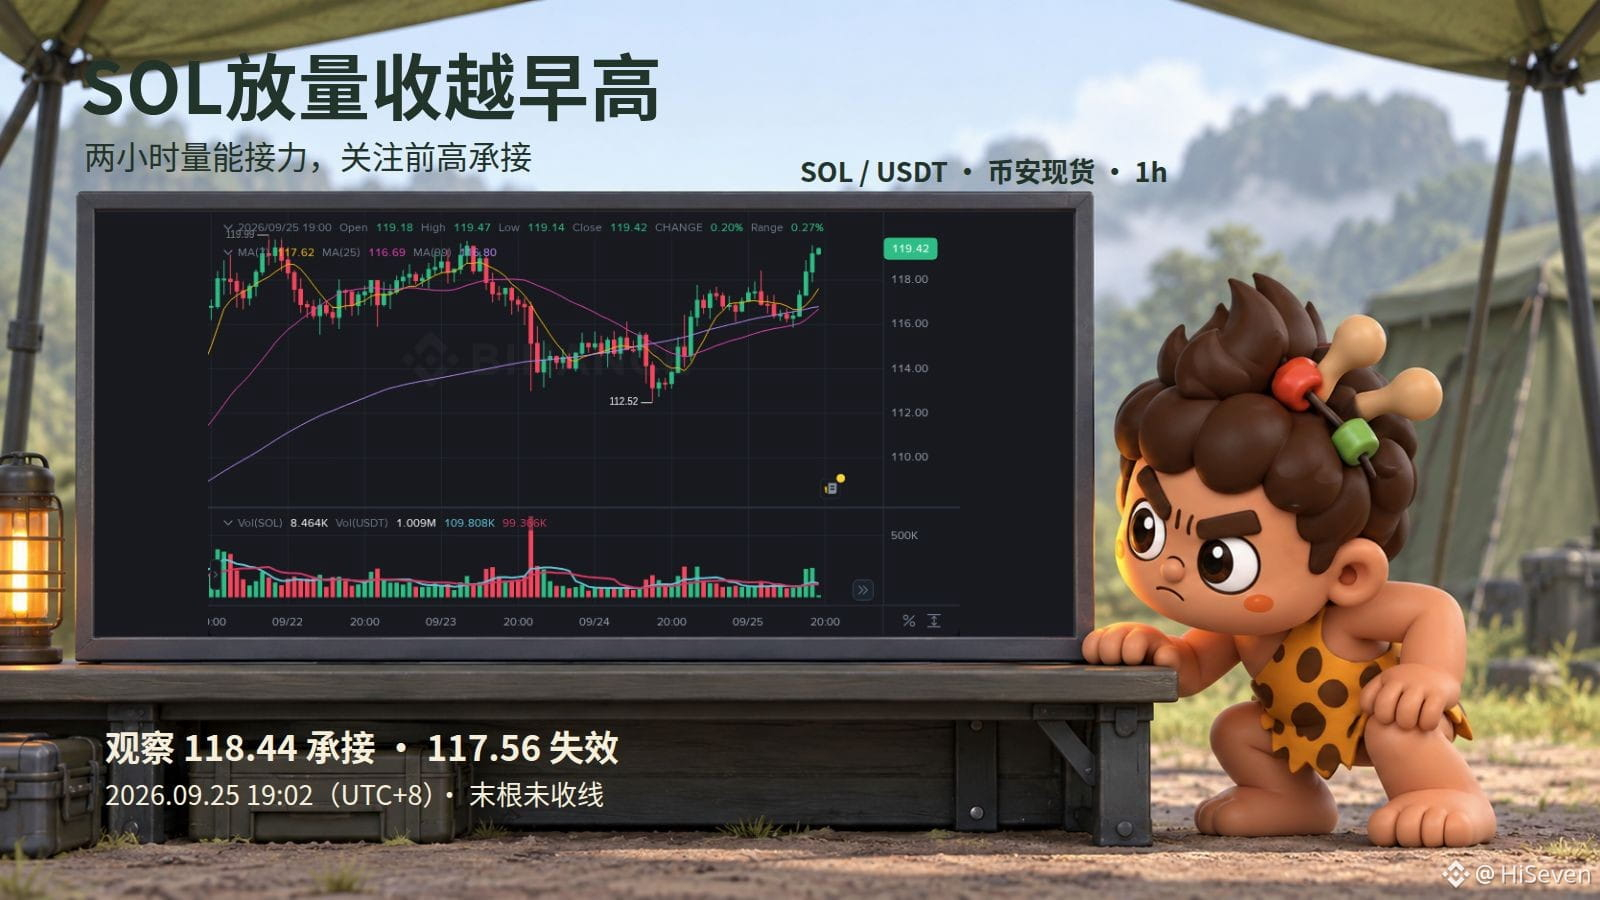
$SOL Breakout volume surpassed the early morning high sooner than expected. Among the mainstream coins, this is worth keeping an eye on for the next leg upward. The reason to watch with a slightly bullish bias is that the hourly closing price has finally crossed above the spot where the morning spike and pullback occurred.
On Binance spot, at 10:00 it touched 118.44 then closed lower; at 17:00 it surged again but still closed below that level; only at 18:00 did it close up to 119.18. After two tests of the high, the breakout is confirmed by a closing price break—this provides an extra layer of validation compared with only looking at intraday price increases.
Volume also picked up: the volume at 17:00 was 2.58 times that at 16:00. And it didn’t fade back at 18:00—it added about another 4%. This is an expansion in traded volume, which doesn’t necessarily mean net inflows.
Next, watch whether 118.44 can turn from the previous high into a support/resistance pivot that gets accepted and held. After backtesting, only if hourly closes continue to hold above it should you look for continuation; if it closes back below the 16:00 high of 117.56, then this breakout observation is invalidated. Chasing right after a sudden rise often runs into profit-taking pullbacks.
You can open the SOL spot 1-hour chart and track the next retest. Don’t treat the unclosed 19:00 candle as confirmation.
Source: Binance SOL/USDT spot, Sep 25 at 19:02 (UTC+8).
https://www.binance.com/en/trade/SOL_USDT?type=spot
$SOL Breakout volume surpassed the early morning high sooner than expected. Among the mainstream coins, this is worth keeping an eye on for the next leg upward. The reason to watch with a slightly bullish bias is that the hourly closing price has finally crossed above the spot where the morning spike and pullback occurred.
On Binance spot, at 10:00 it touched 118.44 then closed lower; at 17:00 it surged again but still closed below that level; only at 18:00 did it close up to 119.18. After two tests of the high, the breakout is confirmed by a closing price break—this provides an extra layer of validation compared with only looking at intraday price increases.
Volume also picked up: the volume at 17:00 was 2.58 times that at 16:00. And it didn’t fade back at 18:00—it added about another 4%. This is an expansion in traded volume, which doesn’t necessarily mean net inflows.
Next, watch whether 118.44 can turn from the previous high into a support/resistance pivot that gets accepted and held. After backtesting, only if hourly closes continue to hold above it should you look for continuation; if it closes back below the 16:00 high of 117.56, then this breakout observation is invalidated. Chasing right after a sudden rise often runs into profit-taking pullbacks.
You can open the SOL spot 1-hour chart and track the next retest. Don’t treat the unclosed 19:00 candle as confirmation.
Source: Binance SOL/USDT spot, Sep 25 at 19:02 (UTC+8).
https://www.binance.com/en/trade/SOL_USDT?type=spot
On Binance spot, at 10:00 it touched 118.44 then closed lower; at 17:00 it surged again but still closed below that level; only at 18:00 did it close up to 119.18. After two tests of the high, the breakout is confirmed by a closing price break—this provides an extra layer of validation compared with only looking at intraday price increases.
Volume also picked up: the volume at 17:00 was 2.58 times that at 16:00. And it didn’t fade back at 18:00—it added about another 4%. This is an expansion in traded volume, which doesn’t necessarily mean net inflows.
Next, watch whether 118.44 can turn from the previous high into a support/resistance pivot that gets accepted and held. After backtesting, only if hourly closes continue to hold above it should you look for continuation; if it closes back below the 16:00 high of 117.56, then this breakout observation is invalidated. Chasing right after a sudden rise often runs into profit-taking pullbacks.
You can open the SOL spot 1-hour chart and track the next retest. Don’t treat the unclosed 19:00 candle as confirmation.
Source: Binance SOL/USDT spot, Sep 25 at 19:02 (UTC+8).
https://www.binance.com/en/trade/SOL_USDT?type=spot
96
·
--
$BTC After dipping below, it reclaimed the midday range. The short-term repair is worth following, but it is not yet a confirmed reversal.
In Binance spot, the 15:00 hourly candle once dipped to 83750.50 and closed back at 84043.96; at 16:00 it continued higher to 84417.06, breaking above the upper bound of the 11:00 to 14:00 range at 84385.10. The dip did not directly evolve into a continuous decline, which is why renewed attention to buying support is warranted.
However, the 16:00 volume was lower than 15:00, so the recovery cannot yet be described as a volume-backed breakout. If later hourly closes stay above 84385.10, then revisit the morning 10:00 high of 84888; only then will the recovery have room to continue. If price falls back into the midday range, suspend the view that strength will extend. A further drop below 83750.50 would invalidate this rebound-and-reclaim logic.
Open the BTC spot 1-hour chart and focus on the next retest; do not treat the ongoing 17:00 candle as confirmation.
Source: Binance spot market data and hourly candlesticks, Sep 25, 17:03 (UTC+8).https://www.binance.com/en/trade/BTC_USDT?type=spot
$BTC After dipping below, it reclaimed the midday range. The short-term repair is worth following, but it is not yet a confirmed reversal.
In Binance spot, the 15:00 hourly candle once dipped to 83750.50 and closed back at 84043.96; at 16:00 it continued higher to 84417.06, breaking above the upper bound of the 11:00 to 14:00 range at 84385.10. The dip did not directly evolve into a continuous decline, which is why renewed attention to buying support is warranted.
However, the 16:00 volume was lower than 15:00, so the recovery cannot yet be described as a volume-backed breakout. If later hourly closes stay above 84385.10, then revisit the morning 10:00 high of 84888; only then will the recovery have room to continue. If price falls back into the midday range, suspend the view that strength will extend. A further drop below 83750.50 would invalidate this rebound-and-reclaim logic.
Open the BTC spot 1-hour chart and focus on the next retest; do not treat the ongoing 17:00 candle as confirmation.
Source: Binance spot market data and hourly candlesticks, Sep 25, 17:03 (UTC+8).https://www.binance.com/en/trade/BTC_USDT?type=spot
In Binance spot, the 15:00 hourly candle once dipped to 83750.50 and closed back at 84043.96; at 16:00 it continued higher to 84417.06, breaking above the upper bound of the 11:00 to 14:00 range at 84385.10. The dip did not directly evolve into a continuous decline, which is why renewed attention to buying support is warranted.
However, the 16:00 volume was lower than 15:00, so the recovery cannot yet be described as a volume-backed breakout. If later hourly closes stay above 84385.10, then revisit the morning 10:00 high of 84888; only then will the recovery have room to continue. If price falls back into the midday range, suspend the view that strength will extend. A further drop below 83750.50 would invalidate this rebound-and-reclaim logic.
Open the BTC spot 1-hour chart and focus on the next retest; do not treat the ongoing 17:00 candle as confirmation.
Source: Binance spot market data and hourly candlesticks, Sep 25, 17:03 (UTC+8).https://www.binance.com/en/trade/BTC_USDT?type=spot

106
·
--
$PHA After the afternoon two waves of increased volume, the price regained the morning high. For the short-term, the more worth tracking is the continuation after a pullback—not chasing just because you see a rally.
On Binance spot’s 1-hour chart, from 09 to 11 the candles kept closing lower continuously, and by 12 it stopped falling; then from 13 to 14 the candles closed higher one after another, ending at $0.0534 and $0.0568 respectively—both above the 08:00 high of $0.0522. At 14:00, the trading volume was also about 35% higher than at 13:00. This shift upward is supported by continuous volume, but volume is not the same as net inflow of funds.
Next, watch whether 0.0522 can turn from the former high into a support/holding area. After it holds, then see whether the 1-hour close can break above the afternoon high at 0.0584—only then can we continue discussing an upward extension. If the 1-hour close falls back below 0.0522, the breakout-continuation thesis is invalid. After a two-hour surge, the amplitude has expanded; don’t treat the spike at the highs as “standing firm.”
Open the PHA spot 1-hour chart and focus on these two conditions. This is for market observation only and does not indicate that positions have been opened.
Source: Binance spot and publicly available candlesticks, Sept 25 at 15:04 (UTC+8), last candle not yet closed.
https://www.binance.com/en/trade/PHA_USDT?type=spot
$PHA After the afternoon two waves of increased volume, the price regained the morning high. For the short-term, the more worth tracking is the continuation after a pullback—not chasing just because you see a rally.
On Binance spot’s 1-hour chart, from 09 to 11 the candles kept closing lower continuously, and by 12 it stopped falling; then from 13 to 14 the candles closed higher one after another, ending at $0.0534 and $0.0568 respectively—both above the 08:00 high of $0.0522. At 14:00, the trading volume was also about 35% higher than at 13:00. This shift upward is supported by continuous volume, but volume is not the same as net inflow of funds.
Next, watch whether 0.0522 can turn from the former high into a support/holding area. After it holds, then see whether the 1-hour close can break above the afternoon high at 0.0584—only then can we continue discussing an upward extension. If the 1-hour close falls back below 0.0522, the breakout-continuation thesis is invalid. After a two-hour surge, the amplitude has expanded; don’t treat the spike at the highs as “standing firm.”
Open the PHA spot 1-hour chart and focus on these two conditions. This is for market observation only and does not indicate that positions have been opened.
Source: Binance spot and publicly available candlesticks, Sept 25 at 15:04 (UTC+8), last candle not yet closed.
https://www.binance.com/en/trade/PHA_USDT?type=spot
On Binance spot’s 1-hour chart, from 09 to 11 the candles kept closing lower continuously, and by 12 it stopped falling; then from 13 to 14 the candles closed higher one after another, ending at $0.0534 and $0.0568 respectively—both above the 08:00 high of $0.0522. At 14:00, the trading volume was also about 35% higher than at 13:00. This shift upward is supported by continuous volume, but volume is not the same as net inflow of funds.
Next, watch whether 0.0522 can turn from the former high into a support/holding area. After it holds, then see whether the 1-hour close can break above the afternoon high at 0.0584—only then can we continue discussing an upward extension. If the 1-hour close falls back below 0.0522, the breakout-continuation thesis is invalid. After a two-hour surge, the amplitude has expanded; don’t treat the spike at the highs as “standing firm.”
Open the PHA spot 1-hour chart and focus on these two conditions. This is for market observation only and does not indicate that positions have been opened.
Source: Binance spot and publicly available candlesticks, Sept 25 at 15:04 (UTC+8), last candle not yet closed.
https://www.binance.com/en/trade/PHA_USDT?type=spot

1
96
·
--
$QNT After moving sideways for several hours, two consecutive hourly candles closed above the previous high. The near-term bullish strength is worth tracking; the key is whether this breakout can hold on with volume staying outside the original range.
On Binance spot today, from 6 to around 10 a.m., multiple attempts were made to test the high, reaching 91.96 USDT at the top. Yet the closes all stayed around 90. At 11 a.m. it finally closed at 93.79, and at 12 p.m. it closed again at 97.48. Trading volume expanded to 2.32 times that of the previous hour. This time, there are consecutive closes with volume confirmation—it's not just a quick touch of the upper wick.
In the same time window, Bitcoin was still consolidating near the lows after dropping around 10 a.m. So for now, we can't interpret QNT’s independent outperformance as the entire market turning bullish.
Next, watch 91.96—the top boundary of the prior sideways range. If pullbacks can still hold above it, that keeps the continuation thesis intact. When retesting the 12 p.m. high at 98.50, focus on the hourly close rather than just the price momentarily touched. If the price closes back below 91.96, the logic behind this breakout fails. After the rally, the amplitude has already expanded—strongness doesn’t automatically mean it’s safe to chase.
Source: Binance spot QNT/USDT hourly chart, collected Sep 25 at 13:04 (UTC+8), and the 1 p.m. candle had not closed.
https://www.binance.com/en/trade/QNT_USDT?type=spot
$QNT After moving sideways for several hours, two consecutive hourly candles closed above the previous high. The near-term bullish strength is worth tracking; the key is whether this breakout can hold on with volume staying outside the original range.
On Binance spot today, from 6 to around 10 a.m., multiple attempts were made to test the high, reaching 91.96 USDT at the top. Yet the closes all stayed around 90. At 11 a.m. it finally closed at 93.79, and at 12 p.m. it closed again at 97.48. Trading volume expanded to 2.32 times that of the previous hour. This time, there are consecutive closes with volume confirmation—it's not just a quick touch of the upper wick.
In the same time window, Bitcoin was still consolidating near the lows after dropping around 10 a.m. So for now, we can't interpret QNT’s independent outperformance as the entire market turning bullish.
Next, watch 91.96—the top boundary of the prior sideways range. If pullbacks can still hold above it, that keeps the continuation thesis intact. When retesting the 12 p.m. high at 98.50, focus on the hourly close rather than just the price momentarily touched. If the price closes back below 91.96, the logic behind this breakout fails. After the rally, the amplitude has already expanded—strongness doesn’t automatically mean it’s safe to chase.
Source: Binance spot QNT/USDT hourly chart, collected Sep 25 at 13:04 (UTC+8), and the 1 p.m. candle had not closed.
https://www.binance.com/en/trade/QNT_USDT?type=spot
On Binance spot today, from 6 to around 10 a.m., multiple attempts were made to test the high, reaching 91.96 USDT at the top. Yet the closes all stayed around 90. At 11 a.m. it finally closed at 93.79, and at 12 p.m. it closed again at 97.48. Trading volume expanded to 2.32 times that of the previous hour. This time, there are consecutive closes with volume confirmation—it's not just a quick touch of the upper wick.
In the same time window, Bitcoin was still consolidating near the lows after dropping around 10 a.m. So for now, we can't interpret QNT’s independent outperformance as the entire market turning bullish.
Next, watch 91.96—the top boundary of the prior sideways range. If pullbacks can still hold above it, that keeps the continuation thesis intact. When retesting the 12 p.m. high at 98.50, focus on the hourly close rather than just the price momentarily touched. If the price closes back below 91.96, the logic behind this breakout fails. After the rally, the amplitude has already expanded—strongness doesn’t automatically mean it’s safe to chase.
Source: Binance spot QNT/USDT hourly chart, collected Sep 25 at 13:04 (UTC+8), and the 1 p.m. candle had not closed.
https://www.binance.com/en/trade/QNT_USDT?type=spot

111
·
--
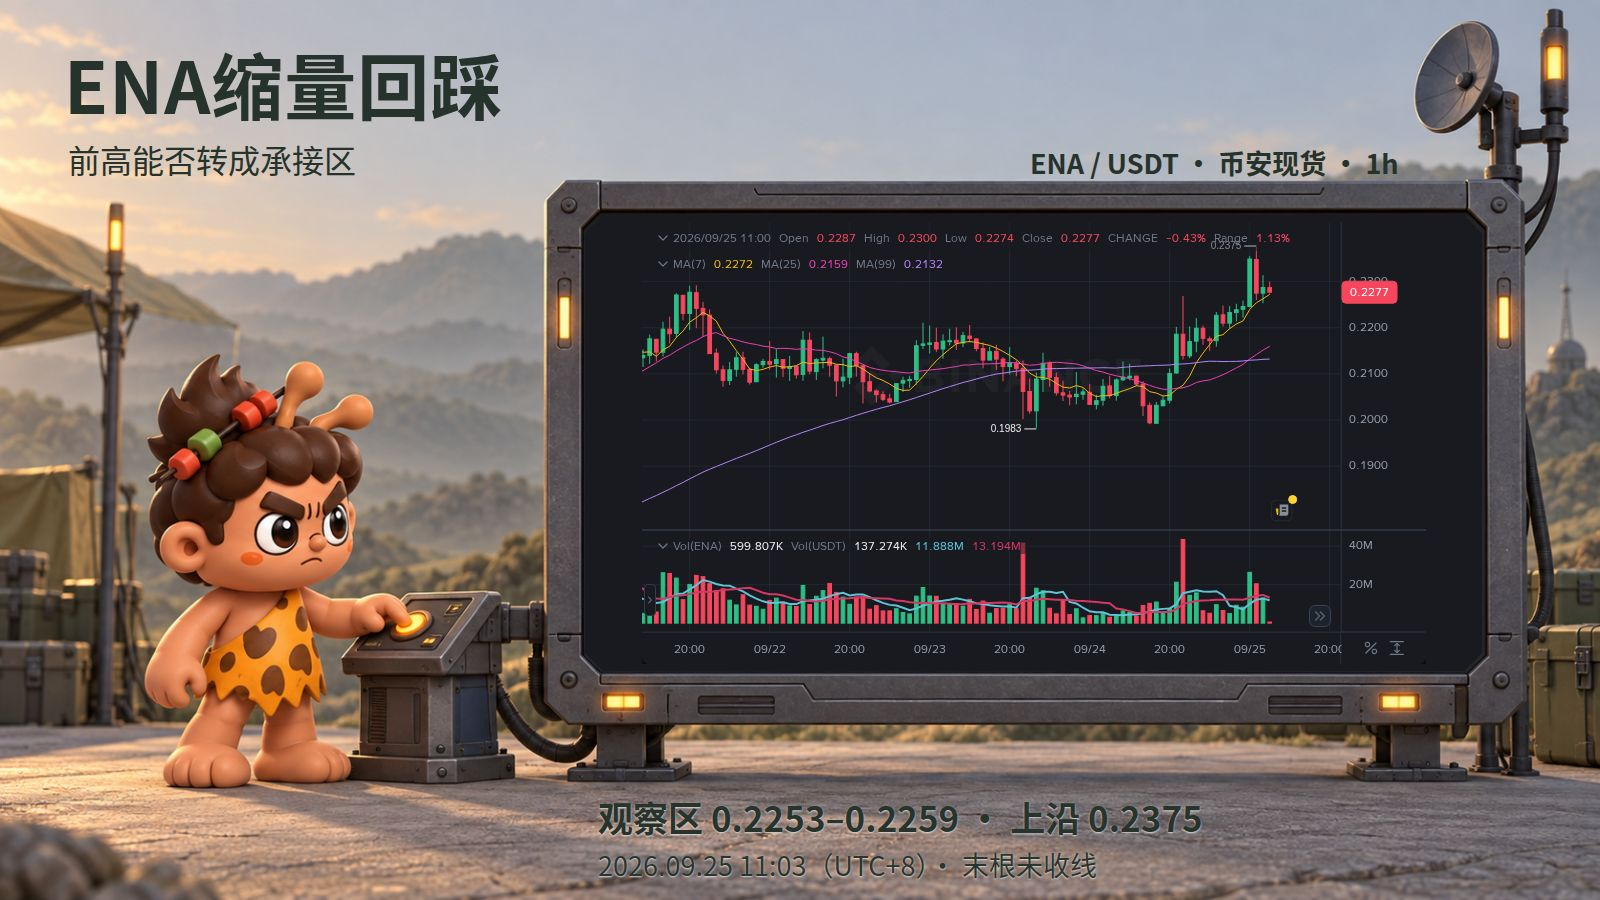
$ENA After a strong volume-driven rally, the pullback volume has contracted for two consecutive hours. The more worthwhile setup to watch is the transition from prior high to support, rather than chasing the big bullish candle from the morning.
At 8:00 Beijing time, ENA closed at 0.2349, breaking above the 0.2248 to 0.2259 zone formed by the earlier highs from 4 to 7 o'clock. It then pulled back over the next two hours, with volume by 10:00 down to about half of what it was at 8:00, while the price still closed at 0.2287. Some of the gains were given back, but the original consolidation area has not been reclaimed yet.
In the same hour, Bitcoin pulled back after a surge and closed lower, while ENA closed higher. The short-term bid support appears relatively stronger; however, lower volume alone still does not prove sufficient buying pressure.
Next, watch 0.2253 to 0.2259: these are respectively the 10:00 pullback low and the 7:00 prior high. If this area holds and volume expands again while price closes back above the 9:00 high of 0.2375, continuation will have stronger support. If the hourly close falls below 0.2253, this support observation becomes invalid, and the decline should not be treated as a bargain entry.
Data as of September 25, 11:03 (UTC+8), Binance spot 1-hour chart, latest candle not yet closed. For condition monitoring only, no trade executed.
Source: https://www.binance.com/en/trade/ENA_USDT?type=spot
$ENA After a strong volume-driven rally, the pullback volume has contracted for two consecutive hours. The more worthwhile setup to watch is the transition from prior high to support, rather than chasing the big bullish candle from the morning.
At 8:00 Beijing time, ENA closed at 0.2349, breaking above the 0.2248 to 0.2259 zone formed by the earlier highs from 4 to 7 o'clock. It then pulled back over the next two hours, with volume by 10:00 down to about half of what it was at 8:00, while the price still closed at 0.2287. Some of the gains were given back, but the original consolidation area has not been reclaimed yet.
In the same hour, Bitcoin pulled back after a surge and closed lower, while ENA closed higher. The short-term bid support appears relatively stronger; however, lower volume alone still does not prove sufficient buying pressure.
Next, watch 0.2253 to 0.2259: these are respectively the 10:00 pullback low and the 7:00 prior high. If this area holds and volume expands again while price closes back above the 9:00 high of 0.2375, continuation will have stronger support. If the hourly close falls below 0.2253, this support observation becomes invalid, and the decline should not be treated as a bargain entry.
Data as of September 25, 11:03 (UTC+8), Binance spot 1-hour chart, latest candle not yet closed. For condition monitoring only, no trade executed.
Source: https://www.binance.com/en/trade/ENA_USDT?type=spot
At 8:00 Beijing time, ENA closed at 0.2349, breaking above the 0.2248 to 0.2259 zone formed by the earlier highs from 4 to 7 o'clock. It then pulled back over the next two hours, with volume by 10:00 down to about half of what it was at 8:00, while the price still closed at 0.2287. Some of the gains were given back, but the original consolidation area has not been reclaimed yet.
In the same hour, Bitcoin pulled back after a surge and closed lower, while ENA closed higher. The short-term bid support appears relatively stronger; however, lower volume alone still does not prove sufficient buying pressure.
Next, watch 0.2253 to 0.2259: these are respectively the 10:00 pullback low and the 7:00 prior high. If this area holds and volume expands again while price closes back above the 9:00 high of 0.2375, continuation will have stronger support. If the hourly close falls below 0.2253, this support observation becomes invalid, and the decline should not be treated as a bargain entry.
Data as of September 25, 11:03 (UTC+8), Binance spot 1-hour chart, latest candle not yet closed. For condition monitoring only, no trade executed.
Source: https://www.binance.com/en/trade/ENA_USDT?type=spot
119
·
--
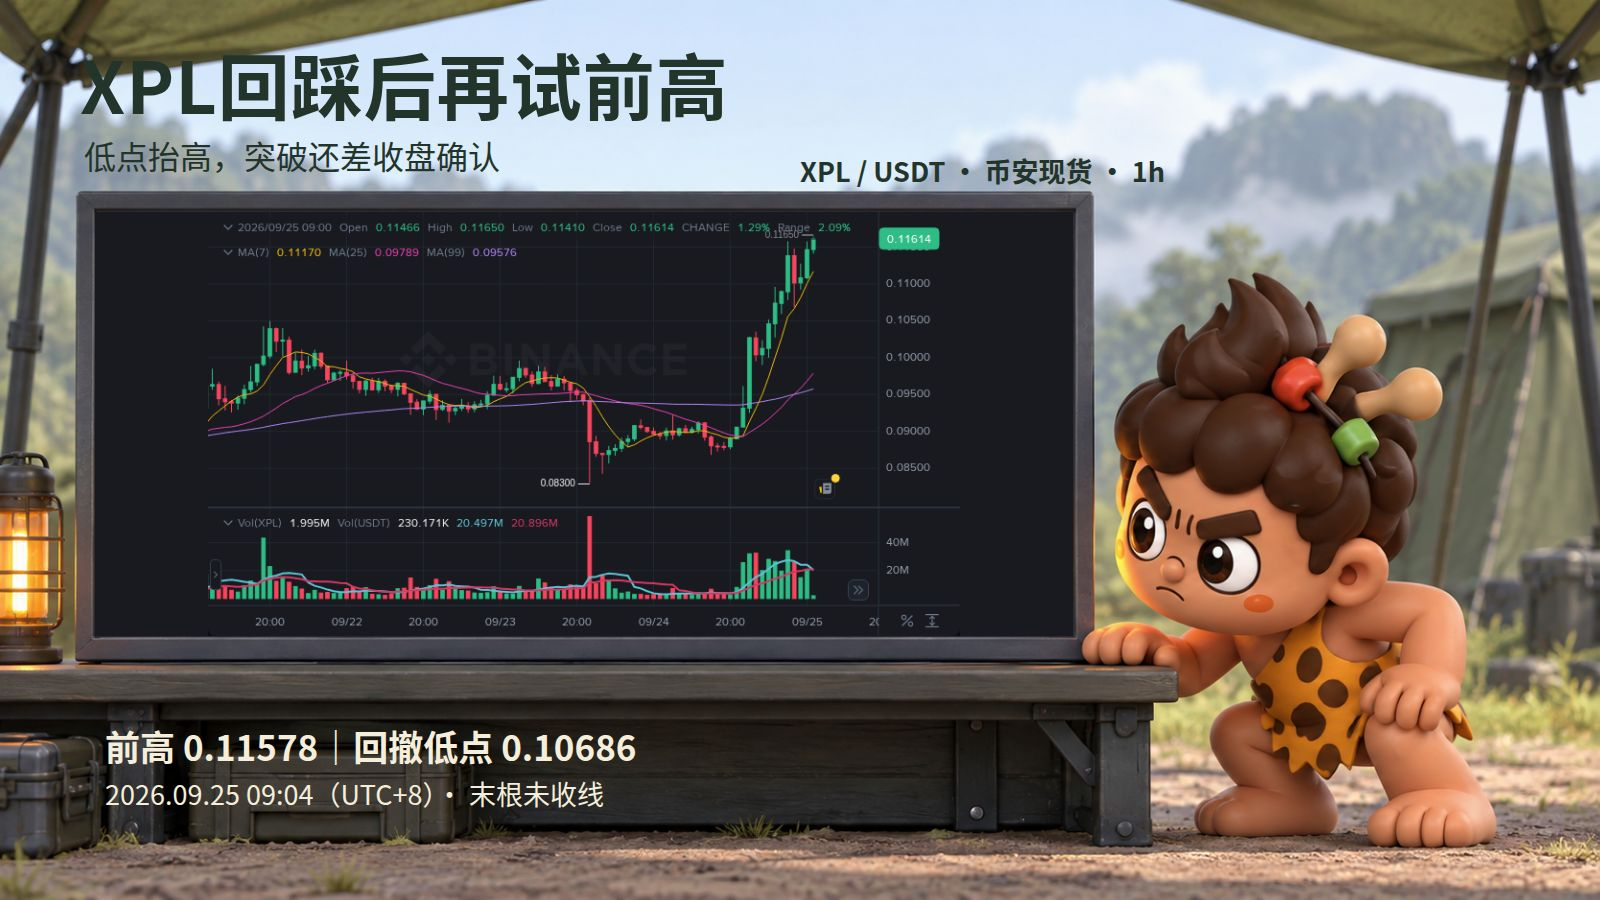
After a pullback, $XPL is approaching its previous high again, suggesting a potential second upward move. We'll wait for confirmation from the hourly close.
Binance Spot reached 0.11578 at 5 AM today, then pulled back to 0.10686 at 6 AM. The subsequent two hourly lows rose consecutively, closing at 0.11466 at 8 AM, bringing the price back near the previous high. The pullback didn't immediately turn into a sharp decline.
However, the volume for the second upward move hasn't caught up: the volume at 8 AM was about 35% higher than at 7 AM, but only 59% of that at 5 AM. This is evidence of a correction, not a confirmed breakout.
Next, watch 0.11578: a close above this level on the hourly chart, followed by a pullback that doesn't fall back, would be more convincing for a continuation of the upward trend. If it falls below the 0.10686 low (the pullback low at 6 AM), the observation of this rising low becomes invalid. Even if it rises and then falls back below the previous high, don't assume it has stabilized.
Open the 1-hour chart for XPL, look at the closing price and backtesting, and avoid chasing the peaks that haven't closed yet. Only spot trading is observed; no open interest is displayed.
Data/Chart Source: Binance XPL/USDT Spot, September 25th, 09:04 (UTC+8), last unclosed candle.
https://www.binance.com/en/trade/XPL_USDT?type=spot
After a pullback, $XPL is approaching its previous high again, suggesting a potential second upward move. We'll wait for confirmation from the hourly close.
Binance Spot reached 0.11578 at 5 AM today, then pulled back to 0.10686 at 6 AM. The subsequent two hourly lows rose consecutively, closing at 0.11466 at 8 AM, bringing the price back near the previous high. The pullback didn't immediately turn into a sharp decline.
However, the volume for the second upward move hasn't caught up: the volume at 8 AM was about 35% higher than at 7 AM, but only 59% of that at 5 AM. This is evidence of a correction, not a confirmed breakout.
Next, watch 0.11578: a close above this level on the hourly chart, followed by a pullback that doesn't fall back, would be more convincing for a continuation of the upward trend. If it falls below the 0.10686 low (the pullback low at 6 AM), the observation of this rising low becomes invalid. Even if it rises and then falls back below the previous high, don't assume it has stabilized.
Open the 1-hour chart for XPL, look at the closing price and backtesting, and avoid chasing the peaks that haven't closed yet. Only spot trading is observed; no open interest is displayed.
Data/Chart Source: Binance XPL/USDT Spot, September 25th, 09:04 (UTC+8), last unclosed candle.
https://www.binance.com/en/trade/XPL_USDT?type=spot
Binance Spot reached 0.11578 at 5 AM today, then pulled back to 0.10686 at 6 AM. The subsequent two hourly lows rose consecutively, closing at 0.11466 at 8 AM, bringing the price back near the previous high. The pullback didn't immediately turn into a sharp decline.
However, the volume for the second upward move hasn't caught up: the volume at 8 AM was about 35% higher than at 7 AM, but only 59% of that at 5 AM. This is evidence of a correction, not a confirmed breakout.
Next, watch 0.11578: a close above this level on the hourly chart, followed by a pullback that doesn't fall back, would be more convincing for a continuation of the upward trend. If it falls below the 0.10686 low (the pullback low at 6 AM), the observation of this rising low becomes invalid. Even if it rises and then falls back below the previous high, don't assume it has stabilized.
Open the 1-hour chart for XPL, look at the closing price and backtesting, and avoid chasing the peaks that haven't closed yet. Only spot trading is observed; no open interest is displayed.
Data/Chart Source: Binance XPL/USDT Spot, September 25th, 09:04 (UTC+8), last unclosed candle.
https://www.binance.com/en/trade/XPL_USDT?type=spot
125
·
--
$FET Consecutive three hours of increased volume and higher closes—what’s more worth tracking tonight is a strong pullback, not chasing the gains.
On Binance spot market hours 20:00 to 22:00 (Beijing time), the hourly trading volume rises step by step. At 22:00 it is 2.71 times that of 21:00. It closes at 0.2165, breaking above the previous hour’s high of 0.2072. In the same hour, after Bitcoin spikes higher it closes lower; FET still closes higher—local strength is temporarily preserved.
Next, watch whether 0.2072 can turn from the previous high into a support level: a pullback with shrinking volume, and an hourly close that stays above it—would provide the basis to further test the 22:00 high of 0.2239. If it closes back below 0.2072, first revoke the judgment of a strong continuation. At 22:00 there is an upper wick; higher volume doesn’t necessarily mean it will inevitably rise afterward. The page also flags the risk of high volatility.
Open the FET hourly chart and focus on whether this pullback has support. Only observe the spot market in terms of price action.
Source: Binance FET/USDT spot and publicly available hourly K-line data; collected at 23:06 UTC+8 on Sep 24, and the 23:00 candle has not closed.
https://www.binance.com/en/trade/FET_USDT?type=spot
$FET Consecutive three hours of increased volume and higher closes—what’s more worth tracking tonight is a strong pullback, not chasing the gains.
On Binance spot market hours 20:00 to 22:00 (Beijing time), the hourly trading volume rises step by step. At 22:00 it is 2.71 times that of 21:00. It closes at 0.2165, breaking above the previous hour’s high of 0.2072. In the same hour, after Bitcoin spikes higher it closes lower; FET still closes higher—local strength is temporarily preserved.
Next, watch whether 0.2072 can turn from the previous high into a support level: a pullback with shrinking volume, and an hourly close that stays above it—would provide the basis to further test the 22:00 high of 0.2239. If it closes back below 0.2072, first revoke the judgment of a strong continuation. At 22:00 there is an upper wick; higher volume doesn’t necessarily mean it will inevitably rise afterward. The page also flags the risk of high volatility.
Open the FET hourly chart and focus on whether this pullback has support. Only observe the spot market in terms of price action.
Source: Binance FET/USDT spot and publicly available hourly K-line data; collected at 23:06 UTC+8 on Sep 24, and the 23:00 candle has not closed.
https://www.binance.com/en/trade/FET_USDT?type=spot
On Binance spot market hours 20:00 to 22:00 (Beijing time), the hourly trading volume rises step by step. At 22:00 it is 2.71 times that of 21:00. It closes at 0.2165, breaking above the previous hour’s high of 0.2072. In the same hour, after Bitcoin spikes higher it closes lower; FET still closes higher—local strength is temporarily preserved.
Next, watch whether 0.2072 can turn from the previous high into a support level: a pullback with shrinking volume, and an hourly close that stays above it—would provide the basis to further test the 22:00 high of 0.2239. If it closes back below 0.2072, first revoke the judgment of a strong continuation. At 22:00 there is an upper wick; higher volume doesn’t necessarily mean it will inevitably rise afterward. The page also flags the risk of high volatility.
Open the FET hourly chart and focus on whether this pullback has support. Only observe the spot market in terms of price action.
Source: Binance FET/USDT spot and publicly available hourly K-line data; collected at 23:06 UTC+8 on Sep 24, and the 23:00 candle has not closed.
https://www.binance.com/en/trade/FET_USDT?type=spot

98
·
--
$ONDO Breakout volume recovers the afternoon pre-high; tonight focus on the consolidation after the breakout.
Binance spot 20:00 hourly line closed up 6.59%, at 0.4564, surpassing the 15:00 high of 0.4433. Previously there was a continuous pullback from 16:00 and 17:00; from 18:00 and 19:00 it slowly repaired, and this candle recovered the afternoon decline.
The trading volume is 12.18 times the average volume of the previous six hourly candles. The breakout has volume confirmation. However, after spiking to 0.4710, it gave back the gains—breakout volume doesn’t yet mean it’s fully been held.
Bullish conditions: pull back to around 0.4433 and hold it; if the hourly close remains above it, then watch whether it can absorb the sell pressure from 0.4710. If the hourly close falls back below 0.4433, then the continuation of the breakout judgment should be withdrawn—don’t chase and buy the upper shadow. Open the market tracker and watch the next candle close.
Source: Binance spot 1h chart and public K-line interface; collected at 21:04 on Sep 24 (UTC+8), with the 21:00 line not yet closed.
https://www.binance.com/en/trade/ONDO_USDT?type=spot
$ONDO Breakout volume recovers the afternoon pre-high; tonight focus on the consolidation after the breakout.
Binance spot 20:00 hourly line closed up 6.59%, at 0.4564, surpassing the 15:00 high of 0.4433. Previously there was a continuous pullback from 16:00 and 17:00; from 18:00 and 19:00 it slowly repaired, and this candle recovered the afternoon decline.
The trading volume is 12.18 times the average volume of the previous six hourly candles. The breakout has volume confirmation. However, after spiking to 0.4710, it gave back the gains—breakout volume doesn’t yet mean it’s fully been held.
Bullish conditions: pull back to around 0.4433 and hold it; if the hourly close remains above it, then watch whether it can absorb the sell pressure from 0.4710. If the hourly close falls back below 0.4433, then the continuation of the breakout judgment should be withdrawn—don’t chase and buy the upper shadow. Open the market tracker and watch the next candle close.
Source: Binance spot 1h chart and public K-line interface; collected at 21:04 on Sep 24 (UTC+8), with the 21:00 line not yet closed.
https://www.binance.com/en/trade/ONDO_USDT?type=spot
Binance spot 20:00 hourly line closed up 6.59%, at 0.4564, surpassing the 15:00 high of 0.4433. Previously there was a continuous pullback from 16:00 and 17:00; from 18:00 and 19:00 it slowly repaired, and this candle recovered the afternoon decline.
The trading volume is 12.18 times the average volume of the previous six hourly candles. The breakout has volume confirmation. However, after spiking to 0.4710, it gave back the gains—breakout volume doesn’t yet mean it’s fully been held.
Bullish conditions: pull back to around 0.4433 and hold it; if the hourly close remains above it, then watch whether it can absorb the sell pressure from 0.4710. If the hourly close falls back below 0.4433, then the continuation of the breakout judgment should be withdrawn—don’t chase and buy the upper shadow. Open the market tracker and watch the next candle close.
Source: Binance spot 1h chart and public K-line interface; collected at 21:04 on Sep 24 (UTC+8), with the 21:00 line not yet closed.
https://www.binance.com/en/trade/ONDO_USDT?type=spot

1
55
·
--
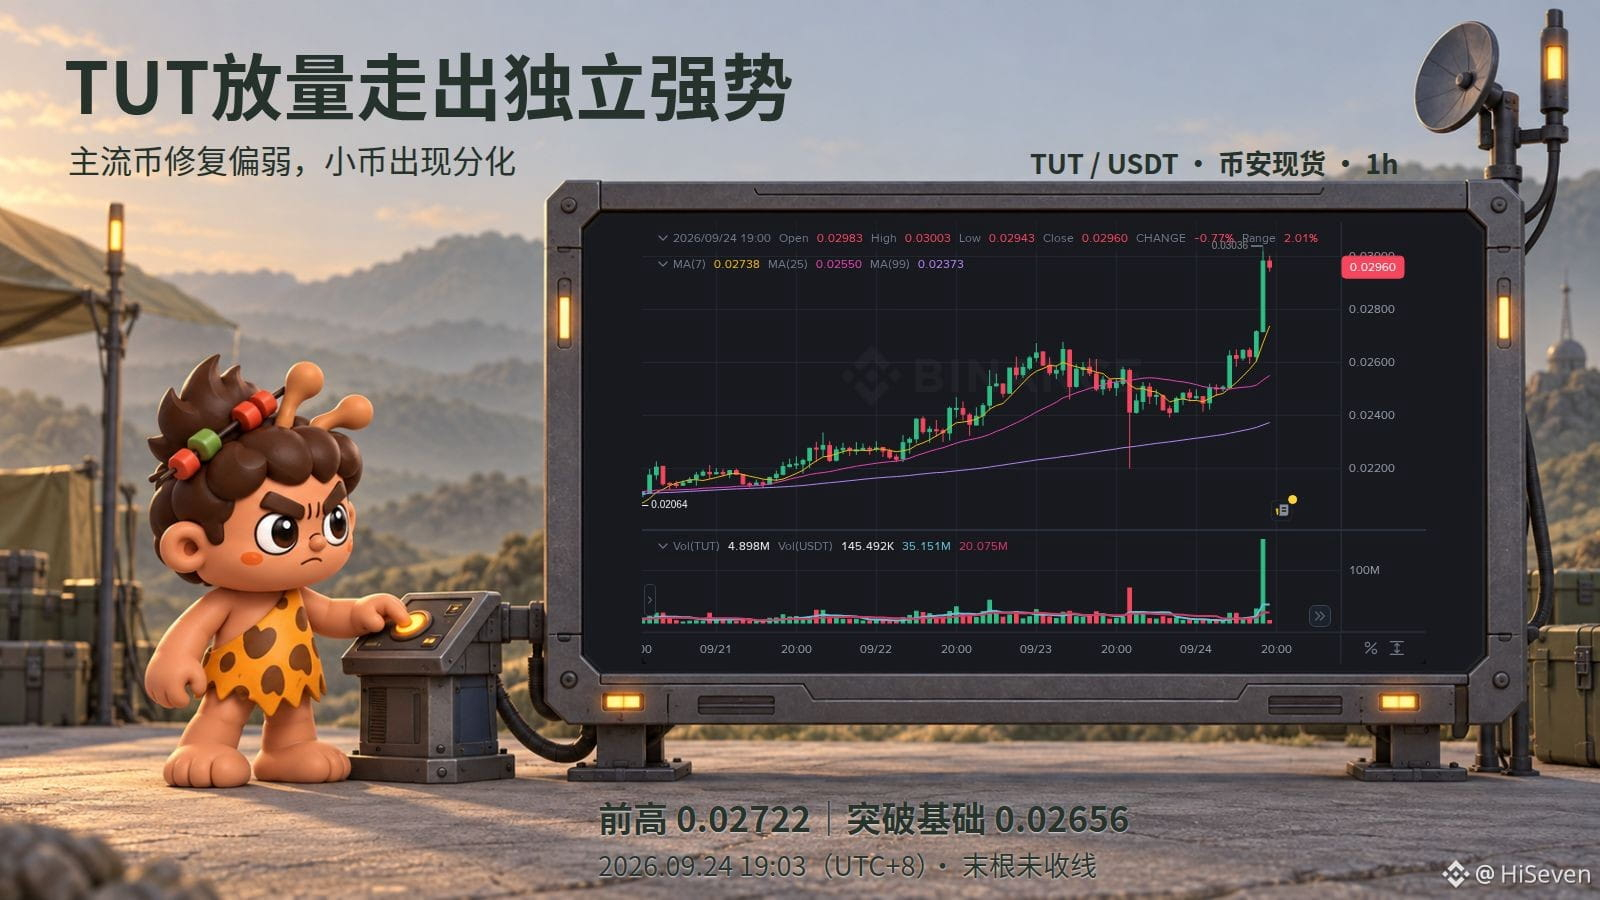
$TUT Volume expansion breaks out of independent strength. What is worth关注 is the continuation opportunity after the strength-weakness divergence—not chasing the very last big bullish candle.
On Binance spot, the 17:00 hourly line first closed above the platform high between 13:00 and 16:00 at 0.02656, and at 18:00 it closed again at 0.02983. The trading volume is 5.95 times that of the previous hour. In the same hour, while Bitcoin and Ethereum both rebounded, neither managed to reclaim the 17:00 high.
This stretch of strength in TUT has price-volume evidence, but you cannot use it to conclude that the entire market has turned stronger.
Focus more on whether, when it pulls back to the previous 17:00 breakout area near 0.02722, it can absorb with reduced volume and then close back above it—this step has not happened yet. If the hourly close falls back below the platform high of 0.02656, the judgment that this breakout continuation will play out becomes invalid. A sudden volume-driven surge will also amplify the pullback. At 19:00 it still hasn’t closed; don’t treat intraday changes as confirmation.
You can open TUT’s 1-hour chart to track these two conditions—no need to chase the gainers list.
Source: Binance spot market data, September 24 at 19:04 (UTC+8).
https://www.binance.com/en/trade/TUT_USDT?type=spot
$TUT Volume expansion breaks out of independent strength. What is worth关注 is the continuation opportunity after the strength-weakness divergence—not chasing the very last big bullish candle.
On Binance spot, the 17:00 hourly line first closed above the platform high between 13:00 and 16:00 at 0.02656, and at 18:00 it closed again at 0.02983. The trading volume is 5.95 times that of the previous hour. In the same hour, while Bitcoin and Ethereum both rebounded, neither managed to reclaim the 17:00 high.
This stretch of strength in TUT has price-volume evidence, but you cannot use it to conclude that the entire market has turned stronger.
Focus more on whether, when it pulls back to the previous 17:00 breakout area near 0.02722, it can absorb with reduced volume and then close back above it—this step has not happened yet. If the hourly close falls back below the platform high of 0.02656, the judgment that this breakout continuation will play out becomes invalid. A sudden volume-driven surge will also amplify the pullback. At 19:00 it still hasn’t closed; don’t treat intraday changes as confirmation.
You can open TUT’s 1-hour chart to track these two conditions—no need to chase the gainers list.
Source: Binance spot market data, September 24 at 19:04 (UTC+8).
https://www.binance.com/en/trade/TUT_USDT?type=spot
On Binance spot, the 17:00 hourly line first closed above the platform high between 13:00 and 16:00 at 0.02656, and at 18:00 it closed again at 0.02983. The trading volume is 5.95 times that of the previous hour. In the same hour, while Bitcoin and Ethereum both rebounded, neither managed to reclaim the 17:00 high.
This stretch of strength in TUT has price-volume evidence, but you cannot use it to conclude that the entire market has turned stronger.
Focus more on whether, when it pulls back to the previous 17:00 breakout area near 0.02722, it can absorb with reduced volume and then close back above it—this step has not happened yet. If the hourly close falls back below the platform high of 0.02656, the judgment that this breakout continuation will play out becomes invalid. A sudden volume-driven surge will also amplify the pullback. At 19:00 it still hasn’t closed; don’t treat intraday changes as confirmation.
You can open TUT’s 1-hour chart to track these two conditions—no need to chase the gainers list.
Source: Binance spot market data, September 24 at 19:04 (UTC+8).
https://www.binance.com/en/trade/TUT_USDT?type=spot
149
·
--
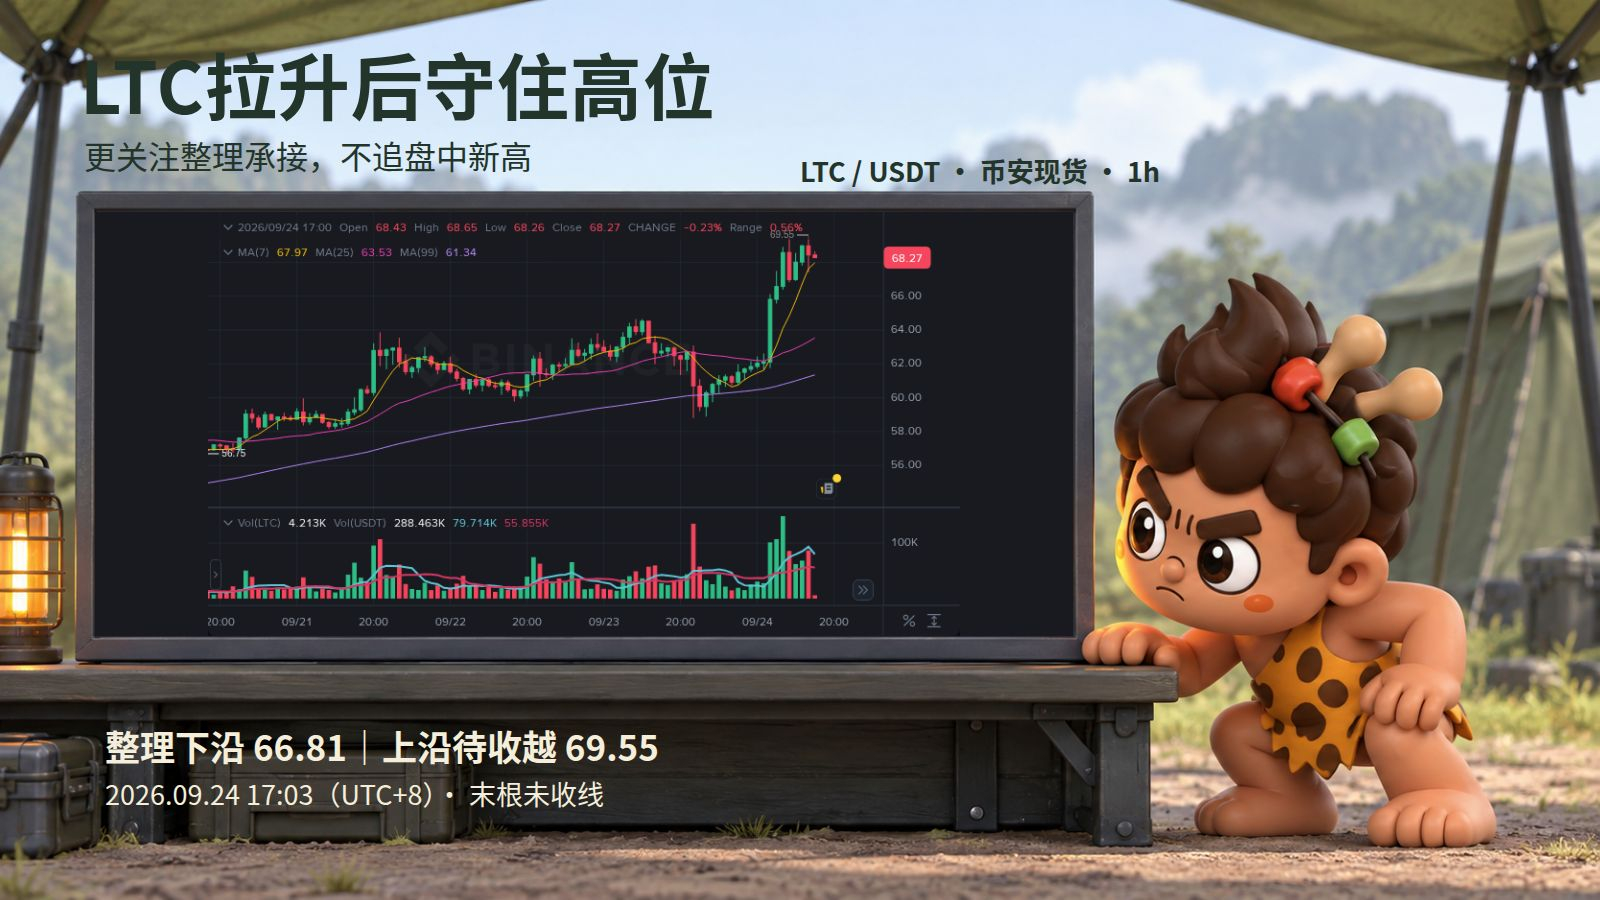
$LTC this morning saw a continuous surge with expanding volume; after noon, the four consecutive hourly candles still held within the high-level consolidation zone. What’s even more worth watching is the continuation opportunity after consolidation—not chasing the just-broken intraday new highs.
On Binance spot from 10:00 to 12:00, prices closed higher continuously and volume increased hour by hour; from 13:00 to 16:00, the volume each hour stayed lower than at 12:00, and the pullback has not yet absorbed the morning’s gains. This is the basis for a bullish read, but it doesn’t mean the uptrend has already restarted.
After pushing to 69.55 at 16:00, it closed at 68.43, indicating there is still selling pressure near the upper edge. First, watch whether the consolidation low formed at 13:00—66.81—can continue to hold; later, if hourly candles show expansion in volume and close above 69.55, the evidence for continuation will be stronger. If an hourly close breaks below 66.81, cancel this round of the “high-level support/continuation” view, and don’t explain any drop back as just a shakeout.
Open the LTC spot 1-hour chart and track these two conditions only. The broader market is concurrently weaker, and even independent strength could get interrupted.
Source: Binance spot; collected at 17:03 on Sep 24 (UTC+8), and the 17:00 candle has not closed.
https://www.binance.com/en/trade/LTC_USDT?type=spot
$LTC this morning saw a continuous surge with expanding volume; after noon, the four consecutive hourly candles still held within the high-level consolidation zone. What’s even more worth watching is the continuation opportunity after consolidation—not chasing the just-broken intraday new highs.
On Binance spot from 10:00 to 12:00, prices closed higher continuously and volume increased hour by hour; from 13:00 to 16:00, the volume each hour stayed lower than at 12:00, and the pullback has not yet absorbed the morning’s gains. This is the basis for a bullish read, but it doesn’t mean the uptrend has already restarted.
After pushing to 69.55 at 16:00, it closed at 68.43, indicating there is still selling pressure near the upper edge. First, watch whether the consolidation low formed at 13:00—66.81—can continue to hold; later, if hourly candles show expansion in volume and close above 69.55, the evidence for continuation will be stronger. If an hourly close breaks below 66.81, cancel this round of the “high-level support/continuation” view, and don’t explain any drop back as just a shakeout.
Open the LTC spot 1-hour chart and track these two conditions only. The broader market is concurrently weaker, and even independent strength could get interrupted.
Source: Binance spot; collected at 17:03 on Sep 24 (UTC+8), and the 17:00 candle has not closed.
https://www.binance.com/en/trade/LTC_USDT?type=spot
On Binance spot from 10:00 to 12:00, prices closed higher continuously and volume increased hour by hour; from 13:00 to 16:00, the volume each hour stayed lower than at 12:00, and the pullback has not yet absorbed the morning’s gains. This is the basis for a bullish read, but it doesn’t mean the uptrend has already restarted.
After pushing to 69.55 at 16:00, it closed at 68.43, indicating there is still selling pressure near the upper edge. First, watch whether the consolidation low formed at 13:00—66.81—can continue to hold; later, if hourly candles show expansion in volume and close above 69.55, the evidence for continuation will be stronger. If an hourly close breaks below 66.81, cancel this round of the “high-level support/continuation” view, and don’t explain any drop back as just a shakeout.
Open the LTC spot 1-hour chart and track these two conditions only. The broader market is concurrently weaker, and even independent strength could get interrupted.
Source: Binance spot; collected at 17:03 on Sep 24 (UTC+8), and the 17:00 candle has not closed.
https://www.binance.com/en/trade/LTC_USDT?type=spot
80
·
--
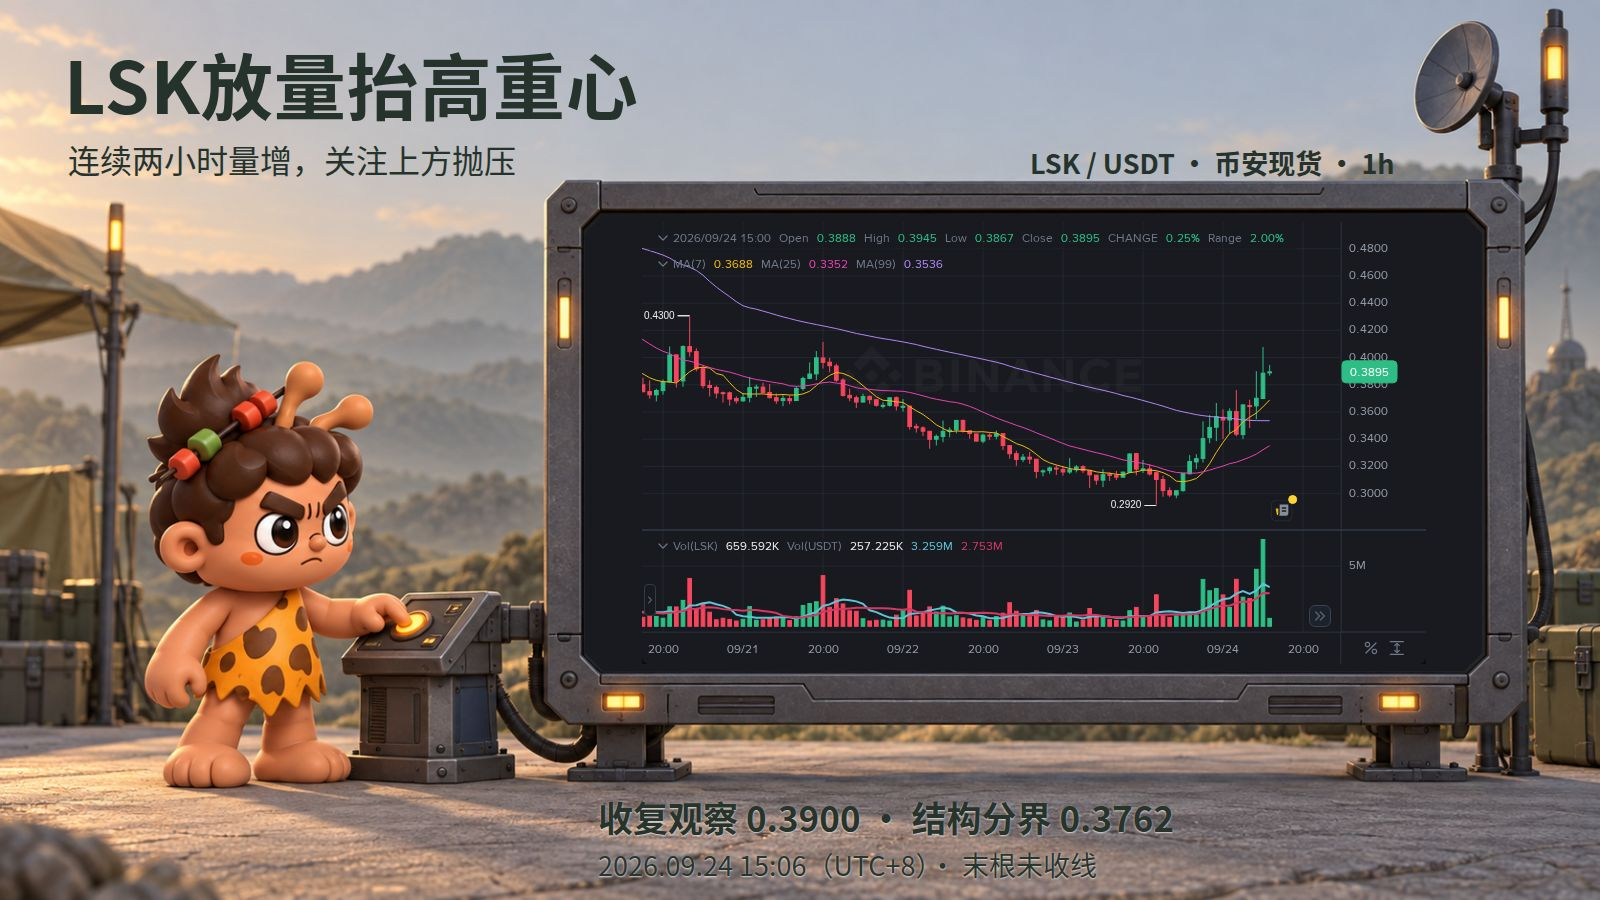
$LSK 连续两小时放量抬高重心,偏多机会值得跟,但0.3900还没拿稳。
币安现货今天13点、14点两根小时线连续收高,成交量也逐根增加;14点量是13点的1.52倍,收在0.3885,越过上午10点留下的0.3762高点。价格和成交一起推进,比单根拉升更值得追踪。
上方仍有抛压:14点冲到0.4078后回落,收盘低于13点高点0.3900,不能把冲高当站稳。
接下来关注小时收盘能否站上0.3900,并在回落时守住0.3762。满足才继续看延续;若小时收回0.3762下方,就取消这段偏多观察。LSK带监控标签,波动与风险较高,不按低风险突破看待。
来源:币安现货LSK/USDT,9月24日15:06(UTC+8)采集;15点线未收完。
https://www.binance.com/en/trade/LSK_USDT?type=spot
$LSK 连续两小时放量抬高重心,偏多机会值得跟,但0.3900还没拿稳。
币安现货今天13点、14点两根小时线连续收高,成交量也逐根增加;14点量是13点的1.52倍,收在0.3885,越过上午10点留下的0.3762高点。价格和成交一起推进,比单根拉升更值得追踪。
上方仍有抛压:14点冲到0.4078后回落,收盘低于13点高点0.3900,不能把冲高当站稳。
接下来关注小时收盘能否站上0.3900,并在回落时守住0.3762。满足才继续看延续;若小时收回0.3762下方,就取消这段偏多观察。LSK带监控标签,波动与风险较高,不按低风险突破看待。
来源:币安现货LSK/USDT,9月24日15:06(UTC+8)采集;15点线未收完。
https://www.binance.com/en/trade/LSK_USDT?type=spot
币安现货今天13点、14点两根小时线连续收高,成交量也逐根增加;14点量是13点的1.52倍,收在0.3885,越过上午10点留下的0.3762高点。价格和成交一起推进,比单根拉升更值得追踪。
上方仍有抛压:14点冲到0.4078后回落,收盘低于13点高点0.3900,不能把冲高当站稳。
接下来关注小时收盘能否站上0.3900,并在回落时守住0.3762。满足才继续看延续;若小时收回0.3762下方,就取消这段偏多观察。LSK带监控标签,波动与风险较高,不按低风险突破看待。
来源:币安现货LSK/USDT,9月24日15:06(UTC+8)采集;15点线未收完。
https://www.binance.com/en/trade/LSK_USDT?type=spot
112
Log in to explore more content
Join global crypto users on Binance Square
⚡️ Get latest and useful information about crypto.
💬 Trusted by the world’s largest crypto exchange.
👍 Discover real insights from verified creators.
Email / Phone number
Trending Topics
CircleMints500MUSDCOnSolana
43,738 views
1,143 Discussing
💵 Solana just received another $500M of USDC. But don't make the mistake everyone else is making...
#circlemints500musdconsolana
Circle's USDC Treasury recorded two 250M USDC mints on Solana, creating $500M of fresh supply through its authorized infrastructure.
Circle now reports $75.2B USDC in circulation globally.
But:
A mint is not the same as $500M of fresh market demand.
It tells us Circle created the inventory.
It does not tell us that $500M has already entered Solana DeFi, exchanges, payments or trading.
That's where the interesting signal begins.
Solana's stablecoin economy is already operating at enormous scale, with recent reporting putting network stablecoin volume above $5T in 2026.
So this isn't really a “USDC mint = SOL bullish” story.
It's an inventory → deployment story.
Watch the wallets.
Where does that $500M move next?
If it gets deployed into exchanges, lending, payments or liquidity pools, the market has something much more meaningful than a treasury print.
The mint confirms creation of USDC, not the eventual destination or economic use of the funds.
$SOL $RARE $USDC
#CircleMints500MUSDCOnSolana #solana #BlackRockBuildsTokenizedPortfoliosForOndo #defi
Stink meaner
·6 Likes
·4.8k views
PolymarketBankFailureBetsDrawFDICConcern
58,407 views
1,246 Discussing
BlackRockBuildsTokenizedPortfoliosForOndo
46,092 views
859 Discussing