

9919
19 Posts

9919
Report
Block User
Open Trade

BNB Holder
Occasional Trader
5.5 Years
26 Following
42 Followers
4 Liked
Posts
Portfolio
·
--
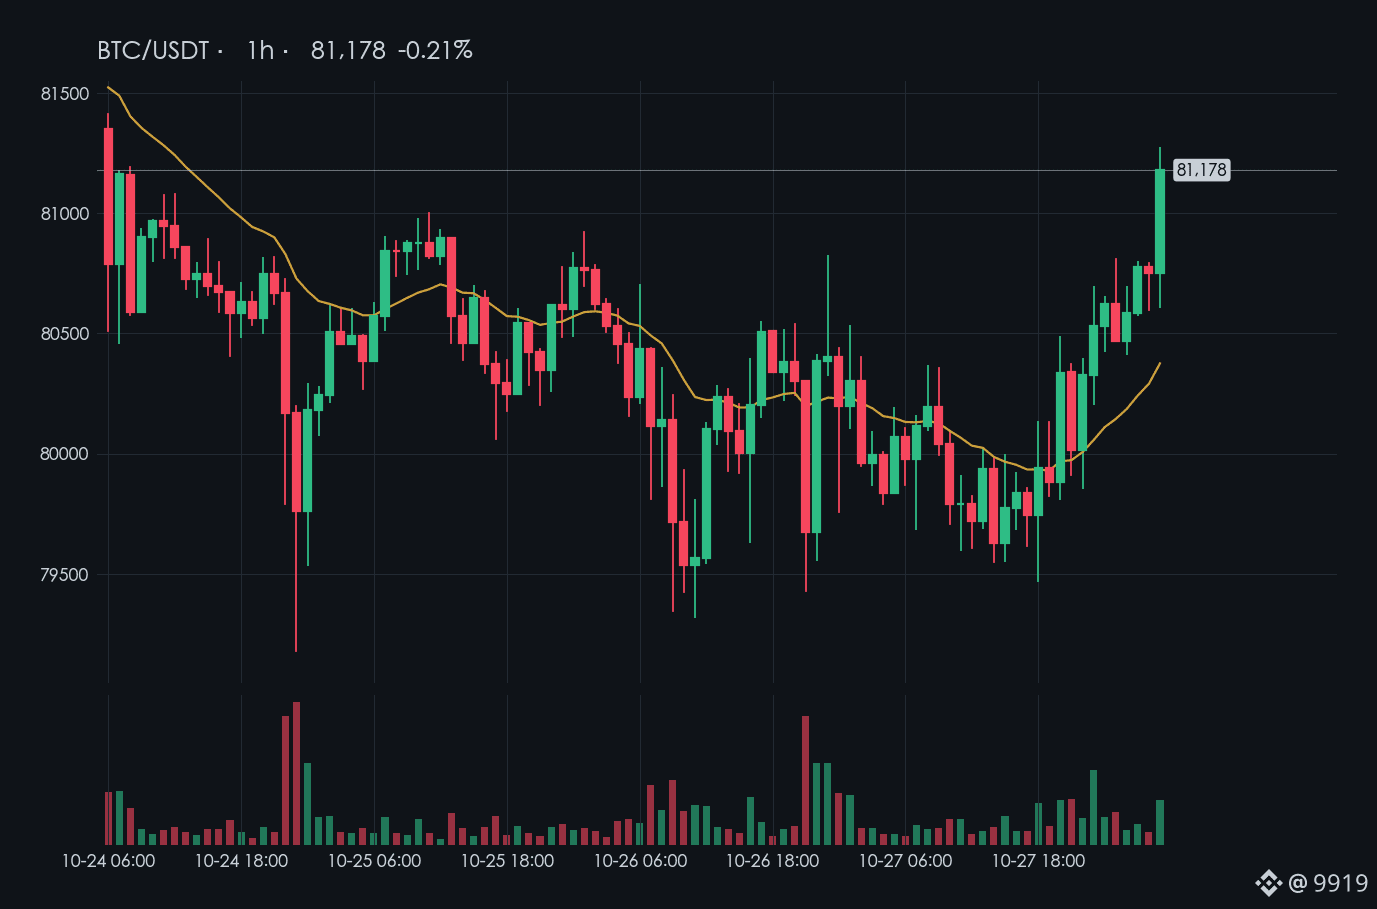
BTC is currently at 81144, up a little over 1% in the past 24 hours and sitting just below 81270. Looking at this week, it still has a long way to go: 84875 was the weekly high, so for now it’s merely clawed back a bit from the bottom.
Top traders have been selling more than buying over the past six hours, and aggressive large orders are net sellers too. Price is near the intraday high, but money is flowing out instead. Honestly, that doesn’t look right.
I’m leaning bearish. It’s tried to move higher from this level several times, but failed to hold.
If the four-hour candle closes above 81100, I’ll drop this view.
Do you think it can really break above this time?
Personal notes, not investment advice.
$BTC
922
·
--
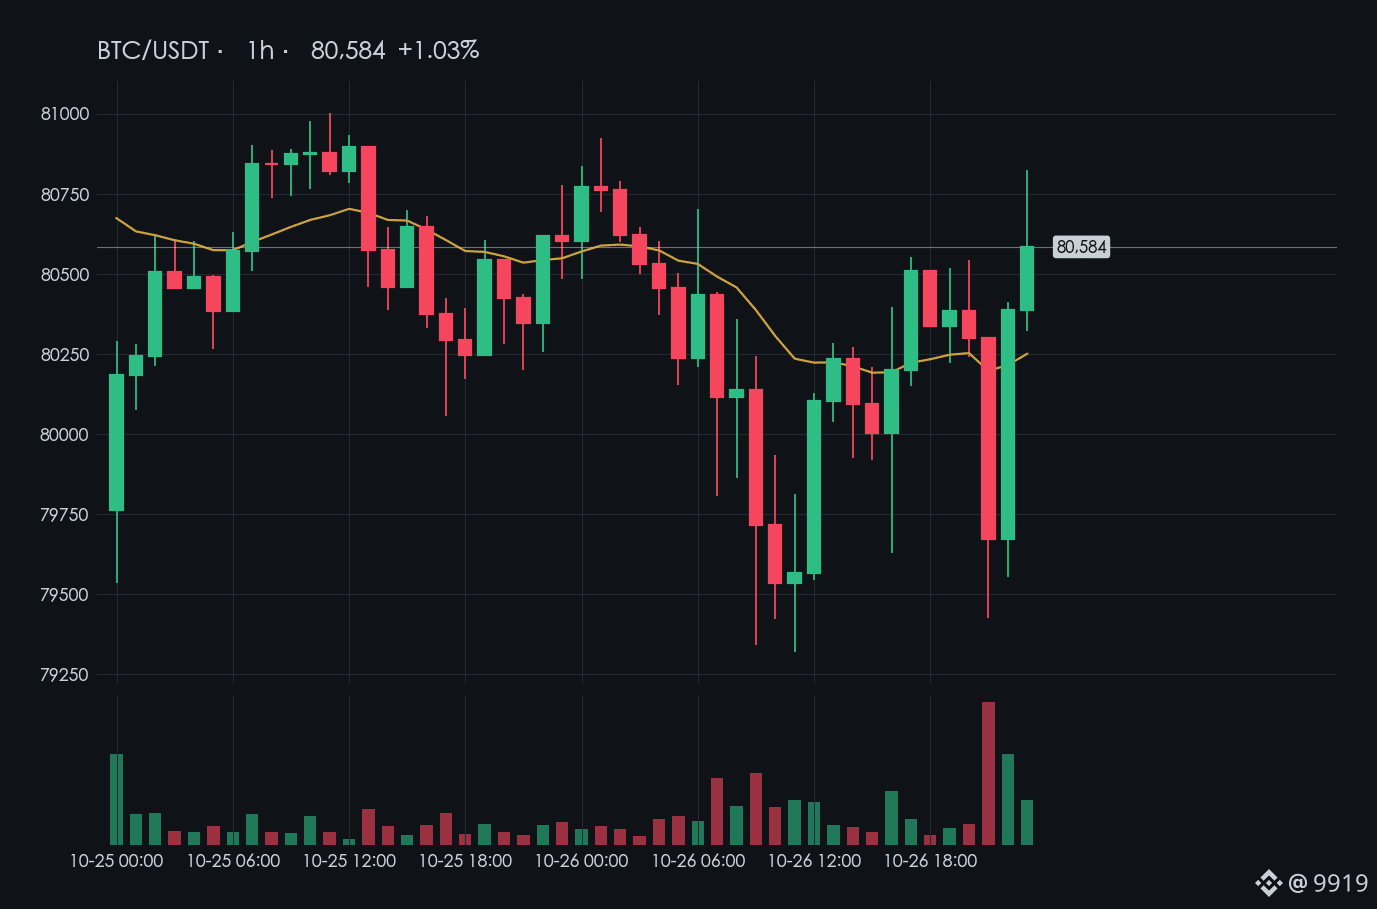
Tonight, right after the U.S. stock market opened, BTC dropped from 80,340 to around 79,450 in an hour, with volume about 5 times normal, then rebounded to 80,600 in the next hour.
It looks scary, but this was already the second time today it tested around 79,400. The first was at 11 a.m., and both times it got bought back. Looking at the past 24 hours, it has just been swinging between 79,370 and 80,850.
Some people asked whether new money came in. I checked stablecoins with single transactions over one million: 620 million went into exchanges today, and 620 million came out, basically a wash. Around 5 p.m., Binance even had a net outflow of 260 million. ETFs were also seeing outflows in the previous two trading days. I didn’t see new money.
When that spike dumped and then got pulled back up, open interest in contracts was rising on both sides, meaning longs and shorts were fighting each other; it wasn’t that either side had given up.
My view is still that this is a range grind. 79,200 is the key level to watch over the next few days. The Fed rate decision is early Thursday morning, and GDP and PCE are also due that evening, so this kind of back-and-forth sweep may continue.
Did you get wicked out tonight?
Personal record, not investment advice.
$BTC #BTC #The U.S. will release Q3 GDP and September PCE next week
148
·
--
Let’s review the BTC views I shared on the Square last week, one by one, and record both the hits and misses.
① On the afternoon of 10-19, near 83000, I said I was bearish. My invalidation level was a 4-hour candle closing above 83350.
The next day, the price fell back to around 81100, so the direction was right. But at 8 p.m. on 10-21, a 4-hour candle closed at 83460. By the rules I set for myself, that invalidated the view. Half right.
② At 10 p.m. on 10-21, near 83800, I said I was bearish again. My invalidation level was a 1-hour candle closing above 84100.
Just an hour later, the next candle closed at 84530, breaking straight through it. Although the price did eventually fall, once the invalidation level was breached, the call was wrong. This one counts as a miss.
③ On the morning of 10-22, I broke down the double top: the neckline zone was 84180 to 84350, with a downside target around 83500. The setup would be invalidated only if the price closed back above 84350.
It never closed back above the neckline after that. The same day, it broke below 83500, and by Saturday night it had bottomed near 79200. This one was right.
One hit, one miss, and one half-right.
The key takeaway is the second call: I got the direction right, but placed the invalidation level too close, and one candle stopped me out. So now I only count body closes on 4-hour candles or higher.
From now on, I’ll review my calls like this every Monday. When you review a trade, do you look at whether the direction was right, or whether the invalidation level held?
Personal notes, not investment advice.
$BTC #BTC Price Analysis
120
·
--
BTC is back at the $80,000 level again— for the third time this month.
It wicked down to $79,220 on Saturday night and the daily candle closed at $79,803, just shy of breaking below. Today it’s back around $80,200. I don’t count a wick as a breakdown; I only look at the candle body close.
A few things worth noting these past few days:
· Despite the steep drop, funding rates are still slightly positive. Longs are still paying, which suggests there hasn’t been any real panic yet.
· ETFs saw $770 million in outflows over Thursday and Friday. Institutions trimmed their positions at higher levels.
· Some estimates put long liquidations below $79,000 at around $850 million. If that level really breaks, the sell-off could accelerate.
My take:
· If a 4-hour candle closes below $79,200, the bottom of the range has broken. I’d look toward $77,000 / $76,000.
· If BTC holds $80,000 and gets back above $81,100, it’s still just a bounce within the range. First target: $82,200.
· The Fed rate decision is at 2 a.m. Thursday. There’ll probably be wicks in both directions around then, so if you’re not confident, sit it out.
If you’re dollar-cost averaging, there’s no need to panic too much. AHR999 is at 0.49, which is relatively low.
Do you think $80,000 will hold this time?
Personal opinion only; not investment advice.
$BTC #BTC price analysis
274
·
--
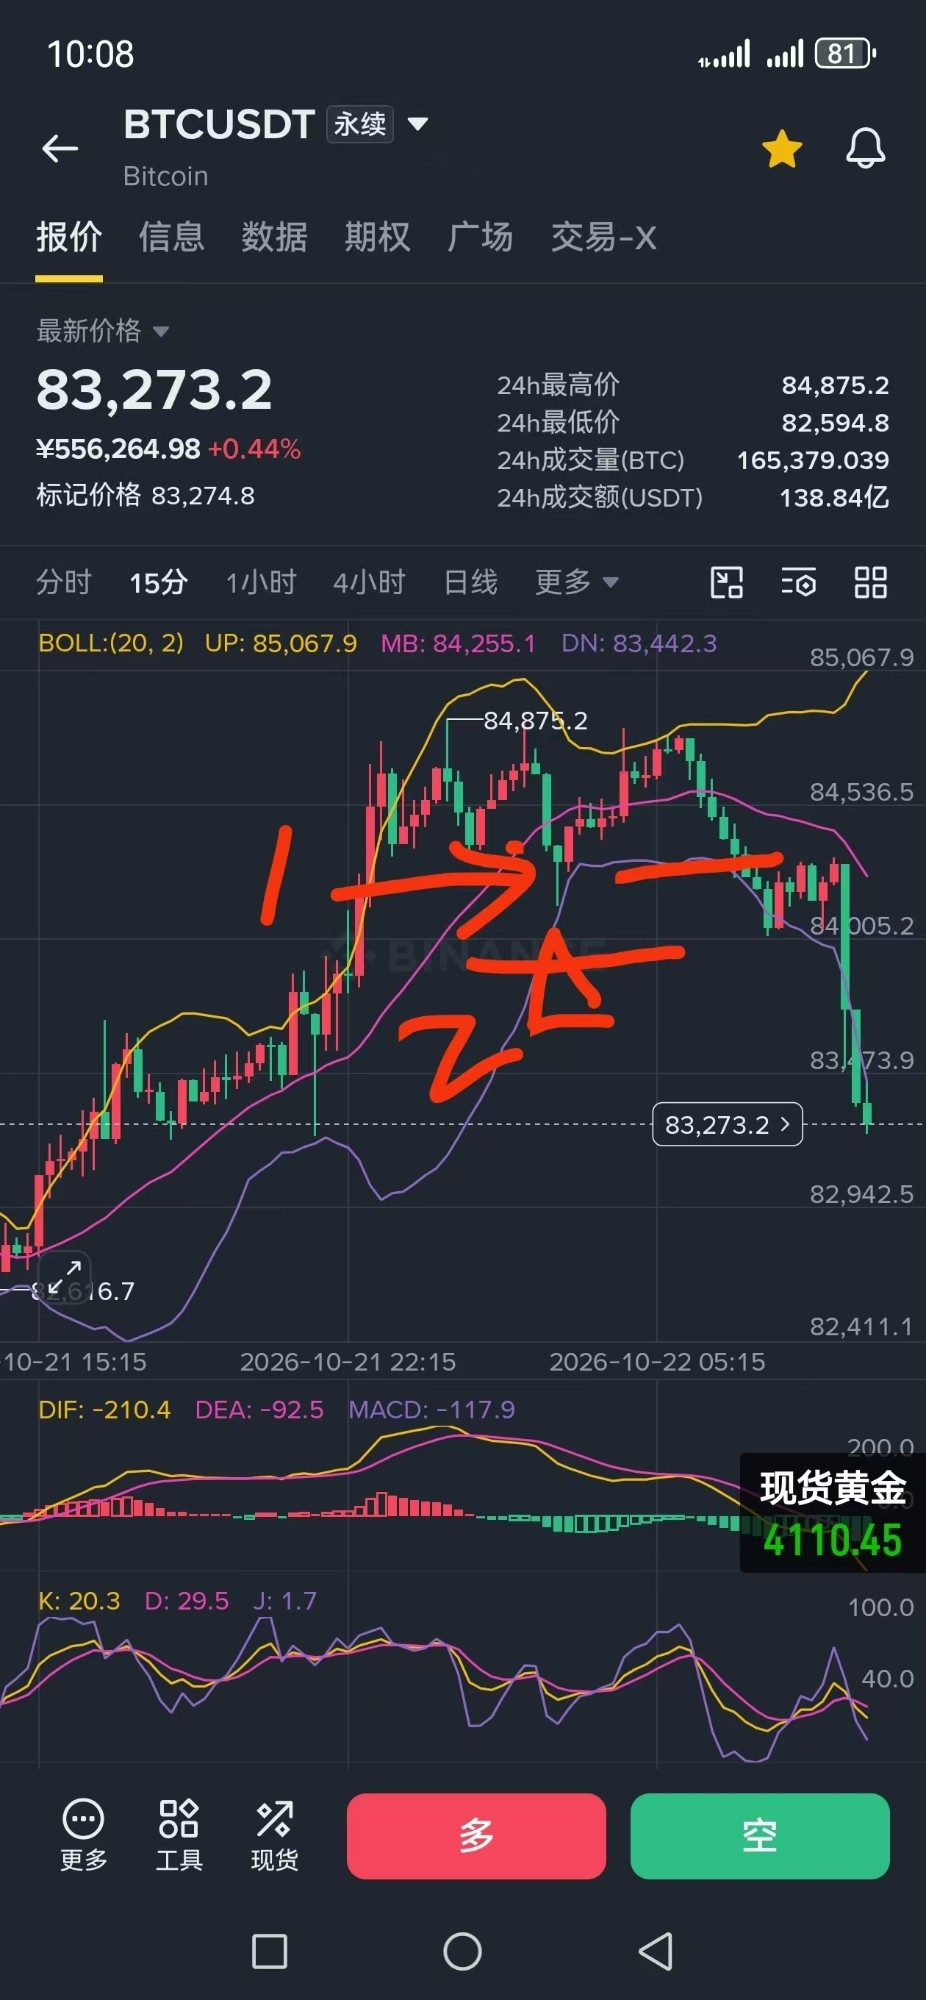
This BTC M-top is a textbook example. Let’s break down how to read the neckline.
Both peaks are between 84,850 and 84,900. The pullback between them bottomed at 84,180—that’s the neckline.
A lot of people debate whether to draw the neckline at the bottom of the candle bodies or at the lowest wick. I usually draw both and treat them as a zone: 84,180 to 84,350.
What counts as a break below:
· A high-volume candle body closes below the zone
· A close within the zone, or a wick dipping below and then closing back above, is just a test
We had a clear example this morning. The 7:45 15-minute candle closed at 84,097, just below the neckline, on low volume. The next candle closed back above it—that was a test. The 9:30 candle was the real breakdown: a high-volume bearish candle closed at 83,780, moving decisively out of the zone.
Measured move: the distance from the top to the neckline is about 700 points, projecting a move down to around 83,500. We’re at 83,250 now, so the move is basically complete.
The invalidation level is also a zone: if price closes back above 84,350, the M-top is invalidated.
To be honest, I posted a bearish view at 10 p.m. last night, and my 84,100 invalidation level was blown through within an hour. I was wrong on that one. Calling the direction isn’t hard; the hard part is setting your invalidation level first.
Do you draw the neckline using candle bodies or wicks?
Personal notes, not investment advice.
$BTC #JPMorganPredictsBitcoinWillLeadForTheNextDecade
269
·
--
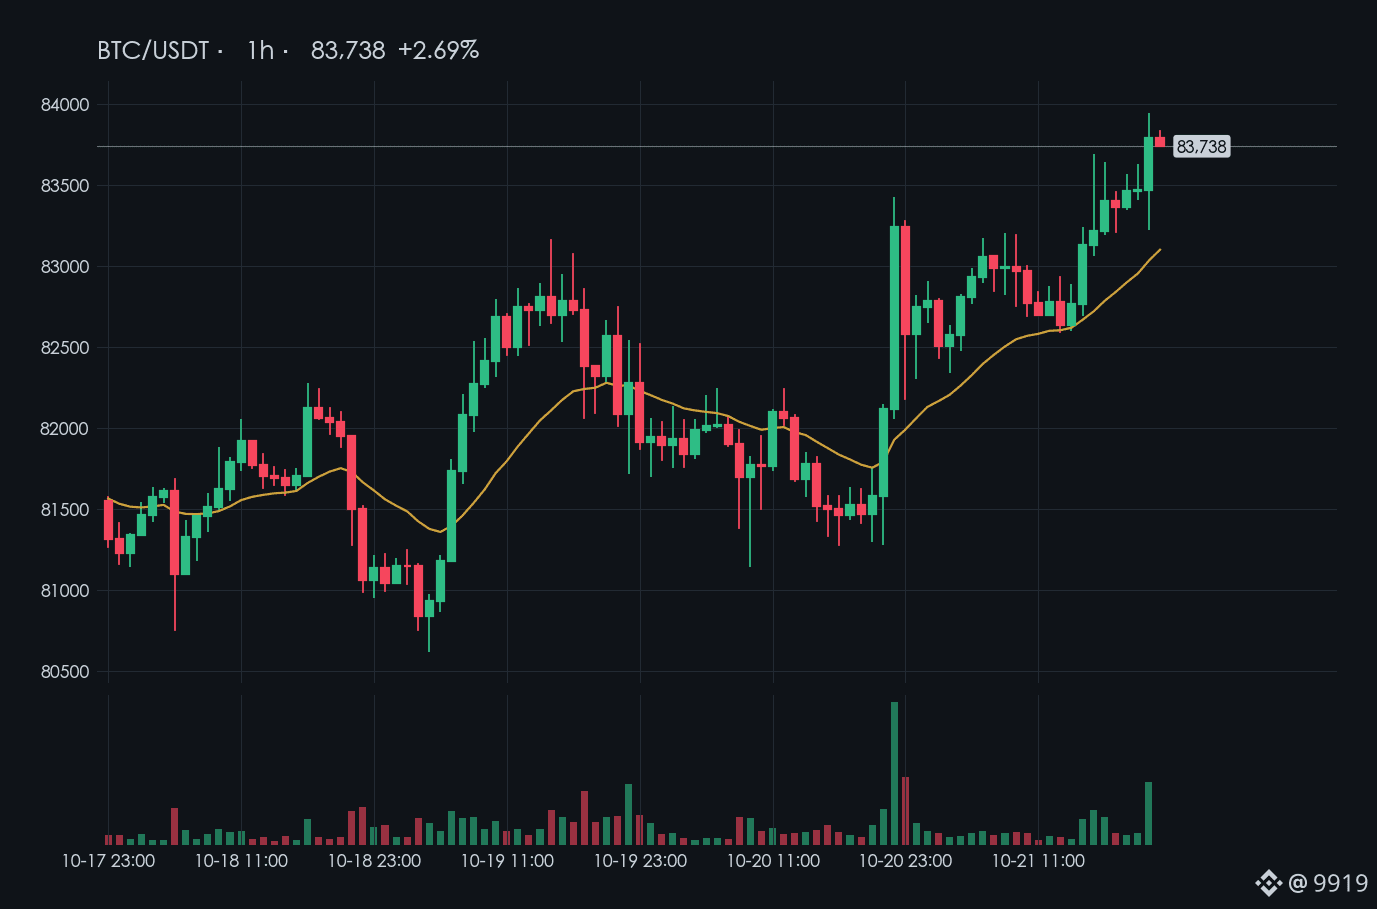
BTC has been hovering near the previous high for half the day. Its current price is 83,818, up 2.2% over the past 24 hours. The 83,939 level was both this week’s high and today’s peak.
Top traders are net short and have been adding to their positions over the past 24 hours. Another group of addresses that has consistently been profitable lately is also short. I haven’t seen any clear dip-buying in the spot market, which, to be honest, makes me a bit uneasy.
I’m leaning bearish. At this previous high, I’d rather bet that the price won’t break above it.
If the hourly candle closes above 84,100, I’ll admit I was wrong. I’ll also reconsider this view if bears start closing their positions en masse while the price holds above 83,400.
Do you think it can make another push?
Personal notes, not investment advice.
$BTC #JPMorgan predicts Bitcoin will lead the pack over the next decade
132
·
--
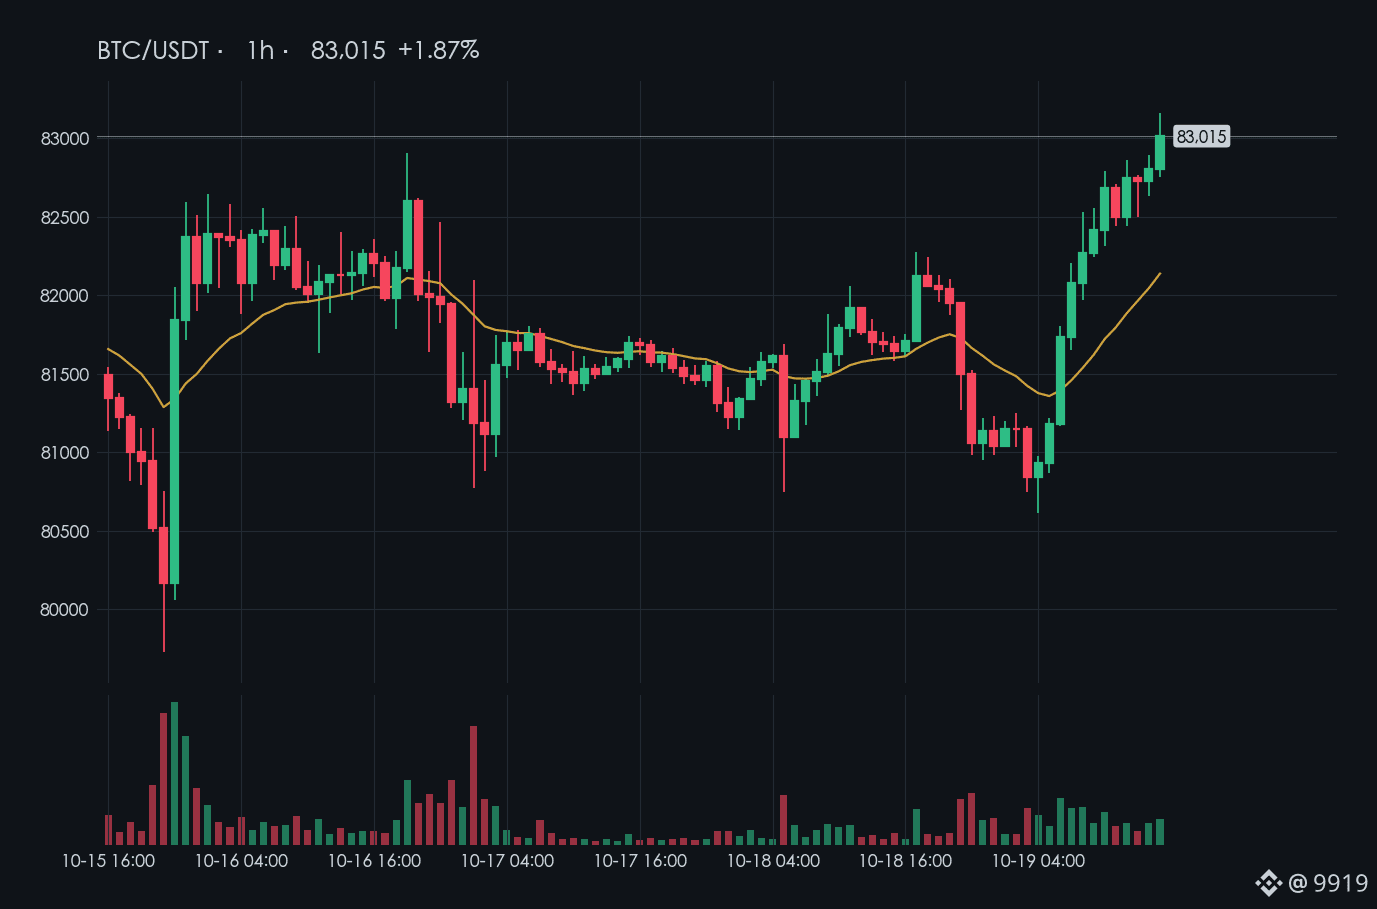
BTC has rebounded to 83,024, up a little over 1% in a day. The 24-hour high of 83,133 is just overhead.
The 82,500–82,900 zone is around the neckline of a daily double top. It wouldn’t be hard to poke above it, but holding there is what counts. Above that is 83,350. Total stablecoin supply has shrunk by $260 million over the past seven days, and I haven’t seen fresh money coming in to buy on the spot market. Top traders are net short.
I’m bearish. At this level, I’m more inclined to think the rally will run out of steam.
If a four-hour candle closes above 83,350, I’ll reconsider this view.
Would anyone still dare to chase it higher here?
Personal notes, not investment advice.
$BTC
236
·
--
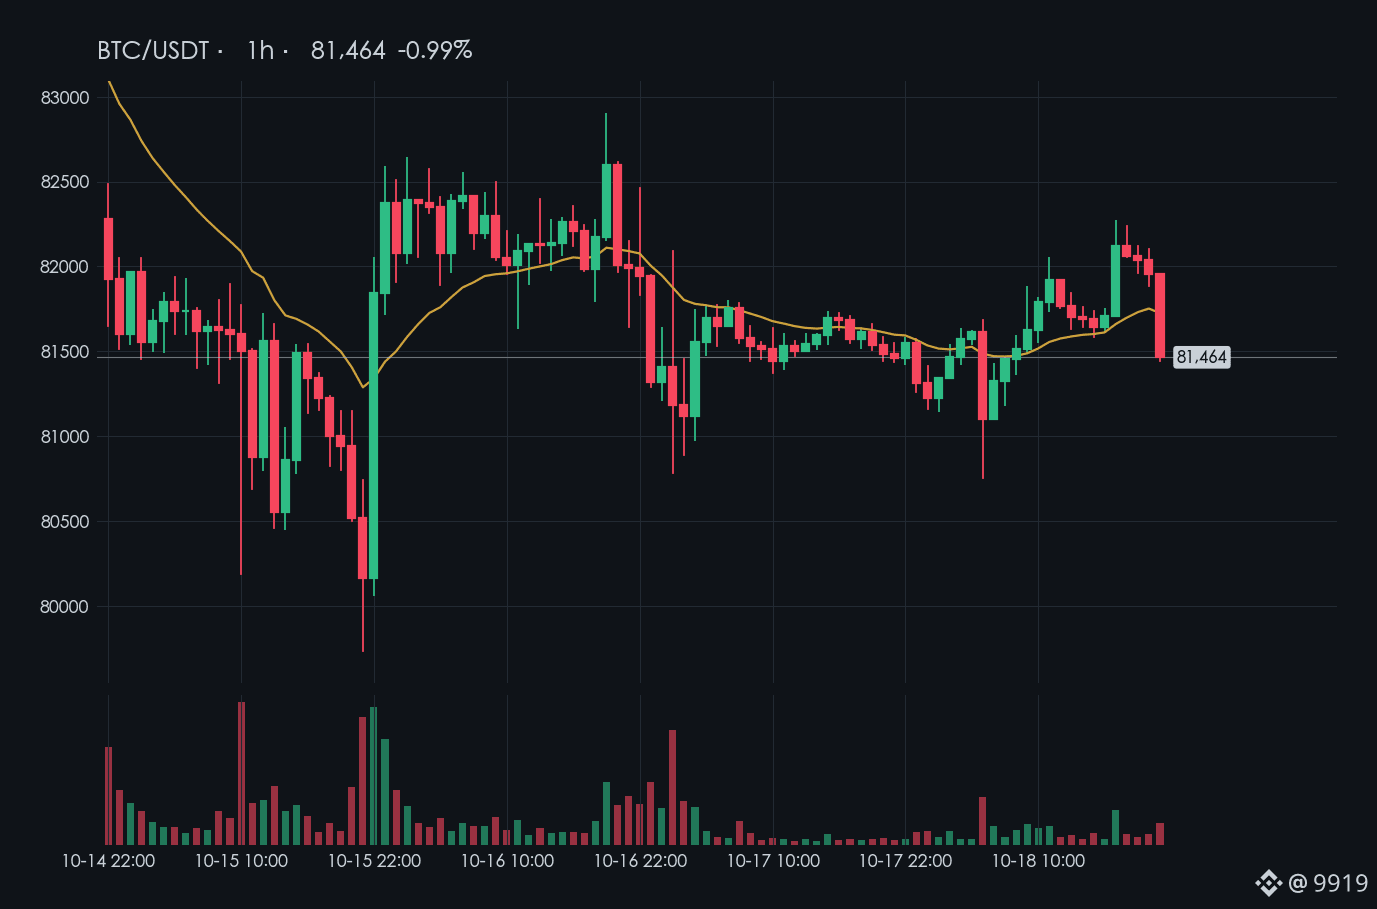
BTC is around 81,500 now. It has barely moved over the past 24 hours, just wavering within this range, a little above the midpoint.
The price tested 80,800 twice on the way down, but bounced back both times, with each low higher than the last. The funding rate is 0.01%, which is very low. Long positions among top traders are still increasing, and their average entry price is also below the current price.
I’m leaning bullish and think it could make another attempt to move higher. But the premium is still negative, and spot buyers aren’t very active, so don’t expect a straight shot up.
If a four-hour candle closes below 81,000, I’ll no longer stand by this view.
Can it get past 82,000 this week?
Personal notes, not investment advice.
$BTC
345
·
--
81,000 has held twice, but money is flowing out of the market
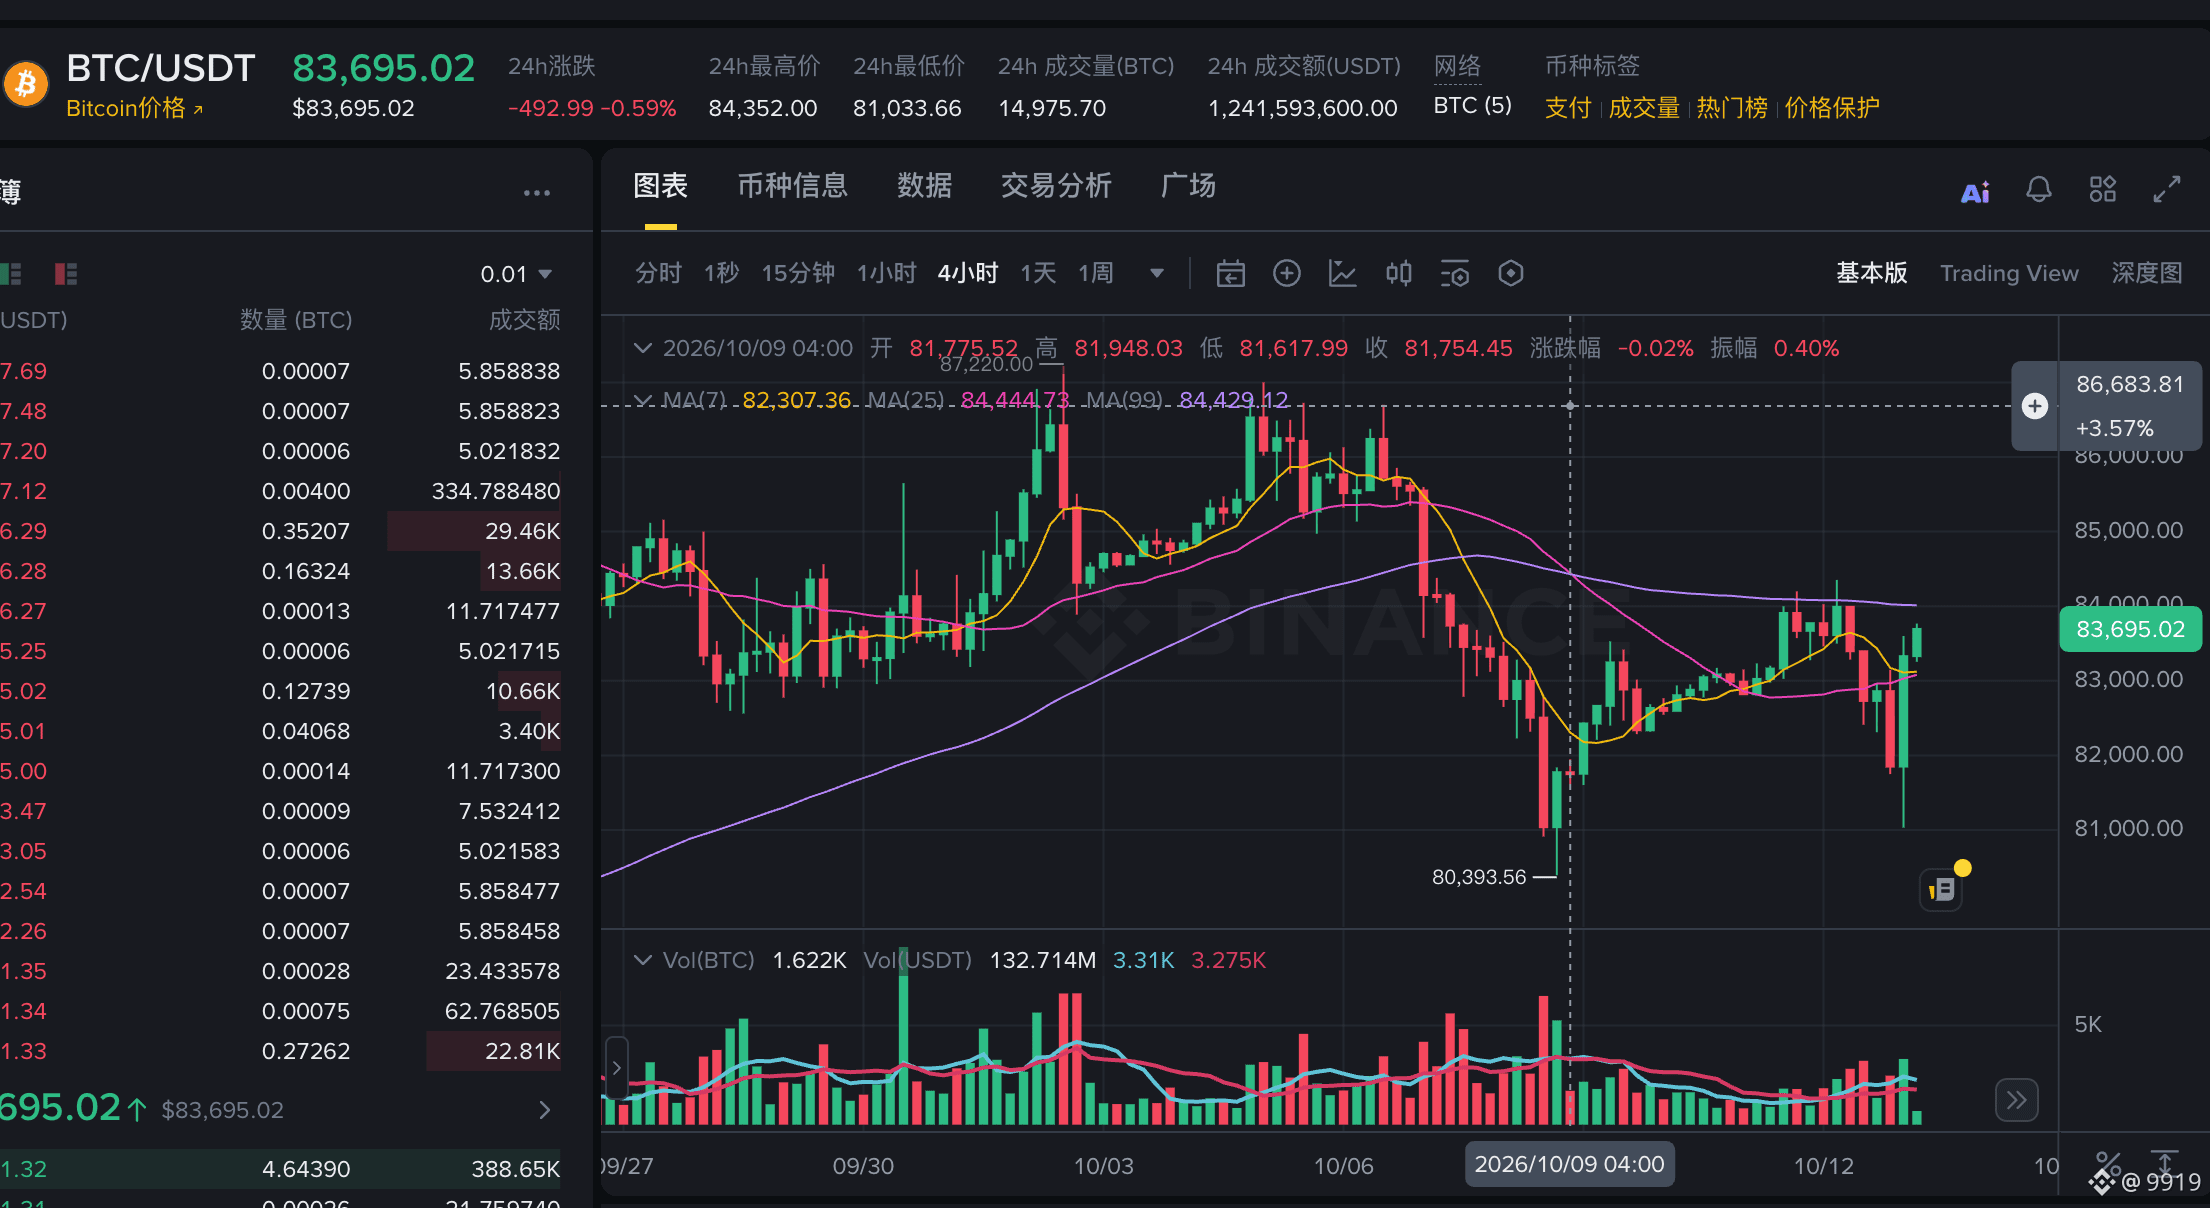
Bitcoin plunged to 80,985 this morning, but stayed above the 80,345 low from October 8. By noon, it had bounced back to around 83,400, up 3%. Ethereum was even more precise: today’s low was 2,407, compared with last week’s low of 2,405—almost exactly the same level. SOL was weaker, falling straight through last week’s low and reaching as low as 101.5.
Technically, Bitcoin’s daily price has just edged back above the 20-day moving average at 83,150. The 50-day average is at 80,200, sitting just below both lows. The daily Bollinger Bands have narrowed to just 5.6% wide; bands this tight usually don’t stay that way for long. First, watch 84,300 overhead—the price turned back around there both the day before yesterday and yesterday. If it breaks through, the next level to watch is 85,500. If 81,000 gets tested for a third time, I’m not sure it’ll hold again. Below that is the weekly 50-day moving average at 78,600.
The macro news is the main driver of this sell-off. The yield on U.S. 30-year Treasuries has reached 5.7%, its highest level since 2002. Oil is above $100, and South Korea’s stock market opened down more than 4% today, triggering a program-trading halt. Existing Home Sales are due tonight at 22:00, followed by CPI tomorrow at 20:30. The market expects year-over-year inflation of 3.7%, up from 3.4% previously. PPI and retail sales come Thursday, followed by a speech from the Fed chair on Friday. This week, the data will call the shots.
On-chain activity and fund flows look weak. U.S. spot Bitcoin ETFs saw net outflows of $65.4 million yesterday, bringing outflows this month to around $450 million. Ethereum ETFs have seen $577 million in outflows over the past five days. The amount of USDC on the Ethereum network has fallen by nearly $700 million in a week, and spot prices in the U.S. have consistently been cheaper than here. Also, an old wallet that had been dormant for years transferred all 4,582 BTC out today. We don’t know if it’s going to sell, but it’s worth keeping an eye on.
There’s a bright spot, too. This morning, $146 million in long positions were liquidated in one hour. Bitcoin futures open interest has fallen from 96,900 BTC last week to 92,400 BTC. Some leverage has been flushed out, funding rates are near zero, and there isn’t a crowd piling into longs.
My take: this is a rebound amid bearish news, with the price in the upper-middle part of the range. I’m not chasing above 83,000. Before CPI, I’m watching the 81,000–84,300 range; I’ll follow whichever direction breaks first.
Are you waiting for CPI before making a move, or have you already entered the market?
Personal notes, not investment advice.
$BTC $ETH
411
·
--
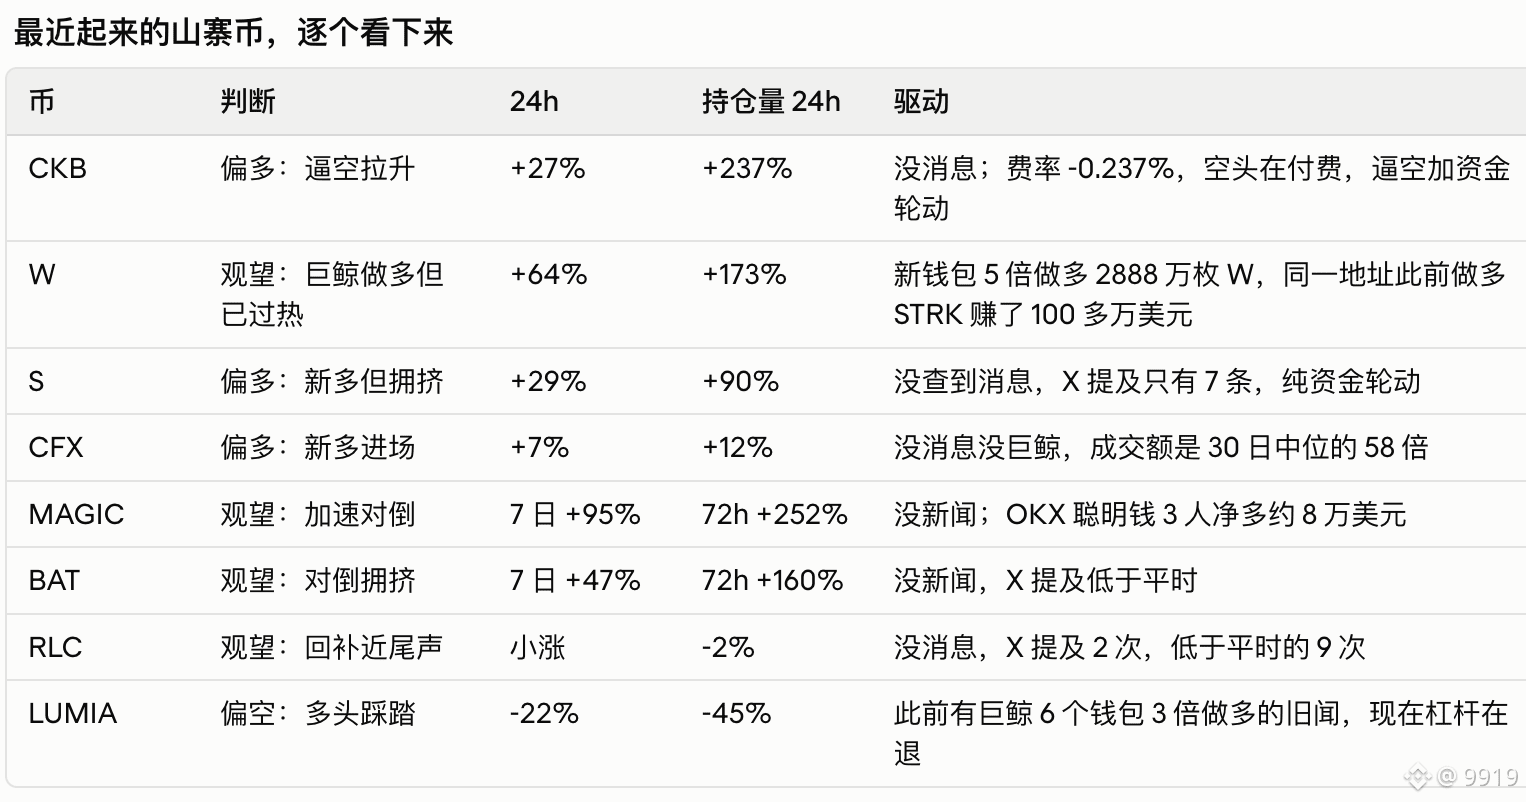
This round looks more like a rotation led by a handful of large players, with derivatives capital following suit.
This round looks more like a rotation led by a handful of large players, with derivatives capital following suit.
6
1
1.8k
·
--
Bullish
A new wallet on Hyperliquid first made over $1 million by going 3x long on STRK, then went 5x long on W. Its position in W ($28.88 million) is more than twice the total open interest in W futures on Binance ($12.8 million), so the price of W is basically determined by this one address. Once it closes its position, the rally could be over.
$STRK #w
{spot}(STRKUSDT)
A new wallet on Hyperliquid first made over $1 million by going 3x long on STRK, then went 5x long on W. Its position in W ($28.88 million) is more than twice the total open interest in W futures on Binance ($12.8 million), so the price of W is basically determined by this one address. Once it closes its position, the rally could be over.
$STRK #w
$STRK #w
370
·
--
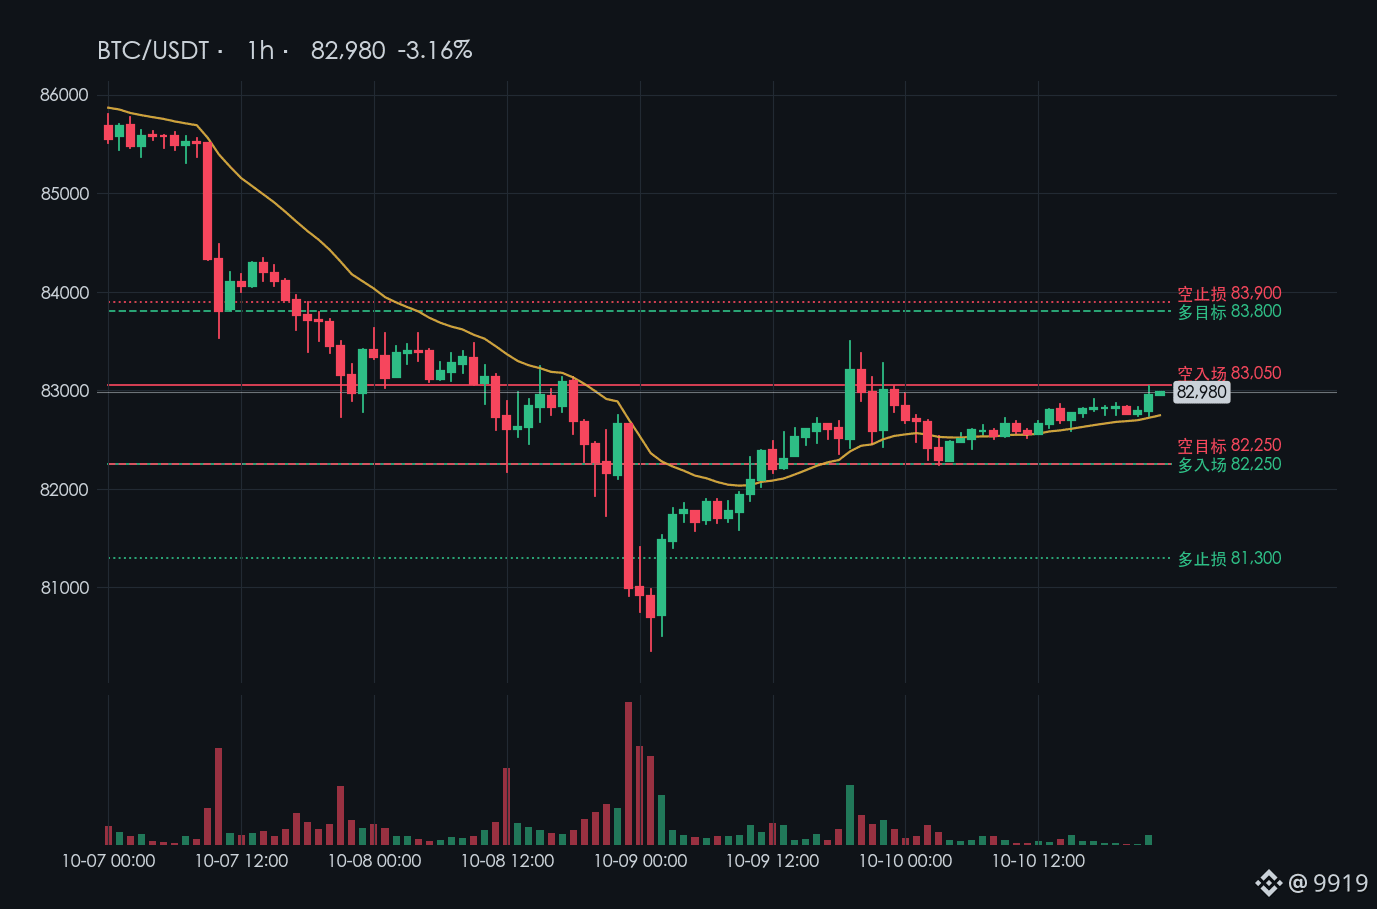
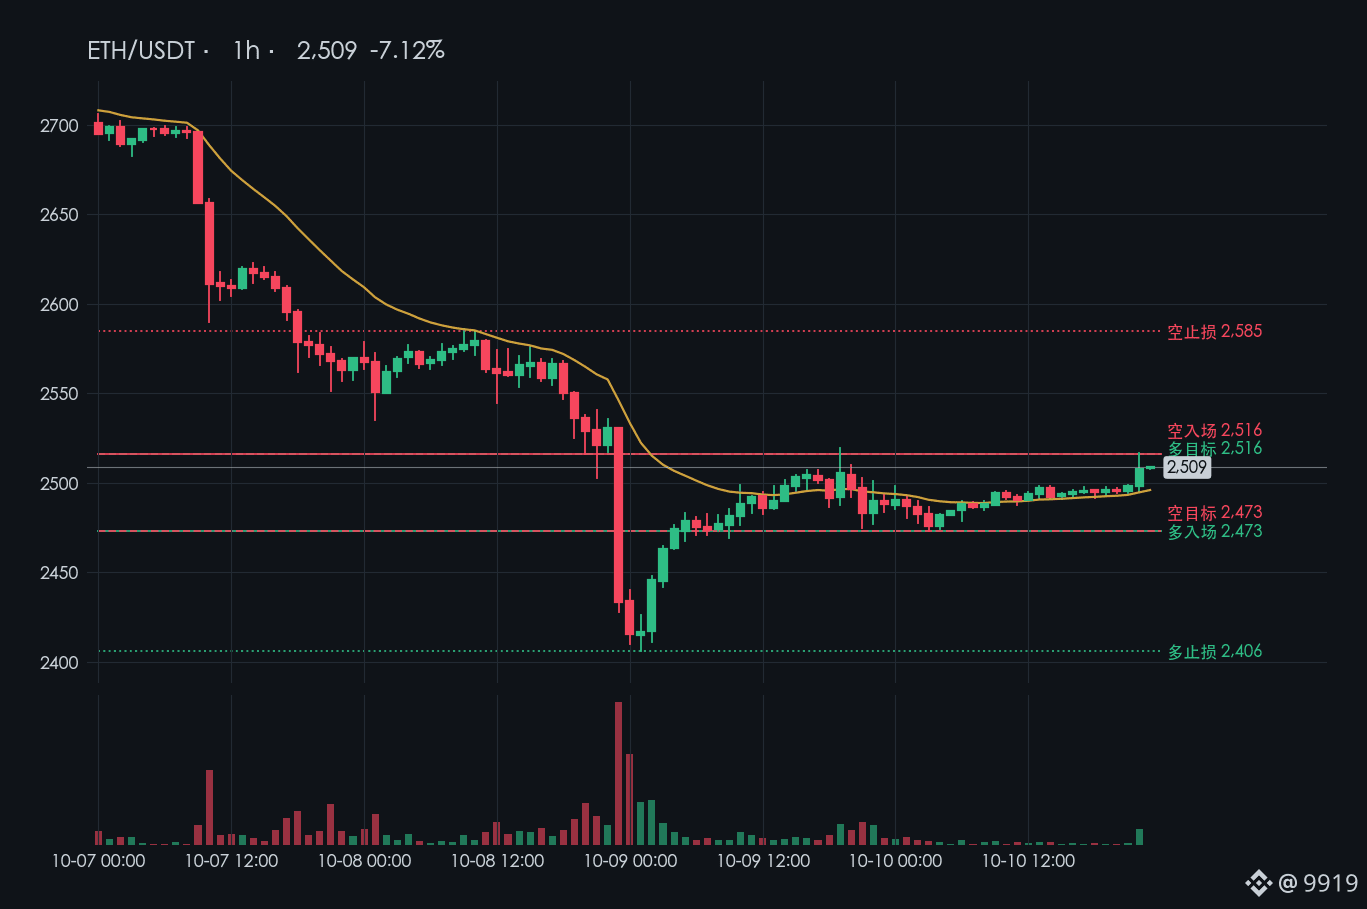
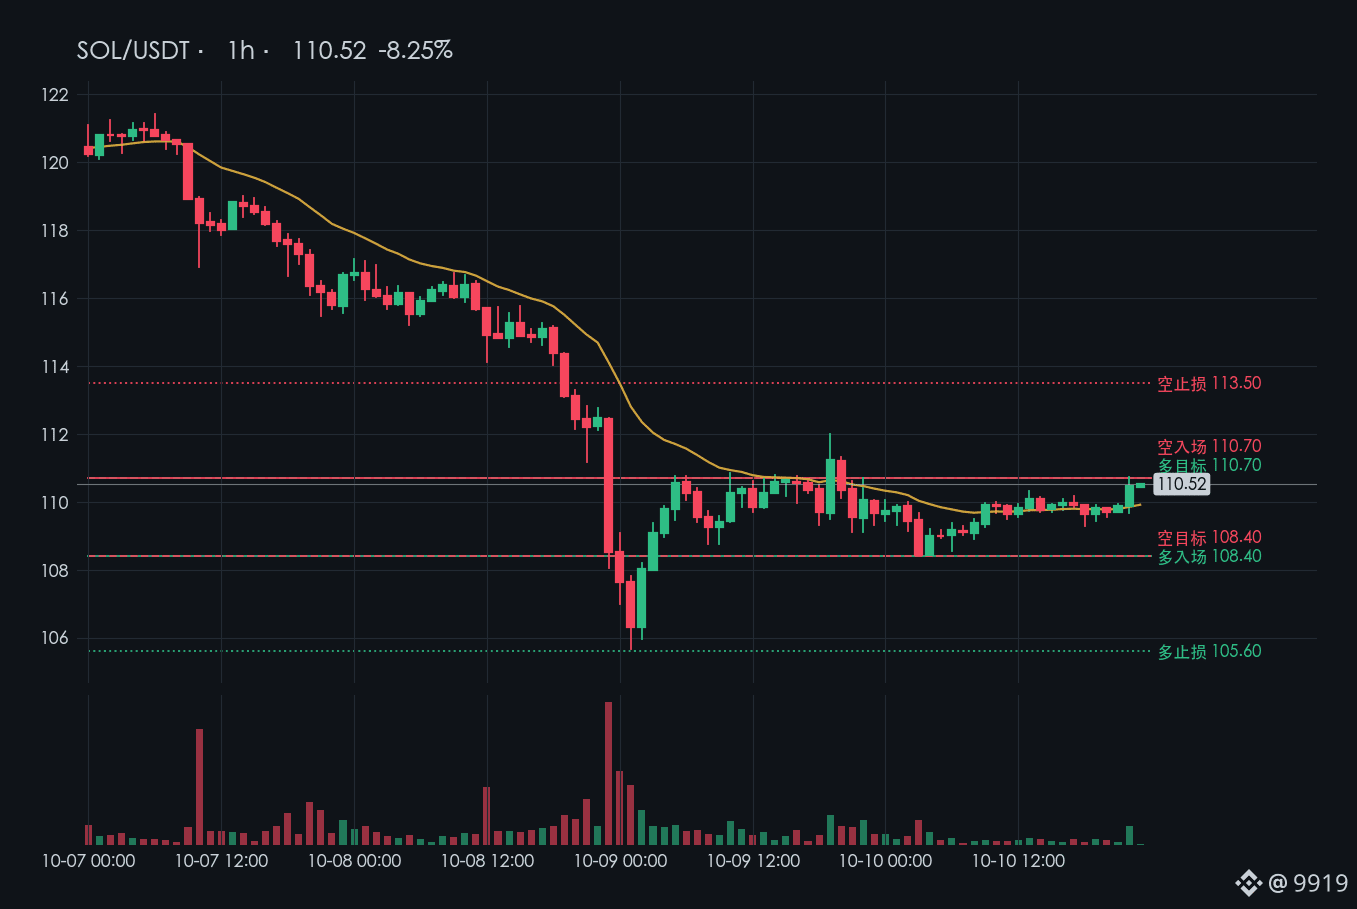
Bitcoin is stuck in a range, so today I’m waiting at both ends
Bitcoin spent the day stuck between 82,000 and 83,000, with barely over a 1% move. More altcoins are in the green, and funding rates are starting to look a bit crowded.
I’m not in any trades, so there’s nothing I need to do today.
I’m just watching Bitcoin’s range. 82236 is the lower boundary. If it holds, I plan to take a position just above it. If it breaks down, I’ll wait and see; support only really starts to show around 81300. At the upper boundary, around 83045, I’ll try a short. I’m staying out of the middle.
The clearest signal is that the Coinbase premium has turned negative—US spot investors are selling. Ethereum saw over 400 million in net USDC redemptions over the past week. Taken together, the case for chasing longs doesn’t look very convincing.
So why keep a long open? I’m not shorting on the futures side. The large accounts on OKX have a long-position cost basis of 81523, and the current price is still above their entry. If it really drops, they’ll feel the pain before I do. I’m just keeping a spot open and waiting.
$BTC Long: entry 82250 / stop loss 81300 / target 83800; Short: entry 83050 / stop loss 83900 / target 82250
$ETH Long: entry 2473 / stop loss 2406 / target 2516; Short: entry 2516 / stop loss 2585 / target 2473
$SOL Long: entry 108.4 / stop loss 105.6 / target 110.7; Short: entry 110.7 / stop loss 113.5 / target 108.4
Which side are you watching today?
Personal notes, not investment advice.
$BTC $ETH $SOL #比特币 #TradingJournal
1
535
·
--
$BNB The popularity of the bsc chain is rising, meme season begins, driving up bnb again
$BNB The popularity of the bsc chain is rising, meme season begins, driving up bnb again
317
Log in to explore more content
Join global crypto users on Binance Square
⚡️ Get latest and useful information about crypto.
💬 Trusted by the world’s largest crypto exchange.
👍 Discover real insights from verified creators.
Email / Phone number