
CryptoZeno 1
460 Posts

CryptoZeno 1
Report
Block User
Featured Creator on #CoinMarketCap #BinanceSquare and #CryptoQuant | On Chain Research and Market Insights
0 Following
8 Followers
19 Liked
Posts
·
--
🚨BREAKING: Brazil’s largest crypto exchange Mercado $BTC confirms a security breach TODAY.
Hypernative flagged over $40 MILLION in suspicious transfers across roughly 10 blockchains.
The exchange suspended deposits and withdrawals while investigating.
It says customer data and assets are safe but has not clarified whether the transfers represent stolen funds. #BTC Price Analysis# #Macro Insights#
🚨BREAKING: Brazil’s largest crypto exchange Mercado $BTC confirms a security breach TODAY.
Hypernative flagged over $40 MILLION in suspicious transfers across roughly 10 blockchains.
The exchange suspended deposits and withdrawals while investigating.
It says customer data and assets are safe but has not clarified whether the transfers represent stolen funds. #BTC Price Analysis# #Macro Insights#
Hypernative flagged over $40 MILLION in suspicious transfers across roughly 10 blockchains.
The exchange suspended deposits and withdrawals while investigating.
It says customer data and assets are safe but has not clarified whether the transfers represent stolen funds. #BTC Price Analysis# #Macro Insights#

49
·
--
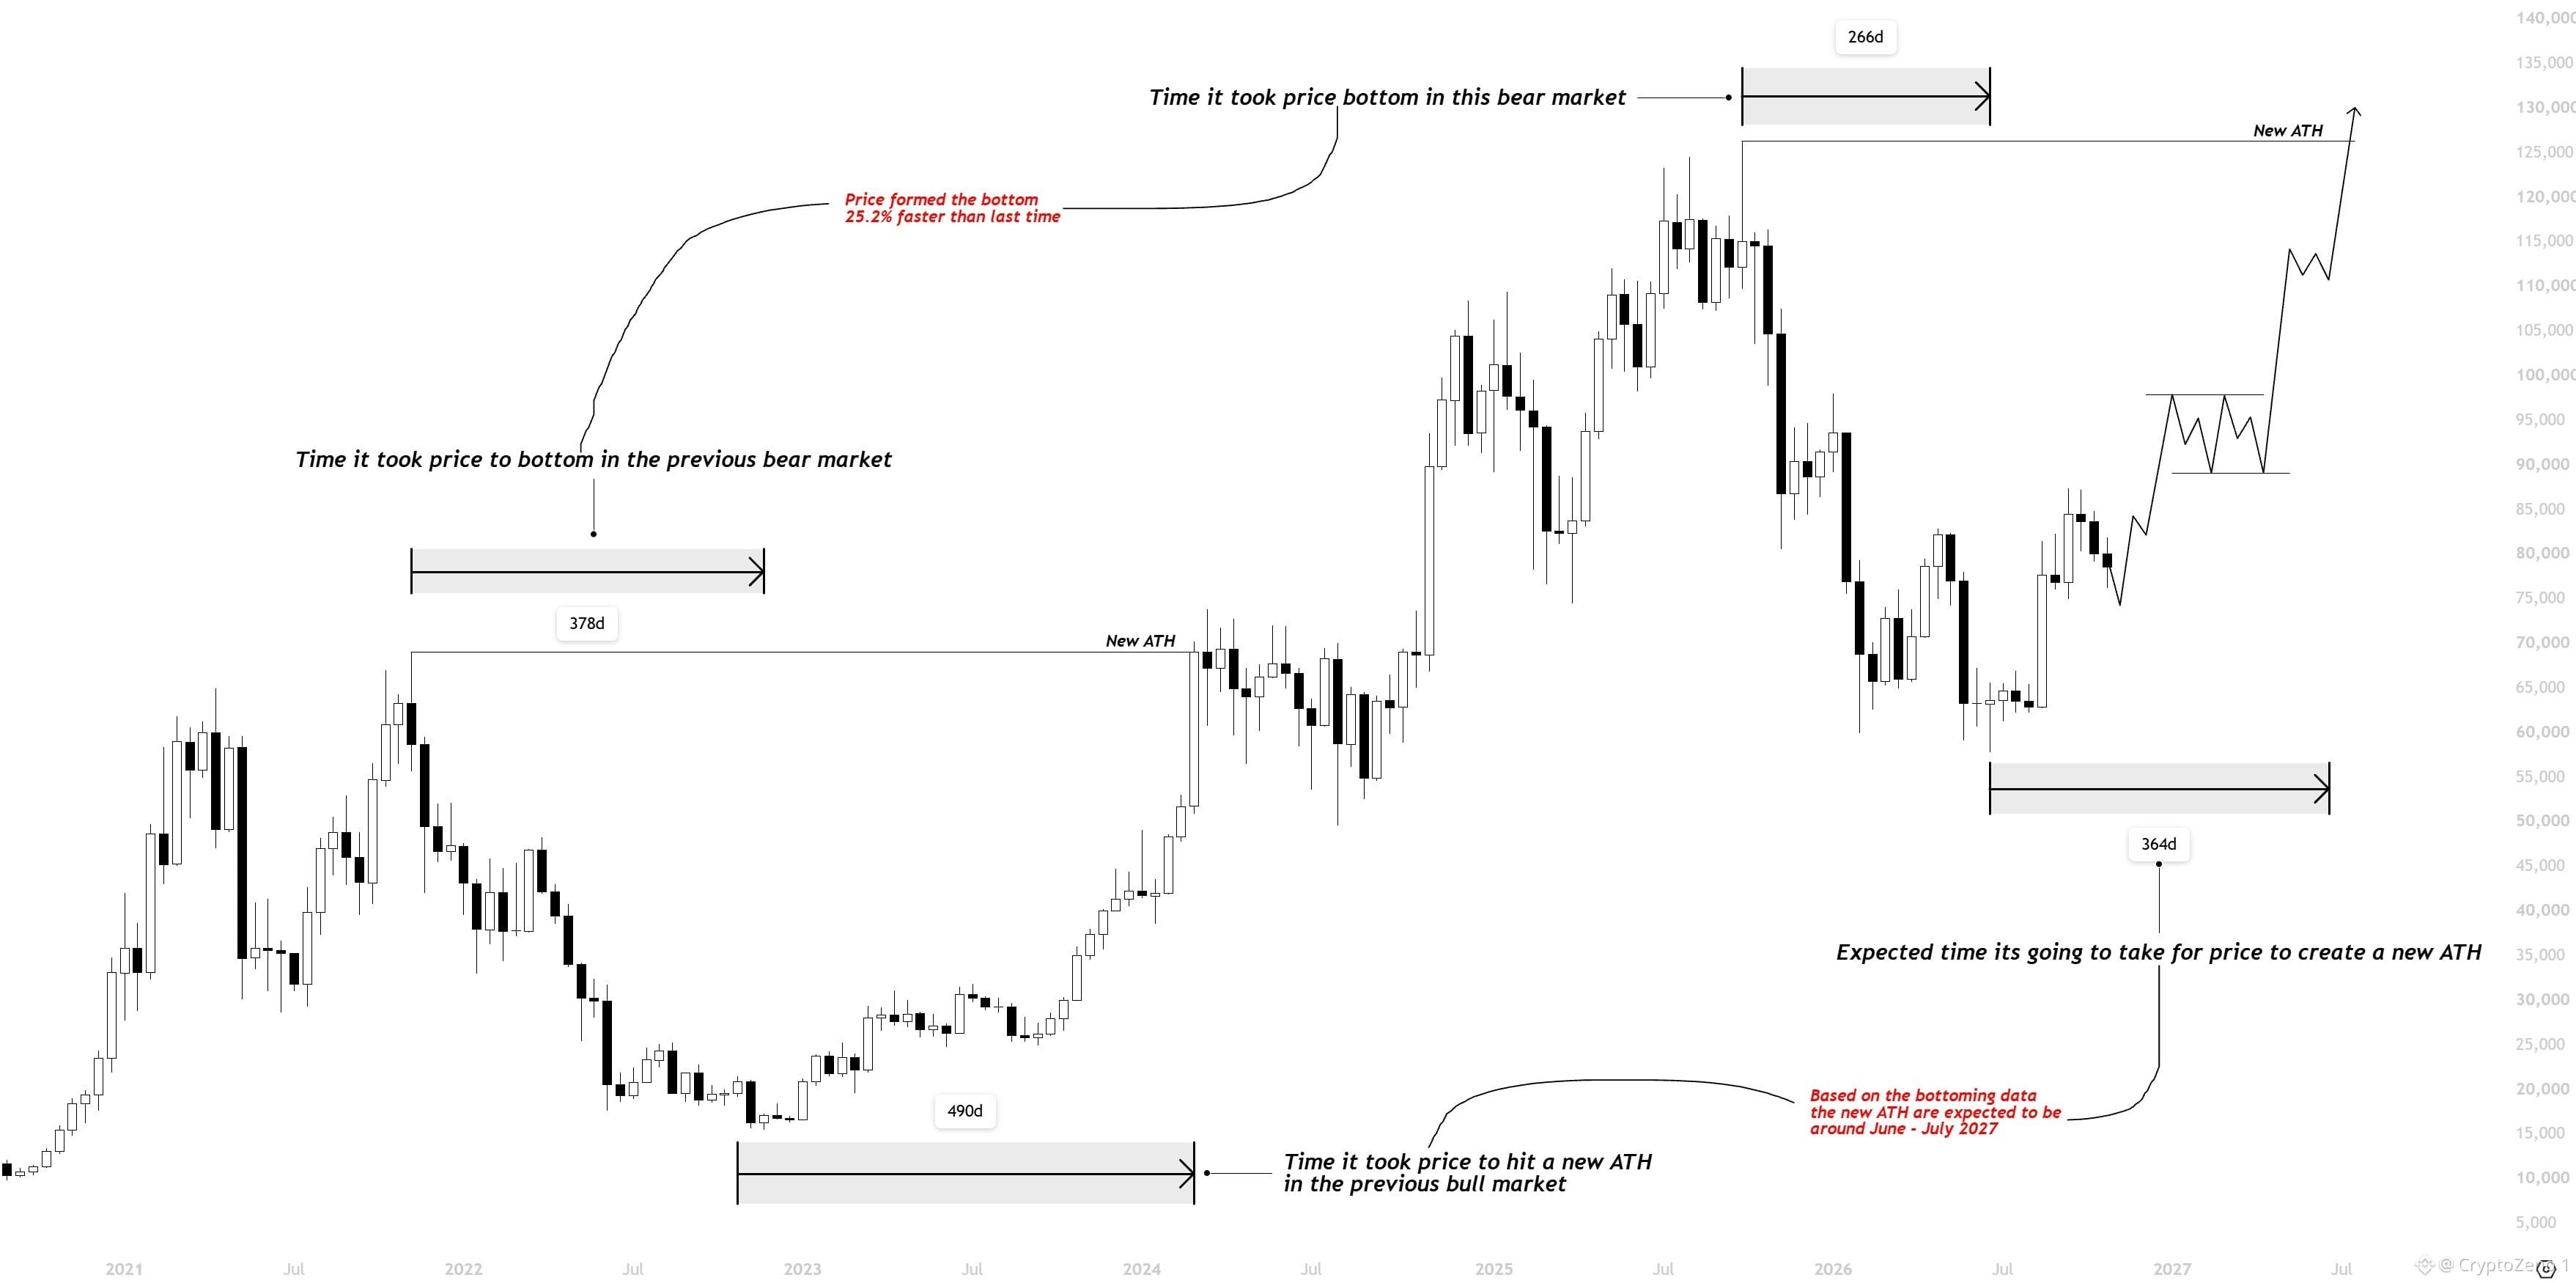
$BTC The 4 year cycle has finally broken,
Last bear market took 365 days to form its bottom.
Meanwhile this time, it took just 273 days to bottom and for comparison it's a 25.2% reduction.
Now let's look at the recovery phase, last cycle it took 486 days for price to reclaim a new ATH from the bottom.
If we apply the same time compression to this cycle, we get approximately 364 days (25.1% reduction).
That's nearly 4 months faster than the previous cycle.
Basically in short a new ATH is around 364 days away from the bottom, which puts us around June - July 2027.
(Reminder: We have already covered 126 days so far).
ACCUMULATE WHILE YOU CAN BECAUSE WE ARE GONNA RIP SOONER THAN YOU EXPECT. #BTC Price Analysis# #Macro Insights#
$BTC The 4 year cycle has finally broken,
Last bear market took 365 days to form its bottom.
Meanwhile this time, it took just 273 days to bottom and for comparison it's a 25.2% reduction.
Now let's look at the recovery phase, last cycle it took 486 days for price to reclaim a new ATH from the bottom.
If we apply the same time compression to this cycle, we get approximately 364 days (25.1% reduction).
That's nearly 4 months faster than the previous cycle.
Basically in short a new ATH is around 364 days away from the bottom, which puts us around June - July 2027.
(Reminder: We have already covered 126 days so far).
ACCUMULATE WHILE YOU CAN BECAUSE WE ARE GONNA RIP SOONER THAN YOU EXPECT. #BTC Price Analysis# #Macro Insights#
Last bear market took 365 days to form its bottom.
Meanwhile this time, it took just 273 days to bottom and for comparison it's a 25.2% reduction.
Now let's look at the recovery phase, last cycle it took 486 days for price to reclaim a new ATH from the bottom.
If we apply the same time compression to this cycle, we get approximately 364 days (25.1% reduction).
That's nearly 4 months faster than the previous cycle.
Basically in short a new ATH is around 364 days away from the bottom, which puts us around June - July 2027.
(Reminder: We have already covered 126 days so far).
ACCUMULATE WHILE YOU CAN BECAUSE WE ARE GONNA RIP SOONER THAN YOU EXPECT. #BTC Price Analysis# #Macro Insights#
69
·
--
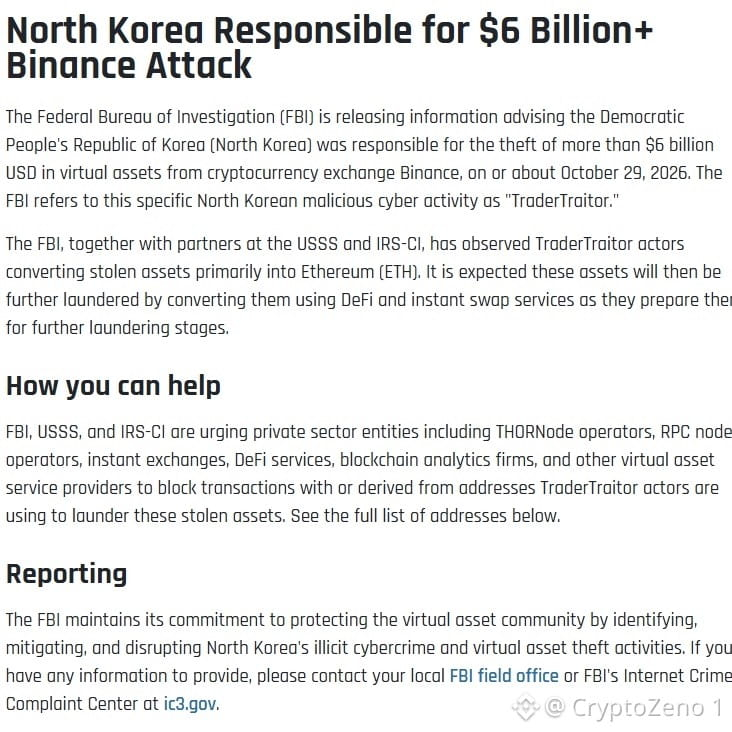
$BTC The FBI has now officially named North Korea as the force behind the $6.3 BILLION Binance hack.
It links the attack to TraderTraitor, the same hacking group tied to the $1.5 BILLION Bybit exploit.
The FBI is urging crypto platforms to block the #hackers wallets as they attempt to launder the stolen funds.
Binance says users won’t bear the losses and that 90% has already been covered. #BTC Price Analysis# #BNBChain#
$BTC The FBI has now officially named North Korea as the force behind the $6.3 BILLION Binance hack.
It links the attack to TraderTraitor, the same hacking group tied to the $1.5 BILLION Bybit exploit.
The FBI is urging crypto platforms to block the #hackers wallets as they attempt to launder the stolen funds.
Binance says users won’t bear the losses and that 90% has already been covered. #BTC Price Analysis# #BNBChain#
It links the attack to TraderTraitor, the same hacking group tied to the $1.5 BILLION Bybit exploit.
The FBI is urging crypto platforms to block the #hackers wallets as they attempt to launder the stolen funds.
Binance says users won’t bear the losses and that 90% has already been covered. #BTC Price Analysis# #BNBChain#

60
·
--
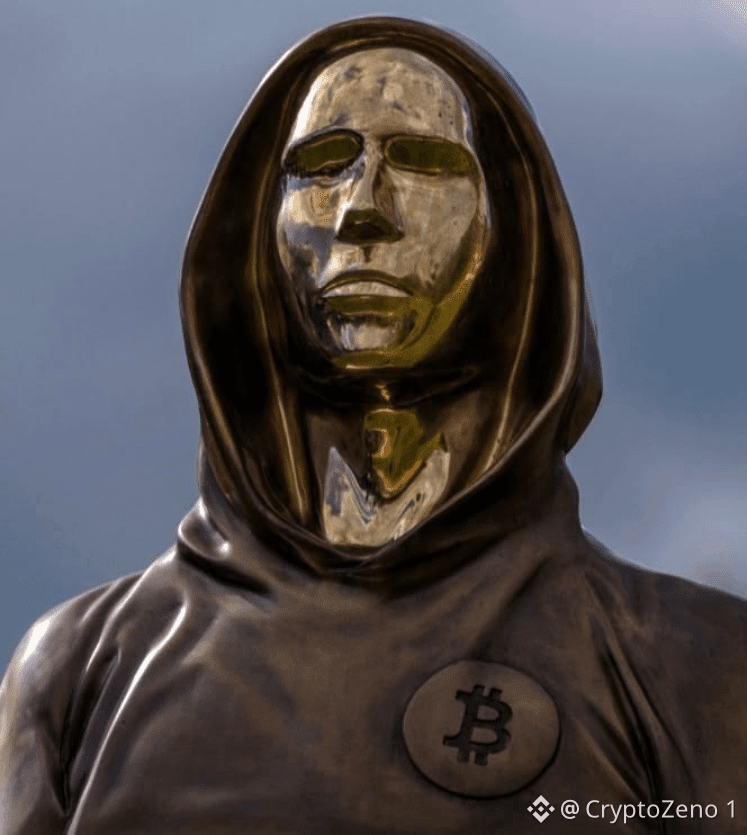
18 years ago today, in the middle of the 2008 financial crisis, an unknown person called Satoshi Nakamoto published a 9-page paper on a new kind of money called $BTC
Since then:
- 2009: The Bitcoin network goes live, Satoshi sends the first Bitcoin transaction to Hal Finney.
- 2010: Someone pays 10,000 $BTC for two pizzas
- 2011: Bitcoin hits $1
- 2012: First halving
- 2013: Bitcoin crosses $1,000
- 2016: Second halving
- 2017: Bitcoin crosses $10,000, and CME launches Bitcoin futures
- 2020: Third halving, and Strategy starts buying Bitcoin
- 2021: Tesla buys $1.5B of Bitcoin, and El Salvador makes it legal tender, Bitcoin reaches a $1 trillion market cap
- 2024: Spot Bitcoin ETFs launch, fourth halving, and Bitcoin crosses $100,000
- 2025: The US creates a Strategic Bitcoin Reserve, and Bitcoin hits a record $126,198
- The 20 millionth Bitcoin is mined.
All of this without its creator, who disappeared in 2011 and has never been found.
Happy 18th birthday, Bitcoin. #Macro Insights# #BTC Price Analysis# #SatoshiNakamoto
18 years ago today, in the middle of the 2008 financial crisis, an unknown person called Satoshi Nakamoto published a 9-page paper on a new kind of money called $BTC
Since then:
- 2009: The Bitcoin network goes live, Satoshi sends the first Bitcoin transaction to Hal Finney.
- 2010: Someone pays 10,000 $BTC for two pizzas
- 2011: Bitcoin hits $1
- 2012: First halving
- 2013: Bitcoin crosses $1,000
- 2016: Second halving
- 2017: Bitcoin crosses $10,000, and CME launches Bitcoin futures
- 2020: Third halving, and Strategy starts buying Bitcoin
- 2021: Tesla buys $1.5B of Bitcoin, and El Salvador makes it legal tender, Bitcoin reaches a $1 trillion market cap
- 2024: Spot Bitcoin ETFs launch, fourth halving, and Bitcoin crosses $100,000
- 2025: The US creates a Strategic Bitcoin Reserve, and Bitcoin hits a record $126,198
- The 20 millionth Bitcoin is mined.
All of this without its creator, who disappeared in 2011 and has never been found.
Happy 18th birthday, Bitcoin. #Macro Insights# #BTC Price Analysis# #SatoshiNakamoto
Since then:
- 2009: The Bitcoin network goes live, Satoshi sends the first Bitcoin transaction to Hal Finney.
- 2010: Someone pays 10,000 $BTC for two pizzas
- 2011: Bitcoin hits $1
- 2012: First halving
- 2013: Bitcoin crosses $1,000
- 2016: Second halving
- 2017: Bitcoin crosses $10,000, and CME launches Bitcoin futures
- 2020: Third halving, and Strategy starts buying Bitcoin
- 2021: Tesla buys $1.5B of Bitcoin, and El Salvador makes it legal tender, Bitcoin reaches a $1 trillion market cap
- 2024: Spot Bitcoin ETFs launch, fourth halving, and Bitcoin crosses $100,000
- 2025: The US creates a Strategic Bitcoin Reserve, and Bitcoin hits a record $126,198
- The 20 millionth Bitcoin is mined.
All of this without its creator, who disappeared in 2011 and has never been found.
Happy 18th birthday, Bitcoin. #Macro Insights# #BTC Price Analysis# #SatoshiNakamoto

46
·
--
$BTC
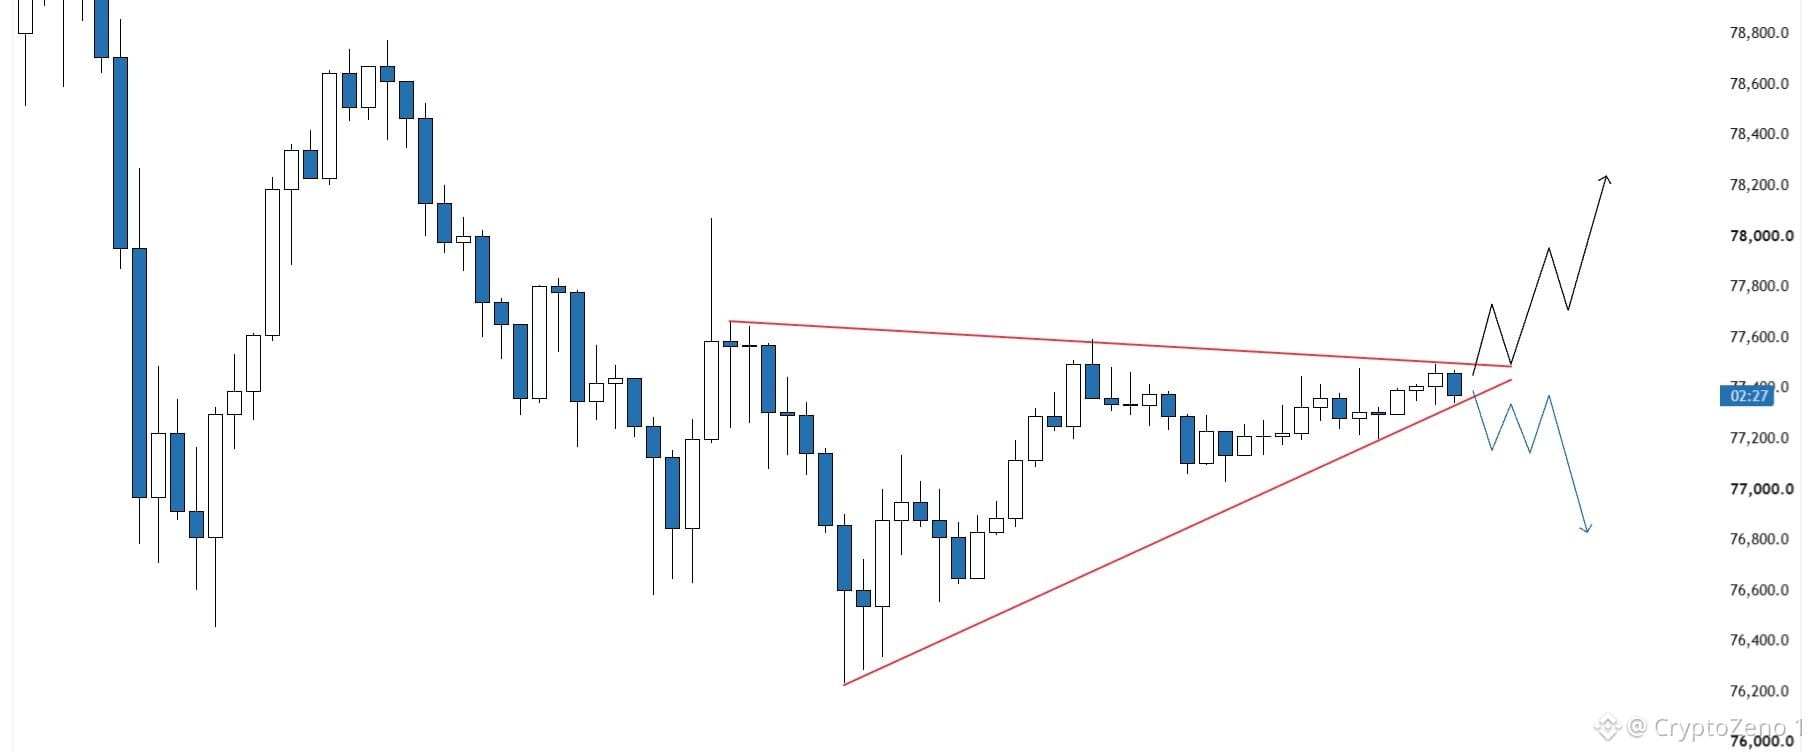
Could the local bottom already be in?
On the lower timeframes, BTC has formed an ascending triangle, which could signal a bullish reversal if we get a confirmed breakout.
Considering how exaggerated the current panic in the market seems, I wouldn't be surprised if this turns out to be the local bottom.
However, the breakout is crucial for this thesis.
If buyers fail to break out and price loses the lower boundary instead, I expect another pullback toward $75.2K. #BTC Price Analysis# #Macro Insights#
$BTC
Could the local bottom already be in?
On the lower timeframes, BTC has formed an ascending triangle, which could signal a bullish reversal if we get a confirmed breakout.
Considering how exaggerated the current panic in the market seems, I wouldn't be surprised if this turns out to be the local bottom.
However, the breakout is crucial for this thesis.
If buyers fail to break out and price loses the lower boundary instead, I expect another pullback toward $75.2K. #BTC Price Analysis# #Macro Insights#
Could the local bottom already be in?
On the lower timeframes, BTC has formed an ascending triangle, which could signal a bullish reversal if we get a confirmed breakout.
Considering how exaggerated the current panic in the market seems, I wouldn't be surprised if this turns out to be the local bottom.
However, the breakout is crucial for this thesis.
If buyers fail to break out and price loses the lower boundary instead, I expect another pullback toward $75.2K. #BTC Price Analysis# #Macro Insights#
63
·
--
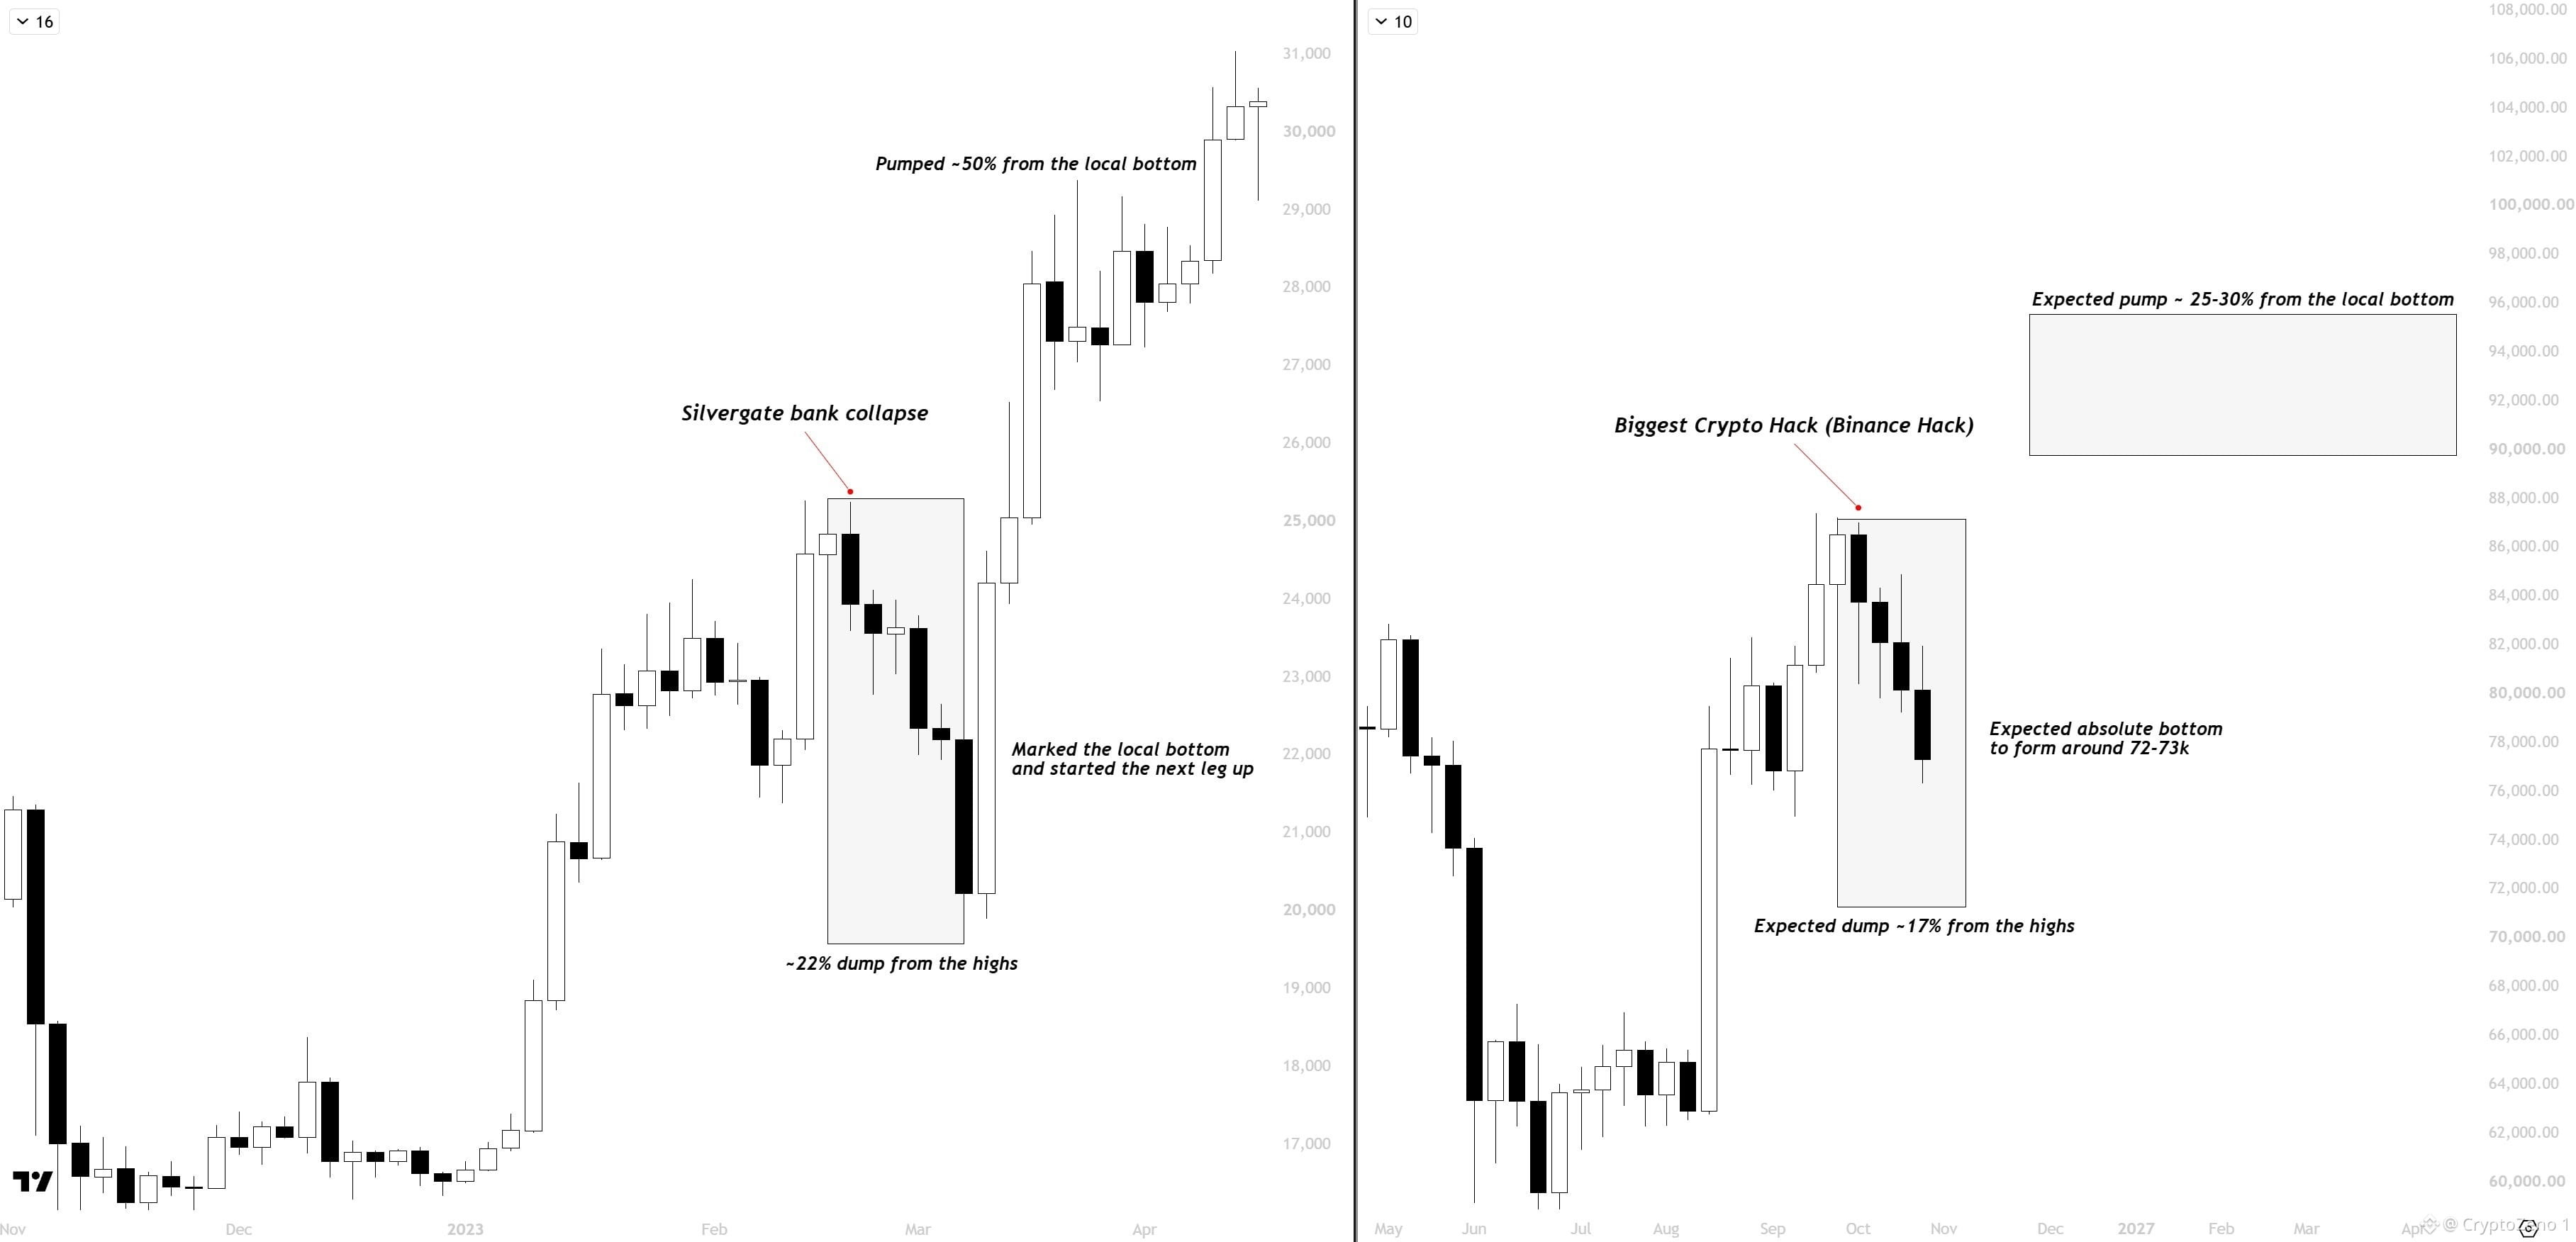
$BTC Last cycle we had a similar bearish catalyst that marked the local bottom,
Price dumped -22% from the highs in 2023 and this time I am expecting it to be around 16-17% dump from the highs.
The intriguing part is that after flushing the overleveraged positions,
Price pumped ~50% from the absolute bottom and the projected pump this time is around 25-30%.
It's nothing new, we get these catalysts play out from time to time, but the market does what it wants to.
Overall, it's just a matter of time before we mark the bottom and absolutely rip towards the upside. #BTC Price Analysis# #Macro Insights#
$BTC Last cycle we had a similar bearish catalyst that marked the local bottom,
Price dumped -22% from the highs in 2023 and this time I am expecting it to be around 16-17% dump from the highs.
The intriguing part is that after flushing the overleveraged positions,
Price pumped ~50% from the absolute bottom and the projected pump this time is around 25-30%.
It's nothing new, we get these catalysts play out from time to time, but the market does what it wants to.
Overall, it's just a matter of time before we mark the bottom and absolutely rip towards the upside. #BTC Price Analysis# #Macro Insights#
Price dumped -22% from the highs in 2023 and this time I am expecting it to be around 16-17% dump from the highs.
The intriguing part is that after flushing the overleveraged positions,
Price pumped ~50% from the absolute bottom and the projected pump this time is around 25-30%.
It's nothing new, we get these catalysts play out from time to time, but the market does what it wants to.
Overall, it's just a matter of time before we mark the bottom and absolutely rip towards the upside. #BTC Price Analysis# #Macro Insights#
68
·
--
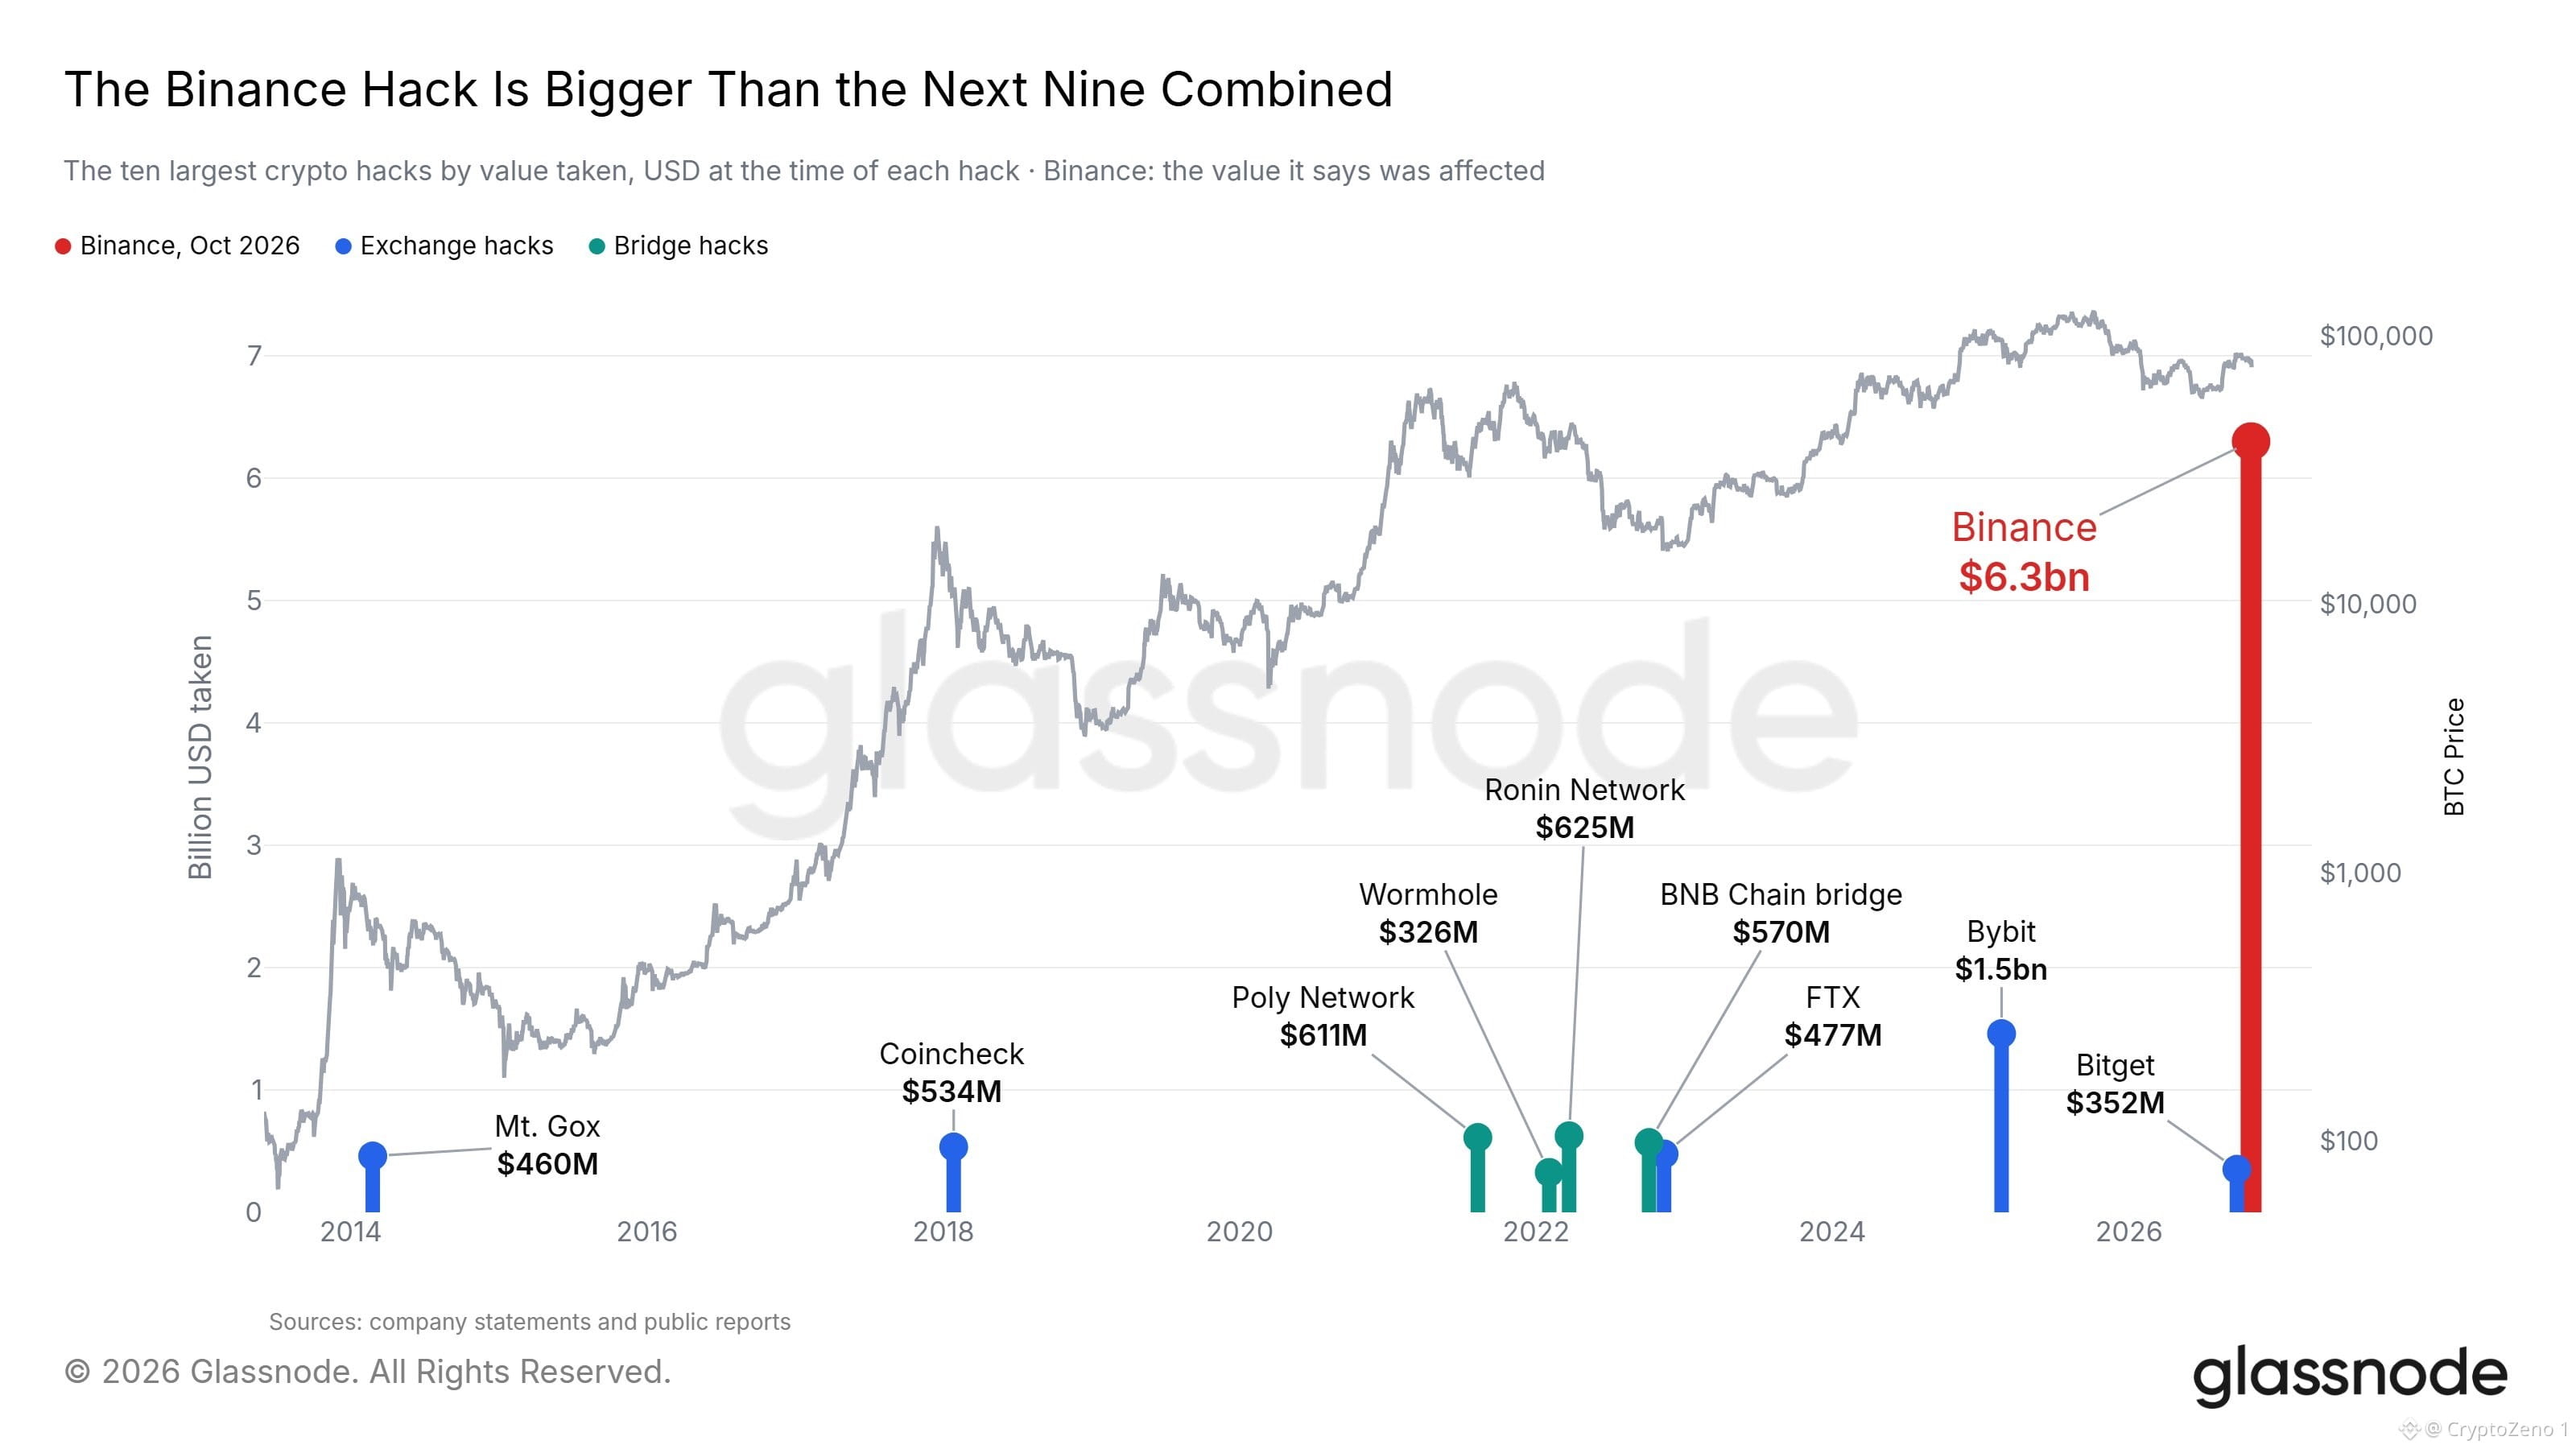
$BTC Yesterday’s #Binance hack is the largest in crypto history.
Over $6 billion was affected, more than the next 9 largest hacks combined.
The previous largest, Bybit in February 2025, was $1.5 billion.
3 out of the 10 largest have now happened since 2025, all at exchanges. #BTC Price Analysis# #BNBChain#
$BTC Yesterday’s #Binance hack is the largest in crypto history.
Over $6 billion was affected, more than the next 9 largest hacks combined.
The previous largest, Bybit in February 2025, was $1.5 billion.
3 out of the 10 largest have now happened since 2025, all at exchanges. #BTC Price Analysis# #BNBChain#
Over $6 billion was affected, more than the next 9 largest hacks combined.
The previous largest, Bybit in February 2025, was $1.5 billion.
3 out of the 10 largest have now happened since 2025, all at exchanges. #BTC Price Analysis# #BNBChain#
28
·
--
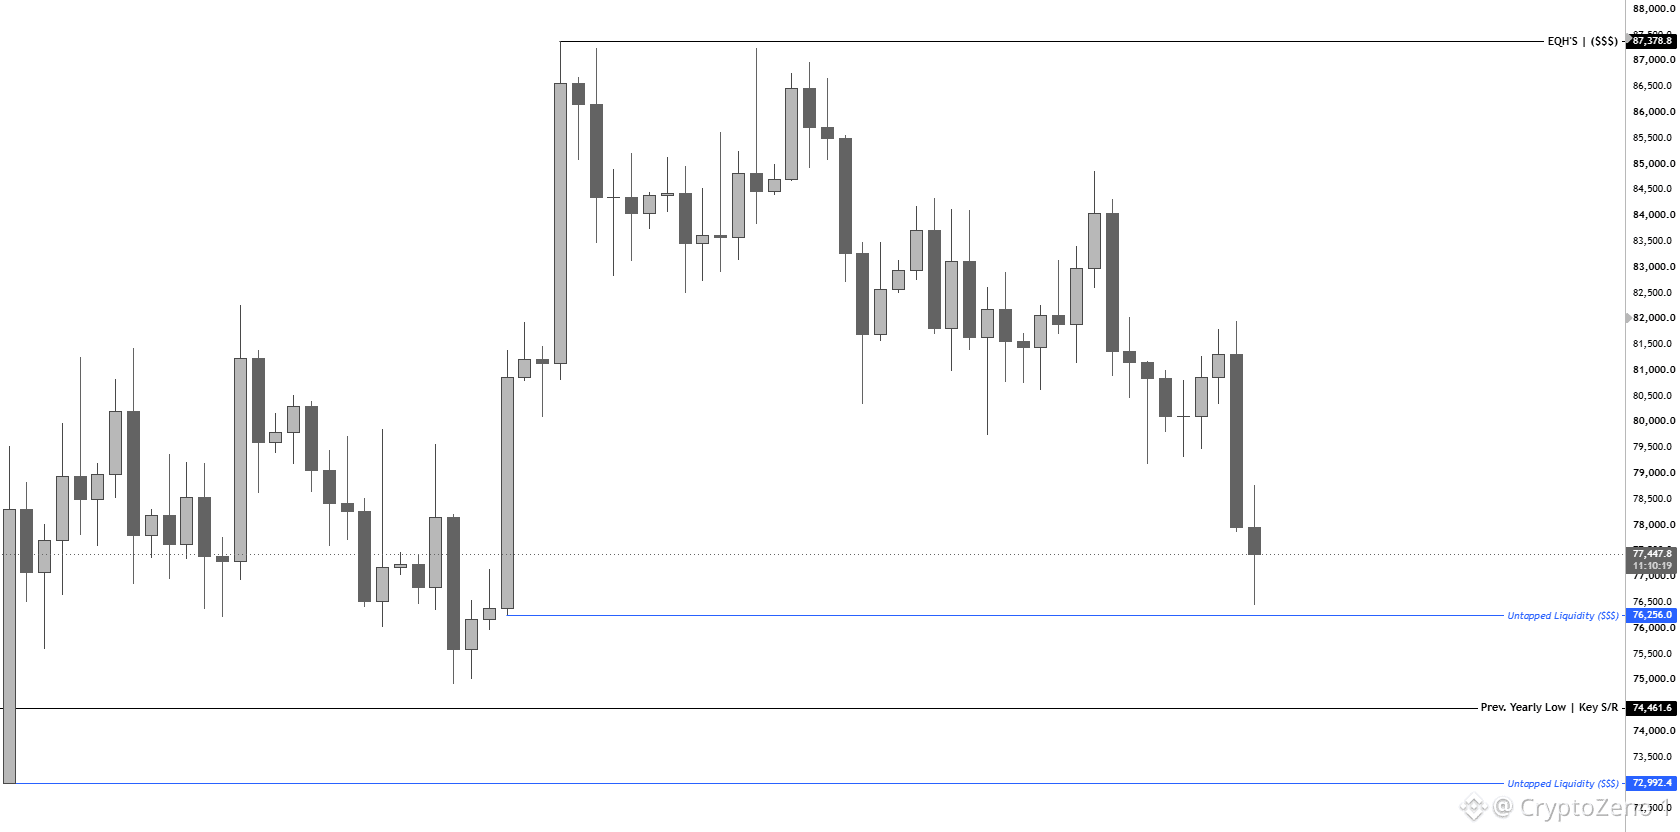
$BTC There's a good chance we sweep the 74.9k low right at the start of next month.
That zone also aligns with the previous yearly candle low, which should act as a strong S/R on revisit.
Ideally, I'd like to see a wick into the 74.9k-72.9k region at the beginning of next month for clearing out the liquidity below the previous low region.
However, I'm also keeping 76.2k as a potential front-run level in case we don't sweep the low and give everyone the obvious long entry.
Either way, all three of these levels are of high interest to me.
If you aren't long already, I'd pay close attention to these zones for a potential swing entry targeting 93k region. #BTC Price Analysis# #Macro Insights#
$BTC There's a good chance we sweep the 74.9k low right at the start of next month.
That zone also aligns with the previous yearly candle low, which should act as a strong S/R on revisit.
Ideally, I'd like to see a wick into the 74.9k-72.9k region at the beginning of next month for clearing out the liquidity below the previous low region.
However, I'm also keeping 76.2k as a potential front-run level in case we don't sweep the low and give everyone the obvious long entry.
Either way, all three of these levels are of high interest to me.
If you aren't long already, I'd pay close attention to these zones for a potential swing entry targeting 93k region. #BTC Price Analysis# #Macro Insights#
That zone also aligns with the previous yearly candle low, which should act as a strong S/R on revisit.
Ideally, I'd like to see a wick into the 74.9k-72.9k region at the beginning of next month for clearing out the liquidity below the previous low region.
However, I'm also keeping 76.2k as a potential front-run level in case we don't sweep the low and give everyone the obvious long entry.
Either way, all three of these levels are of high interest to me.
If you aren't long already, I'd pay close attention to these zones for a potential swing entry targeting 93k region. #BTC Price Analysis# #Macro Insights#
25
·
--
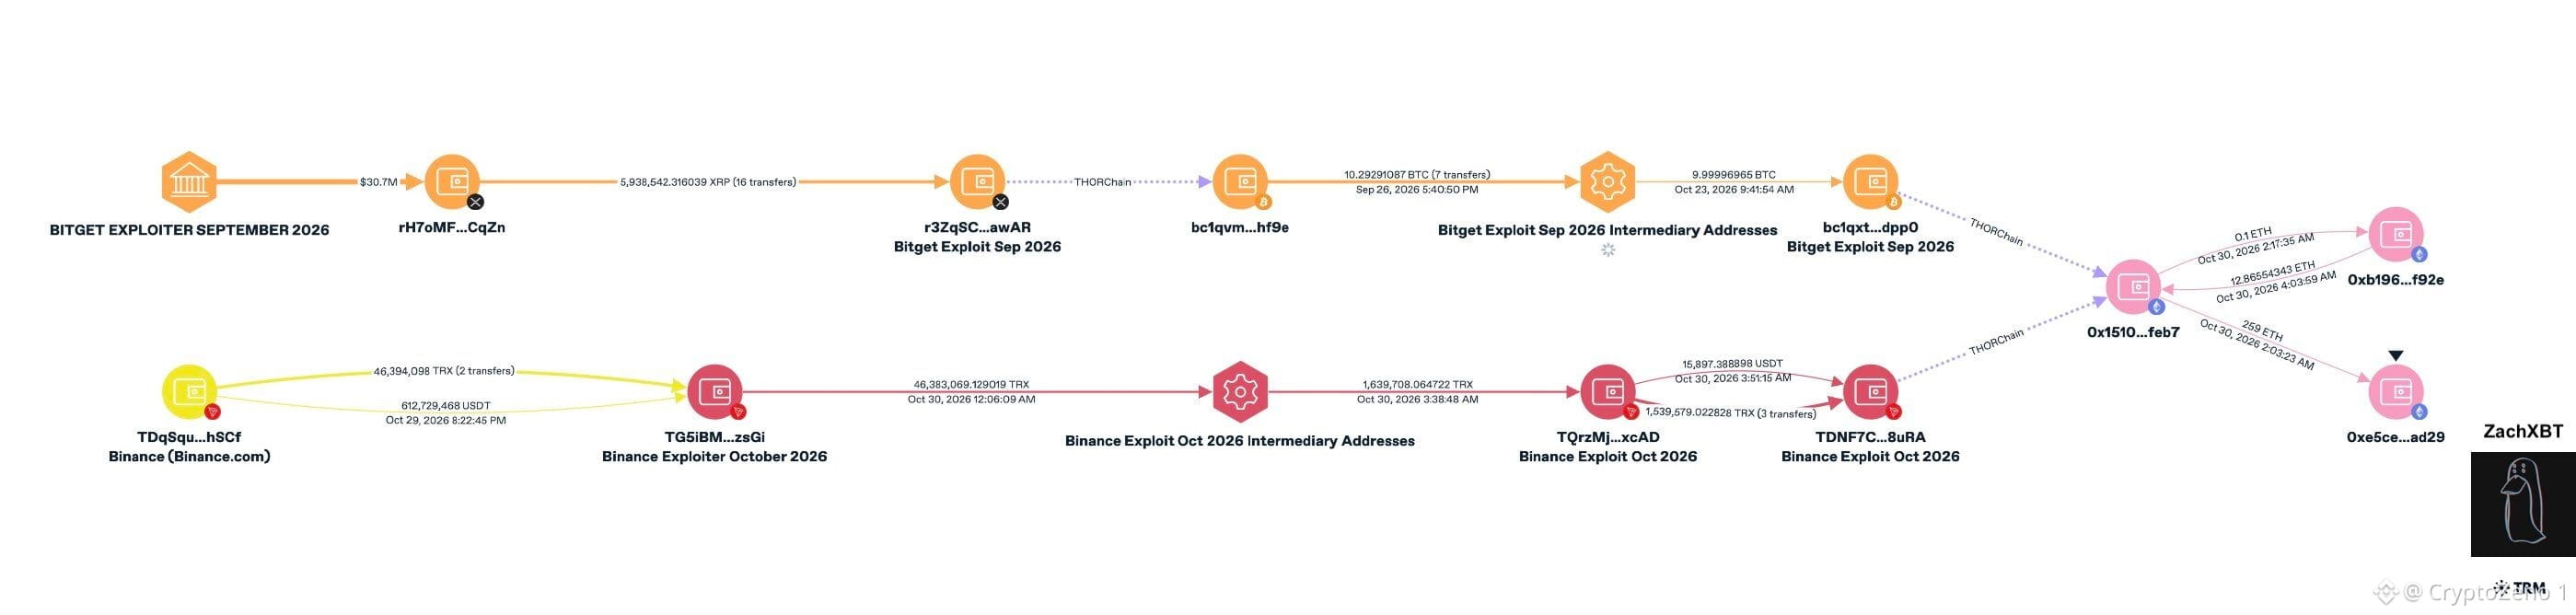
🚨 UPDATE: $BTC North Korea’s TraderTraitor group, tied to the $388M Bitget exploit, is likely also behind the $6.3B Binance hack, says ZachXBT.
Stolen funds from both landed at one address. #BTC Price Analysis# #Macro Insights# #BNBChain#
🚨 UPDATE: $BTC North Korea’s TraderTraitor group, tied to the $388M Bitget exploit, is likely also behind the $6.3B Binance hack, says ZachXBT.
Stolen funds from both landed at one address. #BTC Price Analysis# #Macro Insights# #BNBChain#
Stolen funds from both landed at one address. #BTC Price Analysis# #Macro Insights# #BNBChain#
35
·
--
BREAKING: 🇰🇵 CNN reports that North Korea was behind the $6 BILLION Binance hack.
The scale of this attack is absolutely insane, and it raises serious questions about the security of even the biggest exchanges in the industry. $BTC #BTC Price Analysis# #BNBChain# #binancehack
BREAKING: 🇰🇵 CNN reports that North Korea was behind the $6 BILLION Binance hack.
The scale of this attack is absolutely insane, and it raises serious questions about the security of even the biggest exchanges in the industry. $BTC #BTC Price Analysis# #BNBChain# #binancehack
The scale of this attack is absolutely insane, and it raises serious questions about the security of even the biggest exchanges in the industry. $BTC #BTC Price Analysis# #BNBChain# #binancehack


54
·
--
BREAKING: $BTC BINANCE JUST CONFIRMED IT WILL COVER ALL LOSSES FROM TODAY’S HACK
THE WORLD’S LARGEST #BITCOIN AND CRYPTO EXCHANGE JUST PUBLICLY AGREED TO MAKE 300,000,000 USERS WHOLE
THEY WON’T LOSE A SINGLE SAT
THIS IS THE WAY 🔥🔥🔥 #BTC Price Analysis# #Macro Insights# #BNBChain#
BREAKING: $BTC BINANCE JUST CONFIRMED IT WILL COVER ALL LOSSES FROM TODAY’S HACK
THE WORLD’S LARGEST #BITCOIN AND CRYPTO EXCHANGE JUST PUBLICLY AGREED TO MAKE 300,000,000 USERS WHOLE
THEY WON’T LOSE A SINGLE SAT
THIS IS THE WAY 🔥🔥🔥 #BTC Price Analysis# #Macro Insights# #BNBChain#
THE WORLD’S LARGEST #BITCOIN AND CRYPTO EXCHANGE JUST PUBLICLY AGREED TO MAKE 300,000,000 USERS WHOLE
THEY WON’T LOSE A SINGLE SAT
THIS IS THE WAY 🔥🔥🔥 #BTC Price Analysis# #Macro Insights# #BNBChain#


·
--
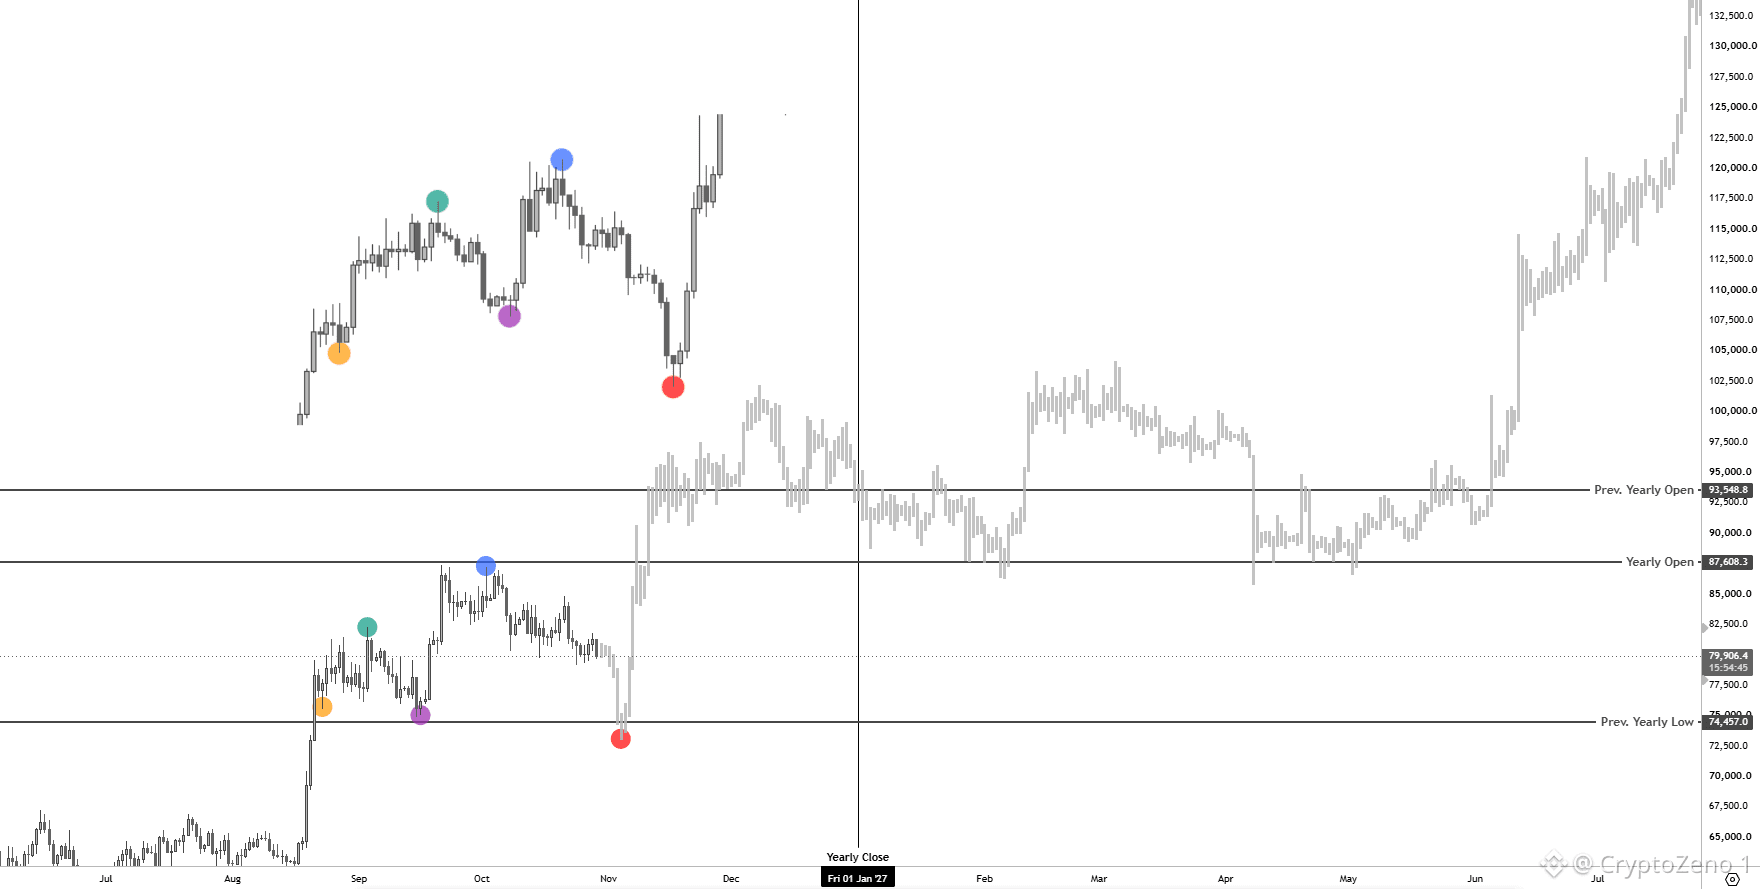
$BTC Zoomed in w/ Last Cycle's Fractals
Now, We all know that we've been following the Last Cycle's PA pretty much to the dot so far. However, I don't solely rely on historical references as they're never guaranteed to play out again, and each cycle's PA is different from the last one in one way or another.
But the thing is, When I couple the Yearly Candle Time + Liquidity analysis I shared above with the last cycle's price action, They pretty much complement each other.
In fact, It feels less like a historical PA reference here and more like a visual representation of that thought process on the chart right now.
Based on this Fractal, The roadmap is the same:
--> Retest of the previous yearly candle's low to complete HTF Wave 2.
--> Pump back above the yearly open and close the year in green around 93.6k
--> Next yearly candle holds the current yearly open and continues towards the upside.
Pretty much what I shared in the post above, and both scenarios line up pretty well and complement each other.
So where I'm getting at is that if we lose the current lows, It would very likely mean we repeat something similar to what we saw back in 2023.
A HTF correction is due, and the 74k-72k region has always remained on my radar.
However, For that region to come into play, We first need to break below the 0.618 Fib on the 1D, sitting at 79.6k. #BTC Price Analysis# #Macro Insights#
$BTC Zoomed in w/ Last Cycle's Fractals
Now, We all know that we've been following the Last Cycle's PA pretty much to the dot so far. However, I don't solely rely on historical references as they're never guaranteed to play out again, and each cycle's PA is different from the last one in one way or another.
But the thing is, When I couple the Yearly Candle Time + Liquidity analysis I shared above with the last cycle's price action, They pretty much complement each other.
In fact, It feels less like a historical PA reference here and more like a visual representation of that thought process on the chart right now.
Based on this Fractal, The roadmap is the same:
--> Retest of the previous yearly candle's low to complete HTF Wave 2.
--> Pump back above the yearly open and close the year in green around 93.6k
--> Next yearly candle holds the current yearly open and continues towards the upside.
Pretty much what I shared in the post above, and both scenarios line up pretty well and complement each other.
So where I'm getting at is that if we lose the current lows, It would very likely mean we repeat something similar to what we saw back in 2023.
A HTF correction is due, and the 74k-72k region has always remained on my radar.
However, For that region to come into play, We first need to break below the 0.618 Fib on the 1D, sitting at 79.6k. #BTC Price Analysis# #Macro Insights#
Now, We all know that we've been following the Last Cycle's PA pretty much to the dot so far. However, I don't solely rely on historical references as they're never guaranteed to play out again, and each cycle's PA is different from the last one in one way or another.
But the thing is, When I couple the Yearly Candle Time + Liquidity analysis I shared above with the last cycle's price action, They pretty much complement each other.
In fact, It feels less like a historical PA reference here and more like a visual representation of that thought process on the chart right now.
Based on this Fractal, The roadmap is the same:
--> Retest of the previous yearly candle's low to complete HTF Wave 2.
--> Pump back above the yearly open and close the year in green around 93.6k
--> Next yearly candle holds the current yearly open and continues towards the upside.
Pretty much what I shared in the post above, and both scenarios line up pretty well and complement each other.
So where I'm getting at is that if we lose the current lows, It would very likely mean we repeat something similar to what we saw back in 2023.
A HTF correction is due, and the 74k-72k region has always remained on my radar.
However, For that region to come into play, We first need to break below the 0.618 Fib on the 1D, sitting at 79.6k. #BTC Price Analysis# #Macro Insights#
60
·
--
THIS IS ACTUALLY CRAZY!
A 19 year old named Trenton Johnston stole 185 $BTC worth $13 MILLION with just one phone call.
He called pretending to be Google and Trezor support and told the victim their wallet was getting hacked.
They panicked and handed over their keys.
He blew the money on a Lamborghini, a Rolls-Royce and private jets.
Then went and bragged about it on Signal and Discord.
11 days later, cops caught him for speeding in that same Rolls-Royce.
The victim lost all his life savings, but this guy only got a 25-month sentence.
If you're in crypto, never share your keys with anyone. Not even "support." #BTC Price Analysis# #Macro Insights#
THIS IS ACTUALLY CRAZY!
A 19 year old named Trenton Johnston stole 185 $BTC worth $13 MILLION with just one phone call.
He called pretending to be Google and Trezor support and told the victim their wallet was getting hacked.
They panicked and handed over their keys.
He blew the money on a Lamborghini, a Rolls-Royce and private jets.
Then went and bragged about it on Signal and Discord.
11 days later, cops caught him for speeding in that same Rolls-Royce.
The victim lost all his life savings, but this guy only got a 25-month sentence.
If you're in crypto, never share your keys with anyone. Not even "support." #BTC Price Analysis# #Macro Insights#
A 19 year old named Trenton Johnston stole 185 $BTC worth $13 MILLION with just one phone call.
He called pretending to be Google and Trezor support and told the victim their wallet was getting hacked.
They panicked and handed over their keys.
He blew the money on a Lamborghini, a Rolls-Royce and private jets.
Then went and bragged about it on Signal and Discord.
11 days later, cops caught him for speeding in that same Rolls-Royce.
The victim lost all his life savings, but this guy only got a 25-month sentence.
If you're in crypto, never share your keys with anyone. Not even "support." #BTC Price Analysis# #Macro Insights#

·
--
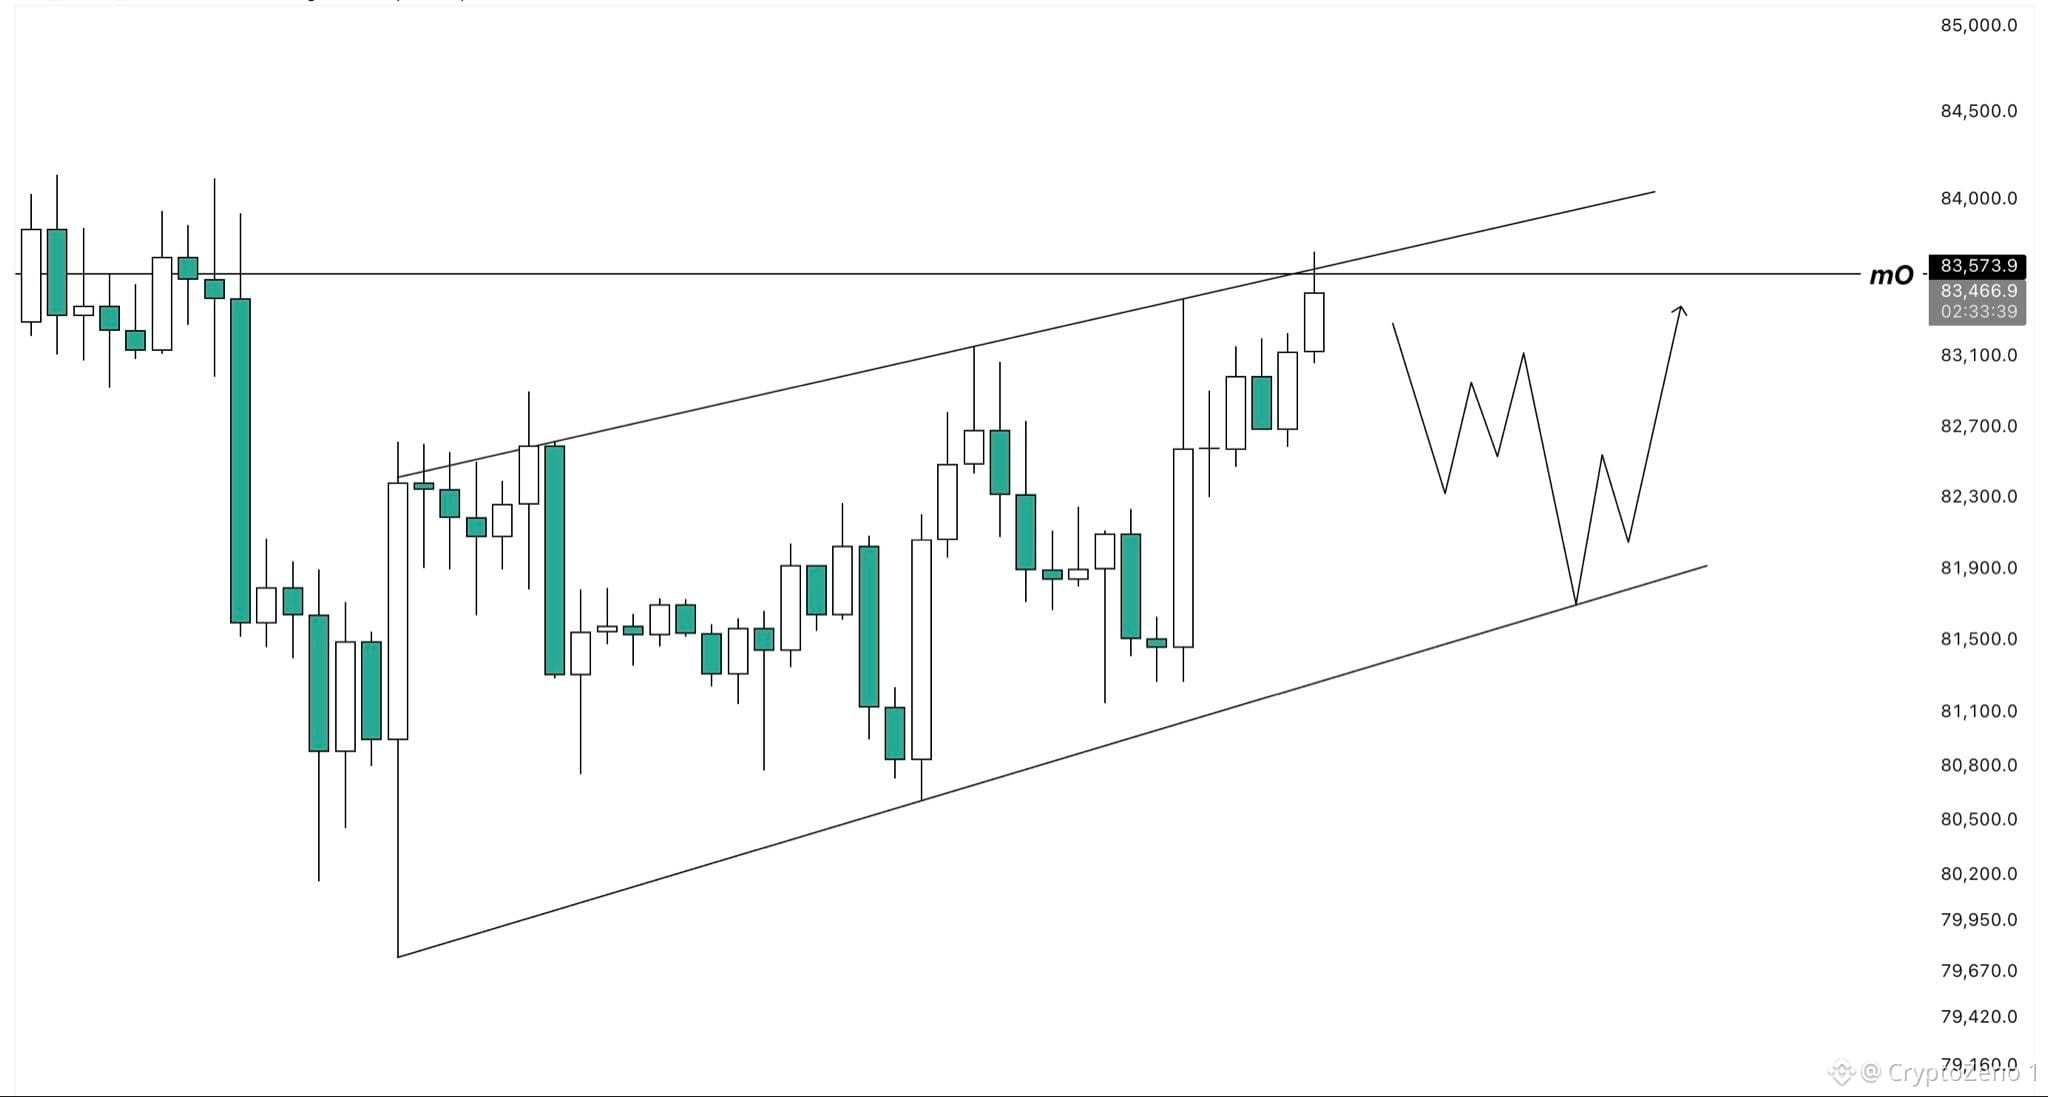
$BTC
is approaching a key decision point.
Price has been grinding higher inside a rising channel, consistently printing higher highs and higher lows.
The upper boundary now lines up almost perfectly with the monthly open around $83.6k, while the $84k region right above also marks the previous intermediate timeframe high.
This creates a pretty heavy resistance cluster, especially considering that $84k is an area many traders are likely watching for shorts.
A rejection from this region could send price back towards $81.5k-$81.8k for another test of the lower part of the channel.
If buyers manage to reclaim the previous high around $84k instead, I’d expect BTC to continue towards the range highs around $87k. #BTC Price Analysis# #Macro Insights#
$BTC
is approaching a key decision point.
Price has been grinding higher inside a rising channel, consistently printing higher highs and higher lows.
The upper boundary now lines up almost perfectly with the monthly open around $83.6k, while the $84k region right above also marks the previous intermediate timeframe high.
This creates a pretty heavy resistance cluster, especially considering that $84k is an area many traders are likely watching for shorts.
A rejection from this region could send price back towards $81.5k-$81.8k for another test of the lower part of the channel.
If buyers manage to reclaim the previous high around $84k instead, I’d expect BTC to continue towards the range highs around $87k. #BTC Price Analysis# #Macro Insights#
is approaching a key decision point.
Price has been grinding higher inside a rising channel, consistently printing higher highs and higher lows.
The upper boundary now lines up almost perfectly with the monthly open around $83.6k, while the $84k region right above also marks the previous intermediate timeframe high.
This creates a pretty heavy resistance cluster, especially considering that $84k is an area many traders are likely watching for shorts.
A rejection from this region could send price back towards $81.5k-$81.8k for another test of the lower part of the channel.
If buyers manage to reclaim the previous high around $84k instead, I’d expect BTC to continue towards the range highs around $87k. #BTC Price Analysis# #Macro Insights#
84
·
--
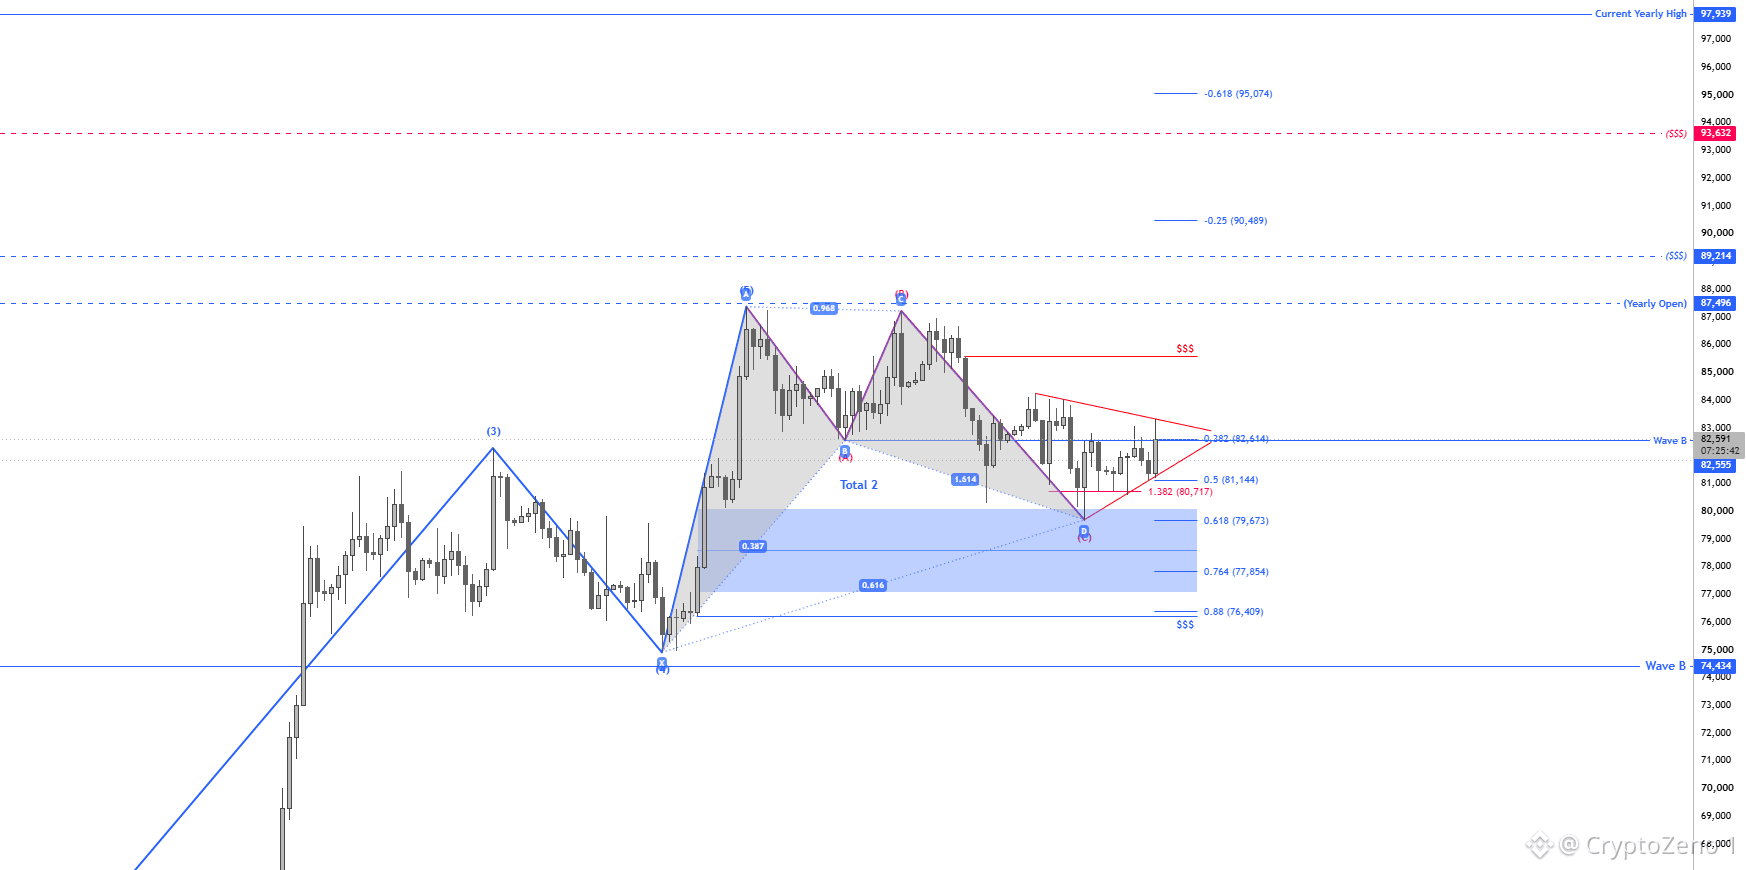
$BTC Nothing much to update...
Don't try to force an outcome or get biased when we're trading inside a compressed range like this.
If anything, look for quick scalps from the range highs/lows.
This is one of those times where you gotta play level to level and wait for the PA itself to show its hand.
We're inside a symmetrical triangle, which can break out in either direction.
However, if we zoom out, we're bouncing after clearing some of the imbalance created on the 1D/2D during the previous leg up.
Inside that imbalance, we printed Wave D on TOTAL 2 and completed the ABC correction as well.
So technically, we should now be inside Wave 1 of the next count.
But for an impulsive move towards the upside, we need to reclaim Wave B on TOTAL 2 at 82.5k.
So far, we haven't seen a substantial higher timeframe close above it, which keeps the possibility of a bearish breakout from this symmetrical on the table as well.
From a Weekly/Monthly perspective, I still don't see anything pointing towards a reversal.
This move down is a bullish pullback, and nothing about my HTF bias has changed.
Worst case we see 76k-74k before higher, And that will likely be the last time we'll see those prices. #BTC Price Analysis# #Macro Insights#
$BTC Nothing much to update...
Don't try to force an outcome or get biased when we're trading inside a compressed range like this.
If anything, look for quick scalps from the range highs/lows.
This is one of those times where you gotta play level to level and wait for the PA itself to show its hand.
We're inside a symmetrical triangle, which can break out in either direction.
However, if we zoom out, we're bouncing after clearing some of the imbalance created on the 1D/2D during the previous leg up.
Inside that imbalance, we printed Wave D on TOTAL 2 and completed the ABC correction as well.
So technically, we should now be inside Wave 1 of the next count.
But for an impulsive move towards the upside, we need to reclaim Wave B on TOTAL 2 at 82.5k.
So far, we haven't seen a substantial higher timeframe close above it, which keeps the possibility of a bearish breakout from this symmetrical on the table as well.
From a Weekly/Monthly perspective, I still don't see anything pointing towards a reversal.
This move down is a bullish pullback, and nothing about my HTF bias has changed.
Worst case we see 76k-74k before higher, And that will likely be the last time we'll see those prices. #BTC Price Analysis# #Macro Insights#
Don't try to force an outcome or get biased when we're trading inside a compressed range like this.
If anything, look for quick scalps from the range highs/lows.
This is one of those times where you gotta play level to level and wait for the PA itself to show its hand.
We're inside a symmetrical triangle, which can break out in either direction.
However, if we zoom out, we're bouncing after clearing some of the imbalance created on the 1D/2D during the previous leg up.
Inside that imbalance, we printed Wave D on TOTAL 2 and completed the ABC correction as well.
So technically, we should now be inside Wave 1 of the next count.
But for an impulsive move towards the upside, we need to reclaim Wave B on TOTAL 2 at 82.5k.
So far, we haven't seen a substantial higher timeframe close above it, which keeps the possibility of a bearish breakout from this symmetrical on the table as well.
From a Weekly/Monthly perspective, I still don't see anything pointing towards a reversal.
This move down is a bullish pullback, and nothing about my HTF bias has changed.
Worst case we see 76k-74k before higher, And that will likely be the last time we'll see those prices. #BTC Price Analysis# #Macro Insights#
64
·
--
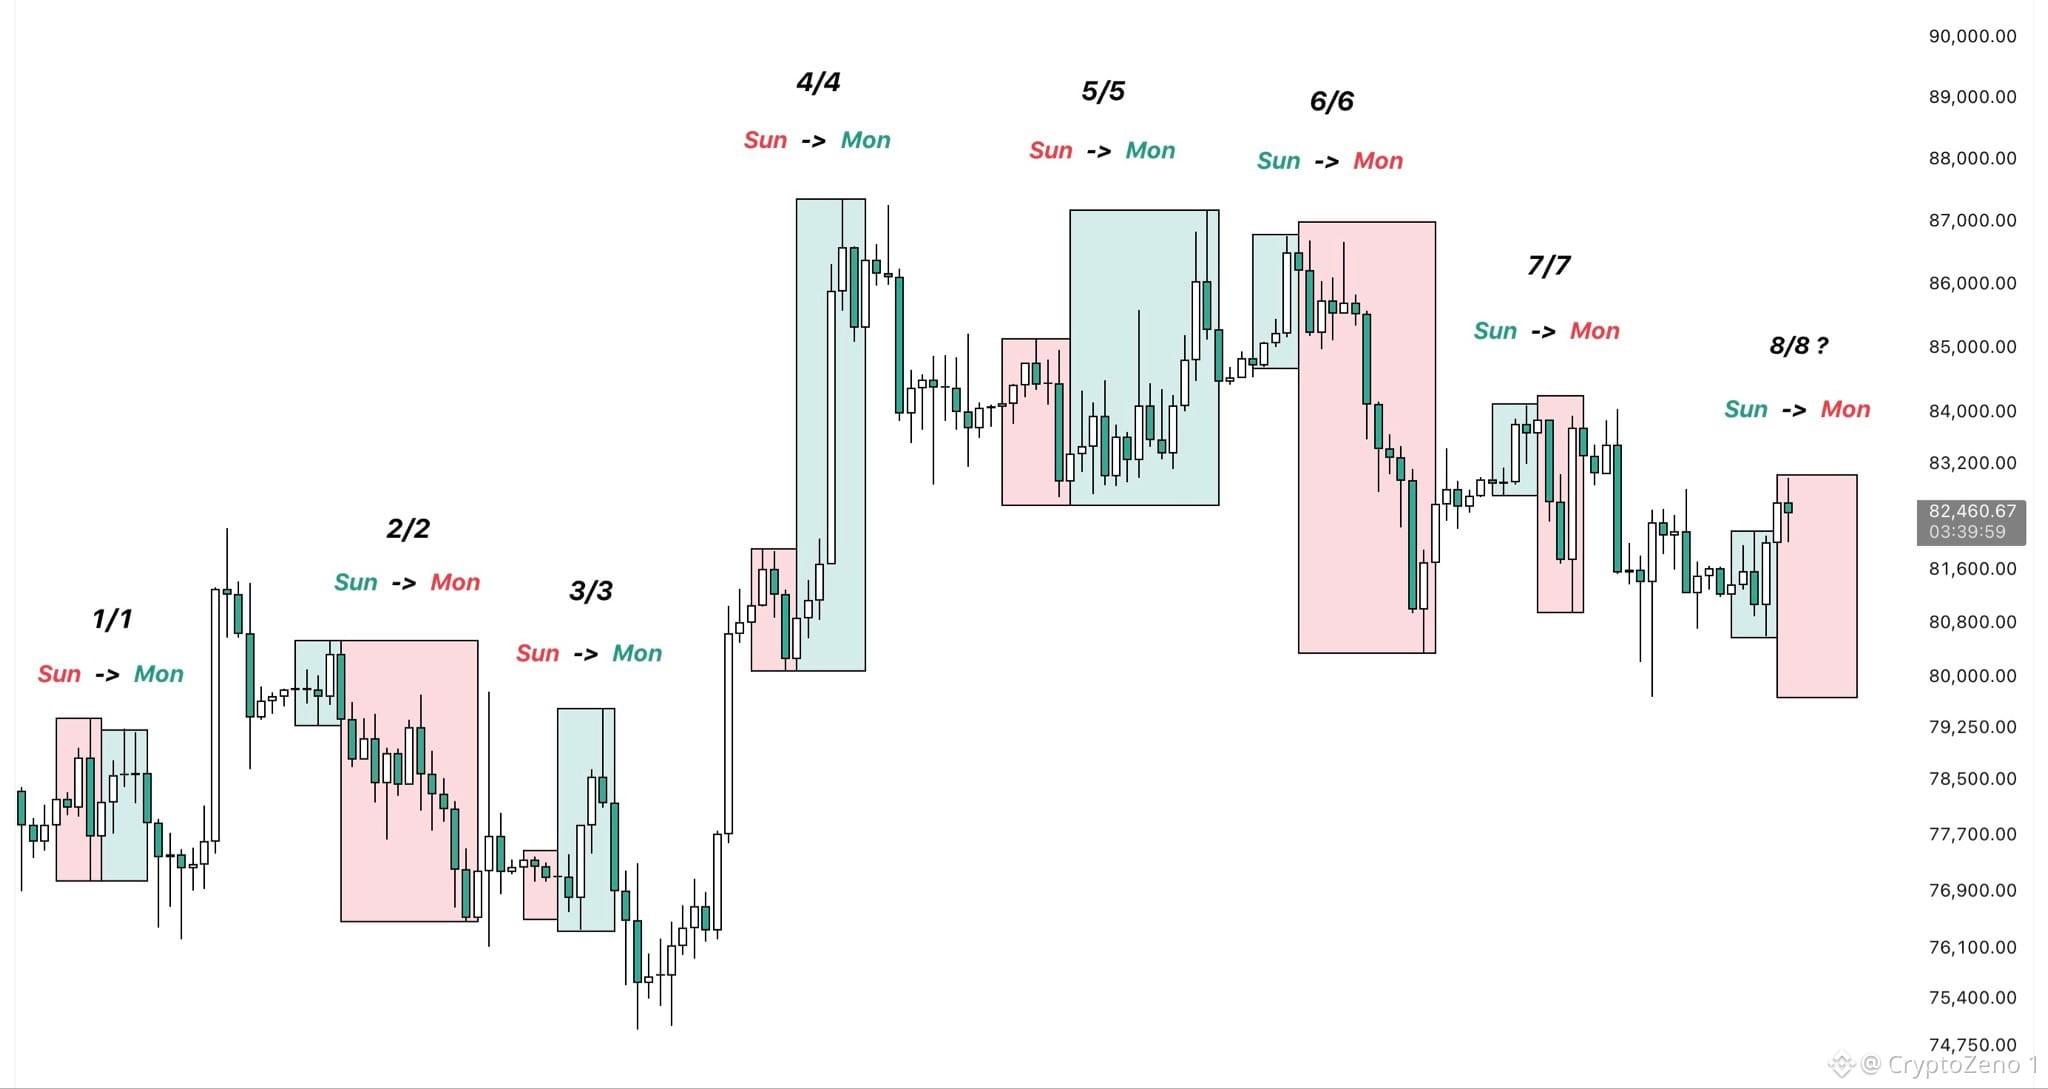
$BTC Lately, Sunday moves have had the tendency of getting reversed during the following week.
Looking at the past seven weeks, this Sunday to Monday correlation pattern has played out every single time.
Yesterday’s Sunday closed green, which would suggest another dump over the next few days if price continues following this pattern.
What’s also interesting is that this weekly candle opened and we saw a move to the upside right away.
Usually, whenever price moves aggressively into one direction right at the open of a new weekly candle, this tends to be a manipulation move.
Of course, a total sample size of 7 isn’t big enough to draw any major conclusions from this pattern alone, but combined with the immediate move higher at the weekly open, it’s definitely worth keeping an eye on. #BTC Price Analysis# #Macro Insights#
$BTC Lately, Sunday moves have had the tendency of getting reversed during the following week.
Looking at the past seven weeks, this Sunday to Monday correlation pattern has played out every single time.
Yesterday’s Sunday closed green, which would suggest another dump over the next few days if price continues following this pattern.
What’s also interesting is that this weekly candle opened and we saw a move to the upside right away.
Usually, whenever price moves aggressively into one direction right at the open of a new weekly candle, this tends to be a manipulation move.
Of course, a total sample size of 7 isn’t big enough to draw any major conclusions from this pattern alone, but combined with the immediate move higher at the weekly open, it’s definitely worth keeping an eye on. #BTC Price Analysis# #Macro Insights#
Looking at the past seven weeks, this Sunday to Monday correlation pattern has played out every single time.
Yesterday’s Sunday closed green, which would suggest another dump over the next few days if price continues following this pattern.
What’s also interesting is that this weekly candle opened and we saw a move to the upside right away.
Usually, whenever price moves aggressively into one direction right at the open of a new weekly candle, this tends to be a manipulation move.
Of course, a total sample size of 7 isn’t big enough to draw any major conclusions from this pattern alone, but combined with the immediate move higher at the weekly open, it’s definitely worth keeping an eye on. #BTC Price Analysis# #Macro Insights#
57
·
--
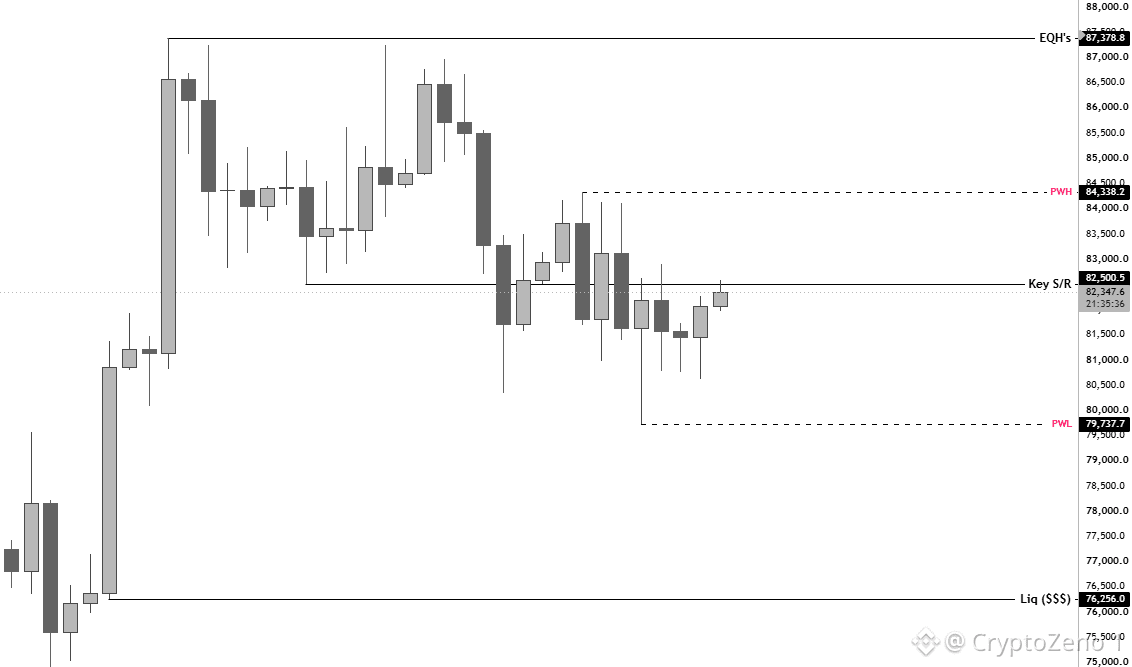
$BTC Retesting the Key S/R right at the start of the week.
For continuation towards the upside, we need to flip this level into support. As long as we're rejecting here, a sweep of the PWL stays in play.
A short from here could do pretty well, but I'm personally not interested in taking it given that we're in the middle of the range and the Risk to Reward just isn't favorable.
The POIs for me this week are the PWH and PWL.
Given that we pretty much ranged for the entire last week, it's quite likely that we hunt either the high or the low of the previous weekly candle this week.
Whichever side gets targeted will give us a better idea of what this current week could look like.
If we reject the 82.5k Key S/R, a sweep of the current 79.7k low comes into play. This is where I'd be looking for longs.
On the other hand, if we break above 82.5k and sweep the PWH, a short could become more favorable if the bulls are exhausted up there and fail to reclaim the level.
Outside of that there's nothing much to do with this PA unless you're looking for quick ins and outs.
It's a scalper's paradise as of now. #BTC Price Analysis# #Macro Insights#
$BTC Retesting the Key S/R right at the start of the week.
For continuation towards the upside, we need to flip this level into support. As long as we're rejecting here, a sweep of the PWL stays in play.
A short from here could do pretty well, but I'm personally not interested in taking it given that we're in the middle of the range and the Risk to Reward just isn't favorable.
The POIs for me this week are the PWH and PWL.
Given that we pretty much ranged for the entire last week, it's quite likely that we hunt either the high or the low of the previous weekly candle this week.
Whichever side gets targeted will give us a better idea of what this current week could look like.
If we reject the 82.5k Key S/R, a sweep of the current 79.7k low comes into play. This is where I'd be looking for longs.
On the other hand, if we break above 82.5k and sweep the PWH, a short could become more favorable if the bulls are exhausted up there and fail to reclaim the level.
Outside of that there's nothing much to do with this PA unless you're looking for quick ins and outs.
It's a scalper's paradise as of now. #BTC Price Analysis# #Macro Insights#
For continuation towards the upside, we need to flip this level into support. As long as we're rejecting here, a sweep of the PWL stays in play.
A short from here could do pretty well, but I'm personally not interested in taking it given that we're in the middle of the range and the Risk to Reward just isn't favorable.
The POIs for me this week are the PWH and PWL.
Given that we pretty much ranged for the entire last week, it's quite likely that we hunt either the high or the low of the previous weekly candle this week.
Whichever side gets targeted will give us a better idea of what this current week could look like.
If we reject the 82.5k Key S/R, a sweep of the current 79.7k low comes into play. This is where I'd be looking for longs.
On the other hand, if we break above 82.5k and sweep the PWH, a short could become more favorable if the bulls are exhausted up there and fail to reclaim the level.
Outside of that there's nothing much to do with this PA unless you're looking for quick ins and outs.
It's a scalper's paradise as of now. #BTC Price Analysis# #Macro Insights#
73
·
--
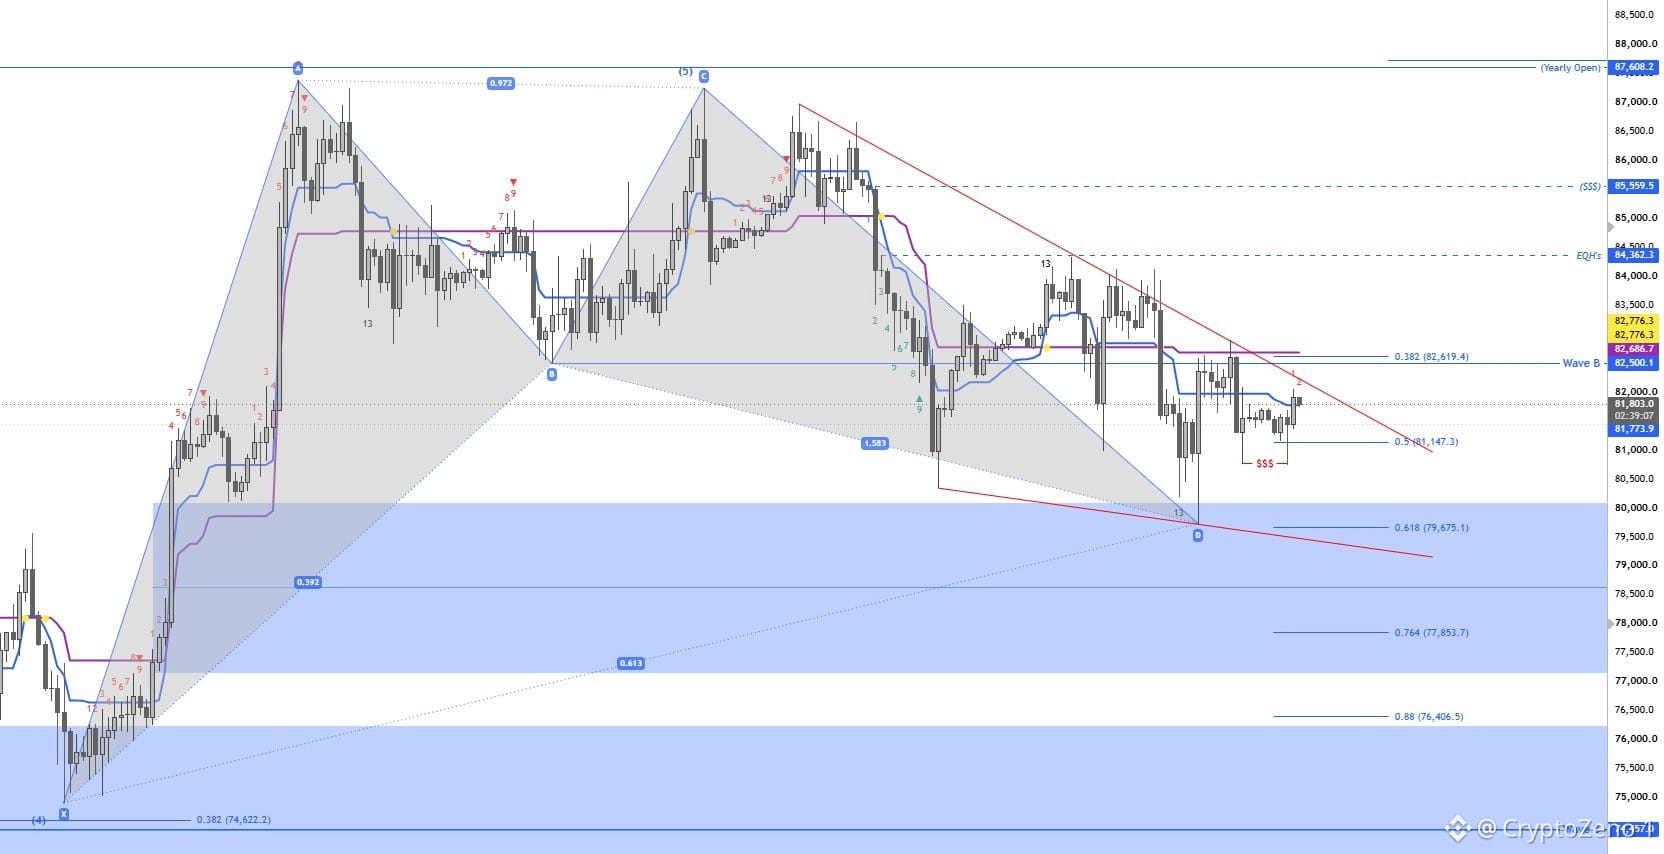
$BTC Nothing much happening on the charts for now.
Ideally, we wanna see a reclaim of the Wave B / Kijun-Sen region for continuation towards the upside.
If we're unable to do so, then a sweep of the current lows is likely next, with the 76k region coming into play.
The structure is messy on the LTF at the moment, so the best approach here is to play level to level.
There's also a falling wedge being formed, and a bullish breakout would confirm the bottom.
The reason being that we have a lot of liquidity sitting in the middle of the range around 84.3k-85.5k, which could fuel the pump higher into the HTF liquidity pocket at 87k-89k.
If we stay below Wave B and keep rejecting there, then I'm looking for one final sweep below the current lows sometime between 20-24th Oct to mark the bottom before trending back towards the upside. #BTC Price Analysis# #Macro Insights#
$BTC Nothing much happening on the charts for now.
Ideally, we wanna see a reclaim of the Wave B / Kijun-Sen region for continuation towards the upside.
If we're unable to do so, then a sweep of the current lows is likely next, with the 76k region coming into play.
The structure is messy on the LTF at the moment, so the best approach here is to play level to level.
There's also a falling wedge being formed, and a bullish breakout would confirm the bottom.
The reason being that we have a lot of liquidity sitting in the middle of the range around 84.3k-85.5k, which could fuel the pump higher into the HTF liquidity pocket at 87k-89k.
If we stay below Wave B and keep rejecting there, then I'm looking for one final sweep below the current lows sometime between 20-24th Oct to mark the bottom before trending back towards the upside. #BTC Price Analysis# #Macro Insights#
Ideally, we wanna see a reclaim of the Wave B / Kijun-Sen region for continuation towards the upside.
If we're unable to do so, then a sweep of the current lows is likely next, with the 76k region coming into play.
The structure is messy on the LTF at the moment, so the best approach here is to play level to level.
There's also a falling wedge being formed, and a bullish breakout would confirm the bottom.
The reason being that we have a lot of liquidity sitting in the middle of the range around 84.3k-85.5k, which could fuel the pump higher into the HTF liquidity pocket at 87k-89k.
If we stay below Wave B and keep rejecting there, then I'm looking for one final sweep below the current lows sometime between 20-24th Oct to mark the bottom before trending back towards the upside. #BTC Price Analysis# #Macro Insights#
70
·
--
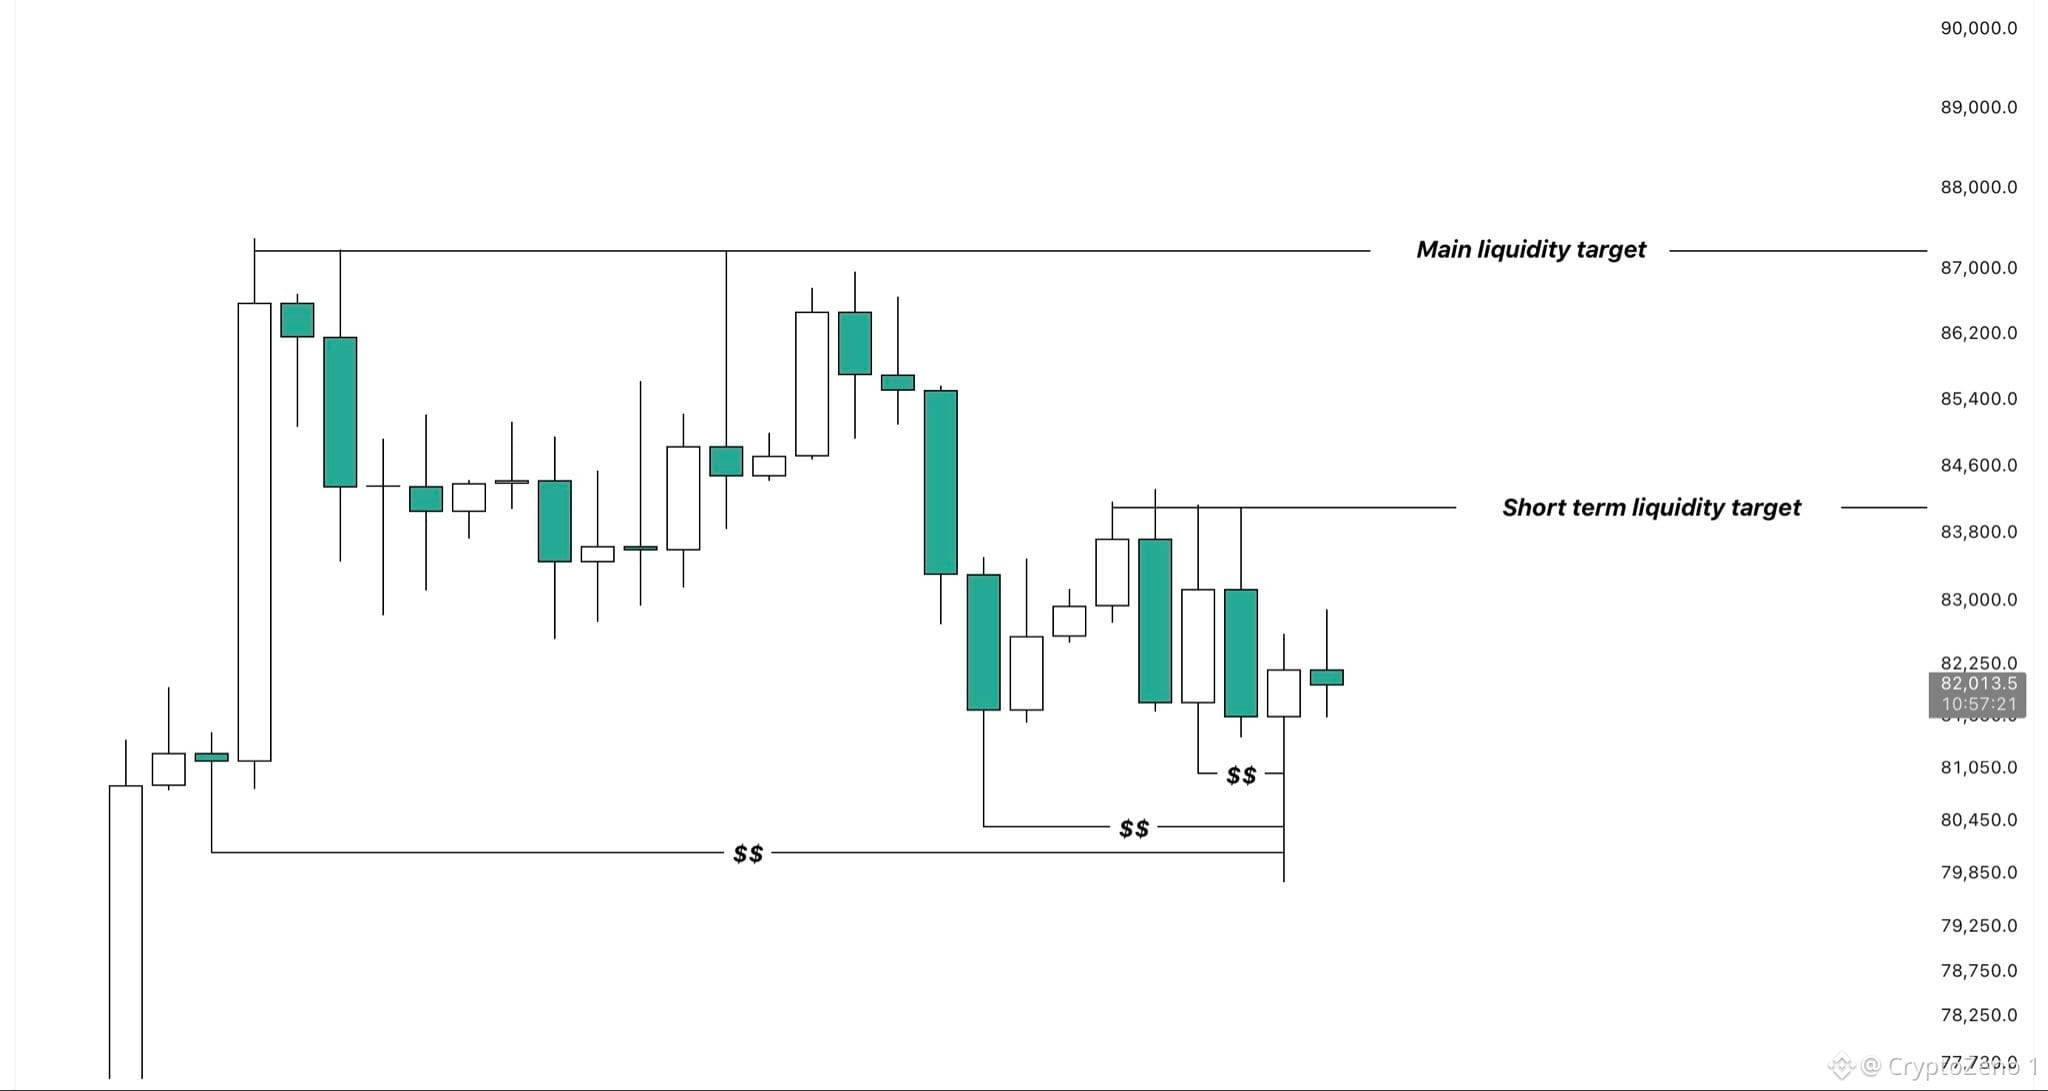
$BTC $84.4k should be our next short term target.
After the recent selloff, price has taken out every unswept low and swept most of the external downside liquidity.
Meanwhile, fresh liquidity has started stacking up right around the previous high at $84.4k and the range highs at $87k.
With BTC still range bound and most of the nearby downside liquidity already cleared, it would make sense for price to target some of the upside clusters next.
The current structure still remains bearish, so further downside is definitely on the table. However, a sweep of the previous high first can’t be ruled out either.
That way BTC would take out a decent amount of shorts while allowing downside liquidity to build back up for a potential continuation lower later on. #BTC Price Analysis# #Macro Insights#
$BTC $84.4k should be our next short term target.
After the recent selloff, price has taken out every unswept low and swept most of the external downside liquidity.
Meanwhile, fresh liquidity has started stacking up right around the previous high at $84.4k and the range highs at $87k.
With BTC still range bound and most of the nearby downside liquidity already cleared, it would make sense for price to target some of the upside clusters next.
The current structure still remains bearish, so further downside is definitely on the table. However, a sweep of the previous high first can’t be ruled out either.
That way BTC would take out a decent amount of shorts while allowing downside liquidity to build back up for a potential continuation lower later on. #BTC Price Analysis# #Macro Insights#
After the recent selloff, price has taken out every unswept low and swept most of the external downside liquidity.
Meanwhile, fresh liquidity has started stacking up right around the previous high at $84.4k and the range highs at $87k.
With BTC still range bound and most of the nearby downside liquidity already cleared, it would make sense for price to target some of the upside clusters next.
The current structure still remains bearish, so further downside is definitely on the table. However, a sweep of the previous high first can’t be ruled out either.
That way BTC would take out a decent amount of shorts while allowing downside liquidity to build back up for a potential continuation lower later on. #BTC Price Analysis# #Macro Insights#
46
·
--
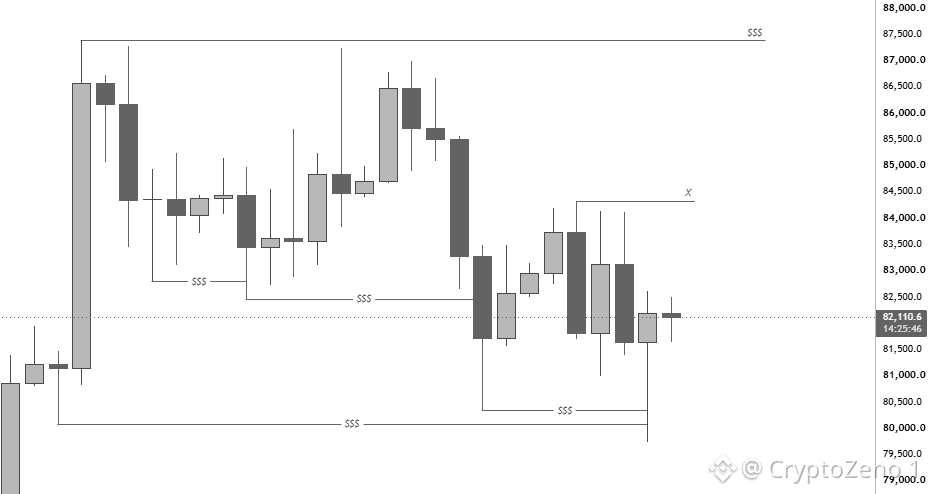
$BTC
The liquidity at the lows got raided multiple times.
But towards the upside, we keep front-running the sweep. Which makes sense given that we're in a bull market, and the more resting liquidity there is towards the upside, the more violent the push will be.
The buyback on the last daily candle was pretty strong, and we closed somewhat like a bullish hammer. Now, if we keep holding above this 81.5k-81.1k region, it will confirm the local bottom for now.
Towards the upside, we need to reclaim the Mid-Range S/R, which sits around the 84.3k region. If we manage to do so, we'll likely trend into a new high from here. #BTC Price Analysis# #Macro Insights#
$BTC
The liquidity at the lows got raided multiple times.
But towards the upside, we keep front-running the sweep. Which makes sense given that we're in a bull market, and the more resting liquidity there is towards the upside, the more violent the push will be.
The buyback on the last daily candle was pretty strong, and we closed somewhat like a bullish hammer. Now, if we keep holding above this 81.5k-81.1k region, it will confirm the local bottom for now.
Towards the upside, we need to reclaim the Mid-Range S/R, which sits around the 84.3k region. If we manage to do so, we'll likely trend into a new high from here. #BTC Price Analysis# #Macro Insights#
The liquidity at the lows got raided multiple times.
But towards the upside, we keep front-running the sweep. Which makes sense given that we're in a bull market, and the more resting liquidity there is towards the upside, the more violent the push will be.
The buyback on the last daily candle was pretty strong, and we closed somewhat like a bullish hammer. Now, if we keep holding above this 81.5k-81.1k region, it will confirm the local bottom for now.
Towards the upside, we need to reclaim the Mid-Range S/R, which sits around the 84.3k region. If we manage to do so, we'll likely trend into a new high from here. #BTC Price Analysis# #Macro Insights#
49
Log in to explore more content
Join global crypto users on Binance Square
⚡️ Get latest and useful information about crypto.
💬 Trusted by the world’s largest crypto exchange.
👍 Discover real insights from verified creators.
Email / Phone number
Trending Topics
BinanceIncidentReport
22,597 views
475 Discussing
29 October 2026 Binance Security Incident: Initial Findings and Response Update
Binance Blog
·245 Likes
·679k views
BinanceReopensWithdrawalsForMoreAssets
130,669 views
1,699 Discussing
BinanceHourlyDepositsExceedWithdrawals
61,710 views
774 Discussing