
0x桐灿
504 Posts

0x桐灿
推特:0xtongcan
36 Following
2.0K+ Followers
1.6K+ Liked
Posts
All
Quotes
Videos
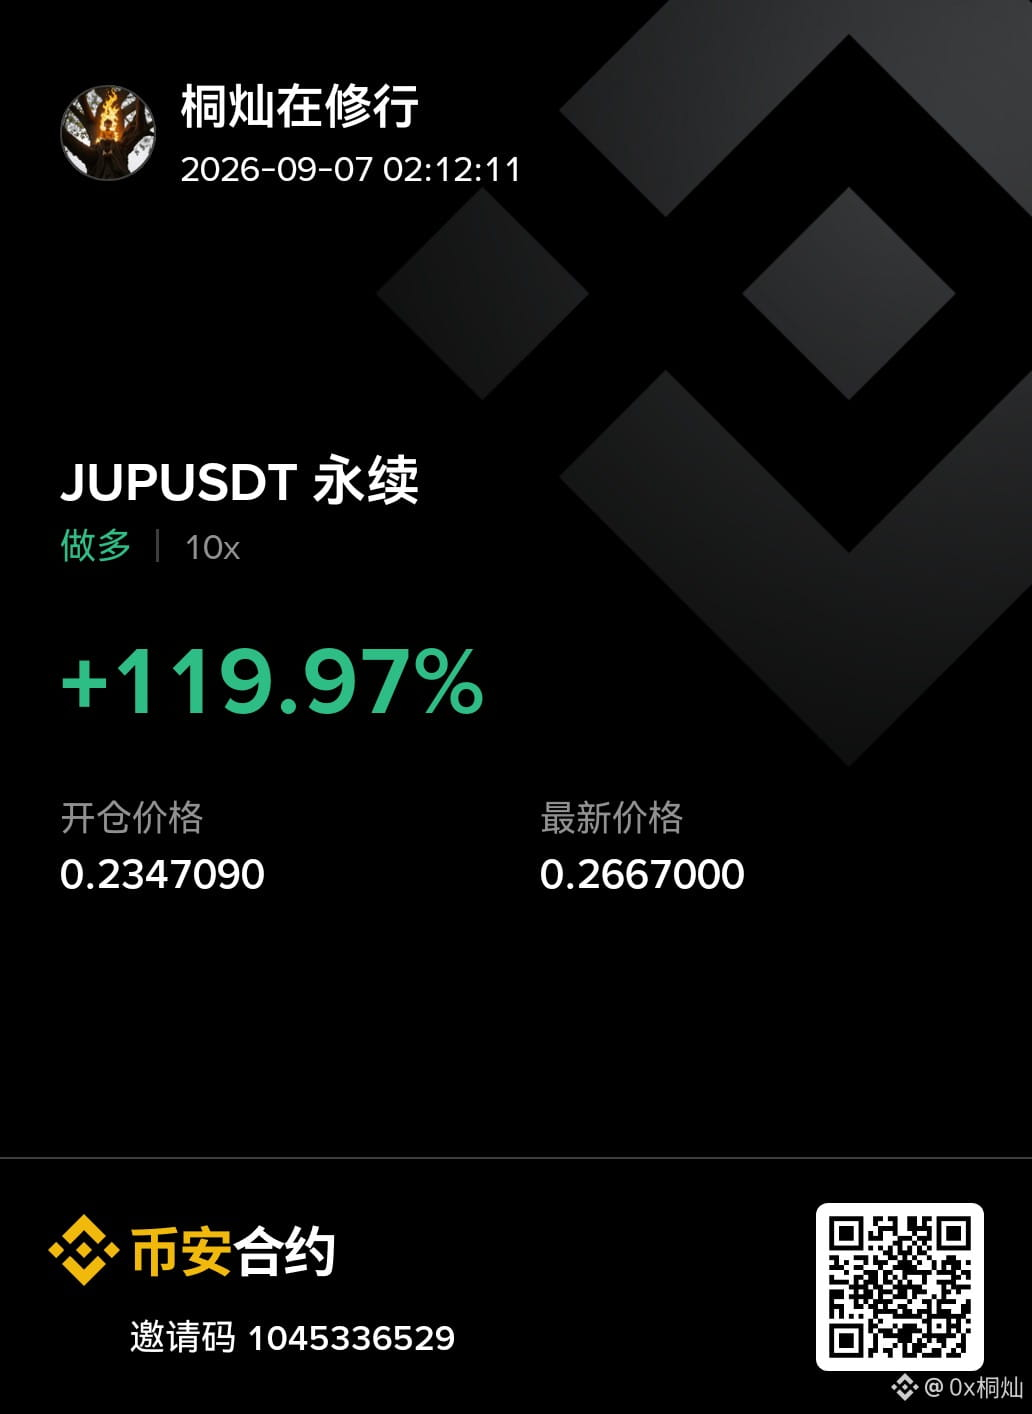
I was out all weekend, drinking while checking orders on my phone, and I’ve been drinking half the night.
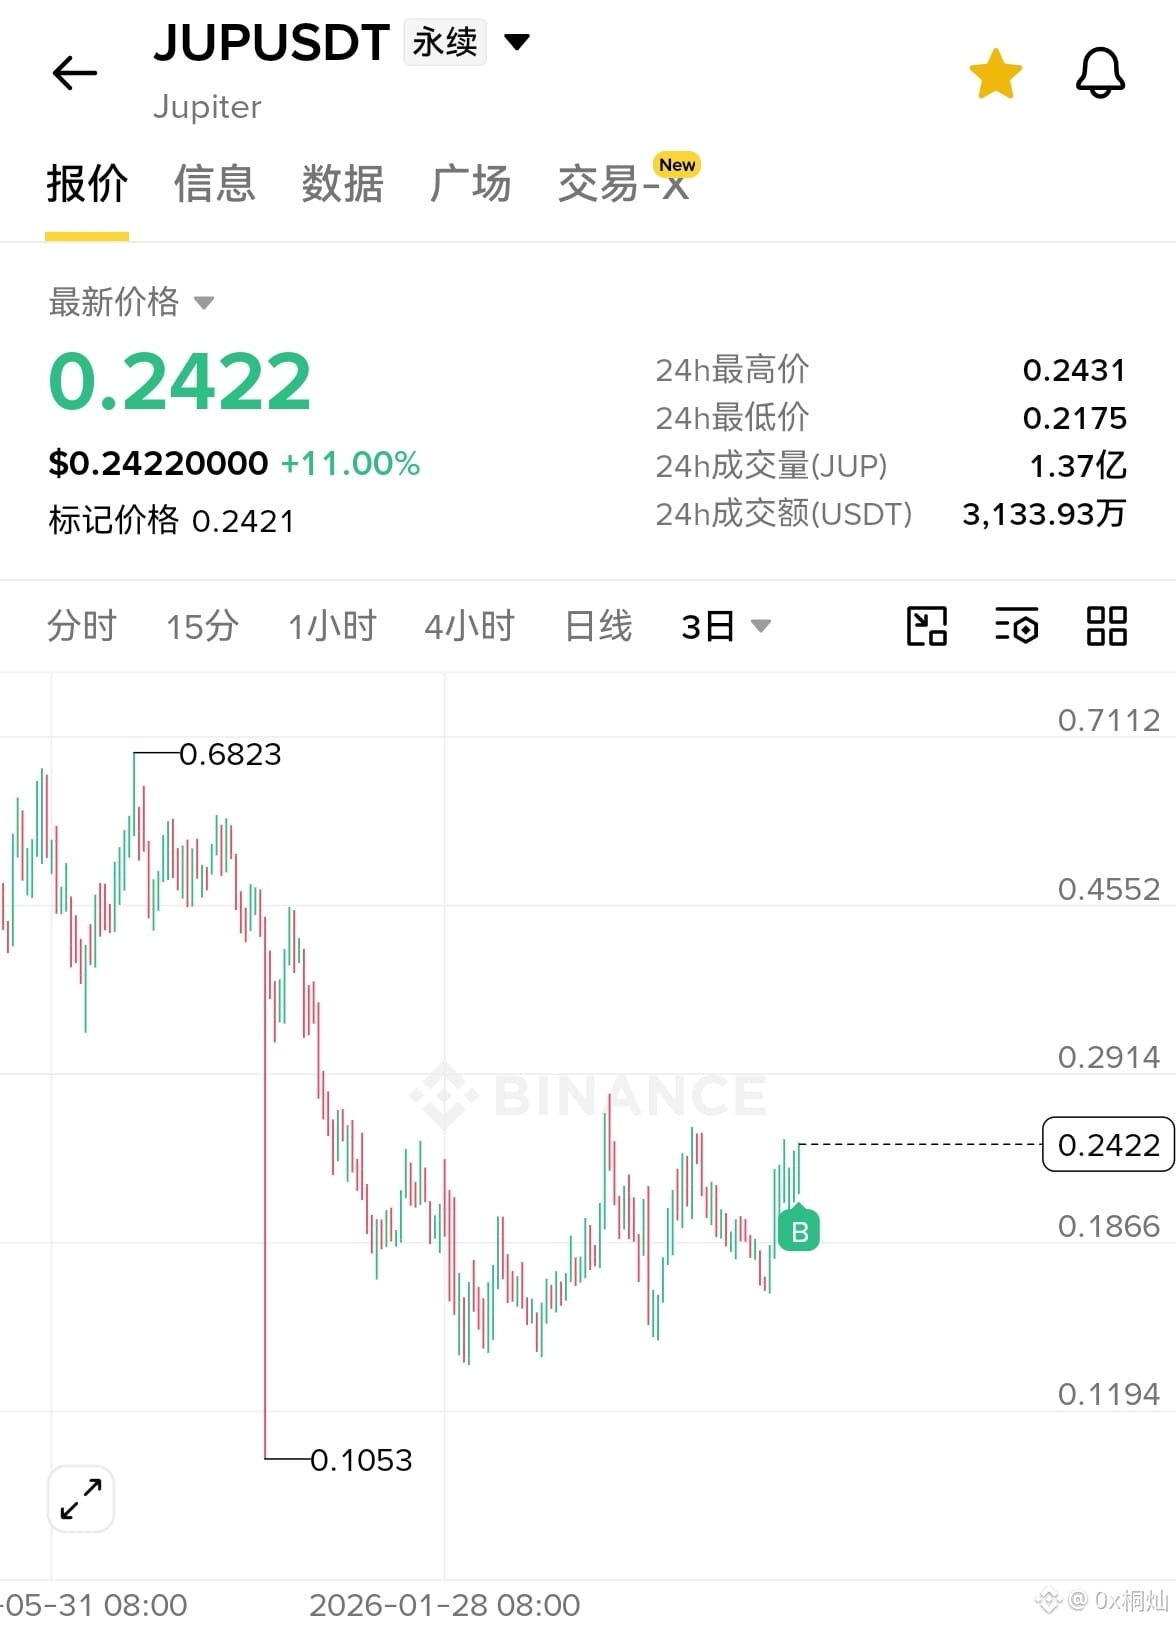
$JUP 0.28 just wouldn’t push higher, so I closed half the position and moved the rest to protection.
The most important thing in trading is to stay calm and easygoing. Opportunities are endless; enter when there is an expectation, and take profits in batches if it doesn’t reach the target.
What matters is that for this trade, whether it reaches expectations, exceeds expectations, or falls short of expectations, I either make a big profit or a small profit, but I do not lose money.
$JUP 0.28 just wouldn’t push higher, so I closed half the position and moved the rest to protection.
The most important thing in trading is to stay calm and easygoing. Opportunities are endless; enter when there is an expectation, and take profits in batches if it doesn’t reach the target.
What matters is that for this trade, whether it reaches expectations, exceeds expectations, or falls short of expectations, I either make a big profit or a small profit, but I do not lose money.


0x桐灿
·
--
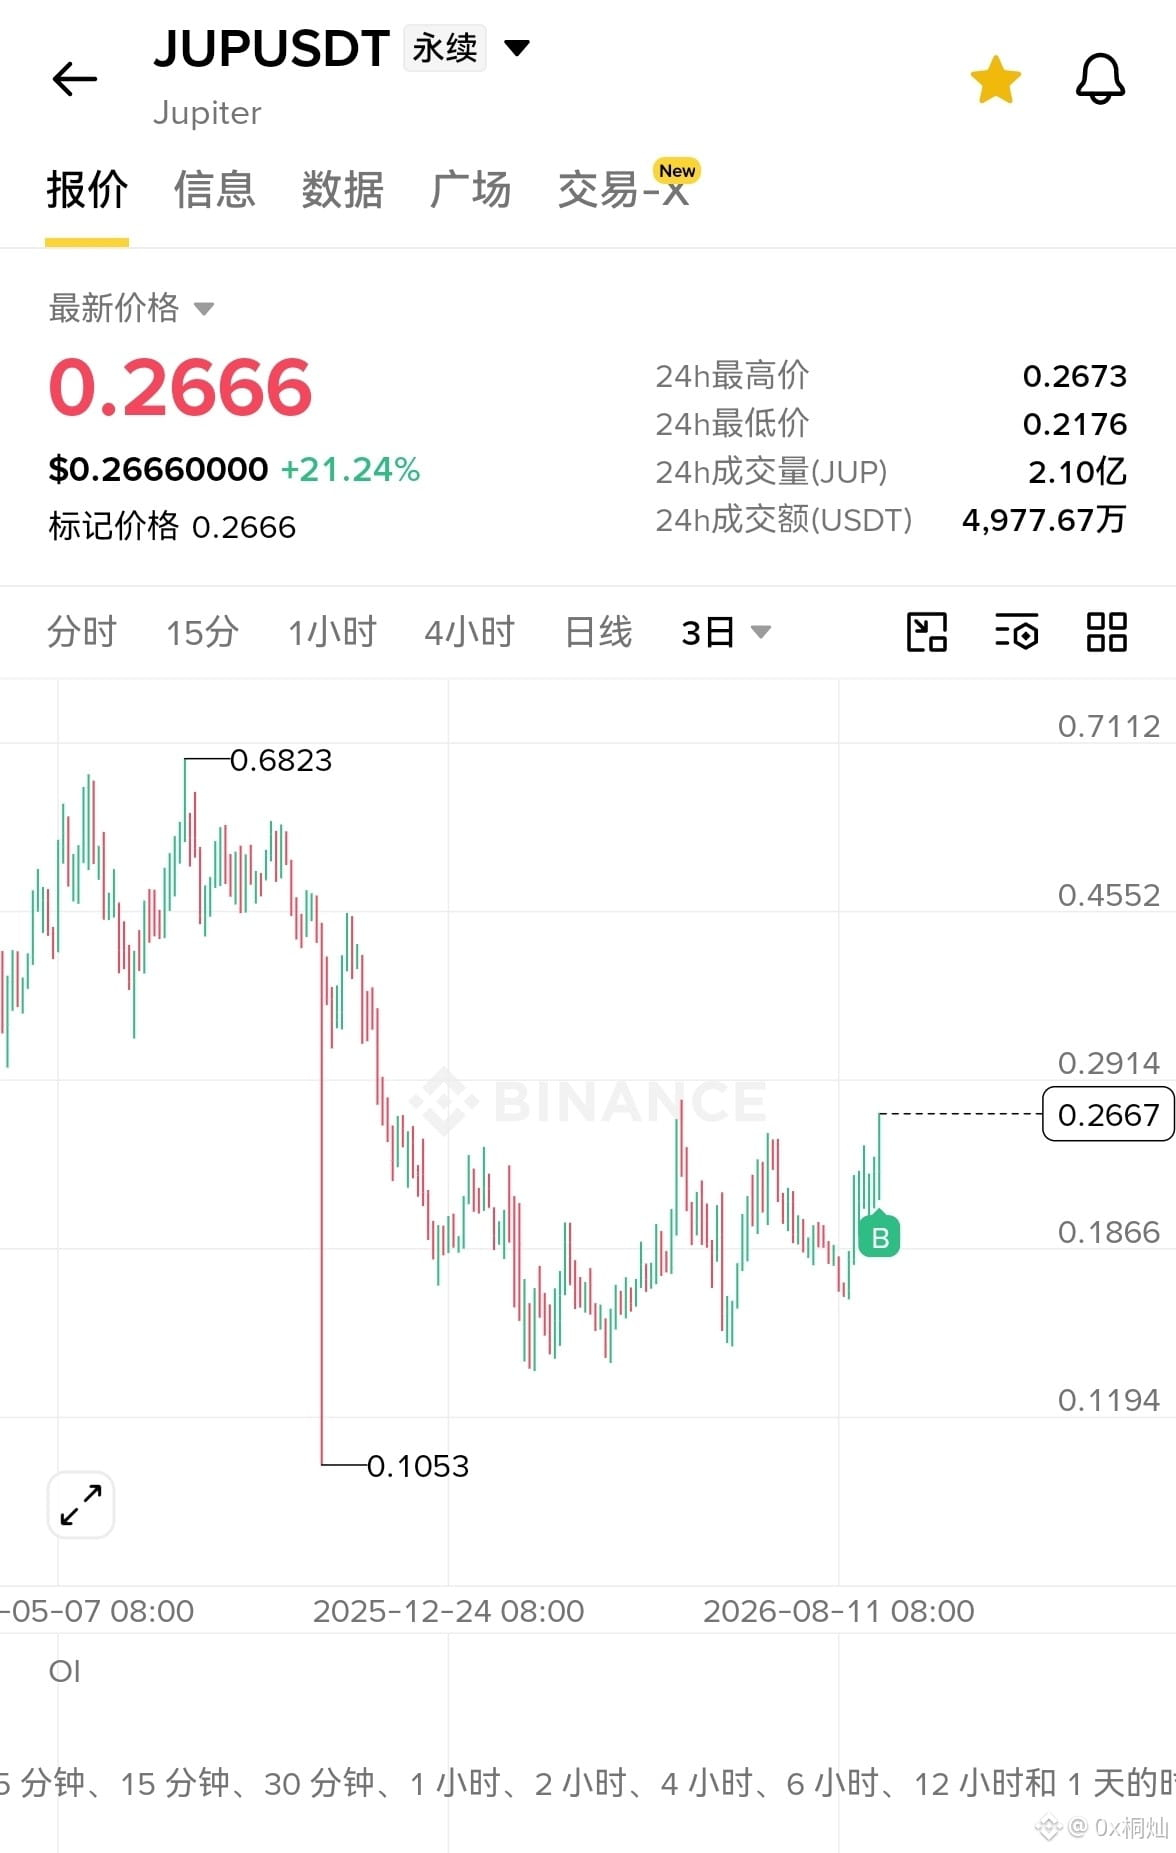
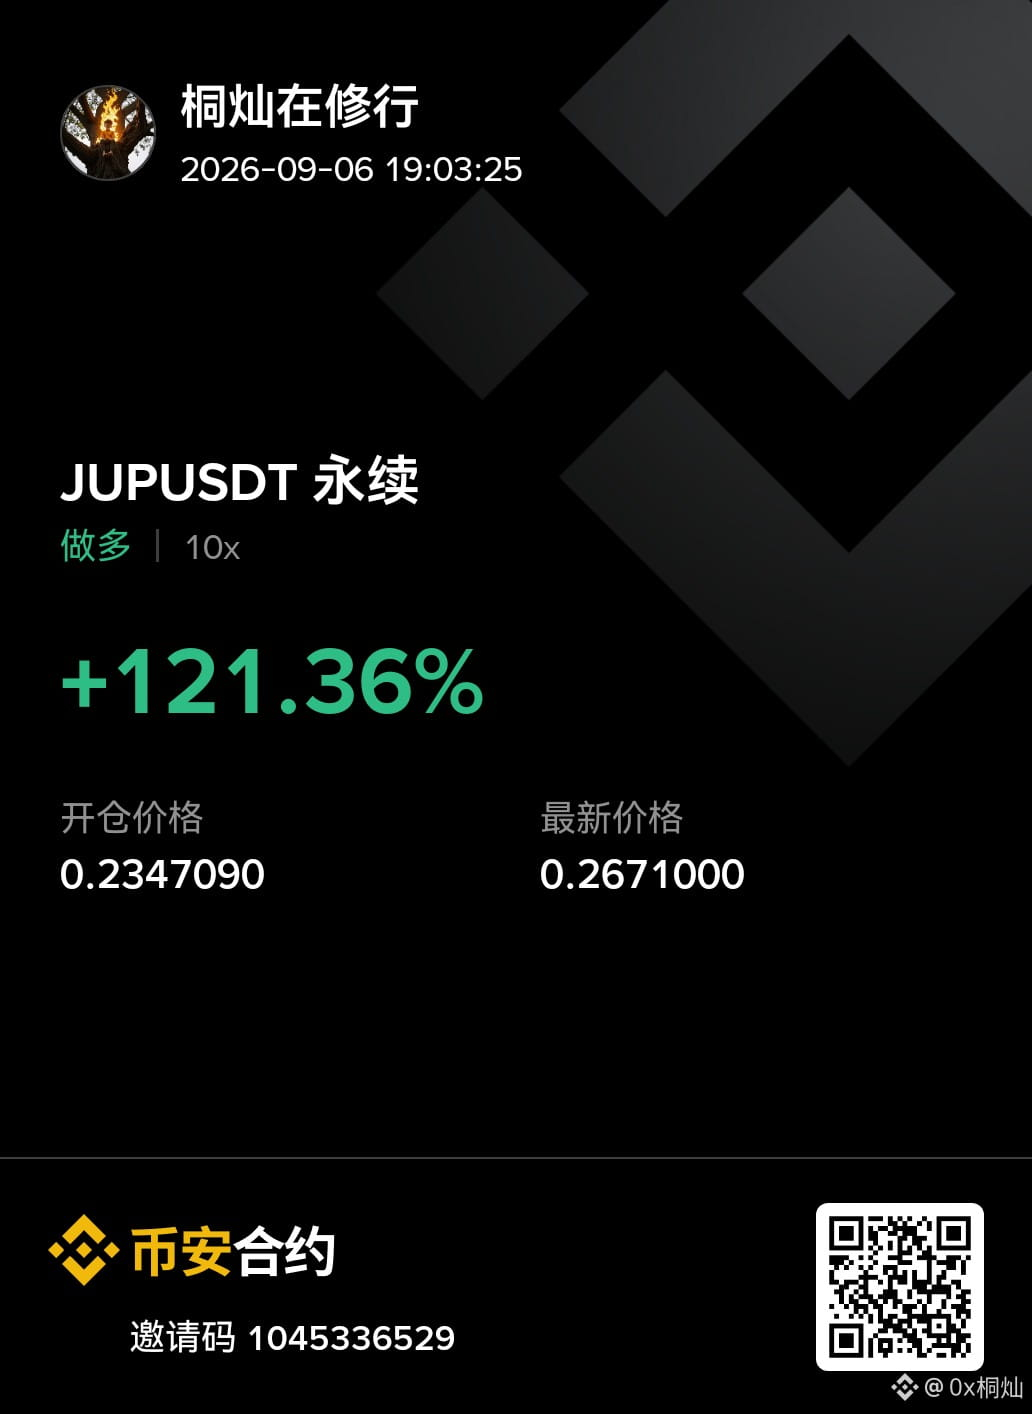
$JUP spray quickly, let me get above 0.3.
$JUP spray quickly, let me get above 0.3.
0x桐灿
·
--
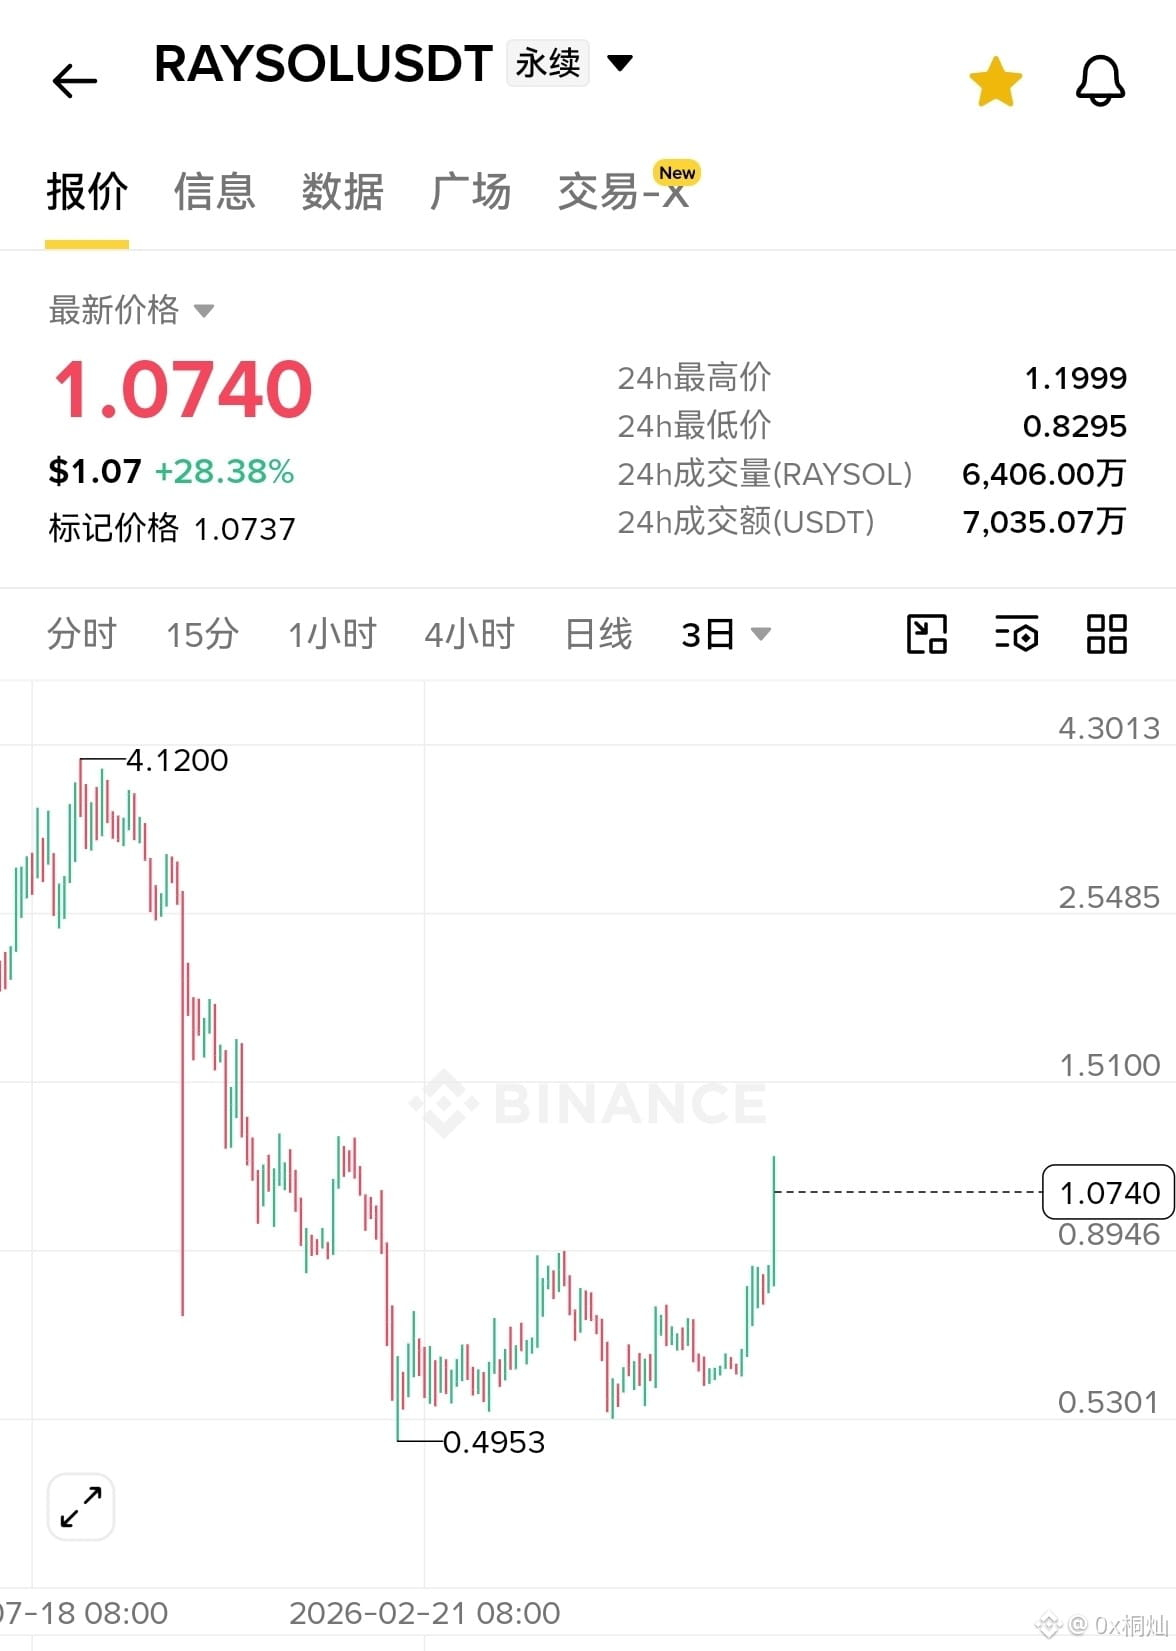
Weekend $UNI driving rotation among the leading sectors of various public chains #Defi , $RAY just surged, $JUP also looks good in terms of pattern, can it surge as well.
Weekend $UNI driving rotation among the leading sectors of various public chains #Defi , $RAY just surged, $JUP also looks good in terms of pattern, can it surge as well.
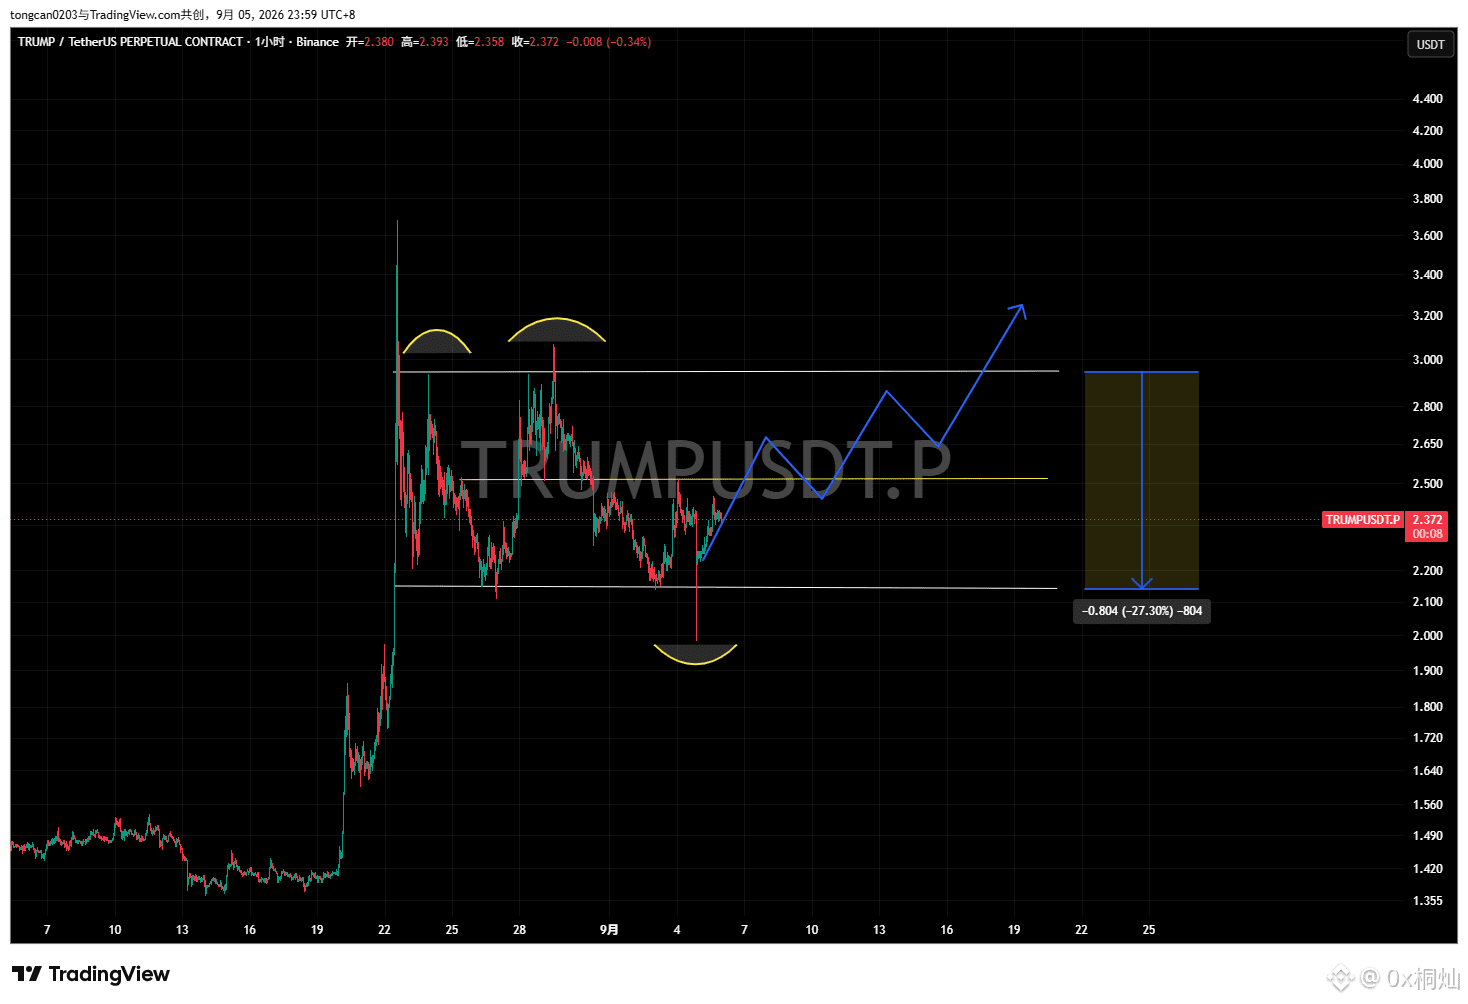
I remember seeing a lot of people last week trying to go long on $TRUMP
for a second leg because of Trump’s midterm election expectations, but I估计 they all got shaken out by the fake breakout in this nearly 30-point range of consolidation.
Now $TRUMP has completed two false breakout tests near the top of the range, and one liquidity sweep with a pin down at the lower edge of the range. This is my personal favorite second-leg entry structure……
If it can break through the yellow line in the middle next, then pull back and form a higher low, it should be the most likely successful second-leg entry this time.
—For reference.
for a second leg because of Trump’s midterm election expectations, but I估计 they all got shaken out by the fake breakout in this nearly 30-point range of consolidation.
Now $TRUMP has completed two false breakout tests near the top of the range, and one liquidity sweep with a pin down at the lower edge of the range. This is my personal favorite second-leg entry structure……
If it can break through the yellow line in the middle next, then pull back and form a higher low, it should be the most likely successful second-leg entry this time.
—For reference.
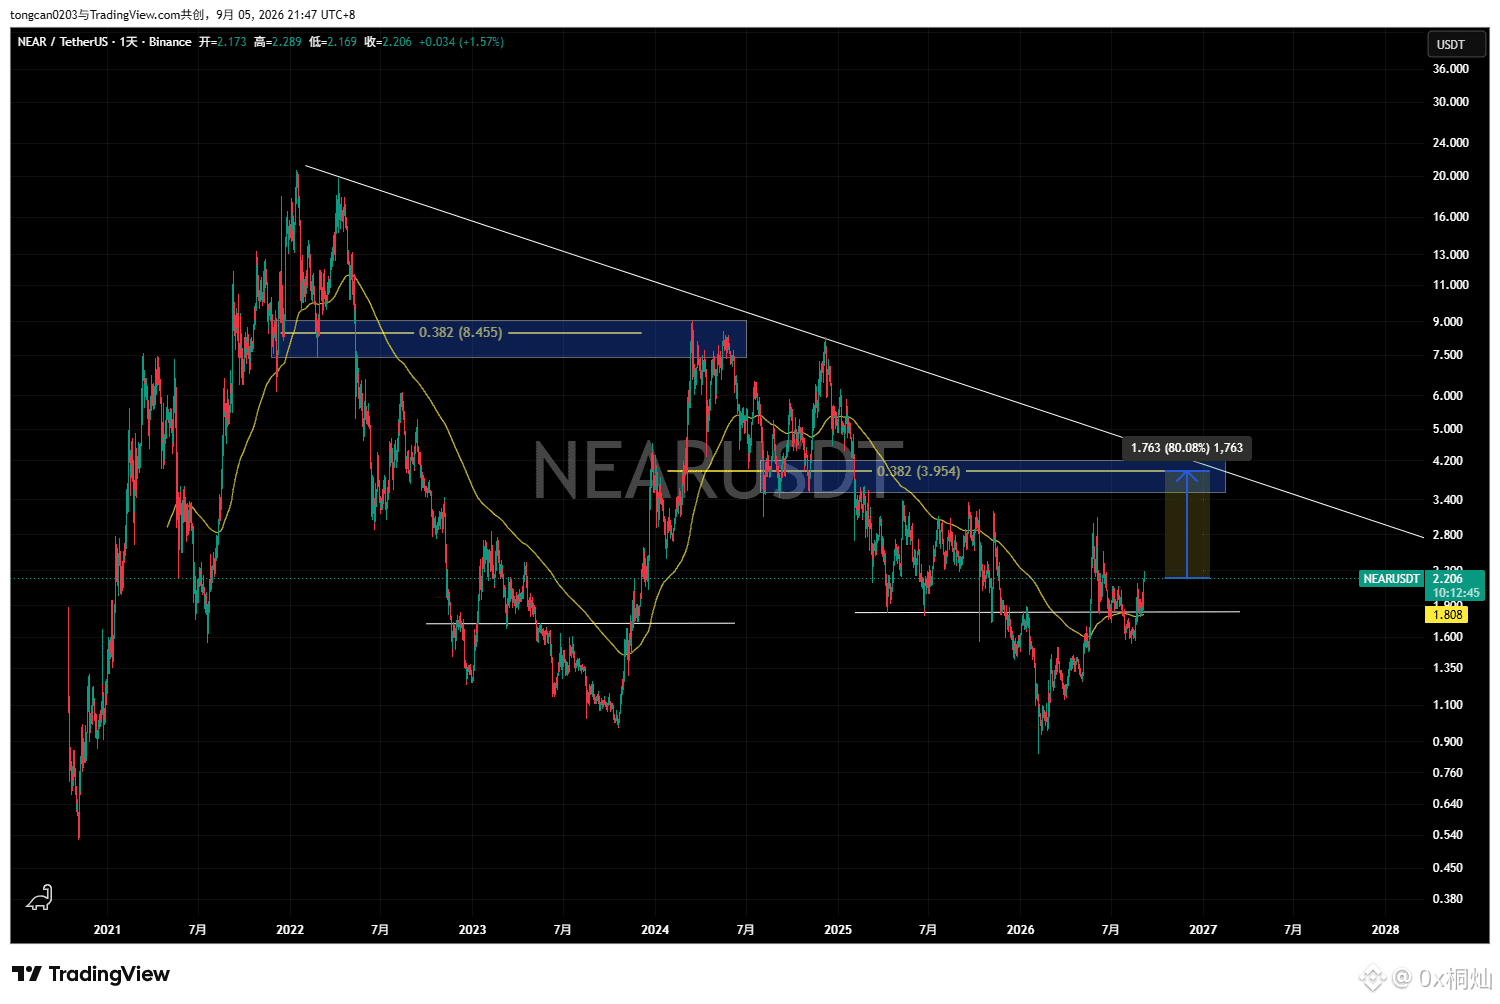
I looked through some tokens in the AI sector, and their short-term structures are all moving pretty much the same. At the moment, the strongest in the AI sector in terms of overall structure and capital flow is still $NEAR .
$FET is one I personally like, so I’ll hold it as a core position for the long term. I just chased some of $NEAR ’s position, and will add more if it pulls back to around 2.1. First, let’s look at the target of 3.9. If it holds above and breaks through the 3.9 resistance, then it opens up a whole new scenario.
—For reference only.
$FET is one I personally like, so I’ll hold it as a core position for the long term. I just chased some of $NEAR ’s position, and will add more if it pulls back to around 2.1. First, let’s look at the target of 3.9. If it holds above and breaks through the 3.9 resistance, then it opens up a whole new scenario.
—For reference only.
0x桐灿
·
--
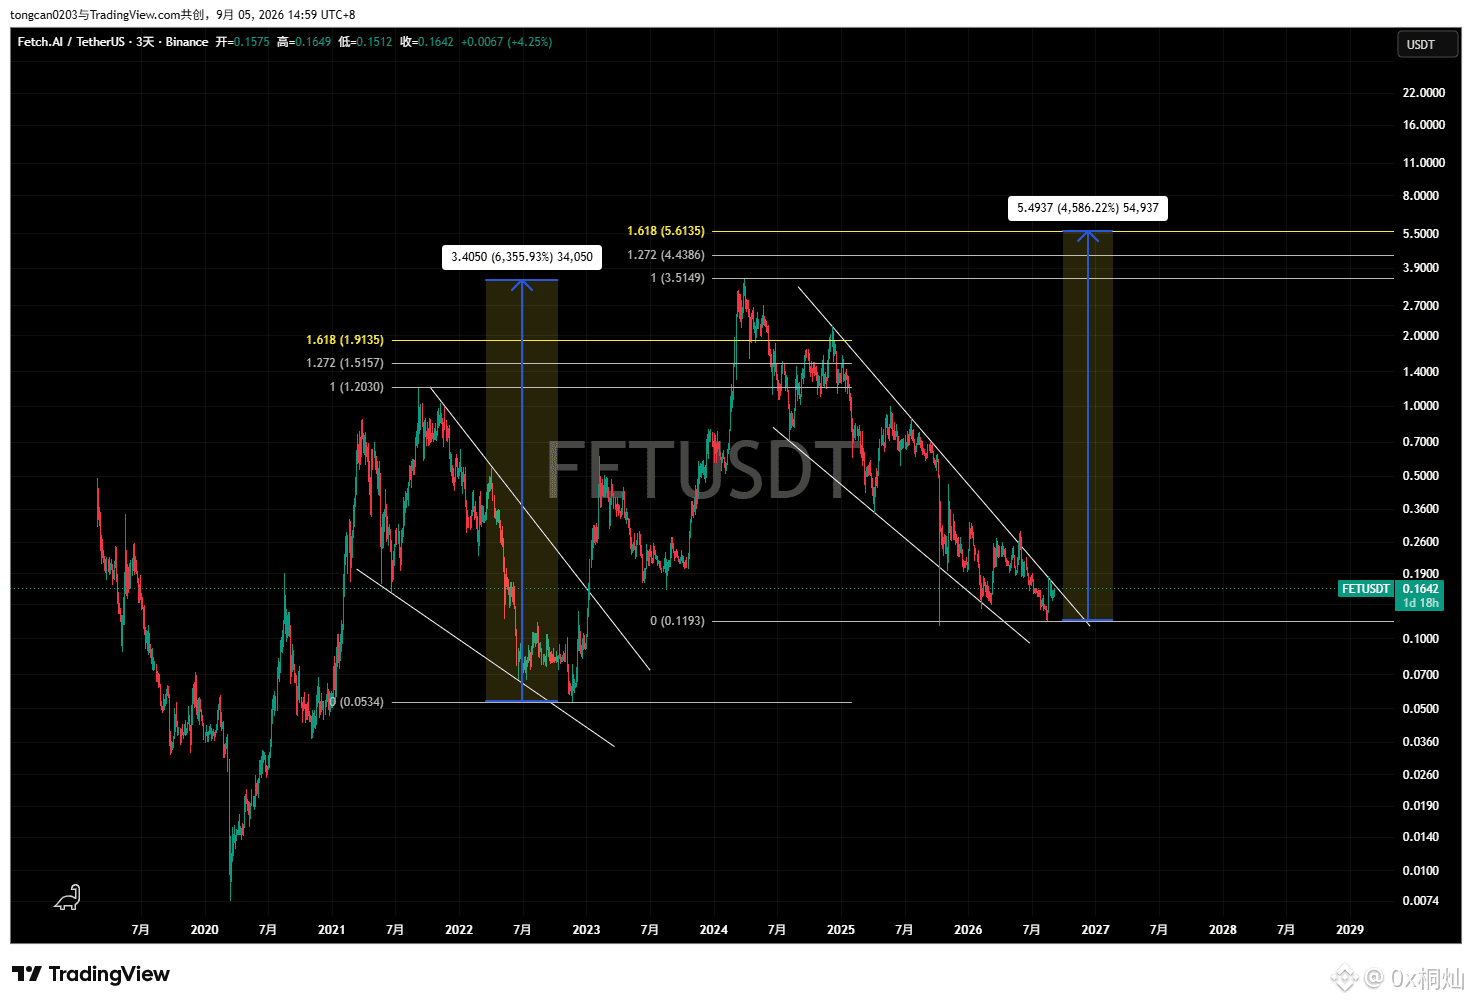
Can $FET regain its former glory?
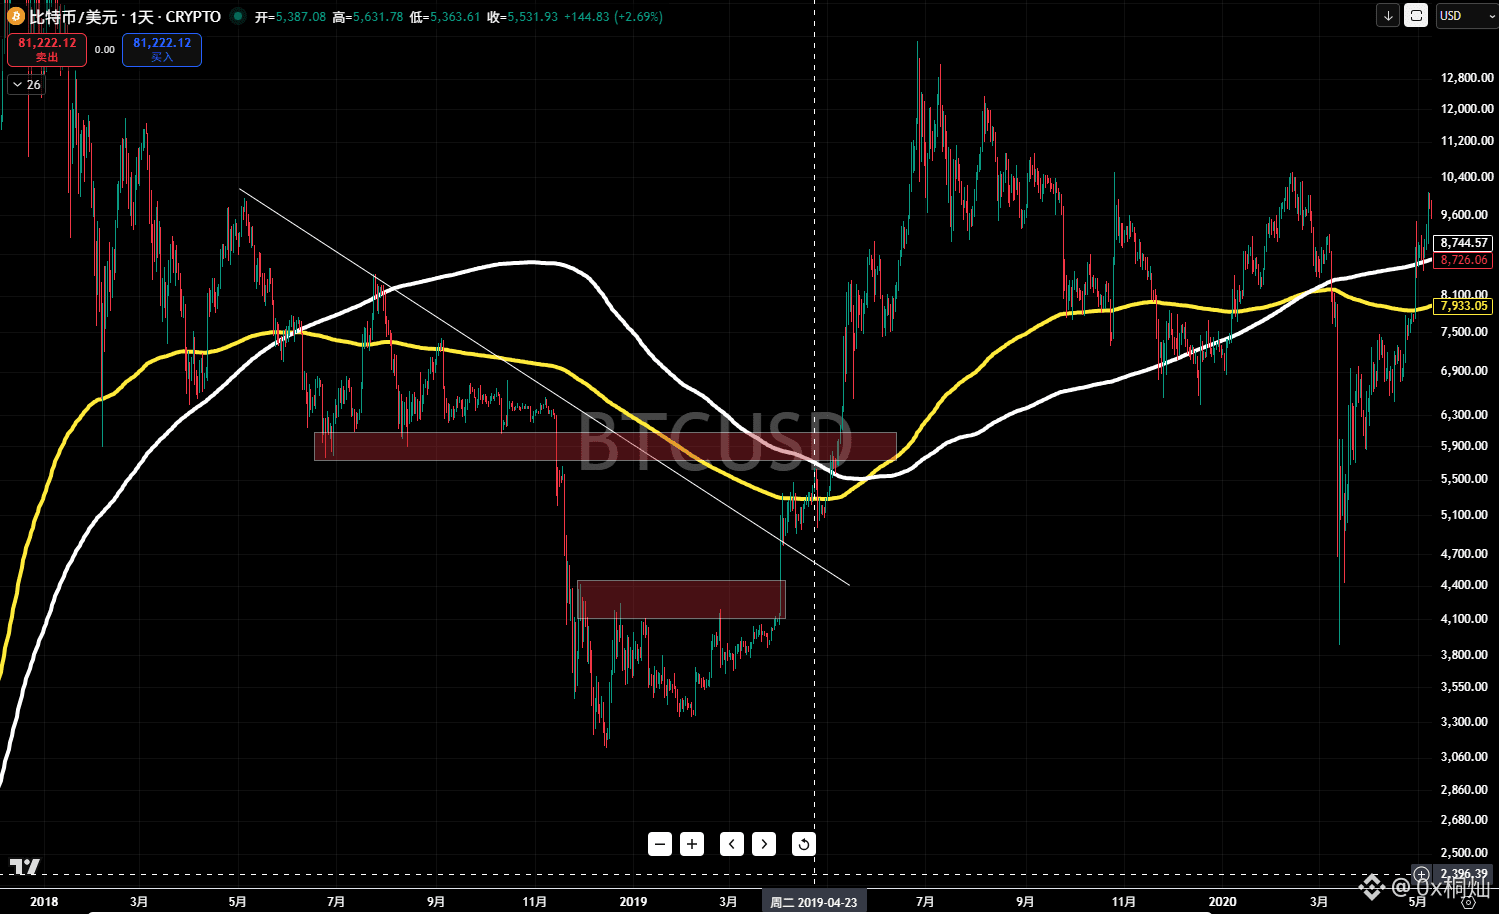
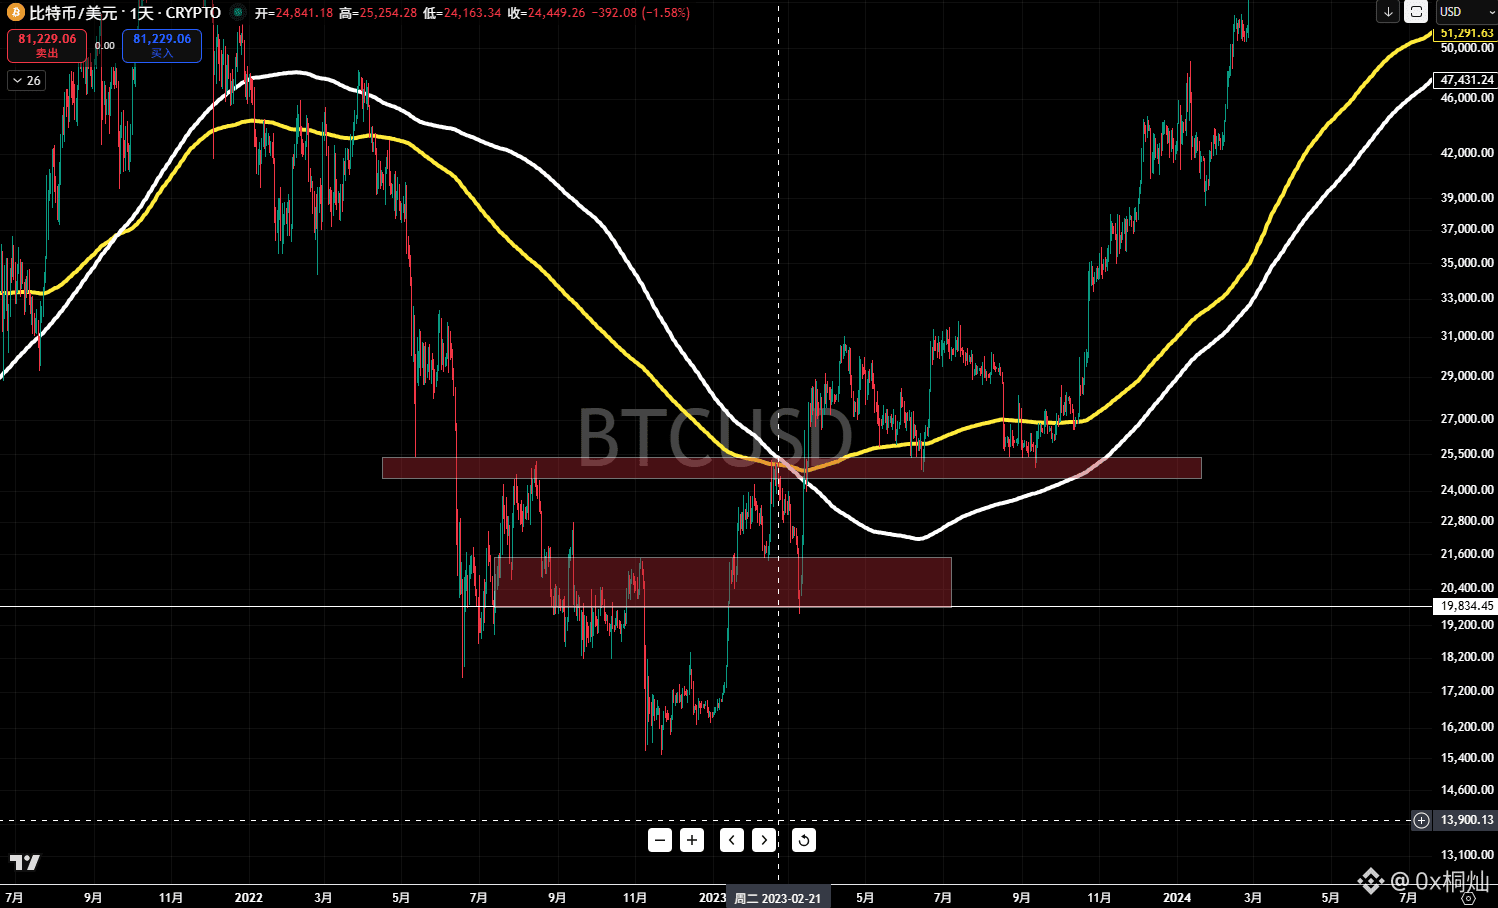
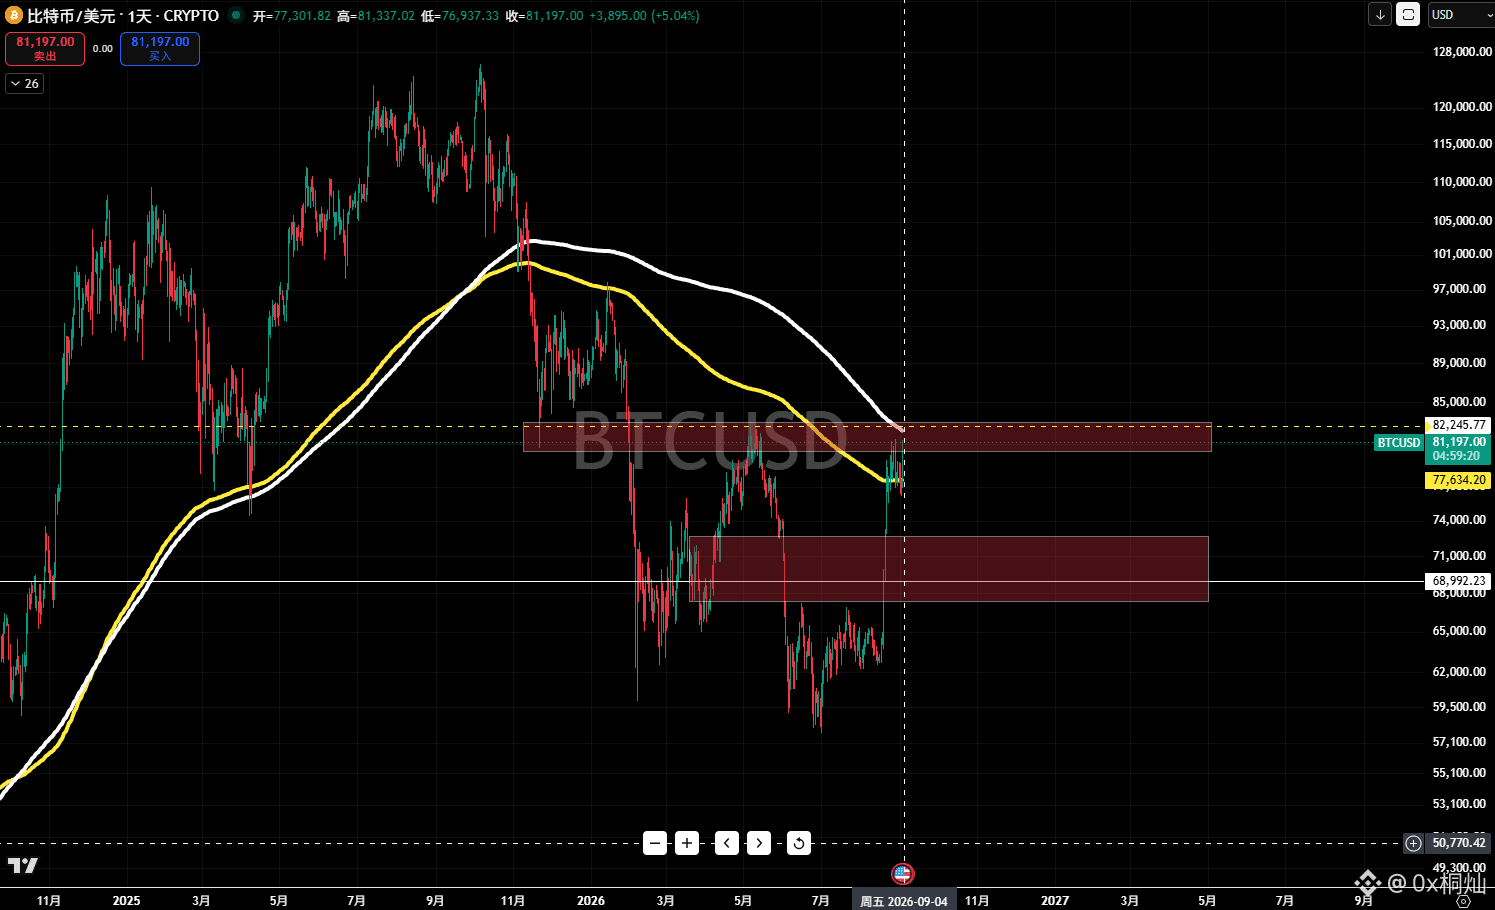
The yellow line is the EMA365, and the white line is the MA365.
【Figure 1】 shows that after $BTC started in the previous bull market (the second-to-last one), on April 23, 2019, it hit resistance and pulled back at the MA365 moving average and at the second-layer resistance level. After a brief strong rebound (HH, HL), it immediately broke through.
【Figure 2】 shows that after $BTC started in the previous bull market, on February 21, 2023, it met resistance at the junction of EMA365 and MA365 and at the second-layer resistance level, then pulled back to the first-layer resistance zone. After it turned into a support zone, it continued moving straight north.
【Figure 3】 shows that today, on September 4, 2026, as in 2019, $BTC has already broken above the EMA365, and it is about to—possibly—pull back to meet resistance at the MA365 moving average and at the second-layer resistance level.
Are you going to take this short, or not? Should you focus your attention on this opportunity to short, or should you stand firm and hold for the next leg up?
If a pullback happens here as expected, can you exit the short position cleanly, decisively, and on time for take-profit, then quickly switch your mindset from short to long, catch the low point of the pullback, and add to spot positions on the reverse, or open a long? Also, how do you judge whether: here will—just like in the prior 2023 cycle—produce a deeper pullback, forming a small timeframe LL, with enough time to take profit on the short;
or whether this time is only a shallow pullback, just like in 2019. You might still be greedy about the short profit, not having taken profit on the short in time, and not having added to spot in time—perhaps even still adding to the short position. As a result, a new trend continuation starts suddenly, and BTC keeps marching north all the way?
【Figure 1】 shows that after $BTC started in the previous bull market (the second-to-last one), on April 23, 2019, it hit resistance and pulled back at the MA365 moving average and at the second-layer resistance level. After a brief strong rebound (HH, HL), it immediately broke through.
【Figure 2】 shows that after $BTC started in the previous bull market, on February 21, 2023, it met resistance at the junction of EMA365 and MA365 and at the second-layer resistance level, then pulled back to the first-layer resistance zone. After it turned into a support zone, it continued moving straight north.
【Figure 3】 shows that today, on September 4, 2026, as in 2019, $BTC has already broken above the EMA365, and it is about to—possibly—pull back to meet resistance at the MA365 moving average and at the second-layer resistance level.
Are you going to take this short, or not? Should you focus your attention on this opportunity to short, or should you stand firm and hold for the next leg up?
If a pullback happens here as expected, can you exit the short position cleanly, decisively, and on time for take-profit, then quickly switch your mindset from short to long, catch the low point of the pullback, and add to spot positions on the reverse, or open a long? Also, how do you judge whether: here will—just like in the prior 2023 cycle—produce a deeper pullback, forming a small timeframe LL, with enough time to take profit on the short;
or whether this time is only a shallow pullback, just like in 2019. You might still be greedy about the short profit, not having taken profit on the short in time, and not having added to spot in time—perhaps even still adding to the short position. As a result, a new trend continuation starts suddenly, and BTC keeps marching north all the way?
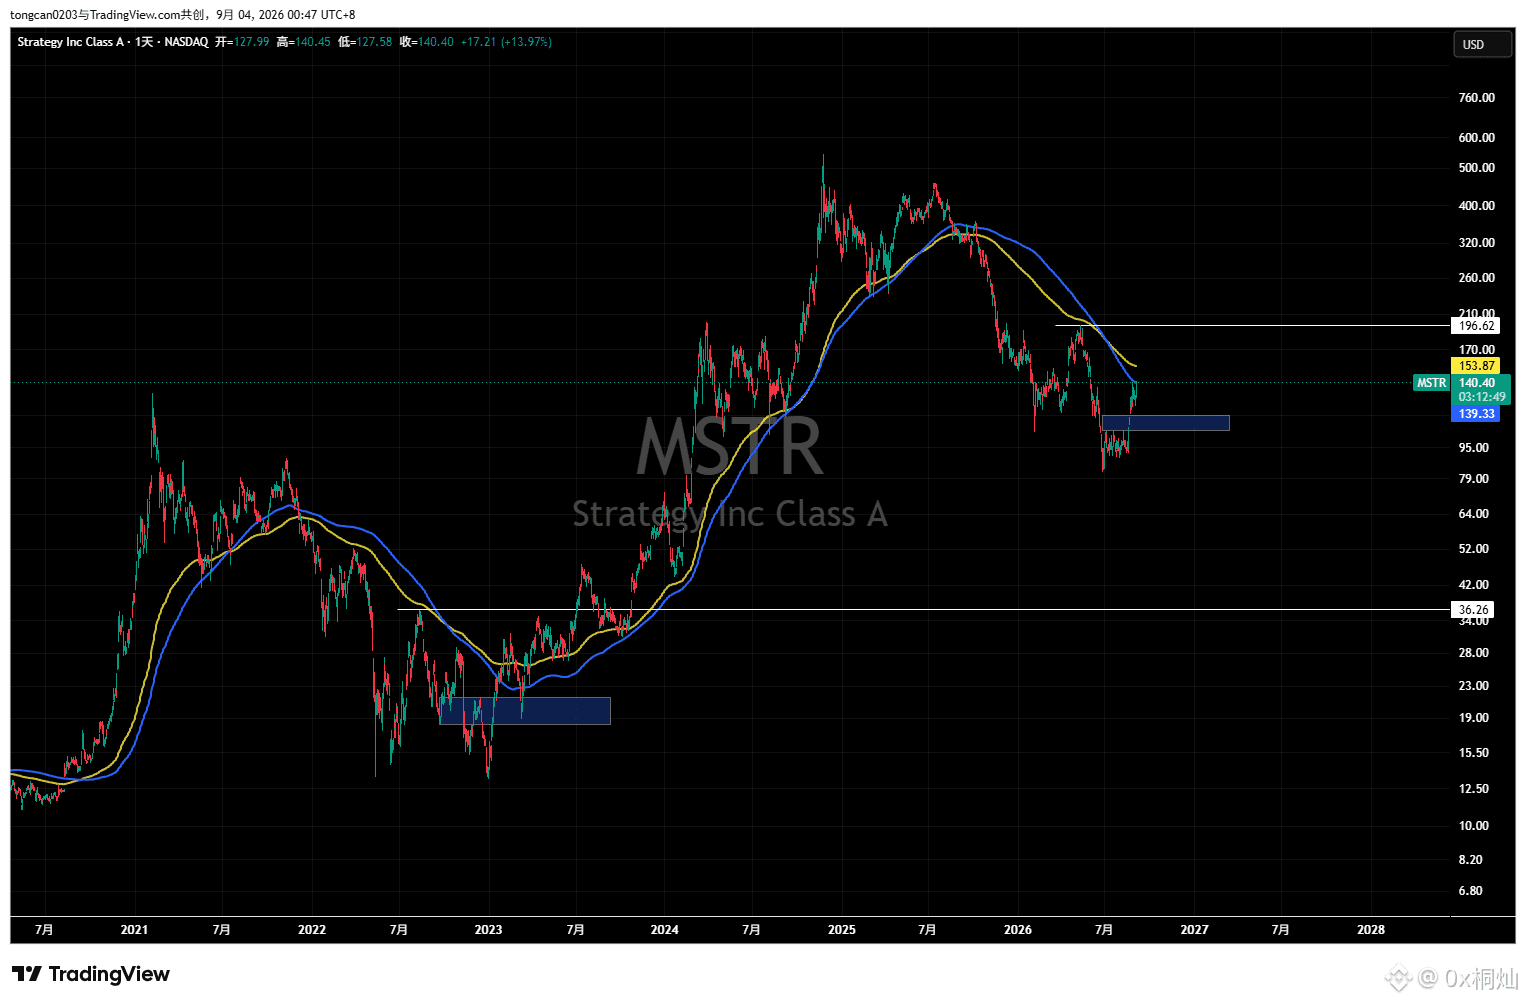
$MSTR is about to hit another new high. If it breaks again, the next resistance level will be around 200.
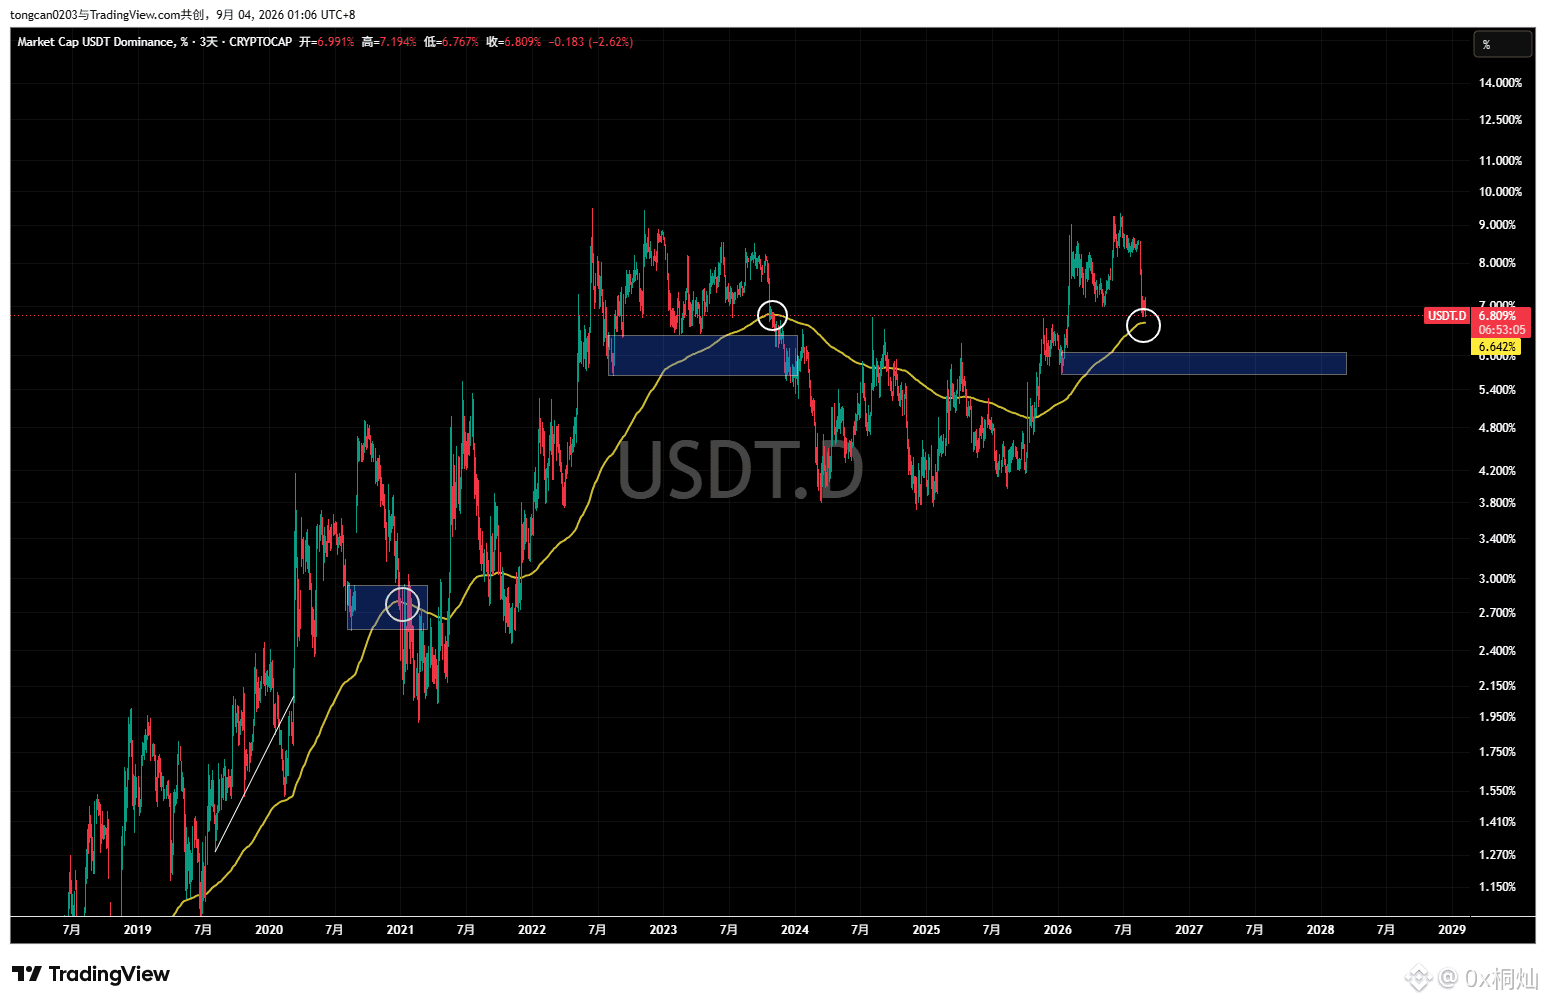
USDT.D is about to break below the 200-day EMA on the 3-day chart. If it breaks, the next resistance is around 6%, roughly $BTC 9.7 million. That would be a smooth one-way trend—possibly even directly pushing toward the previous high near 120,000.
All of our “market predictions and judgments” actually come from “historical candlesticks.” But what people can truly learn from the “history” is only “human nature”—its weaknesses, and its brilliance.
What we can never learn is precisely the “trajectory” that we always think we can learn. Predicting the future using “historical candlesticks” is like building a “palace in the sky.” If you copy it correctly, it becomes a temple admired by everyone; if you copy it wrong, it collapses into nothing.
The most important lesson I’ve learned from history is this: follow a blurry direction, but never try to predict the future’s 【price trajectory】 using your personal ability. For example, you must not, just because my position hasn’t been fully filled, become stubborn and insist there must be another big pullback. Then you would short first and wait for the perfect moment to go all-in at the bottom of the 【golden pit】—that kind of “perfect” operation that is close to “self-delusion.”
My 50% BTC spot DCA, and the subsequent addition of a 30% MSTR spot position plus a 1x leveraged long position, will make no swing trades. The remaining 20% of “ammunition” will only be added during pullbacks. If there is no pullback, then we’ll just let it unfold naturally. The leveraged longs will only be rolled upward in line with the trend.
Just like none of us can predict whether this cycle of $BTC will start early. Likewise, we still cannot predict whether BTC this cycle will produce a smooth one-way trend that nobody could have anticipated.
—For reference.
USDT.D is about to break below the 200-day EMA on the 3-day chart. If it breaks, the next resistance is around 6%, roughly $BTC 9.7 million. That would be a smooth one-way trend—possibly even directly pushing toward the previous high near 120,000.
All of our “market predictions and judgments” actually come from “historical candlesticks.” But what people can truly learn from the “history” is only “human nature”—its weaknesses, and its brilliance.
What we can never learn is precisely the “trajectory” that we always think we can learn. Predicting the future using “historical candlesticks” is like building a “palace in the sky.” If you copy it correctly, it becomes a temple admired by everyone; if you copy it wrong, it collapses into nothing.
The most important lesson I’ve learned from history is this: follow a blurry direction, but never try to predict the future’s 【price trajectory】 using your personal ability. For example, you must not, just because my position hasn’t been fully filled, become stubborn and insist there must be another big pullback. Then you would short first and wait for the perfect moment to go all-in at the bottom of the 【golden pit】—that kind of “perfect” operation that is close to “self-delusion.”
My 50% BTC spot DCA, and the subsequent addition of a 30% MSTR spot position plus a 1x leveraged long position, will make no swing trades. The remaining 20% of “ammunition” will only be added during pullbacks. If there is no pullback, then we’ll just let it unfold naturally. The leveraged longs will only be rolled upward in line with the trend.
Just like none of us can predict whether this cycle of $BTC will start early. Likewise, we still cannot predict whether BTC this cycle will produce a smooth one-way trend that nobody could have anticipated.
—For reference.
0x桐灿
·
--
The logic for adding positions and chasing to $MSTR is very simple.
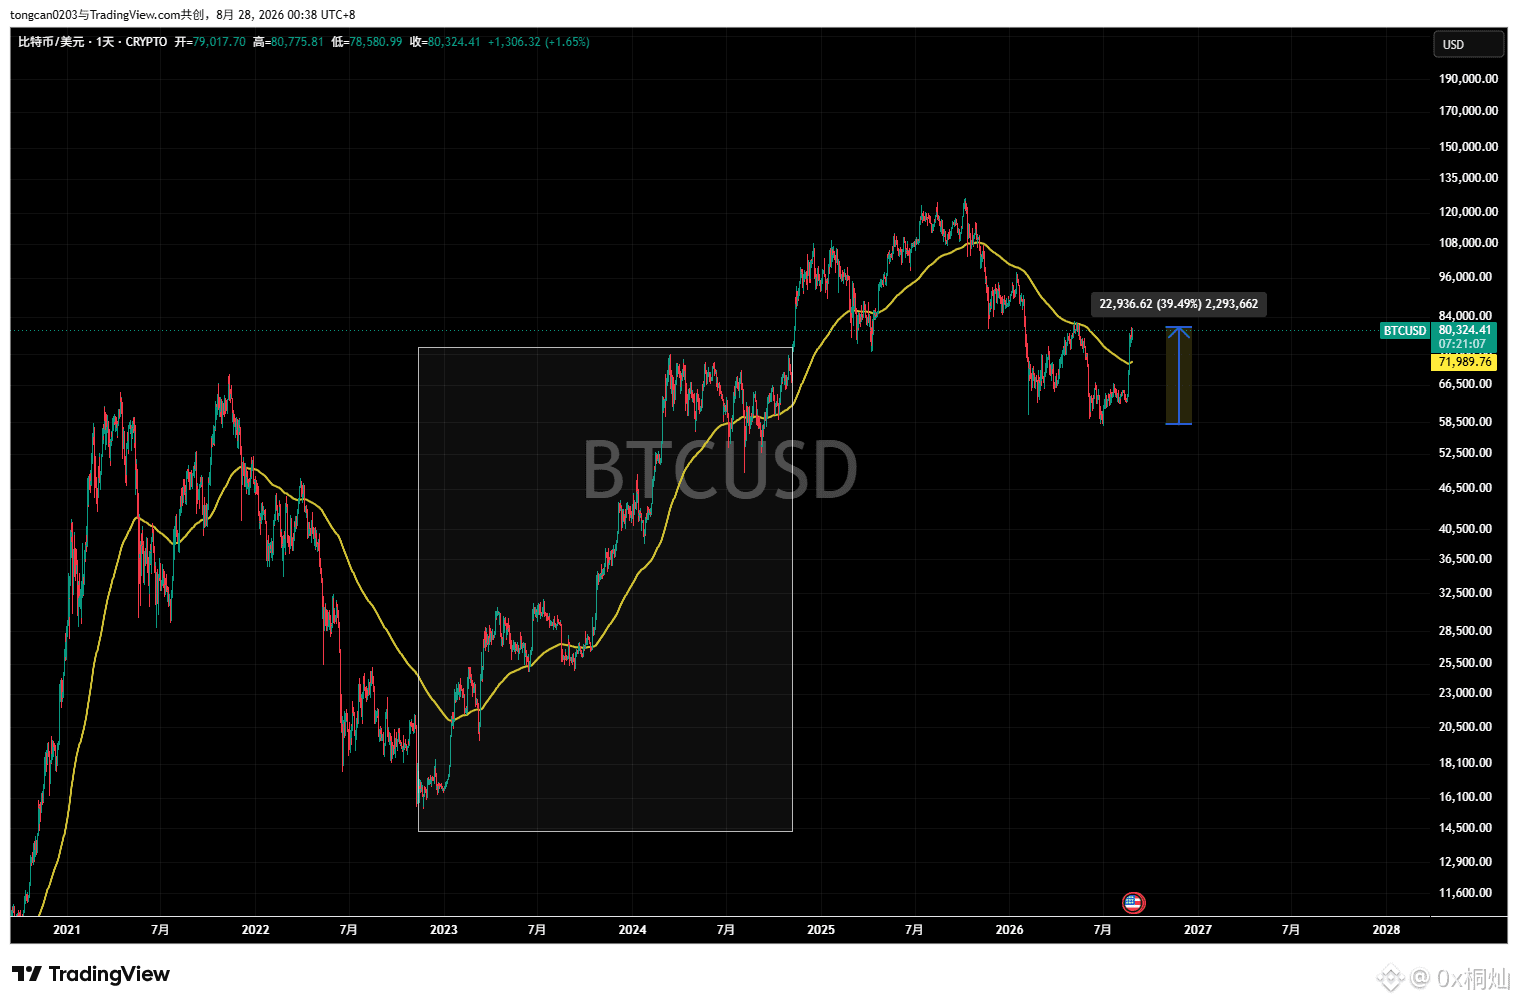
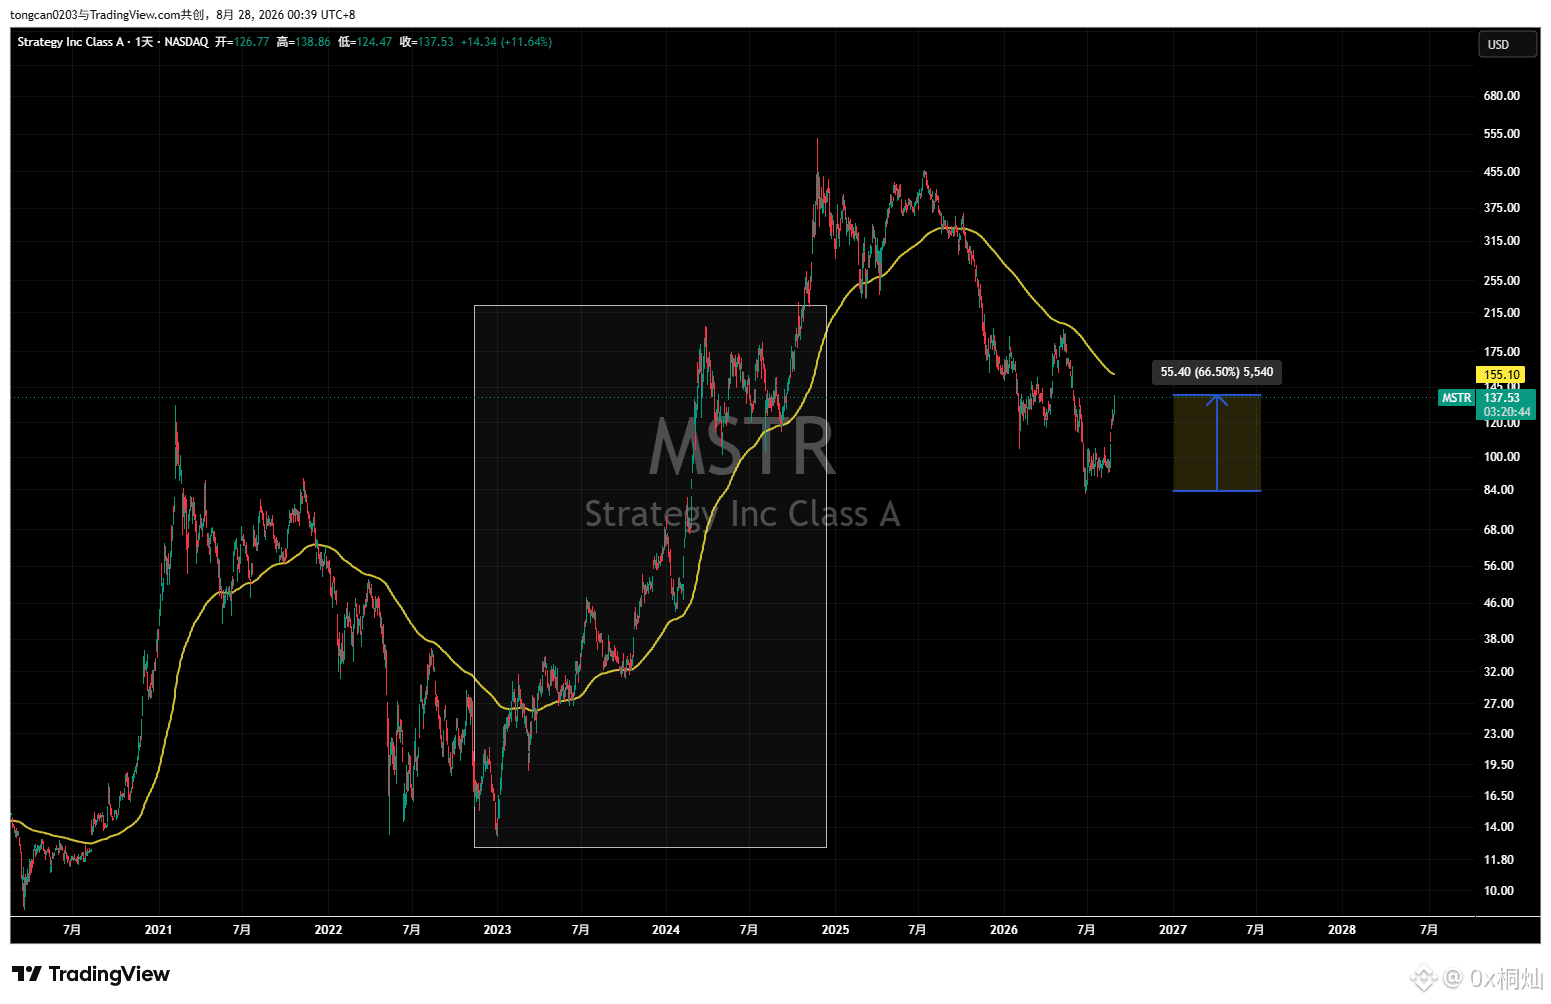
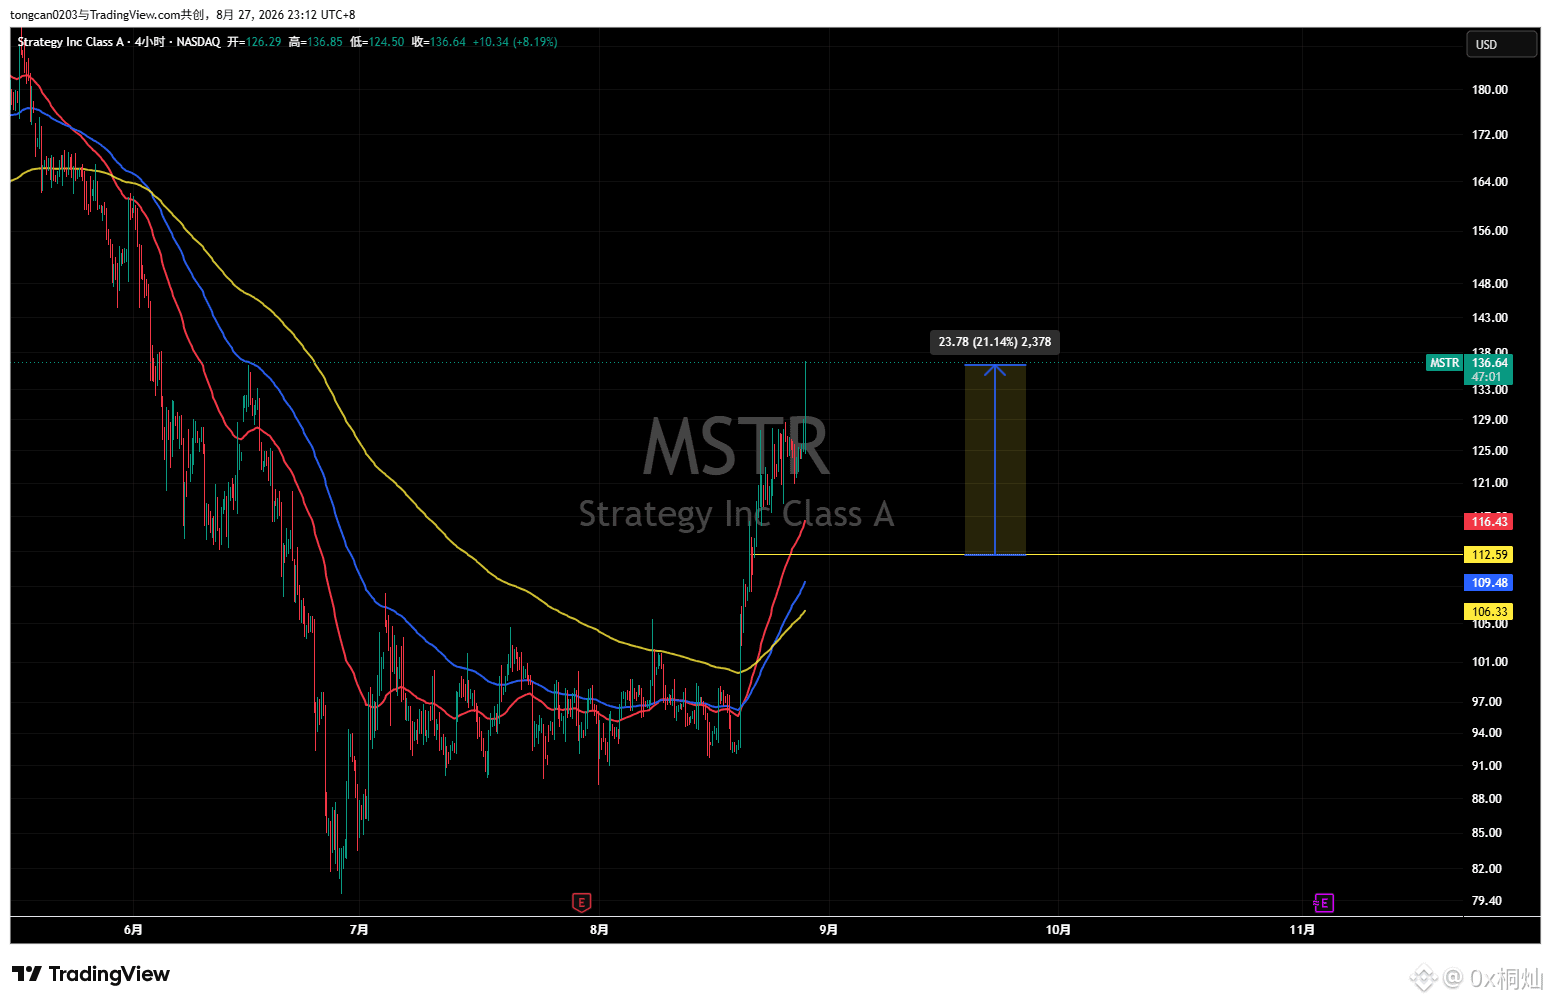
On August 21, MSTR’s daily line ($BTC ) had already stabilized above the EMA200. The rise from the bottom of 58,000 to 78,000 at that time was a 35% gain, while back then the EMA200 for $MSTR still couldn’t even be touched from below. The move from 82 to 112 was a 36% gain. Normally, MSTR’s volatility should be at least 1.5 to 2 times that of BTC, yet at that time the volatility of both sides was almost identical.
During a pullback, MSTR’s volatility would naturally be amplified as well, but most likely it needed to first catch up on the volatility gap. And at that time, 112 was the price where the volatilities of the two sides were nearly in sync—so the safety risk of chasing into MSTR here was very low. Today, the volatilities of both sides have finally started to return to a normal ratio.
Since MSTR is a US stock, in the subsequent uptrend of the larger cycle it may also move more smoothly than BTC, and be easier to form the standard pattern of “higher and higher lows.” After confirming the bottom and the low point, it is more suitable for riding the trend and rolling over with lower leverage.
—The above is for reference.
On August 21, MSTR’s daily line ($BTC ) had already stabilized above the EMA200. The rise from the bottom of 58,000 to 78,000 at that time was a 35% gain, while back then the EMA200 for $MSTR still couldn’t even be touched from below. The move from 82 to 112 was a 36% gain. Normally, MSTR’s volatility should be at least 1.5 to 2 times that of BTC, yet at that time the volatility of both sides was almost identical.
During a pullback, MSTR’s volatility would naturally be amplified as well, but most likely it needed to first catch up on the volatility gap. And at that time, 112 was the price where the volatilities of the two sides were nearly in sync—so the safety risk of chasing into MSTR here was very low. Today, the volatilities of both sides have finally started to return to a normal ratio.
Since MSTR is a US stock, in the subsequent uptrend of the larger cycle it may also move more smoothly than BTC, and be easier to form the standard pattern of “higher and higher lows.” After confirming the bottom and the low point, it is more suitable for riding the trend and rolling over with lower leverage.
—The above is for reference.
The logic for adding positions and chasing to $MSTR is very simple.
On August 21, MSTR’s daily line ($BTC ) had already stabilized above the EMA200. The rise from the bottom of 58,000 to 78,000 at that time was a 35% gain, while back then the EMA200 for $MSTR still couldn’t even be touched from below. The move from 82 to 112 was a 36% gain. Normally, MSTR’s volatility should be at least 1.5 to 2 times that of BTC, yet at that time the volatility of both sides was almost identical.
During a pullback, MSTR’s volatility would naturally be amplified as well, but most likely it needed to first catch up on the volatility gap. And at that time, 112 was the price where the volatilities of the two sides were nearly in sync—so the safety risk of chasing into MSTR here was very low. Today, the volatilities of both sides have finally started to return to a normal ratio.
Since MSTR is a US stock, in the subsequent uptrend of the larger cycle it may also move more smoothly than BTC, and be easier to form the standard pattern of “higher and higher lows.” After confirming the bottom and the low point, it is more suitable for riding the trend and rolling over with lower leverage.
—The above is for reference.
On August 21, MSTR’s daily line ($BTC ) had already stabilized above the EMA200. The rise from the bottom of 58,000 to 78,000 at that time was a 35% gain, while back then the EMA200 for $MSTR still couldn’t even be touched from below. The move from 82 to 112 was a 36% gain. Normally, MSTR’s volatility should be at least 1.5 to 2 times that of BTC, yet at that time the volatility of both sides was almost identical.
During a pullback, MSTR’s volatility would naturally be amplified as well, but most likely it needed to first catch up on the volatility gap. And at that time, 112 was the price where the volatilities of the two sides were nearly in sync—so the safety risk of chasing into MSTR here was very low. Today, the volatilities of both sides have finally started to return to a normal ratio.
Since MSTR is a US stock, in the subsequent uptrend of the larger cycle it may also move more smoothly than BTC, and be easier to form the standard pattern of “higher and higher lows.” After confirming the bottom and the low point, it is more suitable for riding the trend and rolling over with lower leverage.
—The above is for reference.
0x桐灿
·
--
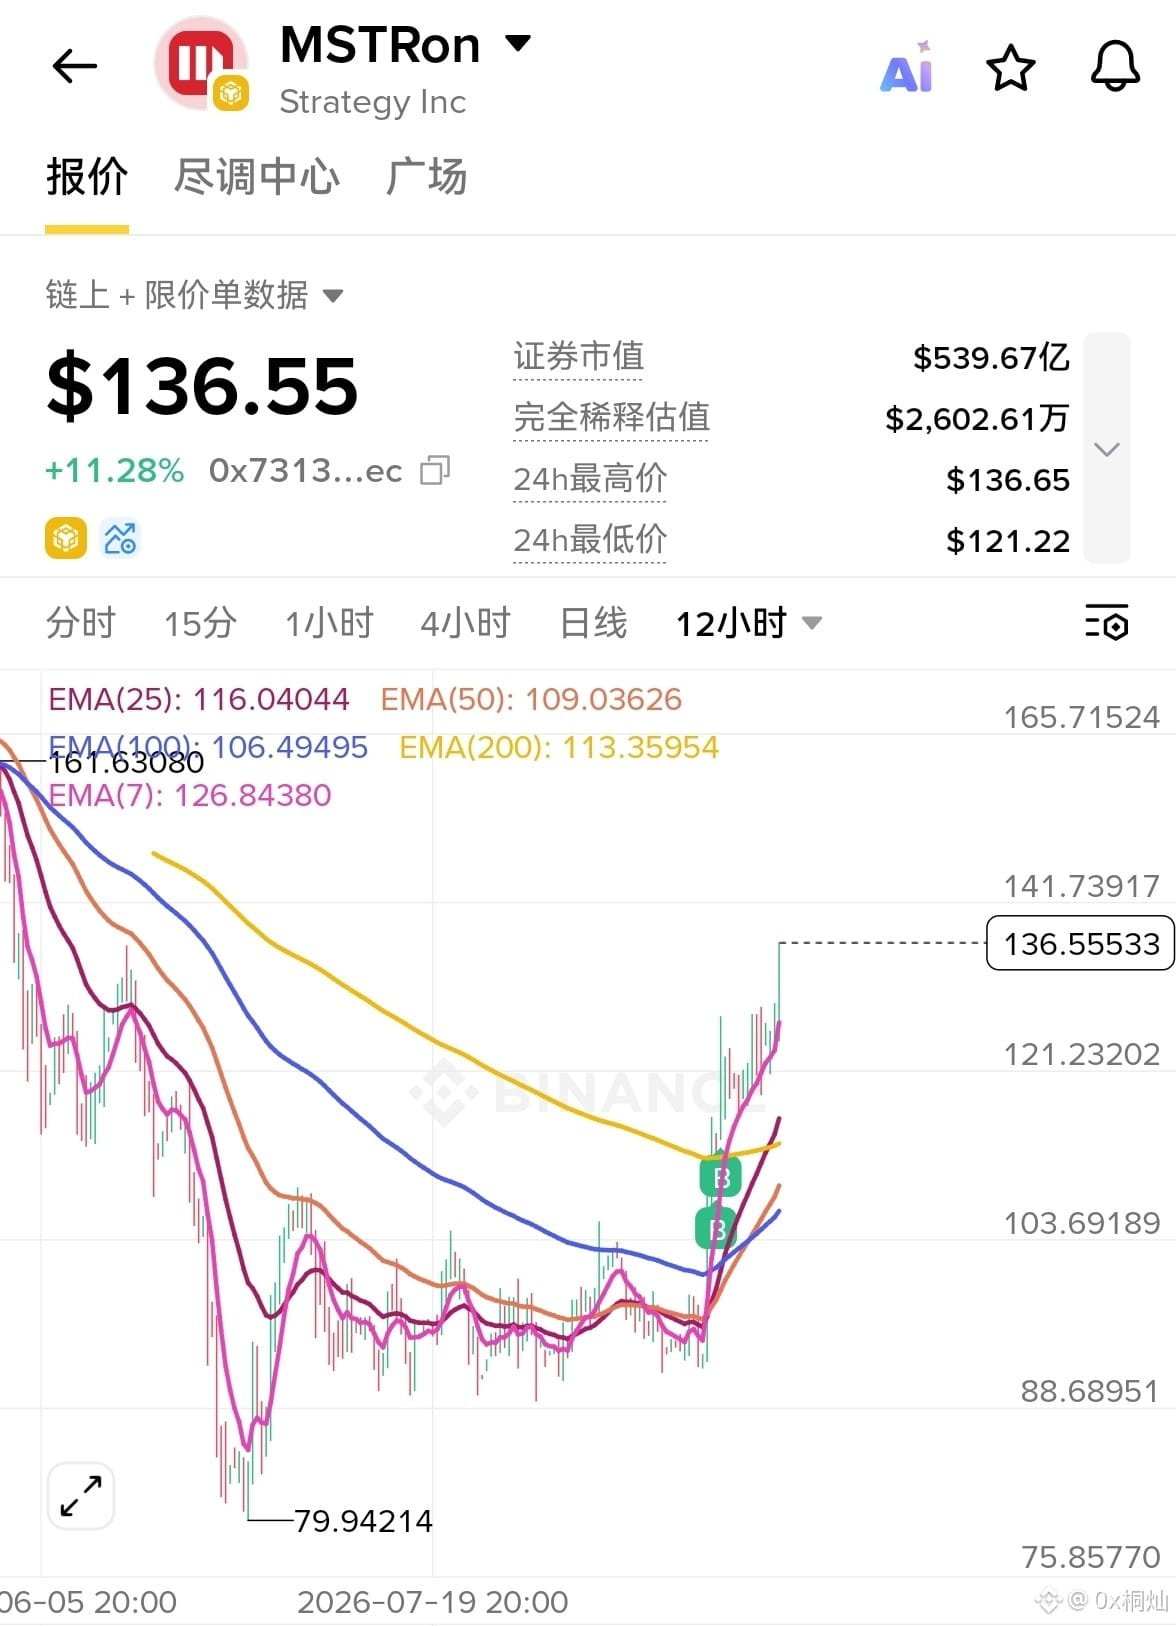
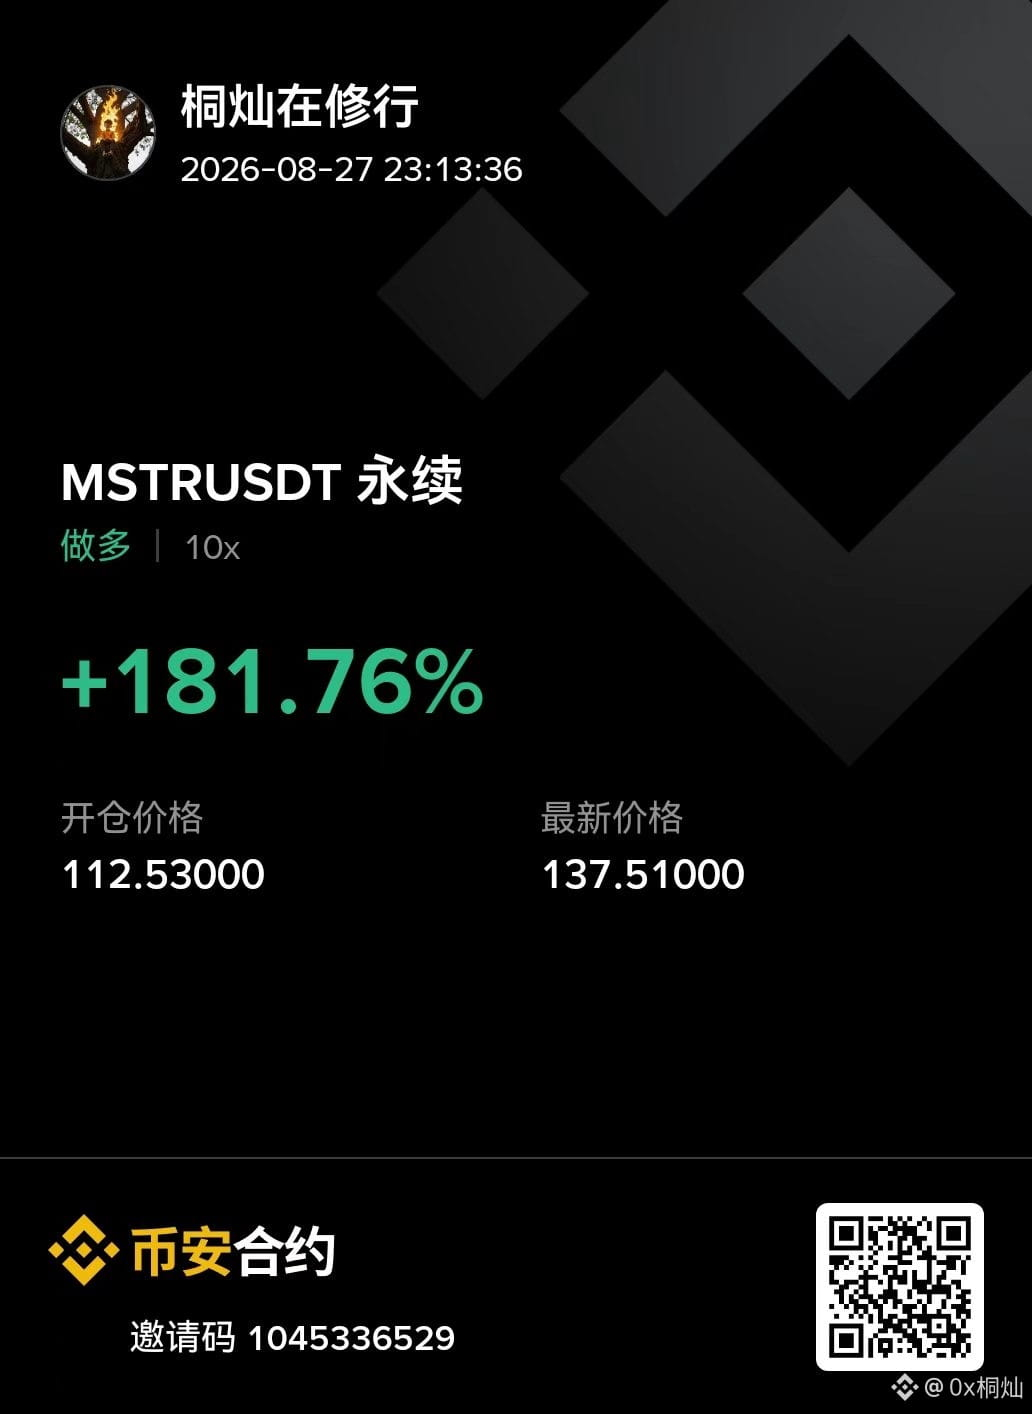
$MSTR has started to catch up on gains. This round began DCA around $BTC 6 million, buying only 50% of the position. On August 21, I decided to add in and follow with 30% of the spot position into $MSTR , and at the same time opened a low-leverage long-term position in the futures account.
BTC rose from 78,000 on the 21st to around 80,000, a 3% increase. MSTR has started to catch up on gains today, and its increase has already reached 20 points.
BTC rose from 78,000 on the 21st to around 80,000, a 3% increase. MSTR has started to catch up on gains today, and its increase has already reached 20 points.
$MSTR has started to catch up on gains. This round began DCA around $BTC 6 million, buying only 50% of the position. On August 21, I decided to add in and follow with 30% of the spot position into $MSTR , and at the same time opened a low-leverage long-term position in the futures account.
BTC rose from 78,000 on the 21st to around 80,000, a 3% increase. MSTR has started to catch up on gains today, and its increase has already reached 20 points.
BTC rose from 78,000 on the 21st to around 80,000, a 3% increase. MSTR has started to catch up on gains today, and its increase has already reached 20 points.
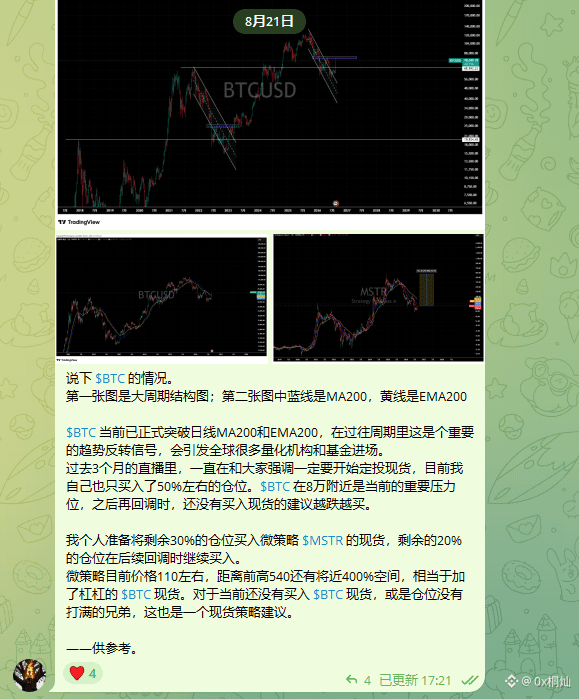
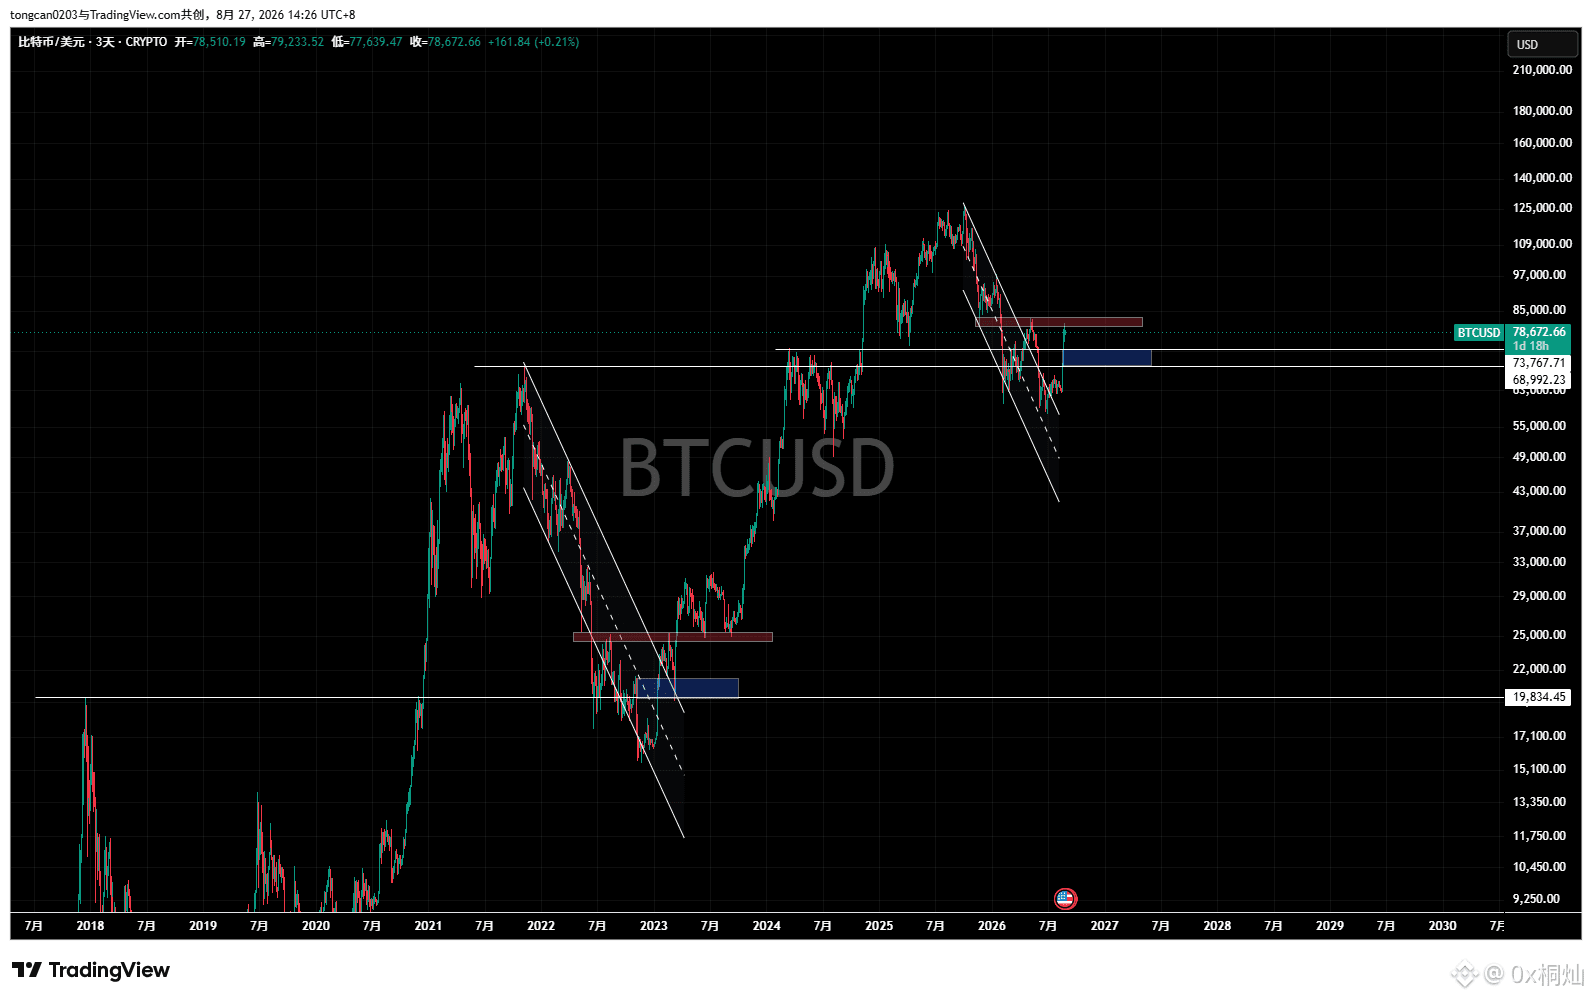
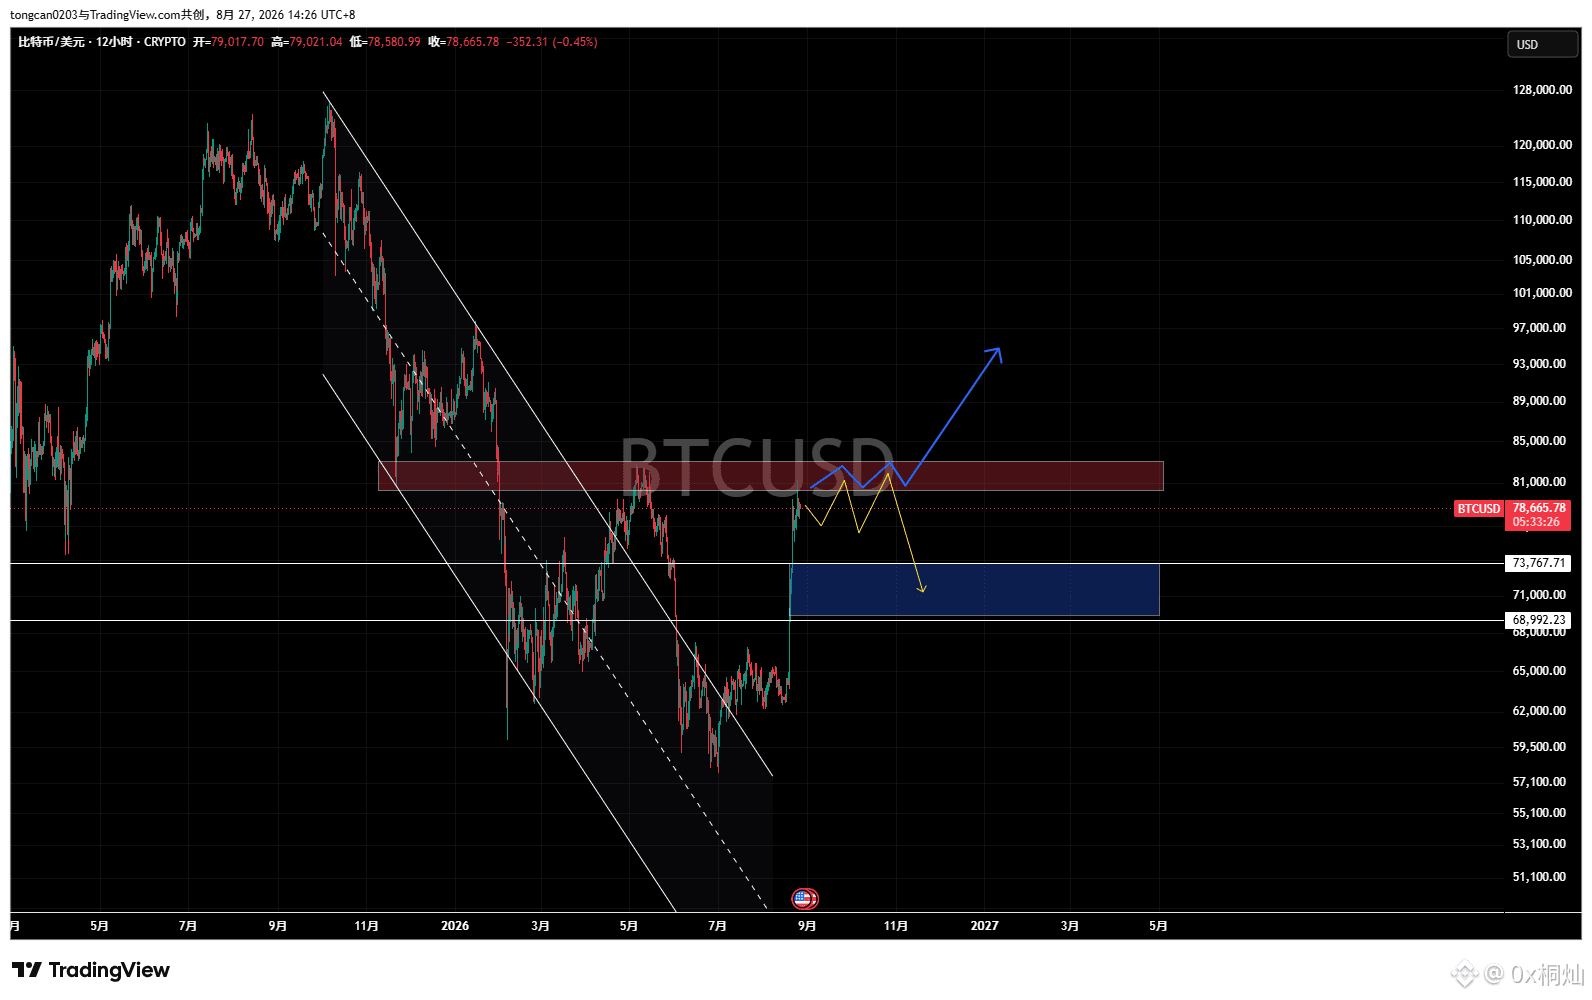
Stage 1: $BTC phase topping and oscillation phase. I tend to wait for a pullback and then look for a long position. If after a strong sideways consolidation the price continues to break out, then enter long following the breakout.
— For reference.
— For reference.
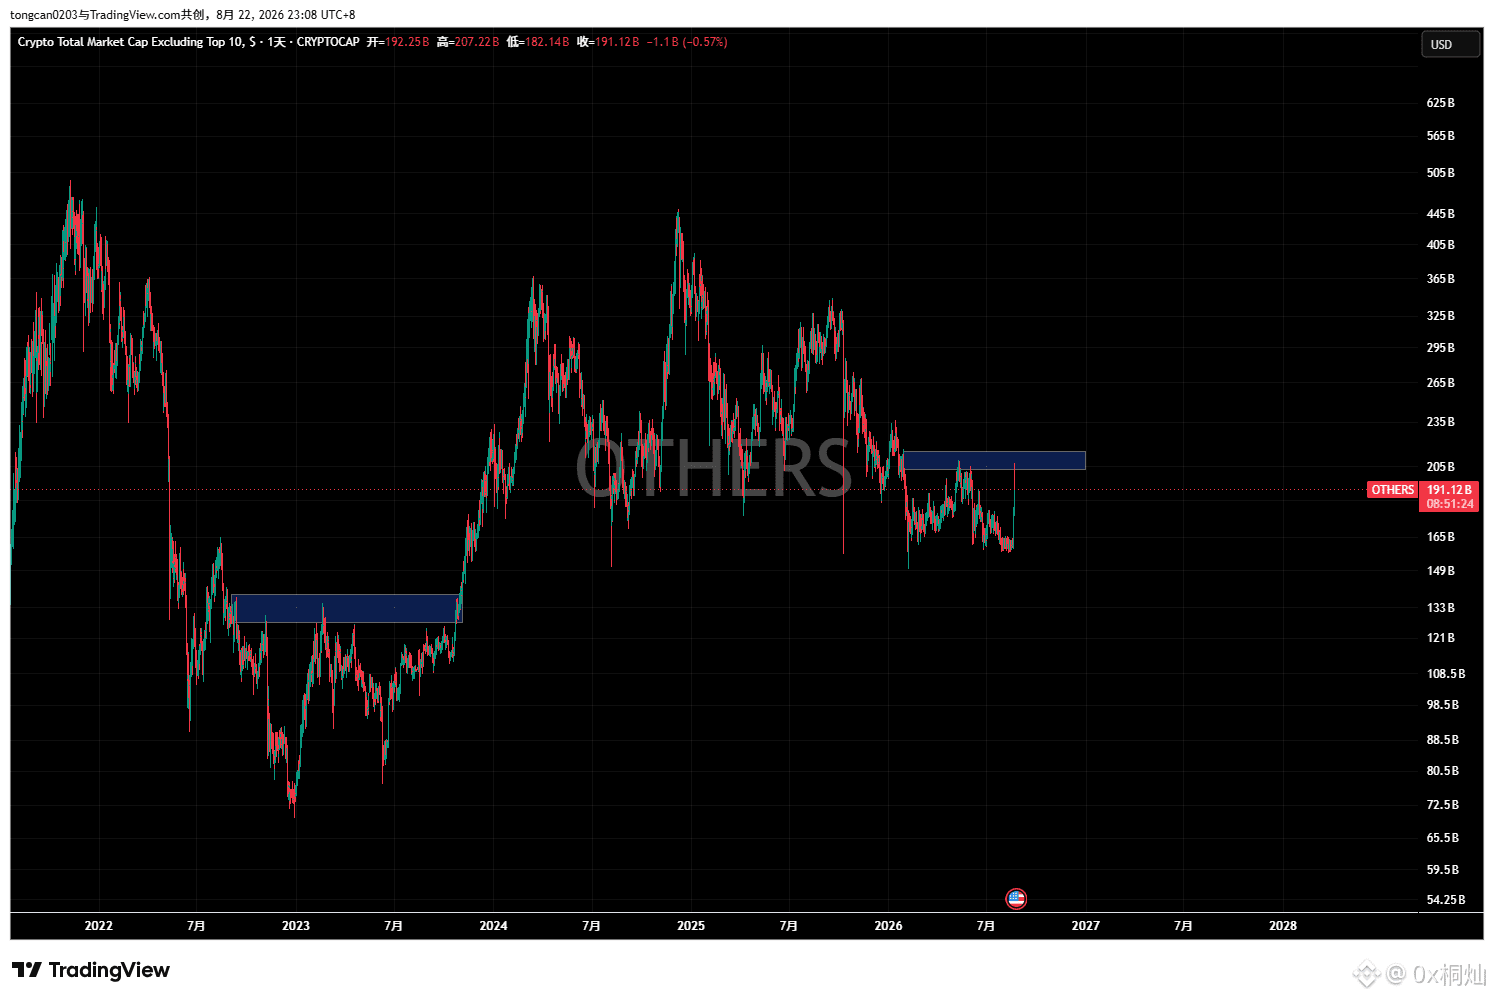
Counterfeit #OTHERS today saw a collective needle-stick; those with strong rebounds can still move along, while the weaker ones have already had their structure broken.
These are experience and intuition learned from losing money back in the days of running counterfeits: the more you make, the more you run—not the more you make, the more greedy you get. When an uptrend comes in fiercely, the first thing to think about is the risk of 【profit giving back and a sudden end】.
When facing the market, think contrarily: go long at lows, short at highs. When facing both your account’s profits and your inner emotions, you should also apply contrarian thinking…
When you’re overwhelmed with joy, the first thing that flashes in your mind is: “Beware and fear.”
These are experience and intuition learned from losing money back in the days of running counterfeits: the more you make, the more you run—not the more you make, the more greedy you get. When an uptrend comes in fiercely, the first thing to think about is the risk of 【profit giving back and a sudden end】.
When facing the market, think contrarily: go long at lows, short at highs. When facing both your account’s profits and your inner emotions, you should also apply contrarian thinking…
When you’re overwhelmed with joy, the first thing that flashes in your mind is: “Beware and fear.”
0x桐灿
·
--
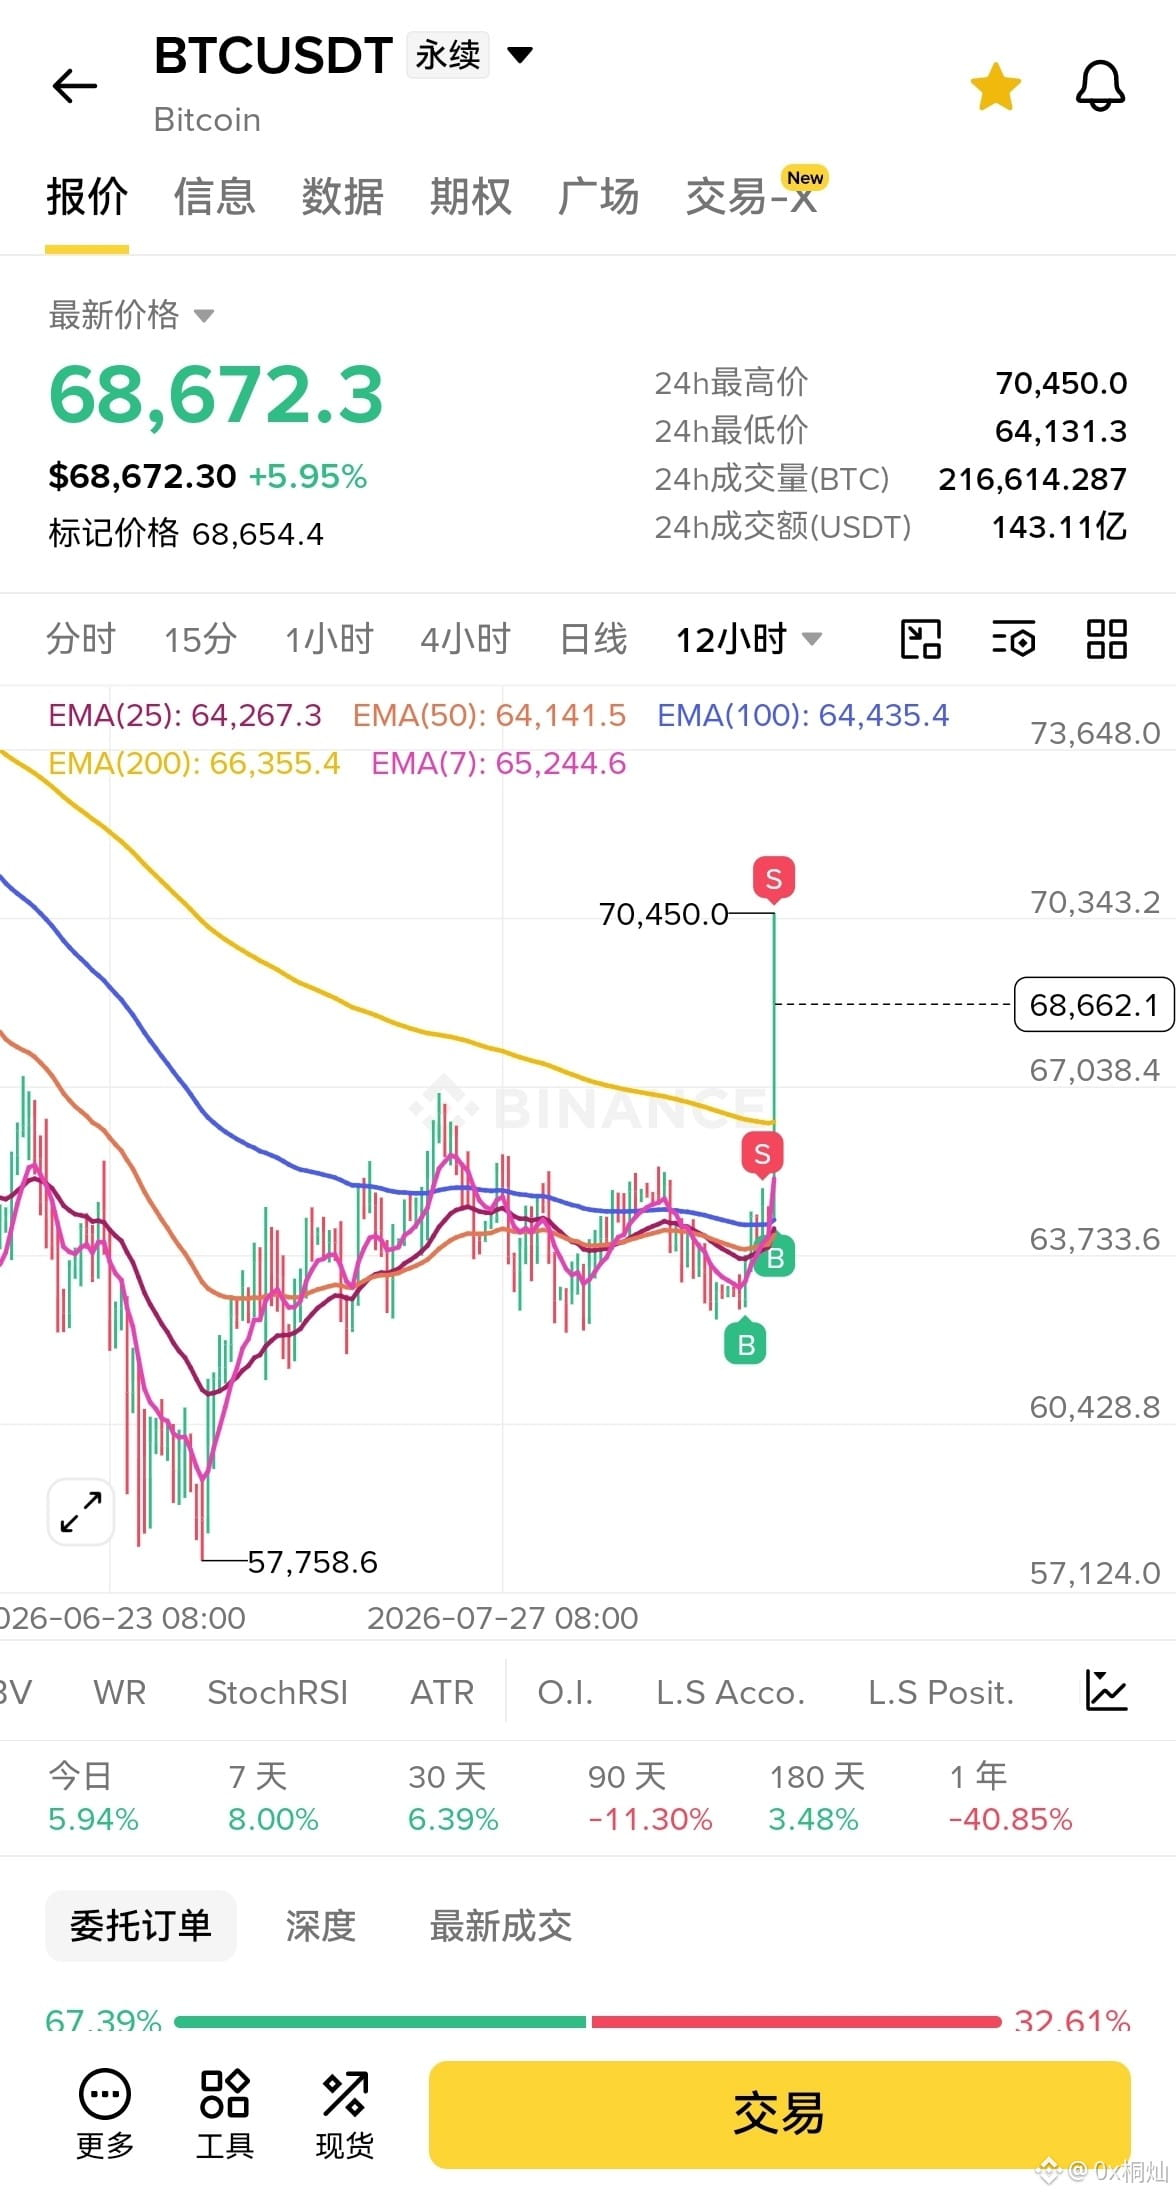
Over the next week or two, I will comprehensively short counterfeit coins. All profits obtained will be used entirely to place 【long-term buy orders】 for $BTC and $MSTR .
All it takes for $BTC is a 10% drop, and the counterfeit coins will collapse completely.
Counterfeit coins need to form a bottom through 【a wide time span + wide price swings】 oscillation. The market is currently in the phase of a bull market—bear market—【wide-range consolidation】. In this phase is the golden time to trade counterfeit coins with the strategy of 【go long low and short high】.
On August 1st, I publicly buried positions in some counterfeit coins; they have already entered the middle-to-late stage of a surge. Today, I’m again publicly disclosing my plans to place short orders.
Everything is for the 【ultimate BTC celebration】.
—For reference.
All it takes for $BTC is a 10% drop, and the counterfeit coins will collapse completely.
Counterfeit coins need to form a bottom through 【a wide time span + wide price swings】 oscillation. The market is currently in the phase of a bull market—bear market—【wide-range consolidation】. In this phase is the golden time to trade counterfeit coins with the strategy of 【go long low and short high】.
On August 1st, I publicly buried positions in some counterfeit coins; they have already entered the middle-to-late stage of a surge. Today, I’m again publicly disclosing my plans to place short orders.
Everything is for the 【ultimate BTC celebration】.
—For reference.
Over the next week or two, I will comprehensively short counterfeit coins. All profits obtained will be used entirely to place 【long-term buy orders】 for $BTC and $MSTR .
All it takes for $BTC is a 10% drop, and the counterfeit coins will collapse completely.
Counterfeit coins need to form a bottom through 【a wide time span + wide price swings】 oscillation. The market is currently in the phase of a bull market—bear market—【wide-range consolidation】. In this phase is the golden time to trade counterfeit coins with the strategy of 【go long low and short high】.
On August 1st, I publicly buried positions in some counterfeit coins; they have already entered the middle-to-late stage of a surge. Today, I’m again publicly disclosing my plans to place short orders.
Everything is for the 【ultimate BTC celebration】.
—For reference.
All it takes for $BTC is a 10% drop, and the counterfeit coins will collapse completely.
Counterfeit coins need to form a bottom through 【a wide time span + wide price swings】 oscillation. The market is currently in the phase of a bull market—bear market—【wide-range consolidation】. In this phase is the golden time to trade counterfeit coins with the strategy of 【go long low and short high】.
On August 1st, I publicly buried positions in some counterfeit coins; they have already entered the middle-to-late stage of a surge. Today, I’m again publicly disclosing my plans to place short orders.
Everything is for the 【ultimate BTC celebration】.
—For reference.
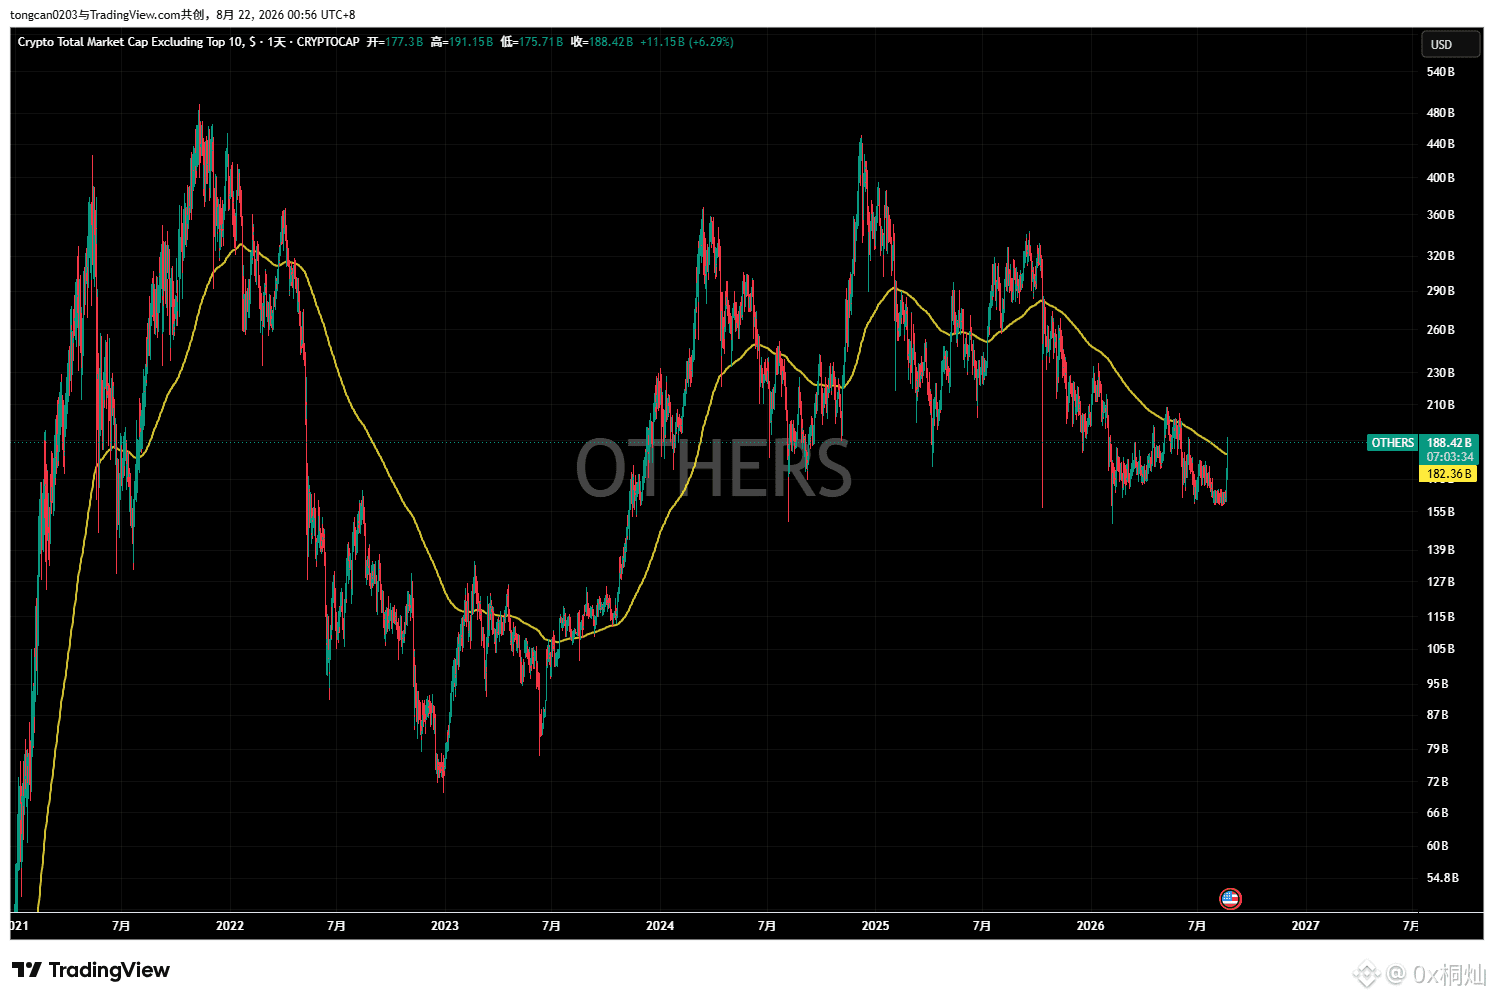
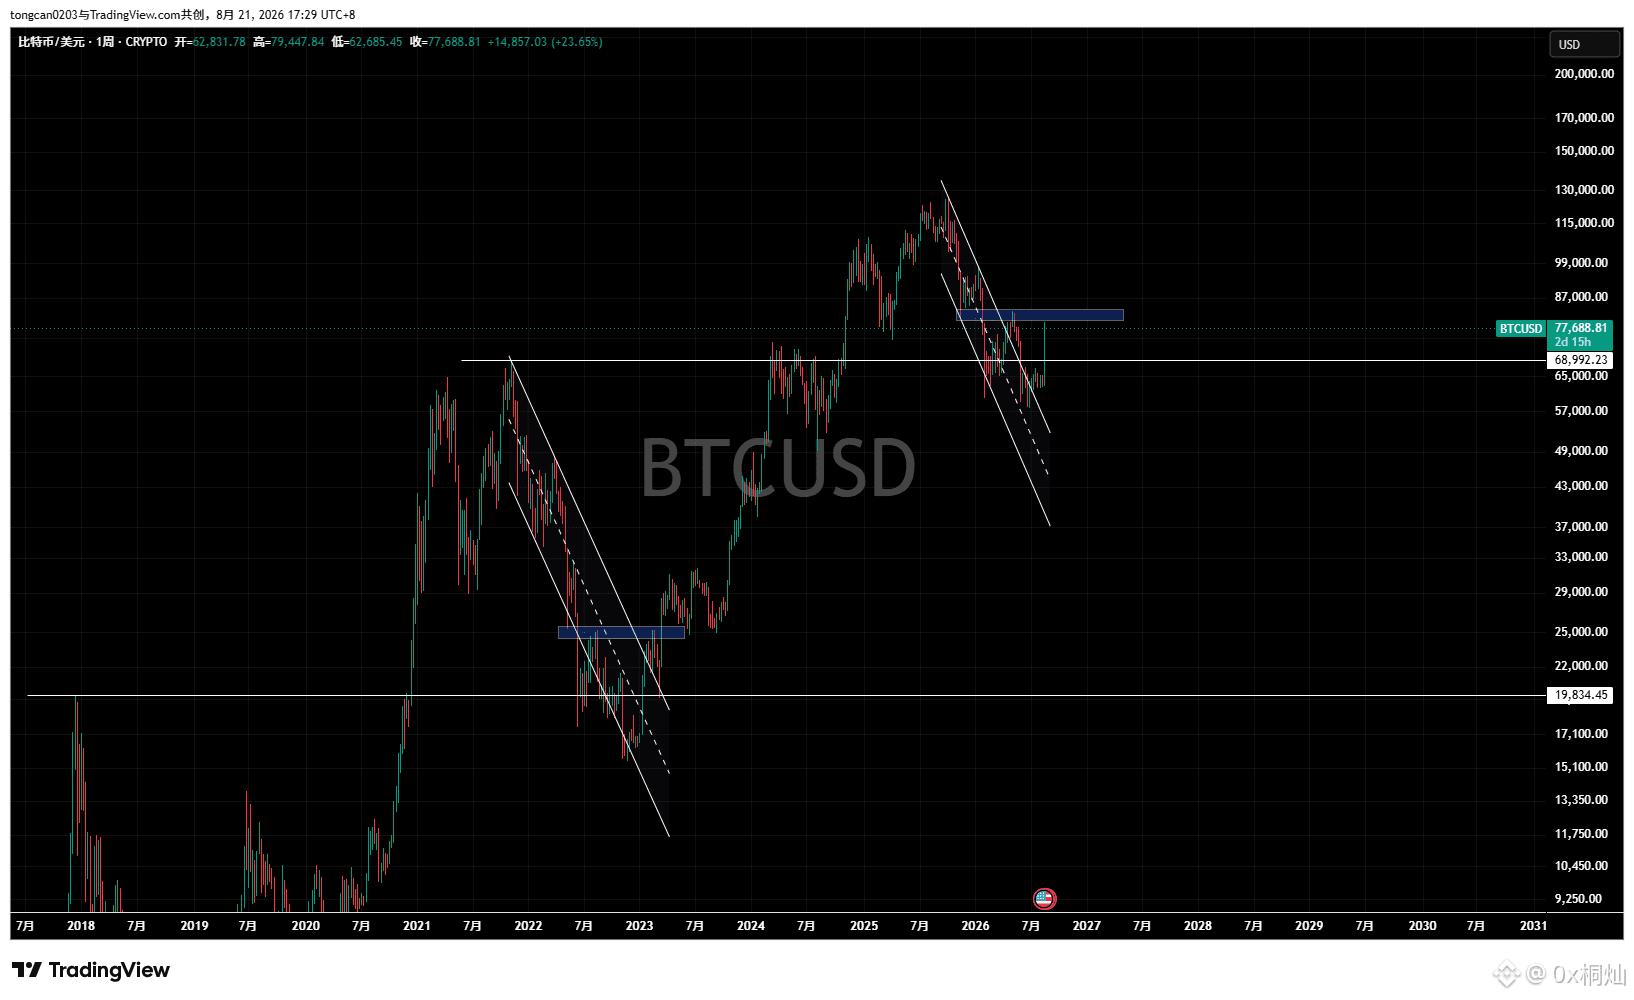
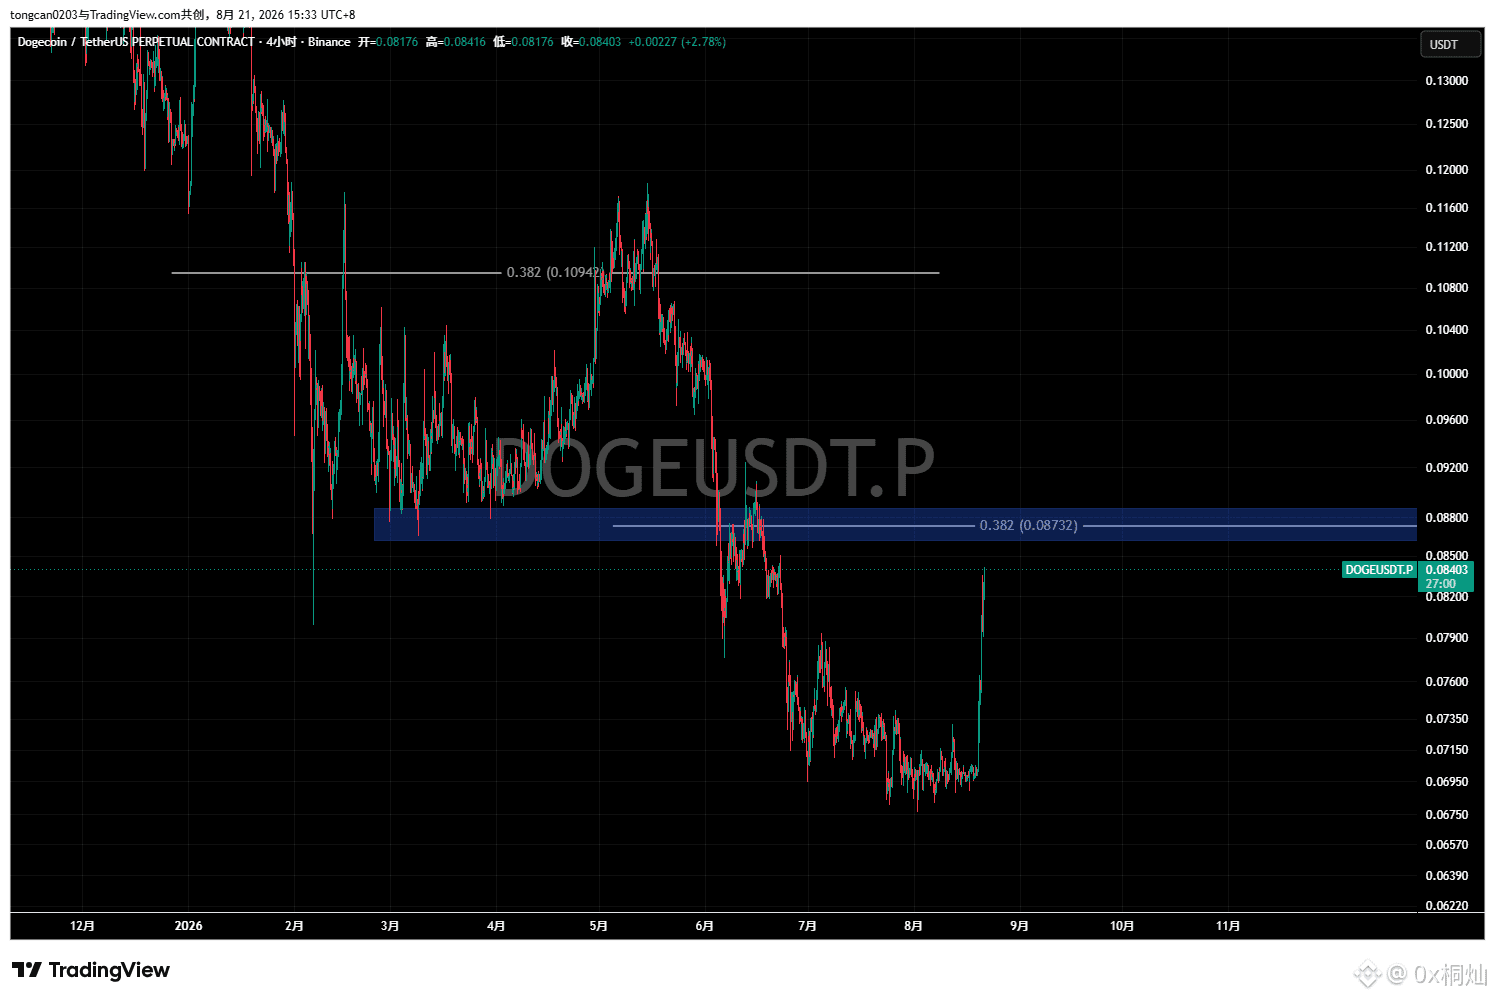
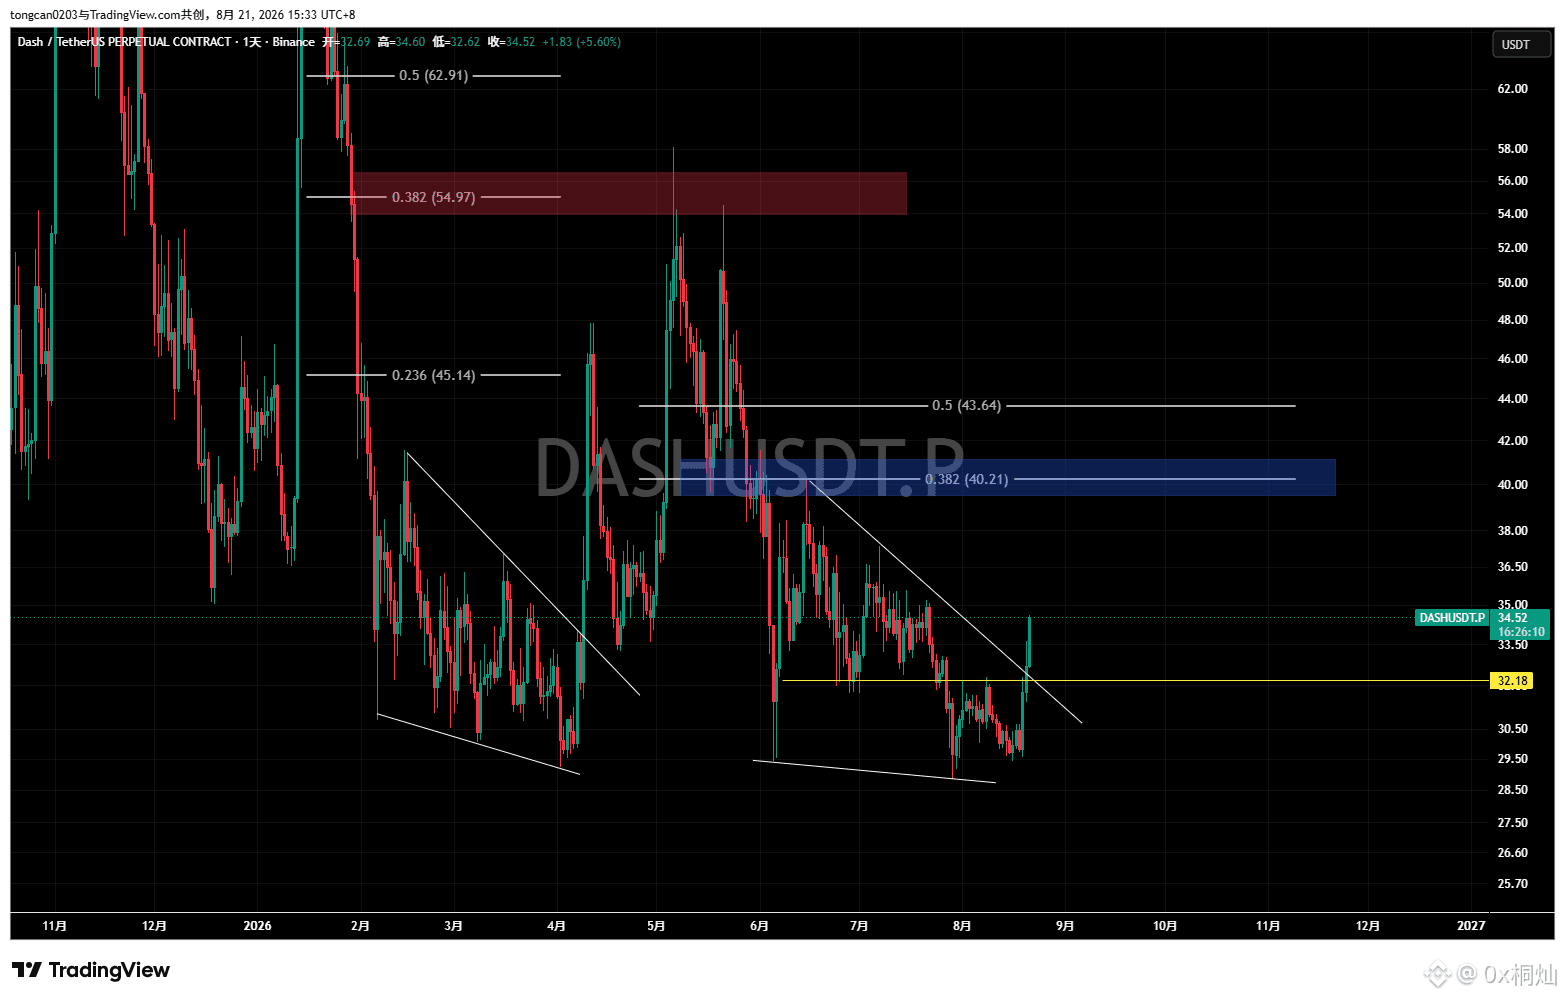
$DOGE and $DASH were positioned secretly at the beginning of August; start taking profits in batches. The final target and the pressure level are both at the 0.382 position—reference only.
0x桐灿
·
--
$AAVE 📉
$DASH $DOGE 等待💹
📈
$DASH $DOGE 等待💹
📈
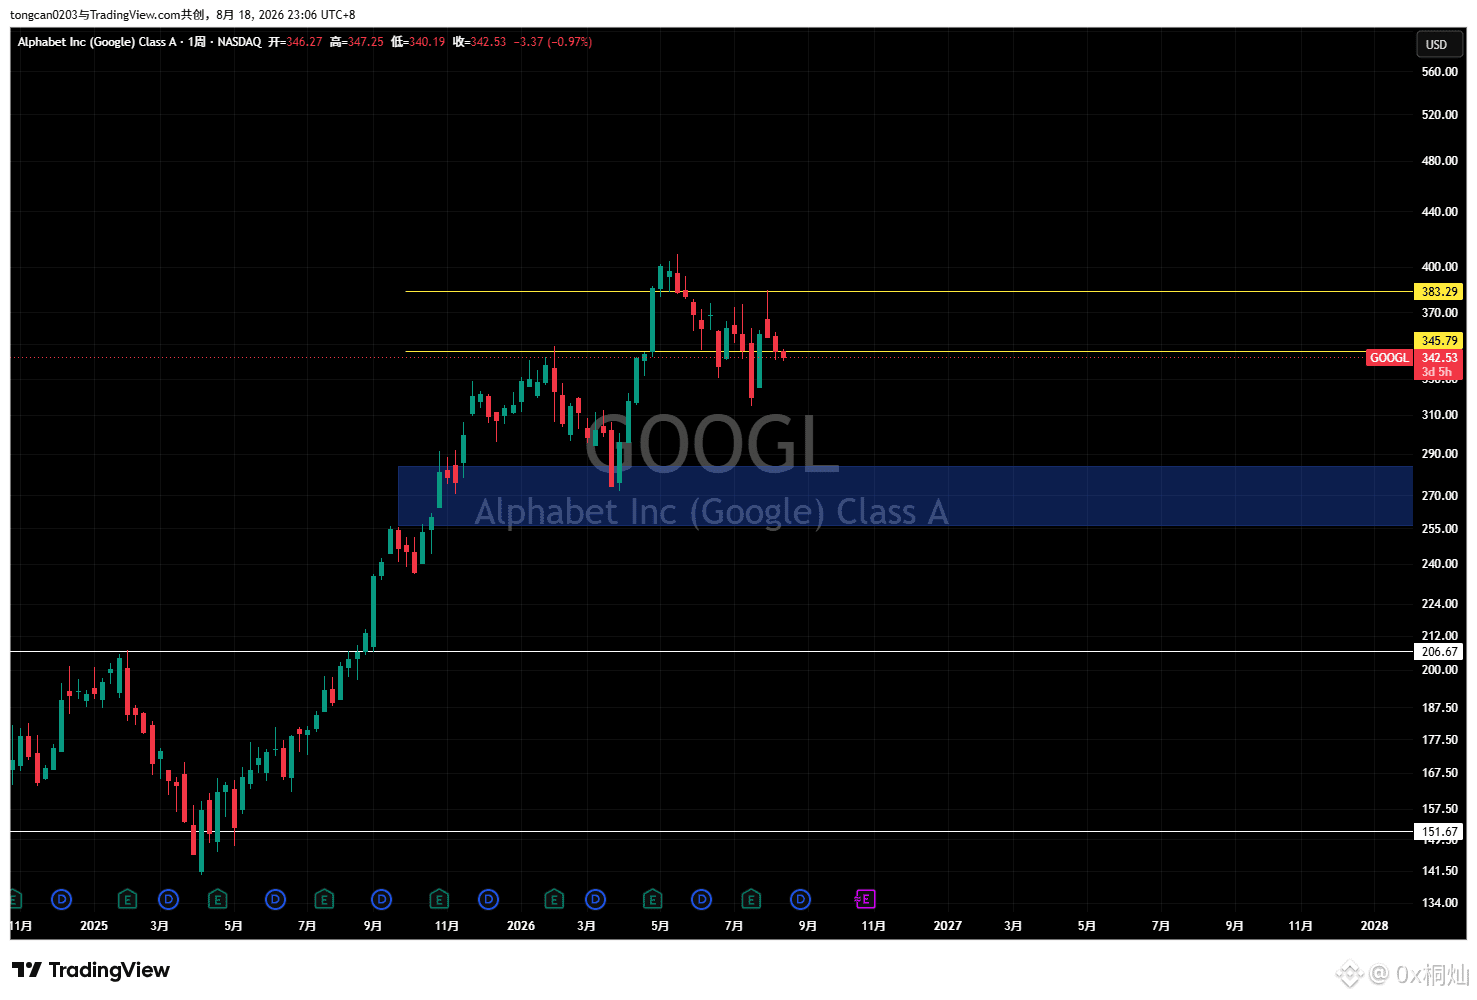
$GOOGL Last week’s long-term short position opened, attempting to hold around 280;
$SOXL The short position I just chased today—add to the position after a small-level rebound, aiming for around 70.
——For reference
$SOXL The short position I just chased today—add to the position after a small-level rebound, aiming for around 70.
——For reference
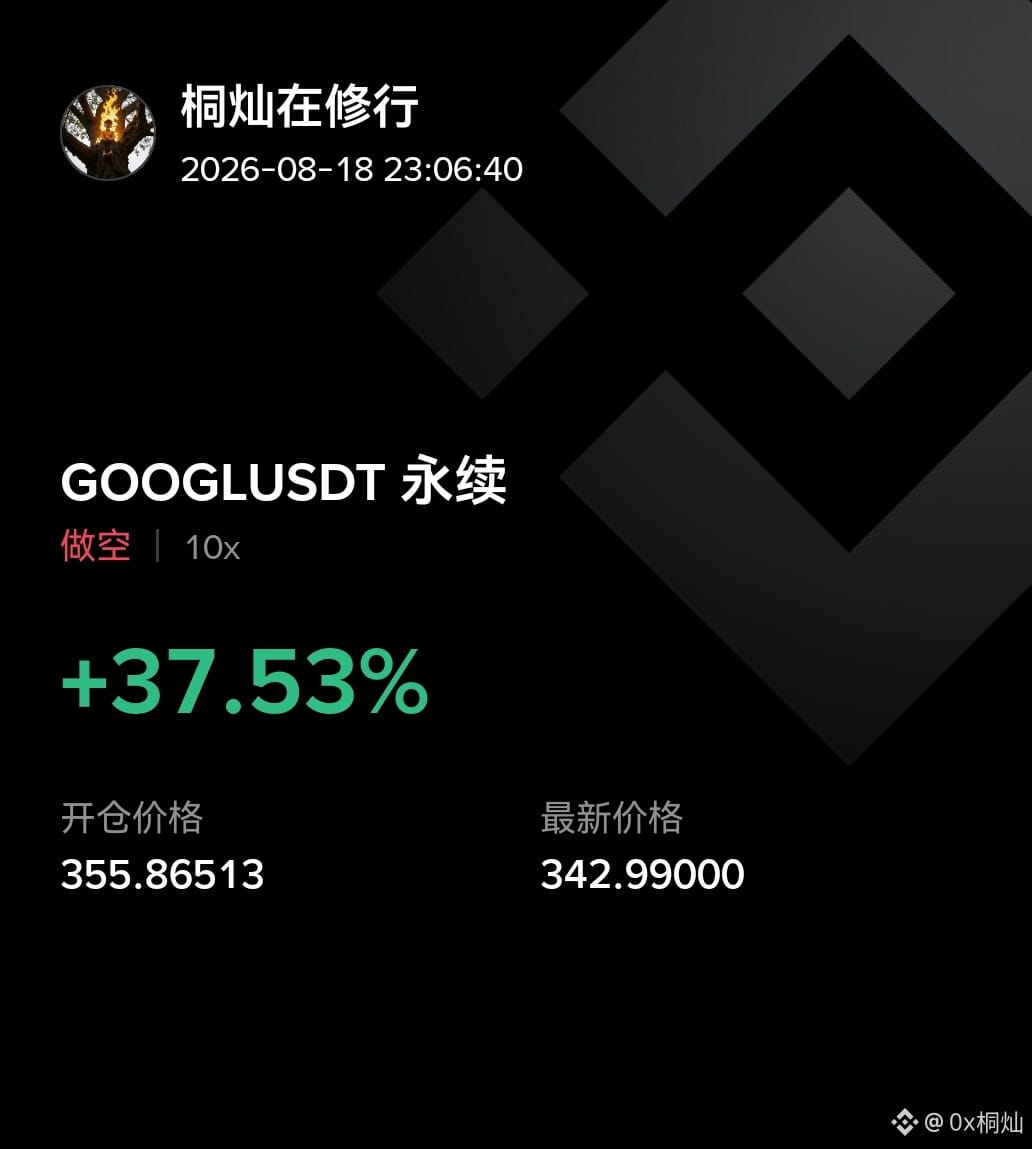
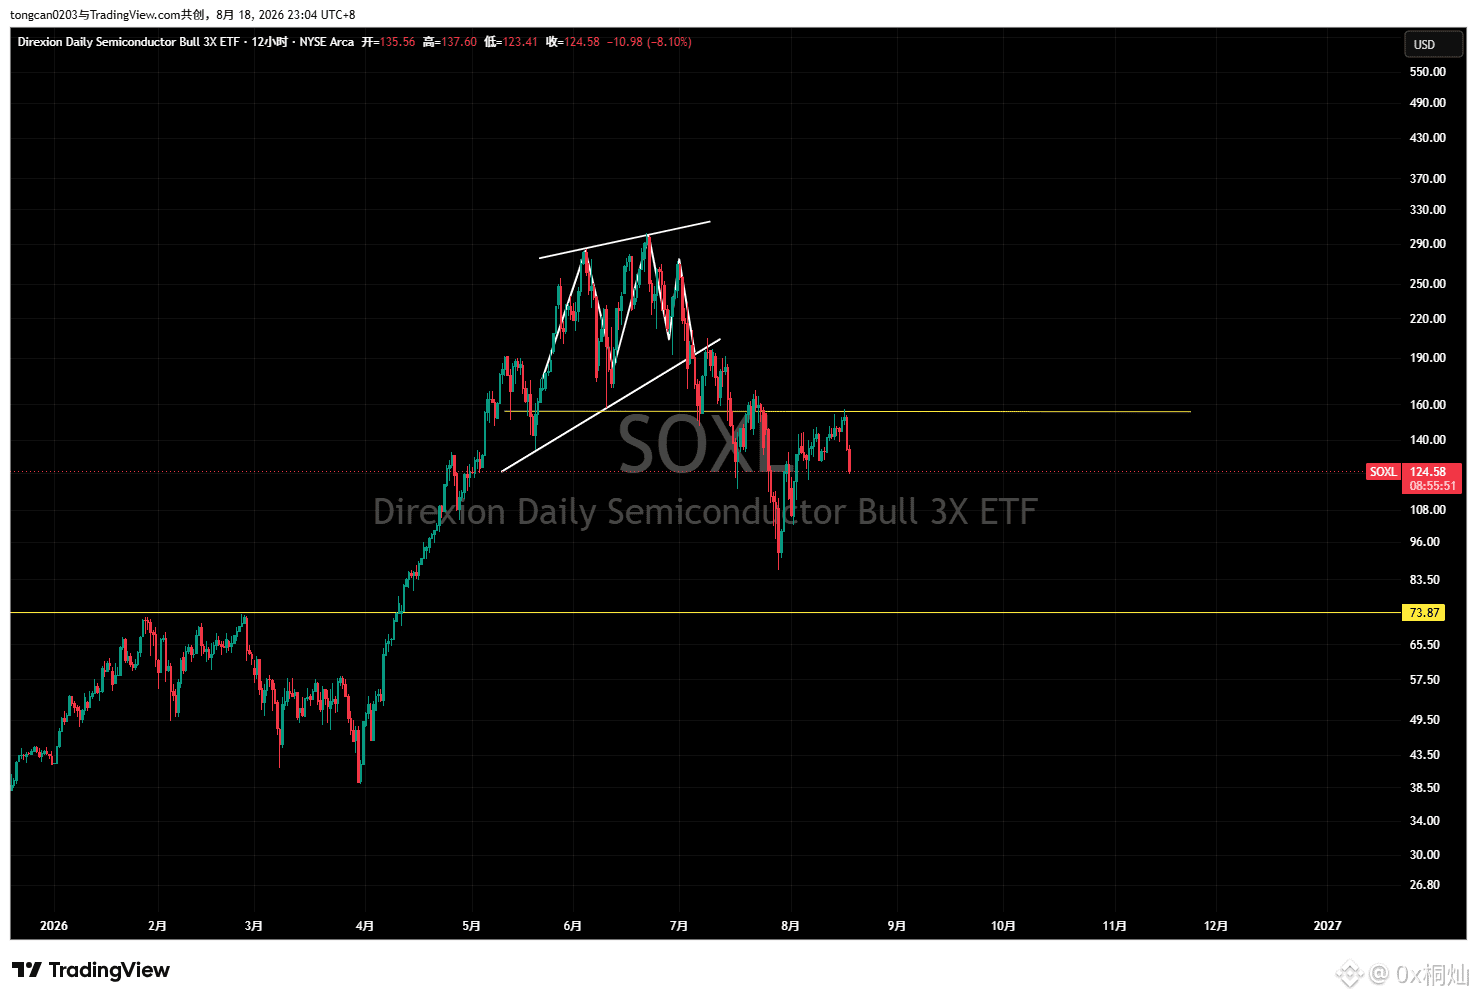
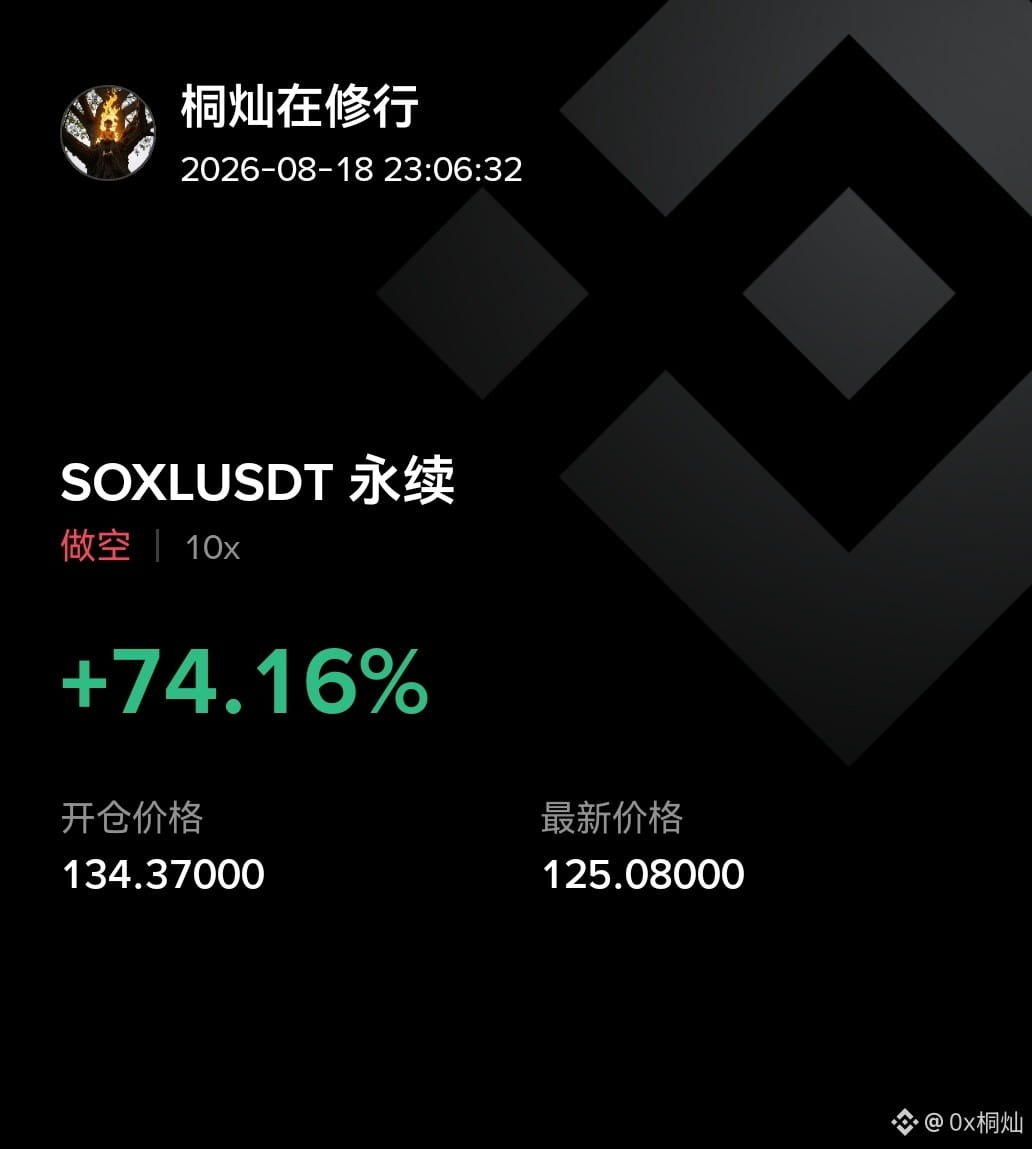
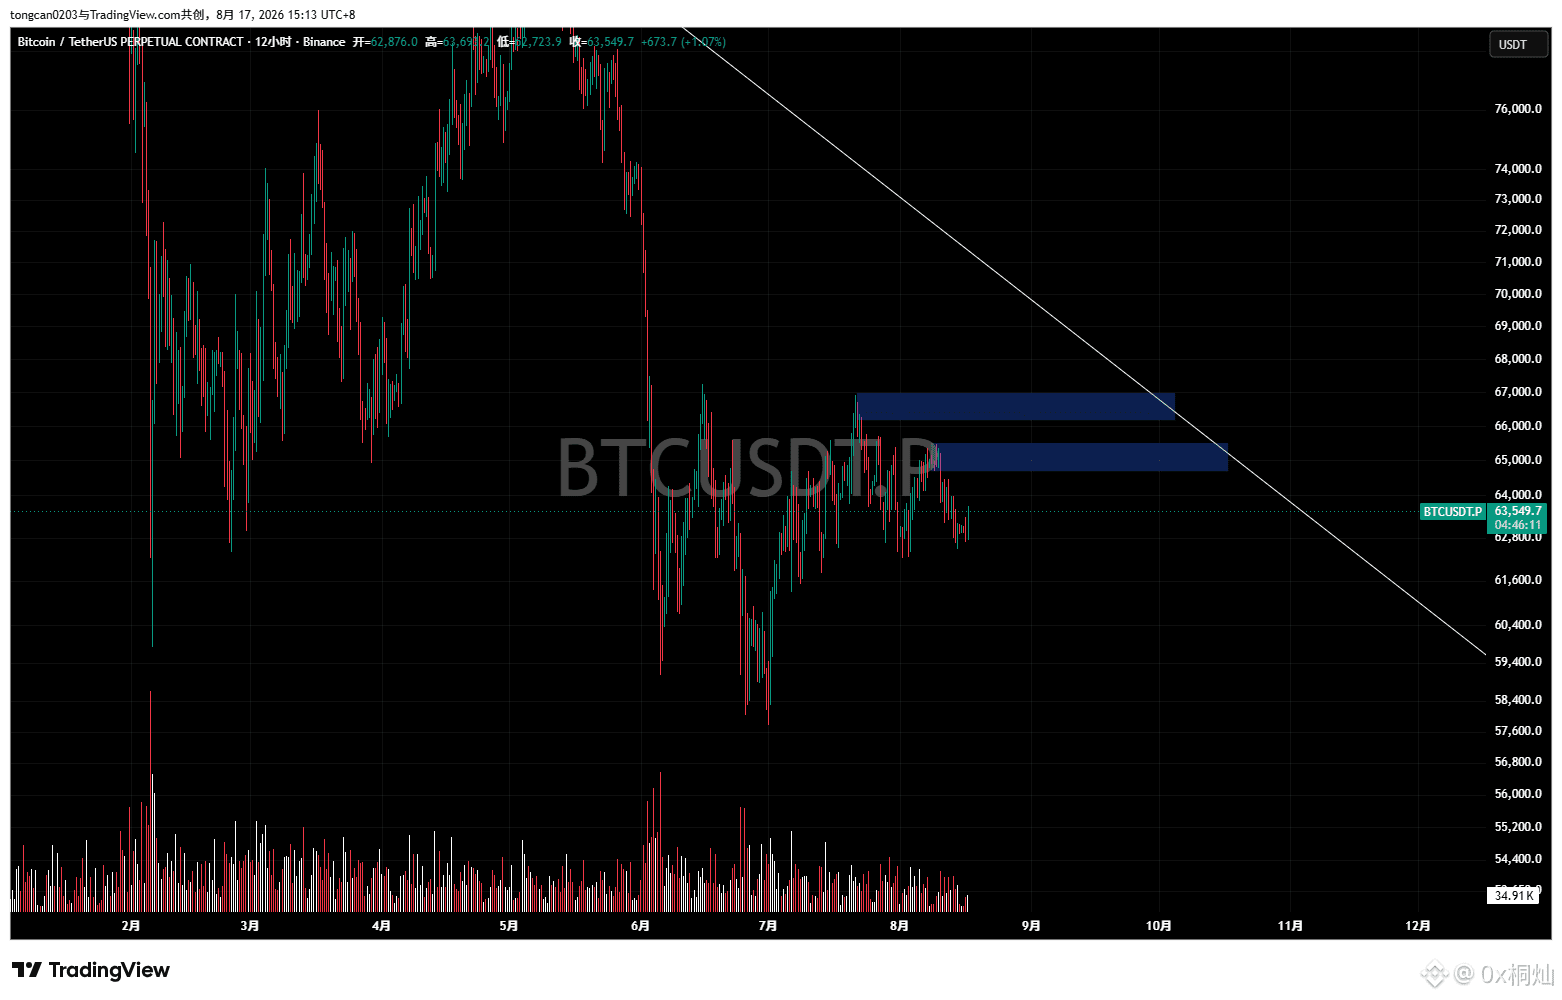
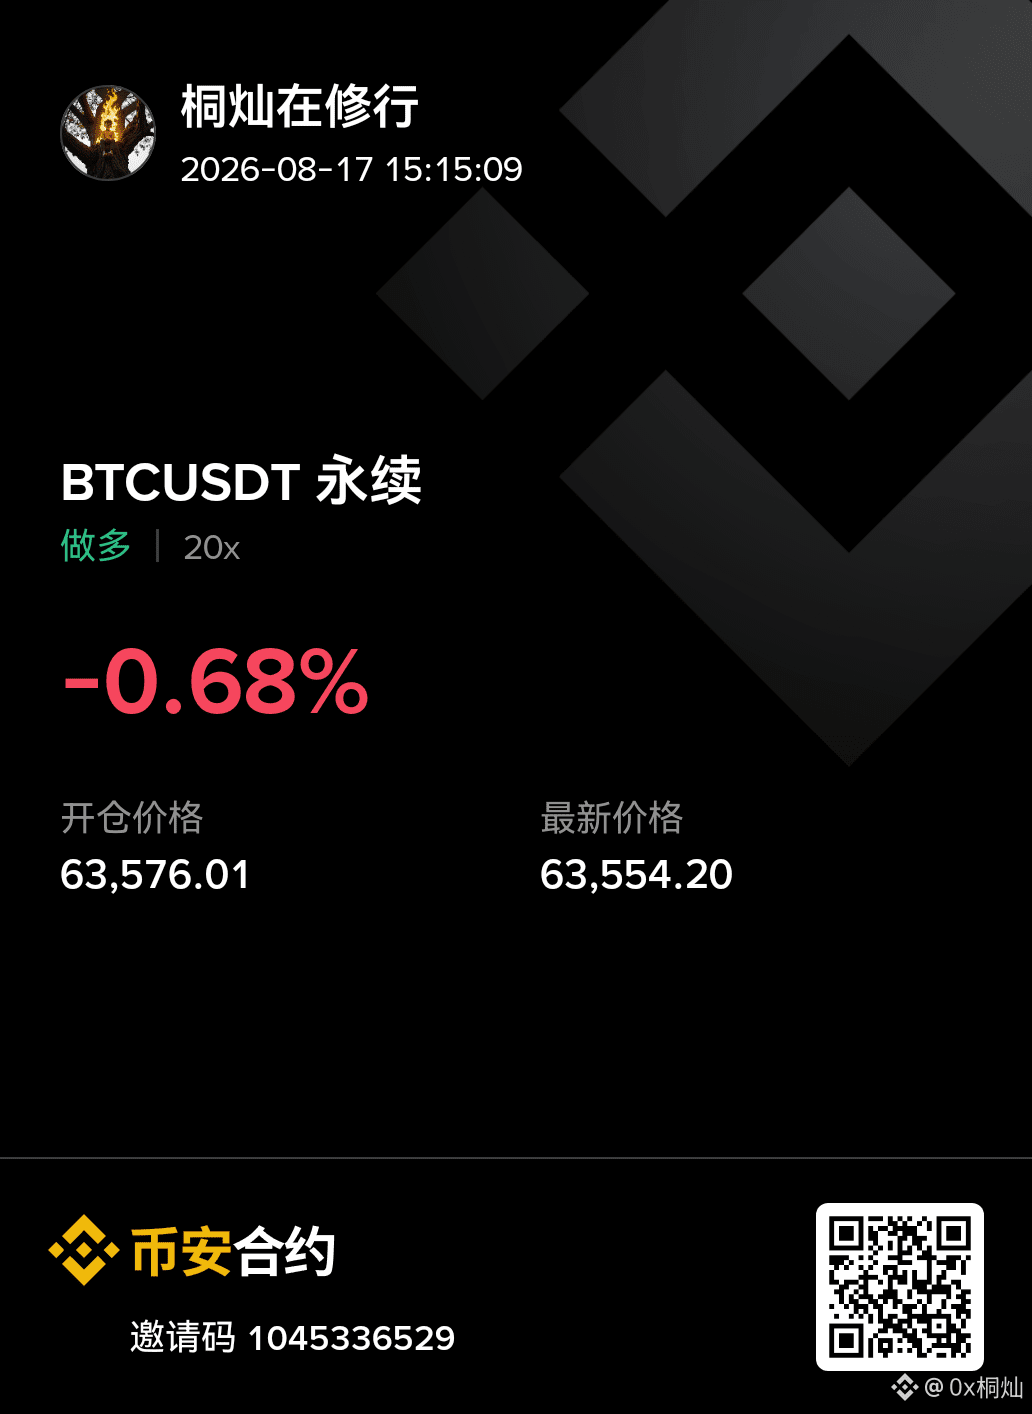
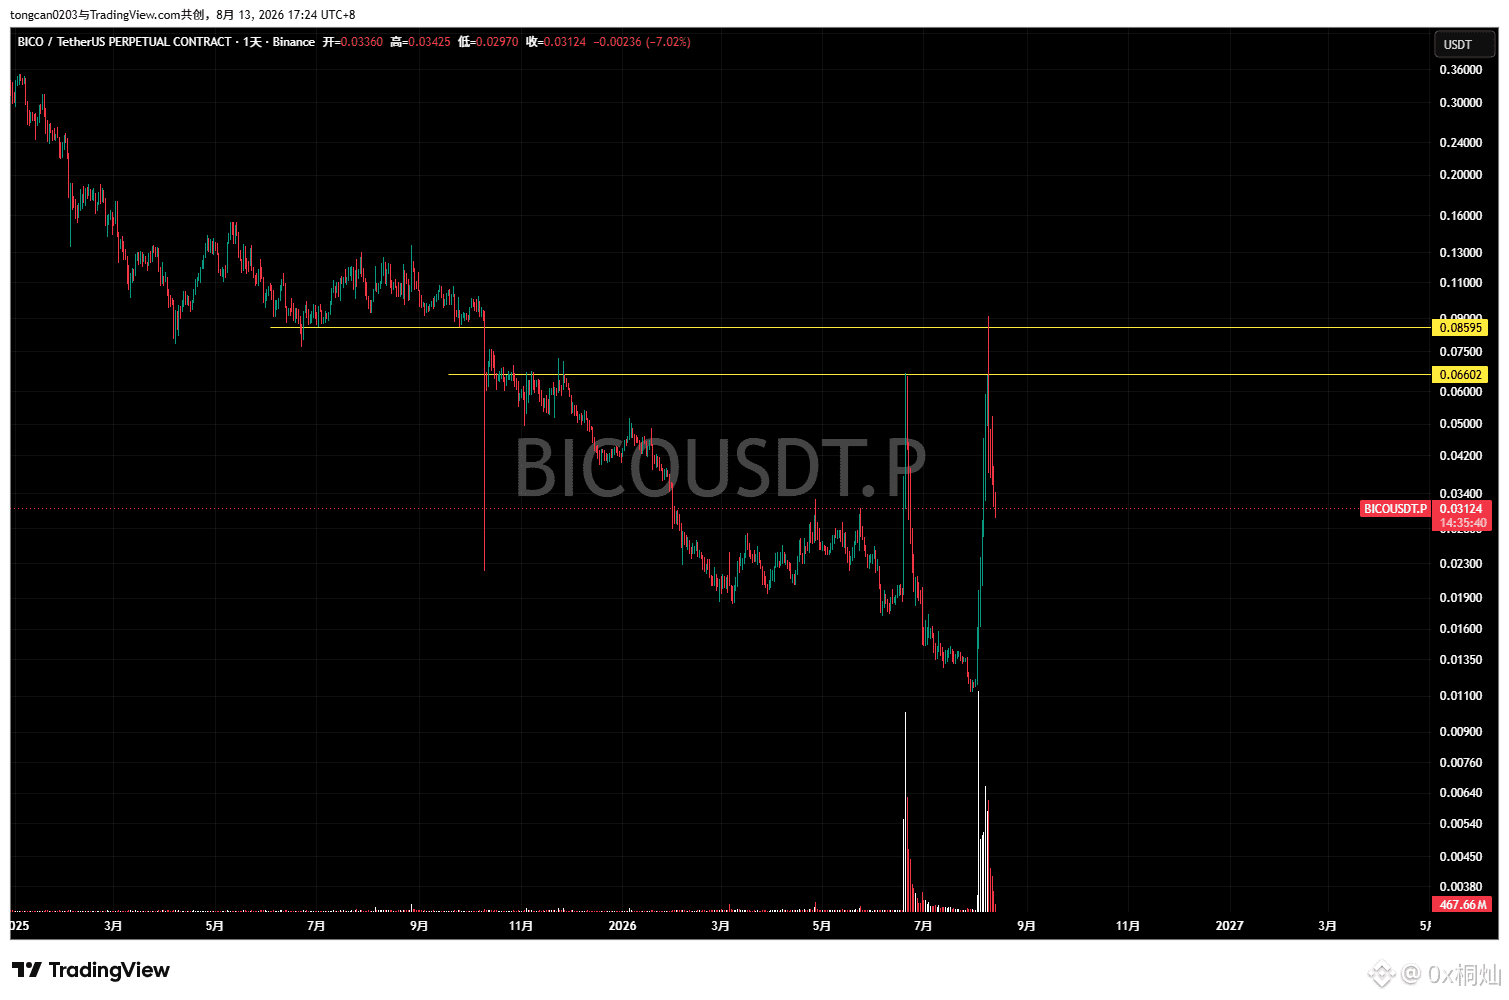
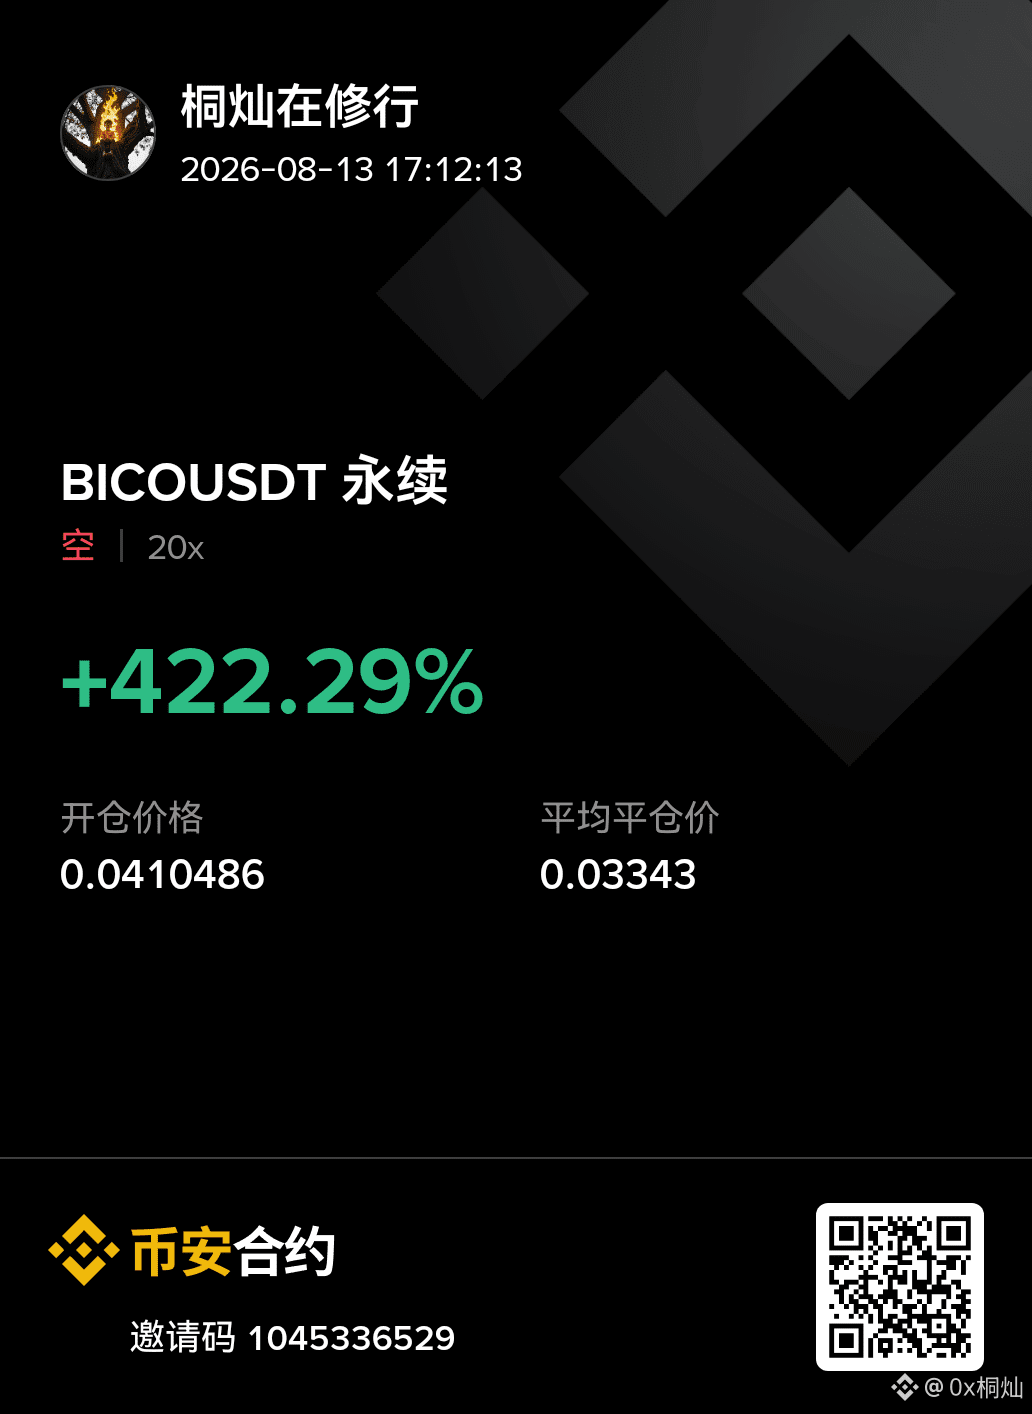
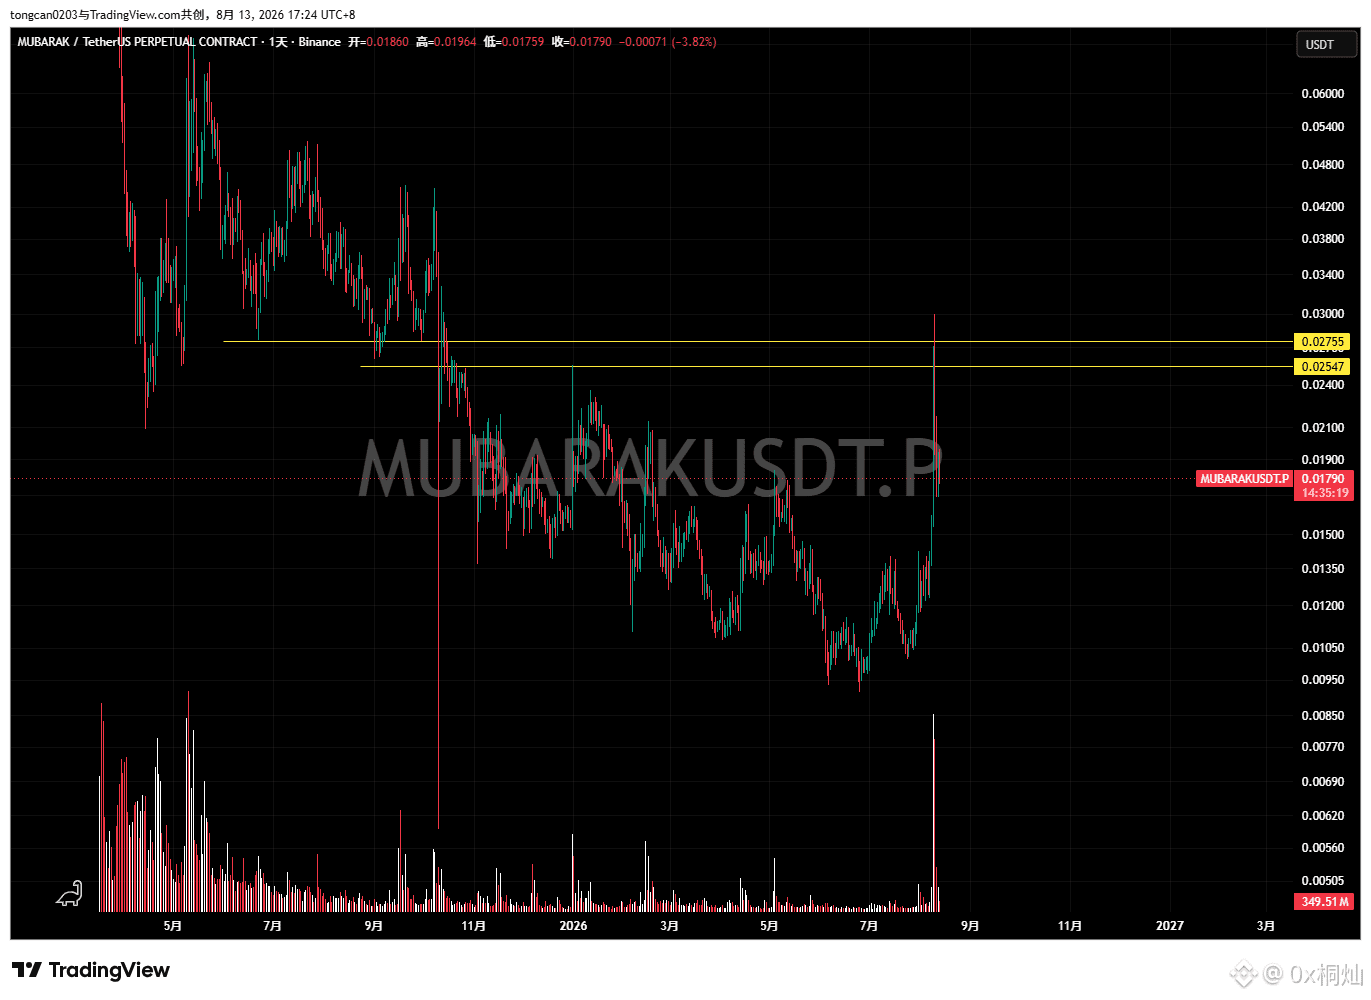
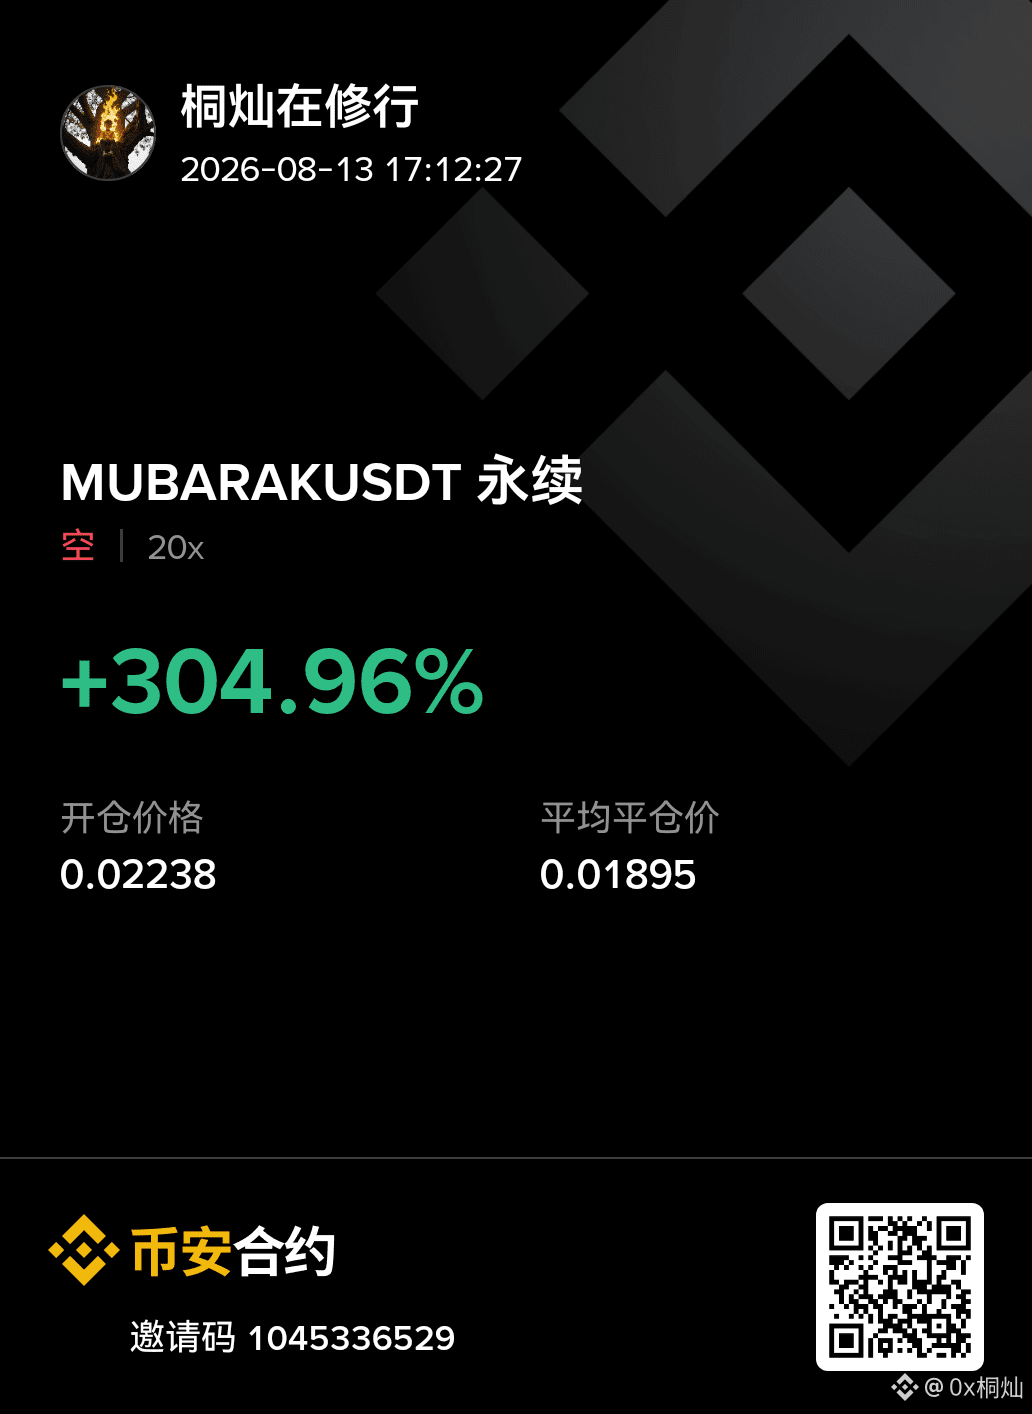
I love the Kongshan Zhai so much that even after hitting a daily-level pressure point and closing the position, just go look for a rebound entry on the smaller timeframes on the right side to go short…… $BICO $MUBARAK
More than half a year, 24x. I didn’t do well—full of ups and downs—and I also experienced a major drawdown. At the beginning of the year, I thought I had “enlightened myself.” Looking back now, I realize that at that time, my “enlightenment” was technically only half-understood, and my mindset was even farther away by a long, long way. But thankfully, I’m still continuing…
I have some dreams about trading. I don’t know whether I can truly realize them in the end or what I’ll leave behind… but I’m also seriously putting my trading system into practice.
What succeeds is made in secret; what is spoken can lead to failure. When it’s 500x or more, it may be made public. If it hasn’t been made public, then it’s zeroed out…
I have some dreams about trading. I don’t know whether I can truly realize them in the end or what I’ll leave behind… but I’m also seriously putting my trading system into practice.
What succeeds is made in secret; what is spoken can lead to failure. When it’s 500x or more, it may be made public. If it hasn’t been made public, then it’s zeroed out…

Log in to explore more content