

Fx楠
28 Posts

Fx楠
Report
Block User
先赚够三千万再收手
20 Following
1.0K+ Followers
178 Liked
Posts
All
Quotes
·
--
Bullish
$SNDK continued holding, waiting for a breakthrough
$SNDK continued holding, waiting for a breakthrough
6
22
369
·
--
Bullish
Can SanDisk reach 1500 with this round? $SNDK
Can SanDisk reach 1500 with this round? $SNDK
6
17
1.3k
·
--
Don’t be lulled by the “only -2%”: what the contract truly bears is the intraday path
First, the conclusion: in this afternoon’s market setup, contract risk doesn’t come only from “how much it fell,” but also from how far the price travels within a single day. BTC and ETH’s 24-hour declines are both around 2%, yet the intraday high-low spread is clearly larger. If you decide position size based only on the rise/fall percentage, it’s easy to underestimate how intraday volatility pressures margin.
Look at the range, not just the endpoint
As of this afternoon: BTC is at 63,439.99 USDT, down 1.96% over 24 hours, with a high of 65,090 and a low of 62,742.47. Using the high and low points, the intraday amplitude is about 3.74%, close to roughly twice the 24-hour decline. ETH is at 1,890.87 USDT, down 2.18%, with high/low of 1,955.41 and 1,856.88—its amplitude is about 5.31%, and the range expansion is more pronounced than BTC’s.
This means that even when you see an “about -2%” move, the price path experienced by BTC and ETH positions is not the same. What the derivatives account must withstand is the entire price process, not the single percentage shown at the end of a market page. Even if your final directional judgment is close, you may still be unable to endure mid-course fluctuations due to an oversized position or insufficient margin buffer.
Trading volume provides another layer of evidence
BTC’s 24-hour turnover is about 906 million USDT, ETH about 561 million USDT, and BNB about 44.43 million USDT. In the same period, BNB rose 0.16%, with intraday high/low of 576.11 and 562.03—an amplitude of about 2.51%. The three assets didn’t move in sync: BTC and ETH pulled back while BNB stayed near flat. ETH’s decline was only slightly larger than BTC’s, yet its amplitude was much bigger. Simply applying the “overall market direction” to every contract will miss the volatility differences between assets.
There’s also another interpretation: 24-hour data is just a rolling window. It can’t, by itself, prove that a trend has already formed, nor can it guarantee that the next segment of price action will continue in the same direction. The high/low points also don’t tell us the sequence of when volatility occurred, so these data are better for identifying risk—not for serving as direct directional instructions.
What’s truly worth taking away: when assessing a contract position, at minimum look at (1) both the rise/fall percentage, (2) the high-low range, and (3) the divergence across different assets. Don’t let a seemingly mild closing-style number hide the intraday path. Contracts and leveraged trading can amplify losses. Past ranges don’t represent future volatility boundaries. Before participating, control position size and margin risk according to your own ability to withstand drawdowns.
Reference data:
- https://data-api.binance.vision/api/v3/ticker/24hr?symbols=%5B%22BTCUSDT%22%2C%22ETHUSDT%22%2C%22BNBUSDT%22%5D
$BTC $ETH $BNB #合约风险 #风险管理 #加密市场
Don’t be lulled by the “only -2%”: what the contract truly bears is the intraday path
First, the conclusion: in this afternoon’s market setup, contract risk doesn’t come only from “how much it fell,” but also from how far the price travels within a single day. BTC and ETH’s 24-hour declines are both around 2%, yet the intraday high-low spread is clearly larger. If you decide position size based only on the rise/fall percentage, it’s easy to underestimate how intraday volatility pressures margin.
Look at the range, not just the endpoint
As of this afternoon: BTC is at 63,439.99 USDT, down 1.96% over 24 hours, with a high of 65,090 and a low of 62,742.47. Using the high and low points, the intraday amplitude is about 3.74%, close to roughly twice the 24-hour decline. ETH is at 1,890.87 USDT, down 2.18%, with high/low of 1,955.41 and 1,856.88—its amplitude is about 5.31%, and the range expansion is more pronounced than BTC’s.
This means that even when you see an “about -2%” move, the price path experienced by BTC and ETH positions is not the same. What the derivatives account must withstand is the entire price process, not the single percentage shown at the end of a market page. Even if your final directional judgment is close, you may still be unable to endure mid-course fluctuations due to an oversized position or insufficient margin buffer.
Trading volume provides another layer of evidence
BTC’s 24-hour turnover is about 906 million USDT, ETH about 561 million USDT, and BNB about 44.43 million USDT. In the same period, BNB rose 0.16%, with intraday high/low of 576.11 and 562.03—an amplitude of about 2.51%. The three assets didn’t move in sync: BTC and ETH pulled back while BNB stayed near flat. ETH’s decline was only slightly larger than BTC’s, yet its amplitude was much bigger. Simply applying the “overall market direction” to every contract will miss the volatility differences between assets.
There’s also another interpretation: 24-hour data is just a rolling window. It can’t, by itself, prove that a trend has already formed, nor can it guarantee that the next segment of price action will continue in the same direction. The high/low points also don’t tell us the sequence of when volatility occurred, so these data are better for identifying risk—not for serving as direct directional instructions.
What’s truly worth taking away: when assessing a contract position, at minimum look at (1) both the rise/fall percentage, (2) the high-low range, and (3) the divergence across different assets. Don’t let a seemingly mild closing-style number hide the intraday path. Contracts and leveraged trading can amplify losses. Past ranges don’t represent future volatility boundaries. Before participating, control position size and margin risk according to your own ability to withstand drawdowns.
Reference data:
- https://data-api.binance.vision/api/v3/ticker/24hr?symbols=%5B%22BTCUSDT%22%2C%22ETHUSDT%22%2C%22BNBUSDT%22%5D
$BTC $ETH $BNB #合约风险 #风险管理 #加密市场
First, the conclusion: in this afternoon’s market setup, contract risk doesn’t come only from “how much it fell,” but also from how far the price travels within a single day. BTC and ETH’s 24-hour declines are both around 2%, yet the intraday high-low spread is clearly larger. If you decide position size based only on the rise/fall percentage, it’s easy to underestimate how intraday volatility pressures margin.
Look at the range, not just the endpoint
As of this afternoon: BTC is at 63,439.99 USDT, down 1.96% over 24 hours, with a high of 65,090 and a low of 62,742.47. Using the high and low points, the intraday amplitude is about 3.74%, close to roughly twice the 24-hour decline. ETH is at 1,890.87 USDT, down 2.18%, with high/low of 1,955.41 and 1,856.88—its amplitude is about 5.31%, and the range expansion is more pronounced than BTC’s.
This means that even when you see an “about -2%” move, the price path experienced by BTC and ETH positions is not the same. What the derivatives account must withstand is the entire price process, not the single percentage shown at the end of a market page. Even if your final directional judgment is close, you may still be unable to endure mid-course fluctuations due to an oversized position or insufficient margin buffer.
Trading volume provides another layer of evidence
BTC’s 24-hour turnover is about 906 million USDT, ETH about 561 million USDT, and BNB about 44.43 million USDT. In the same period, BNB rose 0.16%, with intraday high/low of 576.11 and 562.03—an amplitude of about 2.51%. The three assets didn’t move in sync: BTC and ETH pulled back while BNB stayed near flat. ETH’s decline was only slightly larger than BTC’s, yet its amplitude was much bigger. Simply applying the “overall market direction” to every contract will miss the volatility differences between assets.
There’s also another interpretation: 24-hour data is just a rolling window. It can’t, by itself, prove that a trend has already formed, nor can it guarantee that the next segment of price action will continue in the same direction. The high/low points also don’t tell us the sequence of when volatility occurred, so these data are better for identifying risk—not for serving as direct directional instructions.
What’s truly worth taking away: when assessing a contract position, at minimum look at (1) both the rise/fall percentage, (2) the high-low range, and (3) the divergence across different assets. Don’t let a seemingly mild closing-style number hide the intraday path. Contracts and leveraged trading can amplify losses. Past ranges don’t represent future volatility boundaries. Before participating, control position size and margin risk according to your own ability to withstand drawdowns.
Reference data:
- https://data-api.binance.vision/api/v3/ticker/24hr?symbols=%5B%22BTCUSDT%22%2C%22ETHUSDT%22%2C%22BNBUSDT%22%5D
$BTC $ETH $BNB #合约风险 #风险管理 #加密市场
1
21
191
·
--
Aqua Login to the BNB Chain: How One Wallet Balance Can Support Multiple Liquidity Positions
With the same wallet balance, the past usually required splitting funds into different pools to serve multiple liquidity positions. Aqua, newly launched by 1inch, aims to let the same capital support multiple positions at the same time, while the assets still remain in the user’s own wallet. This product has already covered 13 EVM-compatible chains, including the BNB Chain.
The key point isn’t “yet another liquidity pool,” but how liquidity is called has changed. According to public information, users do not need to deposit tokens into a pool in advance; instead, they authorize by token and by chain. When the preset conditions are met, Aqua calls the assets from the wallet via a registry, and the returns are then sent back to their original place. The authorization can also be revoked. The trades are executed by on-chain-verified market makers or arbitrage bots. For liquidity providers that manage multiple strategies simultaneously, the same balance doesn’t have to be mechanically divided into many parts, giving idle capital a chance to be reduced.
This also explains its significance for the BNB Chain ecosystem: competition for on-chain liquidity isn’t only about total capital; it’s also about whether one unit of capital can support more quote and trading scenarios. If the shared-balance model gains adoption, how market-maker capital is used may change, and what protocols compete for may shift from “how much they deposit” to “who can more efficiently and safely call those authorizations.”
The lesson from this case is that self-custody doesn’t mean there is no risk. Keeping assets in the wallet only removes the need for pre-funded liquidity pools; authorization scope, registry logic, smart-contract vulnerabilities, strategy conditions, and executor behavior can still cause losses. The number of cross-chain deployments also cannot substitute for real execution quality, liquidity depth, and a long-term record of security.
A straightforward way to assess whether it can be migrated to other DeFi products: first confirm who actually holds the funds; then verify whether the call permissions can be finely scoped and revoked; finally, observe whether capital efficiency comes from real execution rather than counting the same balance multiple times. Today at noon, BNB is quoted at 567.32 USDT, down 0.84% over the past 24 hours. Short-term price fluctuations cannot prove that the Aqua model has already succeeded. Before participating in on-chain liquidity, independently verify the contracts, authorization, and exit conditions—and only commit funds you can afford to lose.
Reference data:
- https://www.coindesk.com/web3/2026/07/27/1inch-opens-aqua-liquidity-protocol-across-13-chains
- https://www.panewslab.com/zh/articles/019fa87d-9b7a-713c-b038-4ebb37f581c7
$BNB #BNBChain #DeFi #流动性 #Self-custody
Aqua Login to the BNB Chain: How One Wallet Balance Can Support Multiple Liquidity Positions
With the same wallet balance, the past usually required splitting funds into different pools to serve multiple liquidity positions. Aqua, newly launched by 1inch, aims to let the same capital support multiple positions at the same time, while the assets still remain in the user’s own wallet. This product has already covered 13 EVM-compatible chains, including the BNB Chain.
The key point isn’t “yet another liquidity pool,” but how liquidity is called has changed. According to public information, users do not need to deposit tokens into a pool in advance; instead, they authorize by token and by chain. When the preset conditions are met, Aqua calls the assets from the wallet via a registry, and the returns are then sent back to their original place. The authorization can also be revoked. The trades are executed by on-chain-verified market makers or arbitrage bots. For liquidity providers that manage multiple strategies simultaneously, the same balance doesn’t have to be mechanically divided into many parts, giving idle capital a chance to be reduced.
This also explains its significance for the BNB Chain ecosystem: competition for on-chain liquidity isn’t only about total capital; it’s also about whether one unit of capital can support more quote and trading scenarios. If the shared-balance model gains adoption, how market-maker capital is used may change, and what protocols compete for may shift from “how much they deposit” to “who can more efficiently and safely call those authorizations.”
The lesson from this case is that self-custody doesn’t mean there is no risk. Keeping assets in the wallet only removes the need for pre-funded liquidity pools; authorization scope, registry logic, smart-contract vulnerabilities, strategy conditions, and executor behavior can still cause losses. The number of cross-chain deployments also cannot substitute for real execution quality, liquidity depth, and a long-term record of security.
A straightforward way to assess whether it can be migrated to other DeFi products: first confirm who actually holds the funds; then verify whether the call permissions can be finely scoped and revoked; finally, observe whether capital efficiency comes from real execution rather than counting the same balance multiple times. Today at noon, BNB is quoted at 567.32 USDT, down 0.84% over the past 24 hours. Short-term price fluctuations cannot prove that the Aqua model has already succeeded. Before participating in on-chain liquidity, independently verify the contracts, authorization, and exit conditions—and only commit funds you can afford to lose.
Reference data:
- https://www.coindesk.com/web3/2026/07/27/1inch-opens-aqua-liquidity-protocol-across-13-chains
- https://www.panewslab.com/zh/articles/019fa87d-9b7a-713c-b038-4ebb37f581c7
$BNB #BNBChain #DeFi #流动性 #Self-custody
With the same wallet balance, the past usually required splitting funds into different pools to serve multiple liquidity positions. Aqua, newly launched by 1inch, aims to let the same capital support multiple positions at the same time, while the assets still remain in the user’s own wallet. This product has already covered 13 EVM-compatible chains, including the BNB Chain.
The key point isn’t “yet another liquidity pool,” but how liquidity is called has changed. According to public information, users do not need to deposit tokens into a pool in advance; instead, they authorize by token and by chain. When the preset conditions are met, Aqua calls the assets from the wallet via a registry, and the returns are then sent back to their original place. The authorization can also be revoked. The trades are executed by on-chain-verified market makers or arbitrage bots. For liquidity providers that manage multiple strategies simultaneously, the same balance doesn’t have to be mechanically divided into many parts, giving idle capital a chance to be reduced.
This also explains its significance for the BNB Chain ecosystem: competition for on-chain liquidity isn’t only about total capital; it’s also about whether one unit of capital can support more quote and trading scenarios. If the shared-balance model gains adoption, how market-maker capital is used may change, and what protocols compete for may shift from “how much they deposit” to “who can more efficiently and safely call those authorizations.”
The lesson from this case is that self-custody doesn’t mean there is no risk. Keeping assets in the wallet only removes the need for pre-funded liquidity pools; authorization scope, registry logic, smart-contract vulnerabilities, strategy conditions, and executor behavior can still cause losses. The number of cross-chain deployments also cannot substitute for real execution quality, liquidity depth, and a long-term record of security.
A straightforward way to assess whether it can be migrated to other DeFi products: first confirm who actually holds the funds; then verify whether the call permissions can be finely scoped and revoked; finally, observe whether capital efficiency comes from real execution rather than counting the same balance multiple times. Today at noon, BNB is quoted at 567.32 USDT, down 0.84% over the past 24 hours. Short-term price fluctuations cannot prove that the Aqua model has already succeeded. Before participating in on-chain liquidity, independently verify the contracts, authorization, and exit conditions—and only commit funds you can afford to lose.
Reference data:
- https://www.coindesk.com/web3/2026/07/27/1inch-opens-aqua-liquidity-protocol-across-13-chains
- https://www.panewslab.com/zh/articles/019fa87d-9b7a-713c-b038-4ebb37f581c7
$BNB #BNBChain #DeFi #流动性 #Self-custody
14
74
·
--
When the market drops, check these 4 items before placing an order
When the market drops quickly, beginners are most likely to mistake “it has already fallen a lot” for “the risk has already been released.” This checklist is for a quick verification before placing an order, so you don’t focus only on price changes.
1. First, look at the trading range: At midday today, BTC was 63,392.88 USDT, down 2.85% over the past 24 hours, and it’s already close to the intraday low of 63,059.39. ETH and BNB also fell 4.49% and 1.16%, respectively. Their simultaneous weakness indicates you need to assess overall market pressure first, not just study a single coin.
2. Write down the invalidation conditions: Before entering, record “at what price the conclusion no longer holds,” and use that to limit the loss you can tolerate. Without clear invalidation conditions, you can’t reasonably plan your position size.
3. Verify the execution basis: Don’t look only at the up/down percentage; also compare the 24-hour high/low and trading volume (turnover). Being near the intraday low doesn’t guarantee a rebound—it could also keep making new lows.
4. Check the source of the contract price: If you’re trading a perpetual contract, first confirm the mark price, the oracle, and the market operator. Hyperliquid’s event notes about the SKHYNIX contract show that the deployer of the HIP-3 market can push part of the price inputs; the specific rules will affect the final mark price.
The most common mistake is to place the order first and then look for reasons afterward. If writing down the four items above still can’t define your risk boundary, don’t make a decision yet. Crypto assets and derivatives can be highly volatile, and contracts also involve leverage, liquidation, and price-source risks—please participate only if you understand the rules and can bear the loss.
Reference data:
- https://data-api.binance.vision/api/v3/ticker/24hr?symbols=%5B%22BTCUSDT%22%2C%22ETHUSDT%22%2C%22BNBUSDT%22%5D
- https://www.panewslab.com/zh/articles/019fa7db-2647-76d8-933c-286a5e131f55
$BTC $ETH $BNB #新手科普 #风险管理 #加密市场
When the market drops, check these 4 items before placing an order
When the market drops quickly, beginners are most likely to mistake “it has already fallen a lot” for “the risk has already been released.” This checklist is for a quick verification before placing an order, so you don’t focus only on price changes.
1. First, look at the trading range: At midday today, BTC was 63,392.88 USDT, down 2.85% over the past 24 hours, and it’s already close to the intraday low of 63,059.39. ETH and BNB also fell 4.49% and 1.16%, respectively. Their simultaneous weakness indicates you need to assess overall market pressure first, not just study a single coin.
2. Write down the invalidation conditions: Before entering, record “at what price the conclusion no longer holds,” and use that to limit the loss you can tolerate. Without clear invalidation conditions, you can’t reasonably plan your position size.
3. Verify the execution basis: Don’t look only at the up/down percentage; also compare the 24-hour high/low and trading volume (turnover). Being near the intraday low doesn’t guarantee a rebound—it could also keep making new lows.
4. Check the source of the contract price: If you’re trading a perpetual contract, first confirm the mark price, the oracle, and the market operator. Hyperliquid’s event notes about the SKHYNIX contract show that the deployer of the HIP-3 market can push part of the price inputs; the specific rules will affect the final mark price.
The most common mistake is to place the order first and then look for reasons afterward. If writing down the four items above still can’t define your risk boundary, don’t make a decision yet. Crypto assets and derivatives can be highly volatile, and contracts also involve leverage, liquidation, and price-source risks—please participate only if you understand the rules and can bear the loss.
Reference data:
- https://data-api.binance.vision/api/v3/ticker/24hr?symbols=%5B%22BTCUSDT%22%2C%22ETHUSDT%22%2C%22BNBUSDT%22%5D
- https://www.panewslab.com/zh/articles/019fa7db-2647-76d8-933c-286a5e131f55
$BTC $ETH $BNB #新手科普 #风险管理 #加密市场
When the market drops quickly, beginners are most likely to mistake “it has already fallen a lot” for “the risk has already been released.” This checklist is for a quick verification before placing an order, so you don’t focus only on price changes.
1. First, look at the trading range: At midday today, BTC was 63,392.88 USDT, down 2.85% over the past 24 hours, and it’s already close to the intraday low of 63,059.39. ETH and BNB also fell 4.49% and 1.16%, respectively. Their simultaneous weakness indicates you need to assess overall market pressure first, not just study a single coin.
2. Write down the invalidation conditions: Before entering, record “at what price the conclusion no longer holds,” and use that to limit the loss you can tolerate. Without clear invalidation conditions, you can’t reasonably plan your position size.
3. Verify the execution basis: Don’t look only at the up/down percentage; also compare the 24-hour high/low and trading volume (turnover). Being near the intraday low doesn’t guarantee a rebound—it could also keep making new lows.
4. Check the source of the contract price: If you’re trading a perpetual contract, first confirm the mark price, the oracle, and the market operator. Hyperliquid’s event notes about the SKHYNIX contract show that the deployer of the HIP-3 market can push part of the price inputs; the specific rules will affect the final mark price.
The most common mistake is to place the order first and then look for reasons afterward. If writing down the four items above still can’t define your risk boundary, don’t make a decision yet. Crypto assets and derivatives can be highly volatile, and contracts also involve leverage, liquidation, and price-source risks—please participate only if you understand the rules and can bear the loss.
Reference data:
- https://data-api.binance.vision/api/v3/ticker/24hr?symbols=%5B%22BTCUSDT%22%2C%22ETHUSDT%22%2C%22BNBUSDT%22%5D
- https://www.panewslab.com/zh/articles/019fa7db-2647-76d8-933c-286a5e131f55
$BTC $ETH $BNB #新手科普 #风险管理 #加密市场
11
192
·
--
ETH/BTC drops to around 0.0297—who will feel the pressure first?
Those holding ETH, using ETH as margin, or rotating between BTC and ETH should focus on relative strength today, not just how much each of the two has fallen.
As of around 15:30 today, BTC was at $63,559.77, down 2.76% over the past 24 hours; ETH was at $1,884.96, down 4.16%. Based on current prices, ETH/BTC is about 0.0297, with ETH underperforming BTC by roughly 1.4 percentage points on a daily basis. At the same time, BTC is closer to its 24-hour low ($63,059.39), and ETH is also near its low ($1,866.31). This suggests the current environment is still one of risk contraction, rather than a simple rotation between coins.
In market discussions, there’s already been the view of “shifting from being bearish on ETH to being bearish on BTC,” but that only reflects individual participants’ strategy changes and does not directly prove that ETH/BTC has bottomed. For participants in the ETH ecosystem, the practical implication is: if ETH/BTC can hold near 0.0297 while BTC continues to weaken, relative strength may begin to emerge; if ETH falls again faster and the ratio keeps dropping, capital preference likely remains on the BTC side.
Also pay attention to margin risk: using assets such as WBETH as collateral to hedge BTC would expose you simultaneously to the ETH/BTC exchange rate, the contract funding rate, and the platform and liquidation mechanisms. Short-term volatility means that “equal notional hedging” does not necessarily imply that risk has fully disappeared. The above is only for market observation and does not constitute investment advice.
Reference data:
- https://data-api.binance.vision/api/v3/ticker/24hr?symbols=%5B%22BTCUSDT%22%2C%22ETHUSDT%22%2C%22BNBUSDT%22%5D
- https://www.panewslab.com/zh/articles/019fa797-90d7-7225-a3cb-2f5f7ee06f6d
$BTC $ETH #ETHBTC #行情分析 #加密市场
ETH/BTC drops to around 0.0297—who will feel the pressure first?
Those holding ETH, using ETH as margin, or rotating between BTC and ETH should focus on relative strength today, not just how much each of the two has fallen.
As of around 15:30 today, BTC was at $63,559.77, down 2.76% over the past 24 hours; ETH was at $1,884.96, down 4.16%. Based on current prices, ETH/BTC is about 0.0297, with ETH underperforming BTC by roughly 1.4 percentage points on a daily basis. At the same time, BTC is closer to its 24-hour low ($63,059.39), and ETH is also near its low ($1,866.31). This suggests the current environment is still one of risk contraction, rather than a simple rotation between coins.
In market discussions, there’s already been the view of “shifting from being bearish on ETH to being bearish on BTC,” but that only reflects individual participants’ strategy changes and does not directly prove that ETH/BTC has bottomed. For participants in the ETH ecosystem, the practical implication is: if ETH/BTC can hold near 0.0297 while BTC continues to weaken, relative strength may begin to emerge; if ETH falls again faster and the ratio keeps dropping, capital preference likely remains on the BTC side.
Also pay attention to margin risk: using assets such as WBETH as collateral to hedge BTC would expose you simultaneously to the ETH/BTC exchange rate, the contract funding rate, and the platform and liquidation mechanisms. Short-term volatility means that “equal notional hedging” does not necessarily imply that risk has fully disappeared. The above is only for market observation and does not constitute investment advice.
Reference data:
- https://data-api.binance.vision/api/v3/ticker/24hr?symbols=%5B%22BTCUSDT%22%2C%22ETHUSDT%22%2C%22BNBUSDT%22%5D
- https://www.panewslab.com/zh/articles/019fa797-90d7-7225-a3cb-2f5f7ee06f6d
$BTC $ETH #ETHBTC #行情分析 #加密市场
Those holding ETH, using ETH as margin, or rotating between BTC and ETH should focus on relative strength today, not just how much each of the two has fallen.
As of around 15:30 today, BTC was at $63,559.77, down 2.76% over the past 24 hours; ETH was at $1,884.96, down 4.16%. Based on current prices, ETH/BTC is about 0.0297, with ETH underperforming BTC by roughly 1.4 percentage points on a daily basis. At the same time, BTC is closer to its 24-hour low ($63,059.39), and ETH is also near its low ($1,866.31). This suggests the current environment is still one of risk contraction, rather than a simple rotation between coins.
In market discussions, there’s already been the view of “shifting from being bearish on ETH to being bearish on BTC,” but that only reflects individual participants’ strategy changes and does not directly prove that ETH/BTC has bottomed. For participants in the ETH ecosystem, the practical implication is: if ETH/BTC can hold near 0.0297 while BTC continues to weaken, relative strength may begin to emerge; if ETH falls again faster and the ratio keeps dropping, capital preference likely remains on the BTC side.
Also pay attention to margin risk: using assets such as WBETH as collateral to hedge BTC would expose you simultaneously to the ETH/BTC exchange rate, the contract funding rate, and the platform and liquidation mechanisms. Short-term volatility means that “equal notional hedging” does not necessarily imply that risk has fully disappeared. The above is only for market observation and does not constitute investment advice.
Reference data:
- https://data-api.binance.vision/api/v3/ticker/24hr?symbols=%5B%22BTCUSDT%22%2C%22ETHUSDT%22%2C%22BNBUSDT%22%5D
- https://www.panewslab.com/zh/articles/019fa797-90d7-7225-a3cb-2f5f7ee06f6d
$BTC $ETH #ETHBTC #行情分析 #加密市场
9
87
·
--
ETF net inflows—why couldn’t they hold ETH?
The most noteworthy point isn’t that the three major coins all fell together, but that the signals from capital and the price performance are beginning to diverge: as of this afternoon, ETH is down 3.88% over the past 24 hours, a larger drop than BTC’s 2.97% and BNB’s 1.54%; meanwhile, as of U.S. Eastern Time on July 27, Ethereum spot ETFs were still seeing net inflows of $9.23 million, including BlackRock’s ETHA with net inflows of $11.75 million.
This suggests that ETF capital hasn’t immediately translated into short-term price support, and that the current selling pressure isn’t only targeting a single asset. The boundary is also clear: neither one day’s ETF flows nor the 24-hour market action is enough to confirm a trend. Going forward, we still need to watch whether net inflows can continue and whether ETH can break away from its intraday lows. Digital asset volatility is high, and short-term data can quickly reverse—please assess risk independently.
Reference data:
- https://data-api.binance.vision/api/v3/ticker/24hr?symbols=%5B%22BTCUSDT%22%2C%22ETHUSDT%22%2C%22BNBUSDT%22%5D
- https://www.panewslab.com/zh/articles/019fa6e2-cb4d-72e8-a8ae-dd77f7825201
$BTC $ETH $BNB #市场热点 #以太坊ETF #加密市场
ETF net inflows—why couldn’t they hold ETH?
The most noteworthy point isn’t that the three major coins all fell together, but that the signals from capital and the price performance are beginning to diverge: as of this afternoon, ETH is down 3.88% over the past 24 hours, a larger drop than BTC’s 2.97% and BNB’s 1.54%; meanwhile, as of U.S. Eastern Time on July 27, Ethereum spot ETFs were still seeing net inflows of $9.23 million, including BlackRock’s ETHA with net inflows of $11.75 million.
This suggests that ETF capital hasn’t immediately translated into short-term price support, and that the current selling pressure isn’t only targeting a single asset. The boundary is also clear: neither one day’s ETF flows nor the 24-hour market action is enough to confirm a trend. Going forward, we still need to watch whether net inflows can continue and whether ETH can break away from its intraday lows. Digital asset volatility is high, and short-term data can quickly reverse—please assess risk independently.
Reference data:
- https://data-api.binance.vision/api/v3/ticker/24hr?symbols=%5B%22BTCUSDT%22%2C%22ETHUSDT%22%2C%22BNBUSDT%22%5D
- https://www.panewslab.com/zh/articles/019fa6e2-cb4d-72e8-a8ae-dd77f7825201
$BTC $ETH $BNB #市场热点 #以太坊ETF #加密市场
The most noteworthy point isn’t that the three major coins all fell together, but that the signals from capital and the price performance are beginning to diverge: as of this afternoon, ETH is down 3.88% over the past 24 hours, a larger drop than BTC’s 2.97% and BNB’s 1.54%; meanwhile, as of U.S. Eastern Time on July 27, Ethereum spot ETFs were still seeing net inflows of $9.23 million, including BlackRock’s ETHA with net inflows of $11.75 million.
This suggests that ETF capital hasn’t immediately translated into short-term price support, and that the current selling pressure isn’t only targeting a single asset. The boundary is also clear: neither one day’s ETF flows nor the 24-hour market action is enough to confirm a trend. Going forward, we still need to watch whether net inflows can continue and whether ETH can break away from its intraday lows. Digital asset volatility is high, and short-term data can quickly reverse—please assess risk independently.
Reference data:
- https://data-api.binance.vision/api/v3/ticker/24hr?symbols=%5B%22BTCUSDT%22%2C%22ETHUSDT%22%2C%22BNBUSDT%22%5D
- https://www.panewslab.com/zh/articles/019fa6e2-cb4d-72e8-a8ae-dd77f7825201
$BTC $ETH $BNB #市场热点 #以太坊ETF #加密市场
7
228
·
--
ETH outperforms BTC, but a trend reversal still lacks one piece of evidence
Conclusion first: In today’s data set, ETH is clearly stronger than BTC relative to BTC, but it looks more like relative strength over a 24-hour window, not enough to prove that the ETH/BTC pair has already completed a trend reversal.
【Price layer: the strength-vs-weakness gap has appeared】
Around 23:00 Beijing time today, ETH was at 1934.91 USDT, up 1.90% over 24 hours; BTC was at 64749.45 USDT, only up 0.05% over the same period. Based on the latest prices, ETH/BTC is about 0.02988. Looking only at the % changes, ETH is ahead of BTC by roughly 1.85 percentage points, suggesting that incremental capital or risk appetite leaned more toward ETH that day.
Intraday paths also offer clues. ETH rebounded from 1898.06 to 1934.91, still about 2.3% away from the high of 1981.24. Meanwhile BTC bounced from 64459.82 and then was about 1.5% away from the high of 65744.60. In other words, ETH has higher elasticity, but overhead selling pressure is also more pronounced. Strength doesn’t mean there’s no resistance.
【Trading layer: there is activity, but it can’t directly be equated with net inflows】
ETHUSDT’s 24-hour trading value is about 628 million USDT, while BTCUSDT is about 921 million USDT. ETH’s trading value is roughly 68% of BTC’s; together with the higher rise, this suggests the relative performance did not occur under extremely low activity. However, trading value records trade size only—it does not distinguish between aggressive buy orders and aggressive sell orders, and it cannot, by itself, prove that capital is consistently flowing into ETH.
【Event layer: fundamental information and short-term market action may overlap】
Tonight, CoinDesk reported that Lido is integrating about 8 million staked ETH tokens and plans to reduce the number of validators by roughly one-third, while also, for the first time, requiring professional node operators to provide collateral. This is an important adjustment involving staking infrastructure, but the existing information cannot prove it is the direct cause of ETH’s rise. Another explanation is that risk assets are broadly recovering: Cointelegraph mentioned in parallel that rising US stocks and expectations of eased geopolitical tensions pushed BTC to try to move closer to $66,000. If overall market risk appetite rebounds, ETH typically may exhibit higher elasticity.
Next, what’s truly worth monitoring isn’t whether ETH is rising faster on a single day, but whether ETH/BTC can continue to hold around 0.02988 and expand upward, and whether ETH can again approach and break above 1981.24. If the ratio quickly falls back, or if ETH loses 1898.06 while BTC remains stable, then this relative strength is more likely just a short-term rotation.
The above is based only on a single 24-hour snapshot and publicly available information, and does not constitute investment advice. Crypto assets are highly volatile, and short-term relative strength/weakness can reverse quickly. Before making decisions, you should consider longer-term cycles, liquidity, and your own risk tolerance.
Reference data:
- https://data-api.binance.vision/api/v3/ticker/24hr?symbols=%5B%22BTCUSDT%22%2C%22ETHUSDT%22%2C%22BNBUSDT%22%5D
- https://www.coindesk.com/tech/2026/07/27/lido-begins-moving-usd16-5-billion-in-staked-ether-to-cut-validator-count-by-a-third
$BTC $ETH #ETHBTC #以太坊 #比特币 #行情分析
ETH outperforms BTC, but a trend reversal still lacks one piece of evidence
Conclusion first: In today’s data set, ETH is clearly stronger than BTC relative to BTC, but it looks more like relative strength over a 24-hour window, not enough to prove that the ETH/BTC pair has already completed a trend reversal.
【Price layer: the strength-vs-weakness gap has appeared】
Around 23:00 Beijing time today, ETH was at 1934.91 USDT, up 1.90% over 24 hours; BTC was at 64749.45 USDT, only up 0.05% over the same period. Based on the latest prices, ETH/BTC is about 0.02988. Looking only at the % changes, ETH is ahead of BTC by roughly 1.85 percentage points, suggesting that incremental capital or risk appetite leaned more toward ETH that day.
Intraday paths also offer clues. ETH rebounded from 1898.06 to 1934.91, still about 2.3% away from the high of 1981.24. Meanwhile BTC bounced from 64459.82 and then was about 1.5% away from the high of 65744.60. In other words, ETH has higher elasticity, but overhead selling pressure is also more pronounced. Strength doesn’t mean there’s no resistance.
【Trading layer: there is activity, but it can’t directly be equated with net inflows】
ETHUSDT’s 24-hour trading value is about 628 million USDT, while BTCUSDT is about 921 million USDT. ETH’s trading value is roughly 68% of BTC’s; together with the higher rise, this suggests the relative performance did not occur under extremely low activity. However, trading value records trade size only—it does not distinguish between aggressive buy orders and aggressive sell orders, and it cannot, by itself, prove that capital is consistently flowing into ETH.
【Event layer: fundamental information and short-term market action may overlap】
Tonight, CoinDesk reported that Lido is integrating about 8 million staked ETH tokens and plans to reduce the number of validators by roughly one-third, while also, for the first time, requiring professional node operators to provide collateral. This is an important adjustment involving staking infrastructure, but the existing information cannot prove it is the direct cause of ETH’s rise. Another explanation is that risk assets are broadly recovering: Cointelegraph mentioned in parallel that rising US stocks and expectations of eased geopolitical tensions pushed BTC to try to move closer to $66,000. If overall market risk appetite rebounds, ETH typically may exhibit higher elasticity.
Next, what’s truly worth monitoring isn’t whether ETH is rising faster on a single day, but whether ETH/BTC can continue to hold around 0.02988 and expand upward, and whether ETH can again approach and break above 1981.24. If the ratio quickly falls back, or if ETH loses 1898.06 while BTC remains stable, then this relative strength is more likely just a short-term rotation.
The above is based only on a single 24-hour snapshot and publicly available information, and does not constitute investment advice. Crypto assets are highly volatile, and short-term relative strength/weakness can reverse quickly. Before making decisions, you should consider longer-term cycles, liquidity, and your own risk tolerance.
Reference data:
- https://data-api.binance.vision/api/v3/ticker/24hr?symbols=%5B%22BTCUSDT%22%2C%22ETHUSDT%22%2C%22BNBUSDT%22%5D
- https://www.coindesk.com/tech/2026/07/27/lido-begins-moving-usd16-5-billion-in-staked-ether-to-cut-validator-count-by-a-third
$BTC $ETH #ETHBTC #以太坊 #比特币 #行情分析
Conclusion first: In today’s data set, ETH is clearly stronger than BTC relative to BTC, but it looks more like relative strength over a 24-hour window, not enough to prove that the ETH/BTC pair has already completed a trend reversal.
【Price layer: the strength-vs-weakness gap has appeared】
Around 23:00 Beijing time today, ETH was at 1934.91 USDT, up 1.90% over 24 hours; BTC was at 64749.45 USDT, only up 0.05% over the same period. Based on the latest prices, ETH/BTC is about 0.02988. Looking only at the % changes, ETH is ahead of BTC by roughly 1.85 percentage points, suggesting that incremental capital or risk appetite leaned more toward ETH that day.
Intraday paths also offer clues. ETH rebounded from 1898.06 to 1934.91, still about 2.3% away from the high of 1981.24. Meanwhile BTC bounced from 64459.82 and then was about 1.5% away from the high of 65744.60. In other words, ETH has higher elasticity, but overhead selling pressure is also more pronounced. Strength doesn’t mean there’s no resistance.
【Trading layer: there is activity, but it can’t directly be equated with net inflows】
ETHUSDT’s 24-hour trading value is about 628 million USDT, while BTCUSDT is about 921 million USDT. ETH’s trading value is roughly 68% of BTC’s; together with the higher rise, this suggests the relative performance did not occur under extremely low activity. However, trading value records trade size only—it does not distinguish between aggressive buy orders and aggressive sell orders, and it cannot, by itself, prove that capital is consistently flowing into ETH.
【Event layer: fundamental information and short-term market action may overlap】
Tonight, CoinDesk reported that Lido is integrating about 8 million staked ETH tokens and plans to reduce the number of validators by roughly one-third, while also, for the first time, requiring professional node operators to provide collateral. This is an important adjustment involving staking infrastructure, but the existing information cannot prove it is the direct cause of ETH’s rise. Another explanation is that risk assets are broadly recovering: Cointelegraph mentioned in parallel that rising US stocks and expectations of eased geopolitical tensions pushed BTC to try to move closer to $66,000. If overall market risk appetite rebounds, ETH typically may exhibit higher elasticity.
Next, what’s truly worth monitoring isn’t whether ETH is rising faster on a single day, but whether ETH/BTC can continue to hold around 0.02988 and expand upward, and whether ETH can again approach and break above 1981.24. If the ratio quickly falls back, or if ETH loses 1898.06 while BTC remains stable, then this relative strength is more likely just a short-term rotation.
The above is based only on a single 24-hour snapshot and publicly available information, and does not constitute investment advice. Crypto assets are highly volatile, and short-term relative strength/weakness can reverse quickly. Before making decisions, you should consider longer-term cycles, liquidity, and your own risk tolerance.
Reference data:
- https://data-api.binance.vision/api/v3/ticker/24hr?symbols=%5B%22BTCUSDT%22%2C%22ETHUSDT%22%2C%22BNBUSDT%22%5D
- https://www.coindesk.com/tech/2026/07/27/lido-begins-moving-usd16-5-billion-in-staked-ether-to-cut-validator-count-by-a-third
$BTC $ETH #ETHBTC #以太坊 #比特币 #行情分析
8
328
·
--
Keeping Costs Down, Yet BTC Has Not Broken Through: Pricing Misalignment Before the Fed Decision
This evening, a cautionary contrast has emerged: as the U.S. Federal Reserve’s decision approaches, Bitcoin options traders are reducing downside hedges. According to data cited by CoinDesk, the put/call ratio has fallen from 0.76 in late June to around 0.52, and the price of one-period downside protection has also noticeably dropped. Meanwhile, Binance spot data shows BTC at 65,012.86 USDT—up only 0.68% over the past 24 hours, trading in a range of 64,414 to 65,744.6 USDT, without a strong, synchronized breakout.
The key here is not the phrase “the market is bullish,” but the possible misalignment between hedging demand, event expectations, and actual volatility. Lower hedging costs suggest participants are pricing less severe near-term selloffs. But it could also mean positions are more sensitive to unexpected outcomes. If the Fed decision or related remarks diverge from the current calm expectations, renewed demand to buy protection could push implied volatility higher, and spot prices could quickly widen their trading range.
Looking across the market, ETH rose 3.10% over the same period—clearly stronger than BTC’s 0.68%—while BNB was up only 0.12%. This indicates that not all major assets are trading under the same narrative right now: BTC looks more like it is waiting before an event, ETH already shows more pronounced price elasticity, and BNB is relatively steady. Focusing only on BTC’s up/down percentage may cause you to miss how capital is expressing differing expectations across assets.
The lesson from this episode is: ahead of macro catalysts, cheap protection does not mean risk has disappeared—it only means the market has temporarily priced the risk at a lower cost. When observing similar scenarios, you can check three things in parallel: whether options hedging demand continues to fall, whether spot can break out of the day’s range, and whether relative strength among major assets begins to converge. If BTC breaks below the 64,414 area, or if options hedging rapidly heats up again, the expectation of “a quiet week” may need to be reassessed. If it holds above 65,744.6 and asset synchronization strengthens, spot confirmation would be higher.
The above is based only on publicly available data interpretation and does not constitute investment advice. In an event window, price gaps, liquidity changes, and high volatility are possible—especially when using leverage, risk control is essential.
Reference data:
- https://data-api.binance.vision/api/v3/ticker/24hr?symbols=%5B%22BTCUSDT%22%2C%22ETHUSDT%22%2C%22BNBUSDT%22%5D
- https://www.coindesk.com/markets/2026/07/27/bitcoin-options-traders-are-dropping-their-hedges-going-into-the-fed-meeting
$BTC $ETH $BNB #市场热点 #比特币期权 #美联储议息 #加密市场
Keeping Costs Down, Yet BTC Has Not Broken Through: Pricing Misalignment Before the Fed Decision
This evening, a cautionary contrast has emerged: as the U.S. Federal Reserve’s decision approaches, Bitcoin options traders are reducing downside hedges. According to data cited by CoinDesk, the put/call ratio has fallen from 0.76 in late June to around 0.52, and the price of one-period downside protection has also noticeably dropped. Meanwhile, Binance spot data shows BTC at 65,012.86 USDT—up only 0.68% over the past 24 hours, trading in a range of 64,414 to 65,744.6 USDT, without a strong, synchronized breakout.
The key here is not the phrase “the market is bullish,” but the possible misalignment between hedging demand, event expectations, and actual volatility. Lower hedging costs suggest participants are pricing less severe near-term selloffs. But it could also mean positions are more sensitive to unexpected outcomes. If the Fed decision or related remarks diverge from the current calm expectations, renewed demand to buy protection could push implied volatility higher, and spot prices could quickly widen their trading range.
Looking across the market, ETH rose 3.10% over the same period—clearly stronger than BTC’s 0.68%—while BNB was up only 0.12%. This indicates that not all major assets are trading under the same narrative right now: BTC looks more like it is waiting before an event, ETH already shows more pronounced price elasticity, and BNB is relatively steady. Focusing only on BTC’s up/down percentage may cause you to miss how capital is expressing differing expectations across assets.
The lesson from this episode is: ahead of macro catalysts, cheap protection does not mean risk has disappeared—it only means the market has temporarily priced the risk at a lower cost. When observing similar scenarios, you can check three things in parallel: whether options hedging demand continues to fall, whether spot can break out of the day’s range, and whether relative strength among major assets begins to converge. If BTC breaks below the 64,414 area, or if options hedging rapidly heats up again, the expectation of “a quiet week” may need to be reassessed. If it holds above 65,744.6 and asset synchronization strengthens, spot confirmation would be higher.
The above is based only on publicly available data interpretation and does not constitute investment advice. In an event window, price gaps, liquidity changes, and high volatility are possible—especially when using leverage, risk control is essential.
Reference data:
- https://data-api.binance.vision/api/v3/ticker/24hr?symbols=%5B%22BTCUSDT%22%2C%22ETHUSDT%22%2C%22BNBUSDT%22%5D
- https://www.coindesk.com/markets/2026/07/27/bitcoin-options-traders-are-dropping-their-hedges-going-into-the-fed-meeting
$BTC $ETH $BNB #市场热点 #比特币期权 #美联储议息 #加密市场
This evening, a cautionary contrast has emerged: as the U.S. Federal Reserve’s decision approaches, Bitcoin options traders are reducing downside hedges. According to data cited by CoinDesk, the put/call ratio has fallen from 0.76 in late June to around 0.52, and the price of one-period downside protection has also noticeably dropped. Meanwhile, Binance spot data shows BTC at 65,012.86 USDT—up only 0.68% over the past 24 hours, trading in a range of 64,414 to 65,744.6 USDT, without a strong, synchronized breakout.
The key here is not the phrase “the market is bullish,” but the possible misalignment between hedging demand, event expectations, and actual volatility. Lower hedging costs suggest participants are pricing less severe near-term selloffs. But it could also mean positions are more sensitive to unexpected outcomes. If the Fed decision or related remarks diverge from the current calm expectations, renewed demand to buy protection could push implied volatility higher, and spot prices could quickly widen their trading range.
Looking across the market, ETH rose 3.10% over the same period—clearly stronger than BTC’s 0.68%—while BNB was up only 0.12%. This indicates that not all major assets are trading under the same narrative right now: BTC looks more like it is waiting before an event, ETH already shows more pronounced price elasticity, and BNB is relatively steady. Focusing only on BTC’s up/down percentage may cause you to miss how capital is expressing differing expectations across assets.
The lesson from this episode is: ahead of macro catalysts, cheap protection does not mean risk has disappeared—it only means the market has temporarily priced the risk at a lower cost. When observing similar scenarios, you can check three things in parallel: whether options hedging demand continues to fall, whether spot can break out of the day’s range, and whether relative strength among major assets begins to converge. If BTC breaks below the 64,414 area, or if options hedging rapidly heats up again, the expectation of “a quiet week” may need to be reassessed. If it holds above 65,744.6 and asset synchronization strengthens, spot confirmation would be higher.
The above is based only on publicly available data interpretation and does not constitute investment advice. In an event window, price gaps, liquidity changes, and high volatility are possible—especially when using leverage, risk control is essential.
Reference data:
- https://data-api.binance.vision/api/v3/ticker/24hr?symbols=%5B%22BTCUSDT%22%2C%22ETHUSDT%22%2C%22BNBUSDT%22%5D
- https://www.coindesk.com/markets/2026/07/27/bitcoin-options-traders-are-dropping-their-hedges-going-into-the-fed-meeting
$BTC $ETH $BNB #市场热点 #比特币期权 #美联储议息 #加密市场
7
78
·
--
ETH’s 4.31% Gain Hid a 99.63-Point Risk Test
ETHUSDT gained 4.31% in 24 hours, but its trading range tells the more useful futures-risk story.
At 2026-07-27 10:55:19.390 UTC, ETHUSDT was 1,967.53 after moving between 1,881.61 and 1,981.24. That is a 99.63-point gap between the daily low and high. Over the same snapshot, BTCUSDT rose 1.28%, while BNBUSDT added 0.41%.
The mechanism: leverage magnifies exposure to moves inside the range, not just the final 24-hour percentage. A trader who focuses only on ETH’s 4.31% gain may overlook the path price took. In futures, an adverse move before a recovery can still trigger liquidation or force an early exit.
A reusable pre-trade framework:
1. Range: compare the current price with the 24-hour high and low.
2. Leverage: estimate how much of that observed range the position could withstand.
3. Invalidation: define the price condition that would prove the setup wrong.
4. Event exposure: account for the Fed decision reported as scheduled for Wednesday.
5. Exit capacity: verify that losses remain manageable without relying on a reversal.
The common mistake is treating a positive daily close as evidence that a leveraged…
参考数据:
- https://data-api.binance.vision/api/v3/ticker/24hr?symbols=%5B%22BTCUSDT%22%2C%22ETHUSDT%22%2C%22BNBUSDT%22%5D
- https://www.coindesk.com/markets/2026/07/27/interest-rates-in-u-s-u-k-japan-and-coinbase-strategy-earnings-crypto-week-ahead
$BTCUSDT $ETHUSDT $BNBUSDT #FuturesRisk #RiskManagement #CryptoEducation
ETH’s 4.31% Gain Hid a 99.63-Point Risk Test
ETHUSDT gained 4.31% in 24 hours, but its trading range tells the more useful futures-risk story.
At 2026-07-27 10:55:19.390 UTC, ETHUSDT was 1,967.53 after moving between 1,881.61 and 1,981.24. That is a 99.63-point gap between the daily low and high. Over the same snapshot, BTCUSDT rose 1.28%, while BNBUSDT added 0.41%.
The mechanism: leverage magnifies exposure to moves inside the range, not just the final 24-hour percentage. A trader who focuses only on ETH’s 4.31% gain may overlook the path price took. In futures, an adverse move before a recovery can still trigger liquidation or force an early exit.
A reusable pre-trade framework:
1. Range: compare the current price with the 24-hour high and low.
2. Leverage: estimate how much of that observed range the position could withstand.
3. Invalidation: define the price condition that would prove the setup wrong.
4. Event exposure: account for the Fed decision reported as scheduled for Wednesday.
5. Exit capacity: verify that losses remain manageable without relying on a reversal.
The common mistake is treating a positive daily close as evidence that a leveraged…
参考数据:
- https://data-api.binance.vision/api/v3/ticker/24hr?symbols=%5B%22BTCUSDT%22%2C%22ETHUSDT%22%2C%22BNBUSDT%22%5D
- https://www.coindesk.com/markets/2026/07/27/interest-rates-in-u-s-u-k-japan-and-coinbase-strategy-earnings-crypto-week-ahead
$BTCUSDT $ETHUSDT $BNBUSDT #FuturesRisk #RiskManagement #CryptoEducation
ETHUSDT gained 4.31% in 24 hours, but its trading range tells the more useful futures-risk story.
At 2026-07-27 10:55:19.390 UTC, ETHUSDT was 1,967.53 after moving between 1,881.61 and 1,981.24. That is a 99.63-point gap between the daily low and high. Over the same snapshot, BTCUSDT rose 1.28%, while BNBUSDT added 0.41%.
The mechanism: leverage magnifies exposure to moves inside the range, not just the final 24-hour percentage. A trader who focuses only on ETH’s 4.31% gain may overlook the path price took. In futures, an adverse move before a recovery can still trigger liquidation or force an early exit.
A reusable pre-trade framework:
1. Range: compare the current price with the 24-hour high and low.
2. Leverage: estimate how much of that observed range the position could withstand.
3. Invalidation: define the price condition that would prove the setup wrong.
4. Event exposure: account for the Fed decision reported as scheduled for Wednesday.
5. Exit capacity: verify that losses remain manageable without relying on a reversal.
The common mistake is treating a positive daily close as evidence that a leveraged…
参考数据:
- https://data-api.binance.vision/api/v3/ticker/24hr?symbols=%5B%22BTCUSDT%22%2C%22ETHUSDT%22%2C%22BNBUSDT%22%5D
- https://www.coindesk.com/markets/2026/07/27/interest-rates-in-u-s-u-k-japan-and-coinbase-strategy-earnings-crypto-week-ahead
$BTCUSDT $ETHUSDT $BNBUSDT #FuturesRisk #RiskManagement #CryptoEducation
6
59
·
--
BNB gently rebounds, on-chain participants should be more mindful of off-chain risks
As of 2026-07-27 07:30:50 UTC, BNB is trading at 574.78 USDT, up 0.59% over the past 24 hours. Over the same period, ETH is up 4.46% and BTC is up 1.54%. This set of differences suggests that when the overall market rebounds, BNB does not become a leading-performing asset.
For participants in the BNB Chain ecosystem, the change that deserves more attention right now is not a single price move, but the simultaneous appearance of “market warming” and an increase in “infrastructure risk events.” At 2026-07-27 01:58:54 UTC, Garden Finance shut down its application after its off-chain database used by an independent solver was breached; reports said user funds and smart contracts were not affected. At 05:15:54 UTC, Triple-A confirmed that its treasury wallet was compromised, with losses reaching $11.8 million, and stated that customer funds were not affected.
These two incidents provide a practical checklist for cross-chain, payments, and DeFi users:
1. Determine whether the risk occurred in smart contracts, off-chain services, or the treasury wallet.
2. Before taking action, confirm whether the application has been paused and check the official statement about the affected scope.
3. Review allowance/approval amounts to avoid keeping unnecessary token approvals long-term.
4. Separate funds used for day-to-day interactions from assets held for the long term.
5. Record transaction hashes and the entry points used to facilitate investigation if anomalies occur.
A common misconception is to treat “smart contracts were not affected” as meaning the entire service has no risk. Off-chain databases, solvers, front ends, and treasury wallets can also be failure points. Conversely, if one component is compromised, it does not automatically mean all users’ assets have already been damaged; you still need to assess based on the disclosed impact scope.
The practical implication for the BNB Chain ecosystem is straightforward: as trading activity increases, interaction frequency may rise too, but safety boundaries will not automatically improve. In terms of price, BNB’s intraday low is 570.01 and high is 577.20. If the price falls back below the day’s low again, the current basis for observing this mild rebound would need to be reassessed.
Risk warning: Crypto asset prices are highly volatile, and third-party applications may also involve contract, off-chain system, operational, and custody risks. The above is only educational observation based on public data and does not constitute investment advice.
Reference data:
- https://data-api.binance.vision/api/v3/ticker/24hr?symbols=%5B%22BTCUSDT%22%2C%22ETHUSDT%22%2C%22BNBUSDT%22%5D
- https://cointelegraph.com/news/garden-finance-app-offline-450k-htlc-exploit?utm_source=rss_feed&utm_medium=rss&utm_campaign=rss_partner_inbound
$BNB $BTC $ETH #BNBChain #生态观察 #链上安全 #风险管理
BNB gently rebounds, on-chain participants should be more mindful of off-chain risks
As of 2026-07-27 07:30:50 UTC, BNB is trading at 574.78 USDT, up 0.59% over the past 24 hours. Over the same period, ETH is up 4.46% and BTC is up 1.54%. This set of differences suggests that when the overall market rebounds, BNB does not become a leading-performing asset.
For participants in the BNB Chain ecosystem, the change that deserves more attention right now is not a single price move, but the simultaneous appearance of “market warming” and an increase in “infrastructure risk events.” At 2026-07-27 01:58:54 UTC, Garden Finance shut down its application after its off-chain database used by an independent solver was breached; reports said user funds and smart contracts were not affected. At 05:15:54 UTC, Triple-A confirmed that its treasury wallet was compromised, with losses reaching $11.8 million, and stated that customer funds were not affected.
These two incidents provide a practical checklist for cross-chain, payments, and DeFi users:
1. Determine whether the risk occurred in smart contracts, off-chain services, or the treasury wallet.
2. Before taking action, confirm whether the application has been paused and check the official statement about the affected scope.
3. Review allowance/approval amounts to avoid keeping unnecessary token approvals long-term.
4. Separate funds used for day-to-day interactions from assets held for the long term.
5. Record transaction hashes and the entry points used to facilitate investigation if anomalies occur.
A common misconception is to treat “smart contracts were not affected” as meaning the entire service has no risk. Off-chain databases, solvers, front ends, and treasury wallets can also be failure points. Conversely, if one component is compromised, it does not automatically mean all users’ assets have already been damaged; you still need to assess based on the disclosed impact scope.
The practical implication for the BNB Chain ecosystem is straightforward: as trading activity increases, interaction frequency may rise too, but safety boundaries will not automatically improve. In terms of price, BNB’s intraday low is 570.01 and high is 577.20. If the price falls back below the day’s low again, the current basis for observing this mild rebound would need to be reassessed.
Risk warning: Crypto asset prices are highly volatile, and third-party applications may also involve contract, off-chain system, operational, and custody risks. The above is only educational observation based on public data and does not constitute investment advice.
Reference data:
- https://data-api.binance.vision/api/v3/ticker/24hr?symbols=%5B%22BTCUSDT%22%2C%22ETHUSDT%22%2C%22BNBUSDT%22%5D
- https://cointelegraph.com/news/garden-finance-app-offline-450k-htlc-exploit?utm_source=rss_feed&utm_medium=rss&utm_campaign=rss_partner_inbound
$BNB $BTC $ETH #BNBChain #生态观察 #链上安全 #风险管理
As of 2026-07-27 07:30:50 UTC, BNB is trading at 574.78 USDT, up 0.59% over the past 24 hours. Over the same period, ETH is up 4.46% and BTC is up 1.54%. This set of differences suggests that when the overall market rebounds, BNB does not become a leading-performing asset.
For participants in the BNB Chain ecosystem, the change that deserves more attention right now is not a single price move, but the simultaneous appearance of “market warming” and an increase in “infrastructure risk events.” At 2026-07-27 01:58:54 UTC, Garden Finance shut down its application after its off-chain database used by an independent solver was breached; reports said user funds and smart contracts were not affected. At 05:15:54 UTC, Triple-A confirmed that its treasury wallet was compromised, with losses reaching $11.8 million, and stated that customer funds were not affected.
These two incidents provide a practical checklist for cross-chain, payments, and DeFi users:
1. Determine whether the risk occurred in smart contracts, off-chain services, or the treasury wallet.
2. Before taking action, confirm whether the application has been paused and check the official statement about the affected scope.
3. Review allowance/approval amounts to avoid keeping unnecessary token approvals long-term.
4. Separate funds used for day-to-day interactions from assets held for the long term.
5. Record transaction hashes and the entry points used to facilitate investigation if anomalies occur.
A common misconception is to treat “smart contracts were not affected” as meaning the entire service has no risk. Off-chain databases, solvers, front ends, and treasury wallets can also be failure points. Conversely, if one component is compromised, it does not automatically mean all users’ assets have already been damaged; you still need to assess based on the disclosed impact scope.
The practical implication for the BNB Chain ecosystem is straightforward: as trading activity increases, interaction frequency may rise too, but safety boundaries will not automatically improve. In terms of price, BNB’s intraday low is 570.01 and high is 577.20. If the price falls back below the day’s low again, the current basis for observing this mild rebound would need to be reassessed.
Risk warning: Crypto asset prices are highly volatile, and third-party applications may also involve contract, off-chain system, operational, and custody risks. The above is only educational observation based on public data and does not constitute investment advice.
Reference data:
- https://data-api.binance.vision/api/v3/ticker/24hr?symbols=%5B%22BTCUSDT%22%2C%22ETHUSDT%22%2C%22BNBUSDT%22%5D
- https://cointelegraph.com/news/garden-finance-app-offline-450k-htlc-exploit?utm_source=rss_feed&utm_medium=rss&utm_campaign=rss_partner_inbound
$BNB $BTC $ETH #BNBChain #生态观察 #链上安全 #风险管理
4
248
·
--
Does ETH outperforming BTC in a single day mean “the altcoin season” is here?
BTC is back above $65,000, but that doesn’t mean that “all altcoins are about to rise.”
As of 2026-07-27 05:30:47 UTC, BTCUSDT is 65,403.9, up 1.42% over the past 24 hours; ETHUSDT is 1,959.12, up 3.94%; BNBUSDT is 574.66, up 0.53%. In the same period, ETH performed better than BTC and BNB, but this only indicates that the three assets had different percentage gains within the last 24 hours. You cannot confirm that “altcoin season” has already started based on a single cross-sectional comparison.
To assess claims like this, you can do four checks:
1. Look at persistence: Is relative strength just a short-lived fluctuation, or does it remain across multiple observation intervals?
2. Look at breadth: Has the rally spread to more assets, instead of being concentrated only in ETH?
3. Look at trading activity: Does the price increase come with corresponding increases in trading activity? In this dataset, the 24-hour quoted trading turnover for BTC, ETH, and BNB is approximately 578 million, 367 million, and 37 million USDT, respectively.
4. Define invalidation conditions: If ETH’s advantage over BTC disappears quickly, or if the rally doesn’t broaden, then the conclusion that an “altcoin cycle has started” needs to be reassessed.
A common mistake is to rewrite “ETH outperformed BTC in one day” directly as “the market style has fully switched.” The data supports only a phase of relative strength, not a definitive conclusion about future price action.
A more practical approach is to first record the duration, the breadth of the up-move, and changes in trading turnover, and then discuss whether the market is currently rotating. Crypto asset prices are highly volatile, and short-cycle data can be heavily influenced by events. This article is for market education and data interpretation only and does not constitute investment advice.
Reference data:
- https://data-api.binance.vision/api/v3/ticker/24hr?symbols=%5B%22BTCUSDT%22%2C%22ETHUSDT%22%2C%22BNBUSDT%22%5D
- https://www.coindesk.com/markets/2026/07/27/bitcoin-is-back-above-usd65-000-as-u-s-iran-hold-fire-oil-drops-5
$BTC $ETH $BNB #新手科普 #加密市场 #市场轮动 #风险管理
Does ETH outperforming BTC in a single day mean “the altcoin season” is here?
BTC is back above $65,000, but that doesn’t mean that “all altcoins are about to rise.”
As of 2026-07-27 05:30:47 UTC, BTCUSDT is 65,403.9, up 1.42% over the past 24 hours; ETHUSDT is 1,959.12, up 3.94%; BNBUSDT is 574.66, up 0.53%. In the same period, ETH performed better than BTC and BNB, but this only indicates that the three assets had different percentage gains within the last 24 hours. You cannot confirm that “altcoin season” has already started based on a single cross-sectional comparison.
To assess claims like this, you can do four checks:
1. Look at persistence: Is relative strength just a short-lived fluctuation, or does it remain across multiple observation intervals?
2. Look at breadth: Has the rally spread to more assets, instead of being concentrated only in ETH?
3. Look at trading activity: Does the price increase come with corresponding increases in trading activity? In this dataset, the 24-hour quoted trading turnover for BTC, ETH, and BNB is approximately 578 million, 367 million, and 37 million USDT, respectively.
4. Define invalidation conditions: If ETH’s advantage over BTC disappears quickly, or if the rally doesn’t broaden, then the conclusion that an “altcoin cycle has started” needs to be reassessed.
A common mistake is to rewrite “ETH outperformed BTC in one day” directly as “the market style has fully switched.” The data supports only a phase of relative strength, not a definitive conclusion about future price action.
A more practical approach is to first record the duration, the breadth of the up-move, and changes in trading turnover, and then discuss whether the market is currently rotating. Crypto asset prices are highly volatile, and short-cycle data can be heavily influenced by events. This article is for market education and data interpretation only and does not constitute investment advice.
Reference data:
- https://data-api.binance.vision/api/v3/ticker/24hr?symbols=%5B%22BTCUSDT%22%2C%22ETHUSDT%22%2C%22BNBUSDT%22%5D
- https://www.coindesk.com/markets/2026/07/27/bitcoin-is-back-above-usd65-000-as-u-s-iran-hold-fire-oil-drops-5
$BTC $ETH $BNB #新手科普 #加密市场 #市场轮动 #风险管理
BTC is back above $65,000, but that doesn’t mean that “all altcoins are about to rise.”
As of 2026-07-27 05:30:47 UTC, BTCUSDT is 65,403.9, up 1.42% over the past 24 hours; ETHUSDT is 1,959.12, up 3.94%; BNBUSDT is 574.66, up 0.53%. In the same period, ETH performed better than BTC and BNB, but this only indicates that the three assets had different percentage gains within the last 24 hours. You cannot confirm that “altcoin season” has already started based on a single cross-sectional comparison.
To assess claims like this, you can do four checks:
1. Look at persistence: Is relative strength just a short-lived fluctuation, or does it remain across multiple observation intervals?
2. Look at breadth: Has the rally spread to more assets, instead of being concentrated only in ETH?
3. Look at trading activity: Does the price increase come with corresponding increases in trading activity? In this dataset, the 24-hour quoted trading turnover for BTC, ETH, and BNB is approximately 578 million, 367 million, and 37 million USDT, respectively.
4. Define invalidation conditions: If ETH’s advantage over BTC disappears quickly, or if the rally doesn’t broaden, then the conclusion that an “altcoin cycle has started” needs to be reassessed.
A common mistake is to rewrite “ETH outperformed BTC in one day” directly as “the market style has fully switched.” The data supports only a phase of relative strength, not a definitive conclusion about future price action.
A more practical approach is to first record the duration, the breadth of the up-move, and changes in trading turnover, and then discuss whether the market is currently rotating. Crypto asset prices are highly volatile, and short-cycle data can be heavily influenced by events. This article is for market education and data interpretation only and does not constitute investment advice.
Reference data:
- https://data-api.binance.vision/api/v3/ticker/24hr?symbols=%5B%22BTCUSDT%22%2C%22ETHUSDT%22%2C%22BNBUSDT%22%5D
- https://www.coindesk.com/markets/2026/07/27/bitcoin-is-back-above-usd65-000-as-u-s-iran-hold-fire-oil-drops-5
$BTC $ETH $BNB #新手科普 #加密市场 #市场轮动 #风险管理
3
87
·
--
ETH Outpaced BTC, but the Ratio Is the Real Signal
ETH gained 3.40% over 24 hours while BTC gained 1.13%. That gap matters more than either move alone when assessing ETH/BTC.
Think of ETH/BTC as an exchange rate: it estimates how much BTC one ETH is worth. Using the supplied USDT prices, 1,945.12 ÷ 65,272.16 gives an implied ETH/BTC level of about 0.0298. If that ratio rises, ETH is outperforming BTC; if it falls, BTC is outperforming ETH.
A practical four-check framework:
1. Relative return: ETH led BTC by 2.27 percentage points over this 24-hour window.
2. Range position: ETH traded between 1,878.46 and 1,967.36; BTC traded between 64,293.81 and 65,577.
3. Confirmation: continued relative strength requires ETH/BTC to hold or advance beyond its current implied level, not merely for both USDT prices to rise.
4. Invalidation: if ETH gives back its relative gain and the ratio drops below roughly 0.0298, this short-term outperformance signal weakens.
Example: ETH can rise in USDT while still underperforming BTC if BTC rises faster. That is why ETHUSDT alone cannot answer whether capital is favoring ETH over BTC.
Snapshot captured at 2026-07-27 03:30:45.747 UTC. This is a single 24-hour observation, not proof of a lasting trend. Crypto prices are volatile; use multiple timeframes and defined risk limits be…
参考数据:
- https://data-api.binance.vision/api/v3/ticker/24hr?symbols=%5B%22BTCUSDT%22%2C%22ETHUSDT%22%2C%22BNBUSDT%22%5D
$ETH $BTC #ETHBTC #CryptoMarkets #MarketAnalysis
ETH Outpaced BTC, but the Ratio Is the Real Signal
ETH gained 3.40% over 24 hours while BTC gained 1.13%. That gap matters more than either move alone when assessing ETH/BTC.
Think of ETH/BTC as an exchange rate: it estimates how much BTC one ETH is worth. Using the supplied USDT prices, 1,945.12 ÷ 65,272.16 gives an implied ETH/BTC level of about 0.0298. If that ratio rises, ETH is outperforming BTC; if it falls, BTC is outperforming ETH.
A practical four-check framework:
1. Relative return: ETH led BTC by 2.27 percentage points over this 24-hour window.
2. Range position: ETH traded between 1,878.46 and 1,967.36; BTC traded between 64,293.81 and 65,577.
3. Confirmation: continued relative strength requires ETH/BTC to hold or advance beyond its current implied level, not merely for both USDT prices to rise.
4. Invalidation: if ETH gives back its relative gain and the ratio drops below roughly 0.0298, this short-term outperformance signal weakens.
Example: ETH can rise in USDT while still underperforming BTC if BTC rises faster. That is why ETHUSDT alone cannot answer whether capital is favoring ETH over BTC.
Snapshot captured at 2026-07-27 03:30:45.747 UTC. This is a single 24-hour observation, not proof of a lasting trend. Crypto prices are volatile; use multiple timeframes and defined risk limits be…
参考数据:
- https://data-api.binance.vision/api/v3/ticker/24hr?symbols=%5B%22BTCUSDT%22%2C%22ETHUSDT%22%2C%22BNBUSDT%22%5D
$ETH $BTC #ETHBTC #CryptoMarkets #MarketAnalysis
ETH gained 3.40% over 24 hours while BTC gained 1.13%. That gap matters more than either move alone when assessing ETH/BTC.
Think of ETH/BTC as an exchange rate: it estimates how much BTC one ETH is worth. Using the supplied USDT prices, 1,945.12 ÷ 65,272.16 gives an implied ETH/BTC level of about 0.0298. If that ratio rises, ETH is outperforming BTC; if it falls, BTC is outperforming ETH.
A practical four-check framework:
1. Relative return: ETH led BTC by 2.27 percentage points over this 24-hour window.
2. Range position: ETH traded between 1,878.46 and 1,967.36; BTC traded between 64,293.81 and 65,577.
3. Confirmation: continued relative strength requires ETH/BTC to hold or advance beyond its current implied level, not merely for both USDT prices to rise.
4. Invalidation: if ETH gives back its relative gain and the ratio drops below roughly 0.0298, this short-term outperformance signal weakens.
Example: ETH can rise in USDT while still underperforming BTC if BTC rises faster. That is why ETHUSDT alone cannot answer whether capital is favoring ETH over BTC.
Snapshot captured at 2026-07-27 03:30:45.747 UTC. This is a single 24-hour observation, not proof of a lasting trend. Crypto prices are volatile; use multiple timeframes and defined risk limits be…
参考数据:
- https://data-api.binance.vision/api/v3/ticker/24hr?symbols=%5B%22BTCUSDT%22%2C%22ETHUSDT%22%2C%22BNBUSDT%22%5D
$ETH $BTC #ETHBTC #CryptoMarkets #MarketAnalysis
3
96
·
--
Broad-based price increases do not mean contract risk has decreased
BTC, ETH, and BNB are all rising in sync, but contract risk has not declined as a result.
As of 2026-07-26 23:30:44 UTC, BTCUSDT is at 65,302.68, up 1.41% over the past 24 hours; ETHUSDT is at 1,949.88, up 4.03%; BNBUSDT is at 574.36, up 0.88%. ETH’s gain is leading, but its intraday range is also wider: 1,873.85 to 1,967.36, with an amplitude of about 5%. Price strength and increased volatility can occur at the same time. Positions with high leverage are especially prone to liquidation when the direction ultimately turns out to be wrong—first triggering forced liquidation due to short-term pullbacks.
To determine whether risk continues to rise, check four items:
1. Before entering, has a stop-loss level been specified in advance, rather than being changed temporarily after floating losses appear?
2. Is the single largest potential loss within what your account can tolerate?
3. Is there sufficient margin buffer—can you withstand the underlying returning to the 24-hour low?
4. Have you mistaken the three synchronized, fluctuating positions as “diversified allocation”?
The invalidation conditions must also be clear: if BTC, ETH, and BNB break below the 24-hour lows in this snapshot—64,293.81, 1,873.85, and 568.87, respectively—then the basis for observing “broad-based short-term upswings” no longer holds. You need to reassess your positions, not just keep the original judgment by adding margin.
A common mistake is treating the size of the rally as a safety buffer. In reality, leverage amplification increases not only potential returns, but also volatility, the impact of trading fees, and liquidation risk. A more practical sequence is to first determine the maximum you can afford to lose, then work backward to calculate your position size and leverage.
Data is only a market snapshot at a specific point in time and does not constitute investment advice. Contracts can lead to rapid—even total—loss of margin. Please conduct independent research and carefully assess your own risk tolerance.
Reference data:
- https://data-api.binance.vision/api/v3/ticker/24hr?symbols=%5B%22BTCUSDT%22%2C%22ETHUSDT%22%2C%22BNBUSDT%22%5D
$BTCUSDT $ETHUSDT $BNBUSDT #合约风险 #风险管理 #crypto market
Broad-based price increases do not mean contract risk has decreased
BTC, ETH, and BNB are all rising in sync, but contract risk has not declined as a result.
As of 2026-07-26 23:30:44 UTC, BTCUSDT is at 65,302.68, up 1.41% over the past 24 hours; ETHUSDT is at 1,949.88, up 4.03%; BNBUSDT is at 574.36, up 0.88%. ETH’s gain is leading, but its intraday range is also wider: 1,873.85 to 1,967.36, with an amplitude of about 5%. Price strength and increased volatility can occur at the same time. Positions with high leverage are especially prone to liquidation when the direction ultimately turns out to be wrong—first triggering forced liquidation due to short-term pullbacks.
To determine whether risk continues to rise, check four items:
1. Before entering, has a stop-loss level been specified in advance, rather than being changed temporarily after floating losses appear?
2. Is the single largest potential loss within what your account can tolerate?
3. Is there sufficient margin buffer—can you withstand the underlying returning to the 24-hour low?
4. Have you mistaken the three synchronized, fluctuating positions as “diversified allocation”?
The invalidation conditions must also be clear: if BTC, ETH, and BNB break below the 24-hour lows in this snapshot—64,293.81, 1,873.85, and 568.87, respectively—then the basis for observing “broad-based short-term upswings” no longer holds. You need to reassess your positions, not just keep the original judgment by adding margin.
A common mistake is treating the size of the rally as a safety buffer. In reality, leverage amplification increases not only potential returns, but also volatility, the impact of trading fees, and liquidation risk. A more practical sequence is to first determine the maximum you can afford to lose, then work backward to calculate your position size and leverage.
Data is only a market snapshot at a specific point in time and does not constitute investment advice. Contracts can lead to rapid—even total—loss of margin. Please conduct independent research and carefully assess your own risk tolerance.
Reference data:
- https://data-api.binance.vision/api/v3/ticker/24hr?symbols=%5B%22BTCUSDT%22%2C%22ETHUSDT%22%2C%22BNBUSDT%22%5D
$BTCUSDT $ETHUSDT $BNBUSDT #合约风险 #风险管理 #crypto market
BTC, ETH, and BNB are all rising in sync, but contract risk has not declined as a result.
As of 2026-07-26 23:30:44 UTC, BTCUSDT is at 65,302.68, up 1.41% over the past 24 hours; ETHUSDT is at 1,949.88, up 4.03%; BNBUSDT is at 574.36, up 0.88%. ETH’s gain is leading, but its intraday range is also wider: 1,873.85 to 1,967.36, with an amplitude of about 5%. Price strength and increased volatility can occur at the same time. Positions with high leverage are especially prone to liquidation when the direction ultimately turns out to be wrong—first triggering forced liquidation due to short-term pullbacks.
To determine whether risk continues to rise, check four items:
1. Before entering, has a stop-loss level been specified in advance, rather than being changed temporarily after floating losses appear?
2. Is the single largest potential loss within what your account can tolerate?
3. Is there sufficient margin buffer—can you withstand the underlying returning to the 24-hour low?
4. Have you mistaken the three synchronized, fluctuating positions as “diversified allocation”?
The invalidation conditions must also be clear: if BTC, ETH, and BNB break below the 24-hour lows in this snapshot—64,293.81, 1,873.85, and 568.87, respectively—then the basis for observing “broad-based short-term upswings” no longer holds. You need to reassess your positions, not just keep the original judgment by adding margin.
A common mistake is treating the size of the rally as a safety buffer. In reality, leverage amplification increases not only potential returns, but also volatility, the impact of trading fees, and liquidation risk. A more practical sequence is to first determine the maximum you can afford to lose, then work backward to calculate your position size and leverage.
Data is only a market snapshot at a specific point in time and does not constitute investment advice. Contracts can lead to rapid—even total—loss of margin. Please conduct independent research and carefully assess your own risk tolerance.
Reference data:
- https://data-api.binance.vision/api/v3/ticker/24hr?symbols=%5B%22BTCUSDT%22%2C%22ETHUSDT%22%2C%22BNBUSDT%22%5D
$BTCUSDT $ETHUSDT $BNBUSDT #合约风险 #风险管理 #crypto market
1
1
574
·
--
The "Rapid Turnaround" of Tariff Bludgeon: Trump's Cancellation of Threats to Europe and the Game Behind It
After experiencing a week of severe global market turmoil, the clouds of trade war across the Atlantic have dramatically dissipated.
1. Origin: The "Tariff Storm" Triggered by Greenland
Just a few days ago, the Trump administration used **"buying Greenland"** as leverage, issuing a stern ultimatum to eight European allies, including Germany, France, and the UK: if they do not cooperate with the U.S. Arctic expansion plan, a 10% punitive tariff will be imposed starting February 1. This unprecedented "economic coercion" instantly ignited tensions between Europe and America, with the EU even preparing to deploy the "Anti-Coercion Instrument (ACI)" for reciprocal retaliation.
2. Turning Point: The "Framework Agreement" After Davos
However, on January 21 local time, after a meeting with NATO Secretary General Jens Stoltenberg during the Davos Forum, Trump made a 180-degree turn in attitude. He announced on social media that the two sides had reached a **"framework agreement"** regarding the future security of Greenland and the entire Arctic region.
Main changes: The tariff measures originally set to take effect on February 1 have been officially canceled.
Core content: It is reported that the agreement involves deep cooperation on mineral extraction rights and the "Golden Dome" missile defense system. Although Denmark still emphasizes that sovereignty is non-negotiable, this compromise of "substituting benefits for tariffs" has temporarily quelled the flames of conflict.
3. Global Asset Market: From Safe Haven to Reflow
The removal of the tariff threat directly triggered a "reverse shock" in the financial market:
U.S. Stocks Rebound: Technology stocks (such as Nvidia and AMD) that were previously sold off due to concerns over the trade war have significantly warmed up.
Gold and Silver Correction: As risk aversion sentiment cooled, the previously soaring gold and silver saw a noticeable short-term profit-taking at high levels, with gold prices briefly retreating after the announcement.
Market Consensus: Investors once again experienced the typical characteristics of "Trump-style negotiations"—extreme pressure, market panic, and ultimately reaching a compromise.
Insight Summary: The calming of this tariff storm once again proves that the current international situation has entered a state of "extremely high uncertainty." The fluctuations in gold and silver are not changes in the fundamentals but rather risk-averse funds following political news in an "extreme drift."
#特朗普取消对欧关税威胁
The "Rapid Turnaround" of Tariff Bludgeon: Trump's Cancellation of Threats to Europe and the Game Behind It
After experiencing a week of severe global market turmoil, the clouds of trade war across the Atlantic have dramatically dissipated.
1. Origin: The "Tariff Storm" Triggered by Greenland
Just a few days ago, the Trump administration used **"buying Greenland"** as leverage, issuing a stern ultimatum to eight European allies, including Germany, France, and the UK: if they do not cooperate with the U.S. Arctic expansion plan, a 10% punitive tariff will be imposed starting February 1. This unprecedented "economic coercion" instantly ignited tensions between Europe and America, with the EU even preparing to deploy the "Anti-Coercion Instrument (ACI)" for reciprocal retaliation.
2. Turning Point: The "Framework Agreement" After Davos
However, on January 21 local time, after a meeting with NATO Secretary General Jens Stoltenberg during the Davos Forum, Trump made a 180-degree turn in attitude. He announced on social media that the two sides had reached a **"framework agreement"** regarding the future security of Greenland and the entire Arctic region.
Main changes: The tariff measures originally set to take effect on February 1 have been officially canceled.
Core content: It is reported that the agreement involves deep cooperation on mineral extraction rights and the "Golden Dome" missile defense system. Although Denmark still emphasizes that sovereignty is non-negotiable, this compromise of "substituting benefits for tariffs" has temporarily quelled the flames of conflict.
3. Global Asset Market: From Safe Haven to Reflow
The removal of the tariff threat directly triggered a "reverse shock" in the financial market:
U.S. Stocks Rebound: Technology stocks (such as Nvidia and AMD) that were previously sold off due to concerns over the trade war have significantly warmed up.
Gold and Silver Correction: As risk aversion sentiment cooled, the previously soaring gold and silver saw a noticeable short-term profit-taking at high levels, with gold prices briefly retreating after the announcement.
Market Consensus: Investors once again experienced the typical characteristics of "Trump-style negotiations"—extreme pressure, market panic, and ultimately reaching a compromise.
Insight Summary: The calming of this tariff storm once again proves that the current international situation has entered a state of "extremely high uncertainty." The fluctuations in gold and silver are not changes in the fundamentals but rather risk-averse funds following political news in an "extreme drift."
#特朗普取消对欧关税威胁
After experiencing a week of severe global market turmoil, the clouds of trade war across the Atlantic have dramatically dissipated.
1. Origin: The "Tariff Storm" Triggered by Greenland
Just a few days ago, the Trump administration used **"buying Greenland"** as leverage, issuing a stern ultimatum to eight European allies, including Germany, France, and the UK: if they do not cooperate with the U.S. Arctic expansion plan, a 10% punitive tariff will be imposed starting February 1. This unprecedented "economic coercion" instantly ignited tensions between Europe and America, with the EU even preparing to deploy the "Anti-Coercion Instrument (ACI)" for reciprocal retaliation.
2. Turning Point: The "Framework Agreement" After Davos
However, on January 21 local time, after a meeting with NATO Secretary General Jens Stoltenberg during the Davos Forum, Trump made a 180-degree turn in attitude. He announced on social media that the two sides had reached a **"framework agreement"** regarding the future security of Greenland and the entire Arctic region.
Main changes: The tariff measures originally set to take effect on February 1 have been officially canceled.
Core content: It is reported that the agreement involves deep cooperation on mineral extraction rights and the "Golden Dome" missile defense system. Although Denmark still emphasizes that sovereignty is non-negotiable, this compromise of "substituting benefits for tariffs" has temporarily quelled the flames of conflict.
3. Global Asset Market: From Safe Haven to Reflow
The removal of the tariff threat directly triggered a "reverse shock" in the financial market:
U.S. Stocks Rebound: Technology stocks (such as Nvidia and AMD) that were previously sold off due to concerns over the trade war have significantly warmed up.
Gold and Silver Correction: As risk aversion sentiment cooled, the previously soaring gold and silver saw a noticeable short-term profit-taking at high levels, with gold prices briefly retreating after the announcement.
Market Consensus: Investors once again experienced the typical characteristics of "Trump-style negotiations"—extreme pressure, market panic, and ultimately reaching a compromise.
Insight Summary: The calming of this tariff storm once again proves that the current international situation has entered a state of "extremely high uncertainty." The fluctuations in gold and silver are not changes in the fundamentals but rather risk-averse funds following political news in an "extreme drift."
#特朗普取消对欧关税威胁

5
670
·
--
ICT Learning First Lesson: 'Black Talk System'1.Liquidity
Refers to places where a large number of stop-loss orders, pending orders, and liquidation orders are concentrated in the market.
Common locations:
Previous high / Previous low
Range high / low
Double top / Double bottom
Trendline breakout point
Function:
The main force needs these orders to complete building positions or unloading.
Understanding in one sentence:
Liquidity = the 'fuel' of the main force.
2.Buy-side Liquidity / Sell-side Liquidity
Buy-side:
Upper liquidity (short stop-loss, long breakout buy orders)
Sell-side:
Lower liquidity (long stop-loss, short breakout sell orders)
Which side the price sweeps indicates which side the main force wants to eat first.
ICT Learning First Lesson: 'Black Talk System'
1.Liquidity
Refers to places where a large number of stop-loss orders, pending orders, and liquidation orders are concentrated in the market.
Common locations:
Previous high / Previous low
Range high / low
Double top / Double bottom
Trendline breakout point
Function:
The main force needs these orders to complete building positions or unloading.
Understanding in one sentence:
Liquidity = the 'fuel' of the main force.
2.Buy-side Liquidity / Sell-side Liquidity
Buy-side:
Upper liquidity (short stop-loss, long breakout buy orders)
Sell-side:
Lower liquidity (long stop-loss, short breakout sell orders)
Which side the price sweeps indicates which side the main force wants to eat first.
Refers to places where a large number of stop-loss orders, pending orders, and liquidation orders are concentrated in the market.
Common locations:
Previous high / Previous low
Range high / low
Double top / Double bottom
Trendline breakout point
Function:
The main force needs these orders to complete building positions or unloading.
Understanding in one sentence:
Liquidity = the 'fuel' of the main force.
2.Buy-side Liquidity / Sell-side Liquidity
Buy-side:
Upper liquidity (short stop-loss, long breakout buy orders)
Sell-side:
Lower liquidity (long stop-loss, short breakout sell orders)
Which side the price sweeps indicates which side the main force wants to eat first.
1
46
·
--
Bullish
Record the experience of the first 10 times
In one week, 10 times, during which there was a drawdown of over 50%
Almost failed, thanks to 2026
I hope everyone can pay attention, and we can share good suggestions and opportunities together in the future
Everyone, please pay more attention, and we will trade together in the live broadcast after it is opened
#加密市场观察 #ETH #BTC
Record the experience of the first 10 times
In one week, 10 times, during which there was a drawdown of over 50%
Almost failed, thanks to 2026
I hope everyone can pay attention, and we can share good suggestions and opportunities together in the future
Everyone, please pay more attention, and we will trade together in the live broadcast after it is opened
#加密市场观察 #ETH #BTC
In one week, 10 times, during which there was a drawdown of over 50%
Almost failed, thanks to 2026
I hope everyone can pay attention, and we can share good suggestions and opportunities together in the future
Everyone, please pay more attention, and we will trade together in the live broadcast after it is opened
#加密市场观察 #ETH #BTC
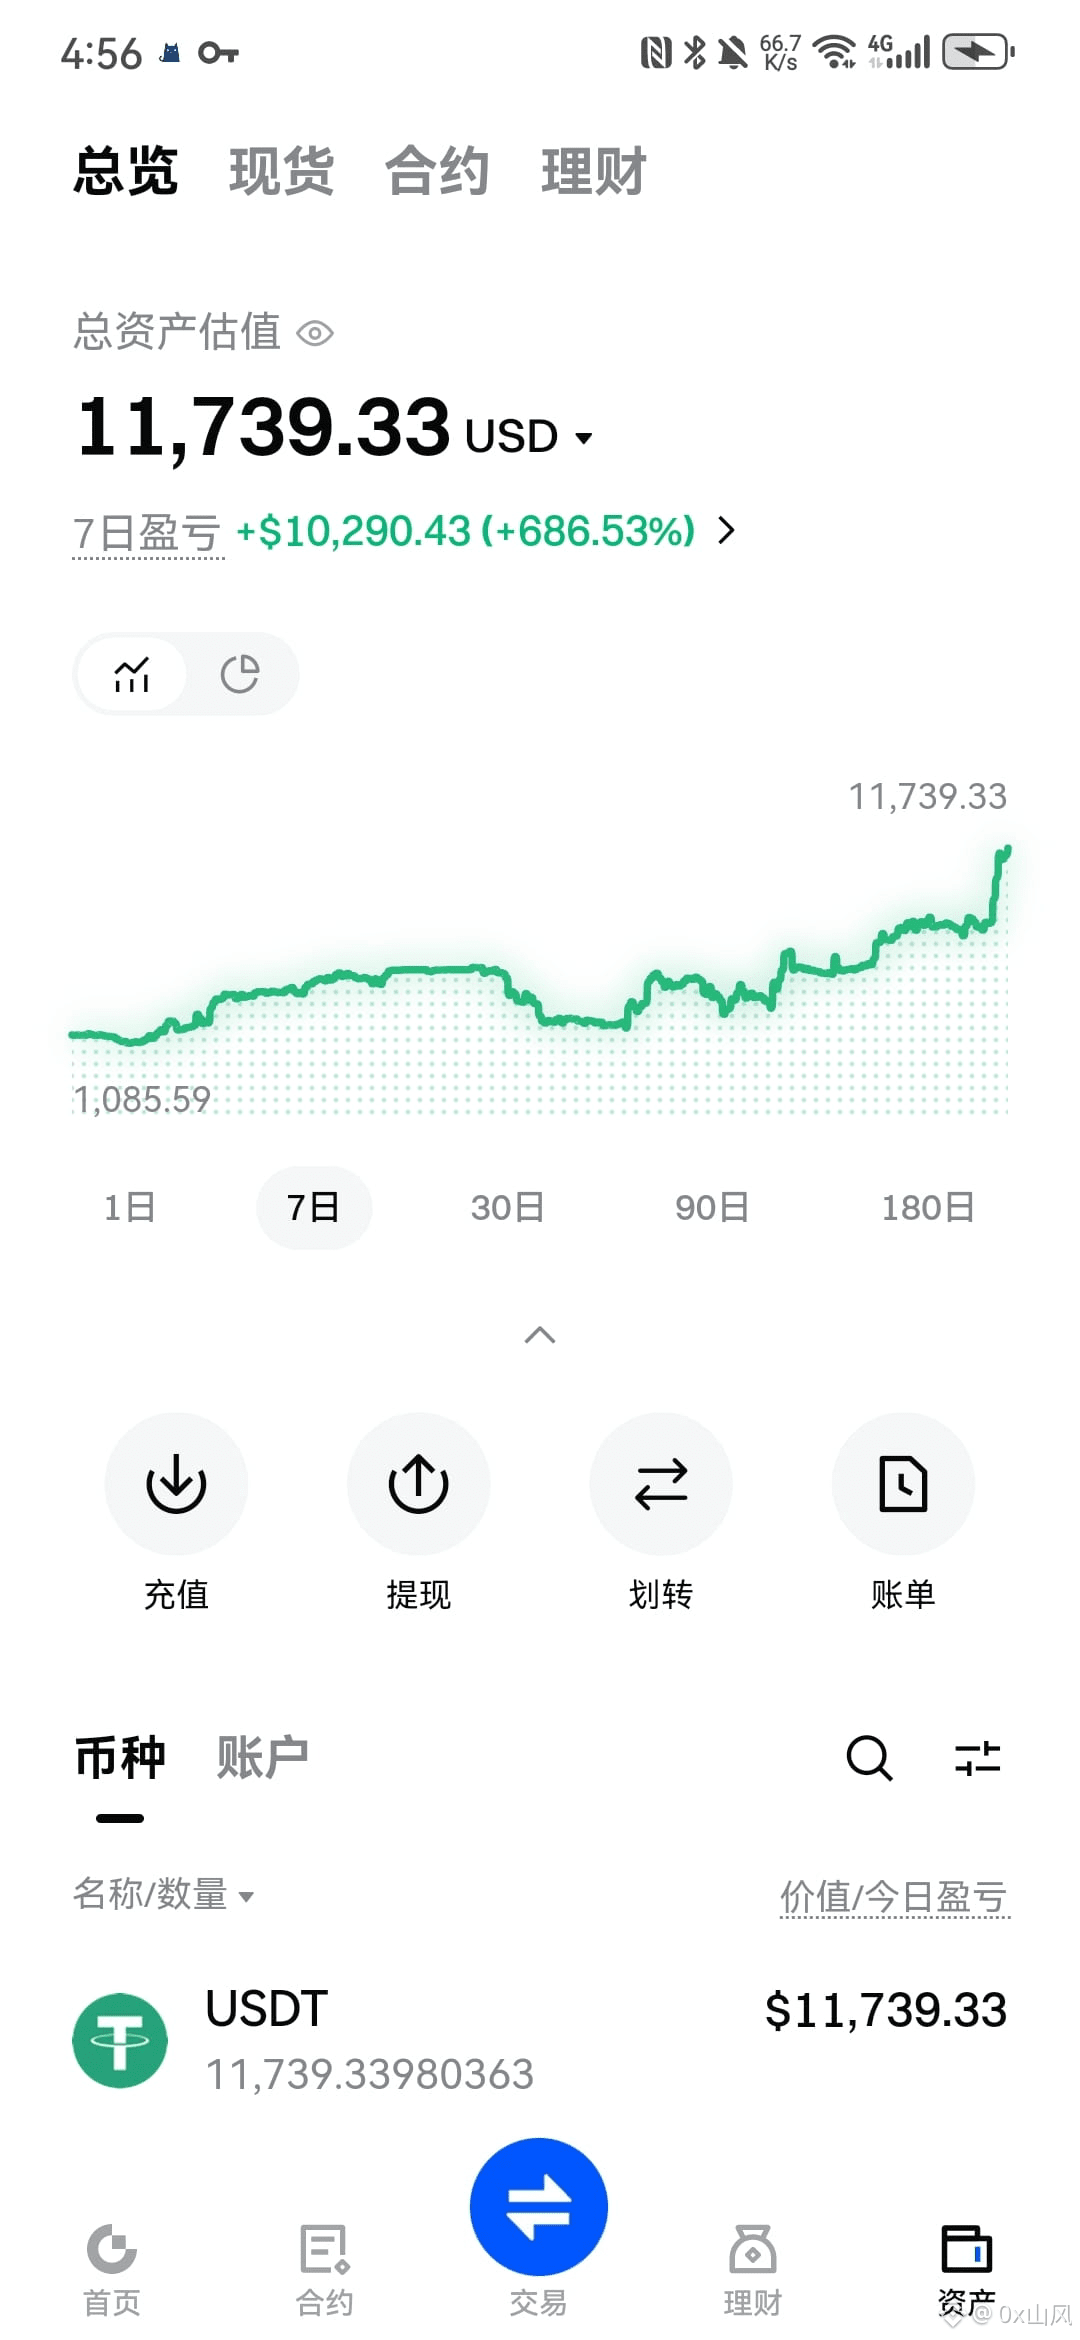
4
149
·
--
Bullish
#山寨币市场回暖 Next, just wait for the counterfeiters to take off
#山寨币市场回暖 Next, just wait for the counterfeiters to take off
19
·
--
Bearish
Will #ETH drop 4K this week? What does everyone think?
Will #ETH drop 4K this week? What does everyone think?
165
·
--
Bearish
Who is still taking over $WLFI ? Such strength, take a look at v50, is it okay to send it to the west?😀
{future}(WLFIUSDT)
Who is still taking over $WLFI ? Such strength, take a look at v50, is it okay to send it to the west?😀
542
Log in to explore more content
Join global crypto users on Binance Square
⚡️ Get latest and useful information about crypto.
💬 Trusted by the world’s largest crypto exchange.
👍 Discover real insights from verified creators.
Email / Phone number
Trending Topics
BinanceLaunchesBinanceIntelligence
57,012 views
776 Discussing
🚨 BINANCE JUST PUT AI DIRECTLY INSIDE THE EXCHANGE — AND THIS COULD CHANGE HOW RETAIL TRADES.
Binance has officially launched Binance Intelligence, a new AI layer built into the Binance ecosystem. It combines three products:
Binance AI for everyday users,
Binance AI Pro for automated trading workflows,
and Agent OS for developers building financial agents.
The part traders should care about?
Binance AI can surface market briefs, smart alerts, PnL recaps and personalized information, while AI Pro is designed to turn a plain-English trading idea into a visual strategy workflow.
That means the next phase of exchange competition may not be:
lowest fees vs deepest liquidity.
It could be:
who gives traders the best AI execution layer.
If Binance Intelligence actually drives heavier user activity, automated strategies and higher trading frequency, watch $BNB first.
AI adoption ↑
→ Binance engagement ↑
→ trading activity ↑
→ ecosystem narrative strengthens.
The catalyst I’d watch now:
global rollout + AI Pro launch + measurable user adoption.
Because once AI stops just telling you what the market is doing…
…and starts helping build the trade itself?
That’s when this gets much bigger than another chatbot. 👀
#binancelaunchesbinanceintelligence #EvernorthXRPTreasuryCompletesSPACMerger #ADAGains10%Above$0.27 #ETHUp70%InQ3ButLiquidityFalls #EthStakingExitQueueHits2026High
KimHotbae
·20 Likes
·27.1k views
StriveBuys2000BTCFor$169M
4 views
26 Discussing
EvernorthXRPTreasuryCompletesSPACMerger
48,400 views
565 Discussing