
Content
Introduction
What is support and resistance?
How traders use support and resistance levels
Psychological levels of support and resistance
Trend line support and resistance levels
Moving Average Support and Resistance
Fibonacci support and resistance levels
What is confluence in technical analysis?
Summary
Introduction
The concepts of support and resistance are fundamental concepts in technical analysis of financial markets. They apply to almost any market, be it stocks, Forex, gold or cryptocurrency.
Although these concepts are easy to understand, they are quite difficult to master in practice, since the definition of levels is completely subjective and their behavior depends on many conditions. So first of all, it is important to learn to distinguish between their types. To do this, you will have to familiarize yourself with a lot of charts, and this guide will help you.
What is support and resistance?
At the most basic level, support and resistance are simple concepts. To determine them, maximum and minimum price indicators are displayed, acting as some kind of barrier. In this case, the lower values of the chart represent the support level, and the upper values represent the resistance level. Essentially, the support level can be viewed from a demand perspective and the resistance level from a supply perspective.
Despite the fact that support and resistance levels are usually denoted by lines, in reality they usually look different. It should be taken into account that markets are not governed by any physical law that prevents indicators from going beyond a certain level. Therefore, it makes more sense to consider support and resistance levels as areas. You can think of these areas as ranges on a price chart, approaching which is likely to cause increased trading activity.
Let's look at an example with a support level. Please note: the price indicator crosses the support area several times, which was formed as a result of repeated retesting of this area. And since the bears (sellers) failed to push the price down, it eventually bounced up, starting a new uptrend.
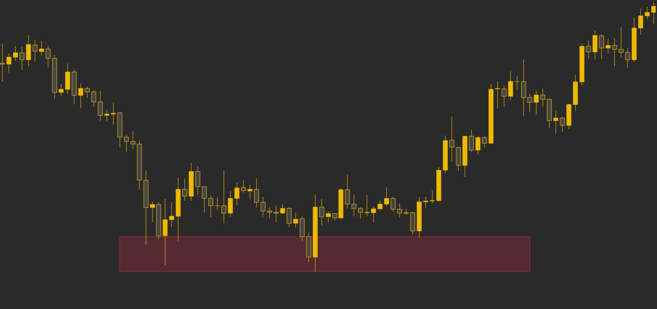
The price in the support level area bounces up before breaking out.
Now let's look at the resistance level. As you can see on the chart, the price was in a downward trend and after each rebound it went down again. The resistance level is formed because the bulls (buyers) failed to gain control of the market and raise the price, which led to the continuation of the downward trend.

The price failed to break through the resistance area.
How traders use support and resistance levels
Technical analysts use support and resistance levels to identify areas of interest on a price chart. At these levels, the main trend is likely to change direction.
Market psychology plays an important role in the formation of support and resistance levels. Traders and investors focus on price levels that previously attracted increased interest and trading activity. These areas will encourage increased liquidity as many traders will be tracking the same price levels. Often, support and resistance zones create ideal conditions for large traders (whales) to enter or exit a position.
The concepts of support and resistance levels are key to effective risk management. Your ability to consistently identify these zones can determine your trading capabilities. Typically, after the price reaches a support or resistance area, two scenarios are possible. It either bounces off that area or breaks through it and continues in the direction of the trend to the next potential support or resistance area.
It is best to enter a trade when the price is near a support or resistance level, mainly due to its relative proximity to the cancellation point where a stop loss order is usually placed. In the event of a breakout of the area and the transaction being declared invalid, traders will be able to reduce their losses, since the further the entry is from the supply or demand zone, the further the point of invalidation of the transaction is.
At the same time, you need to understand how these levels will change depending on changes in the situation on the chart. Typically, a breakout of a support area can turn it into a resistance area. Conversely, a broken resistance area may turn into a support area when it is retested. This pattern is called a support-resistance flip.

The price breaks through the support area, turning it into a resistance area.
The fact that the support area now functions as a resistance area (or vice versa) confirms this pattern. Therefore, the moment of retesting the level is appropriate to enter a position.
The next important aspect is the strength of the support or resistance level. As a rule, the more often the price falls and tests the support level, the higher the likelihood that it will break the lower boundary. Likewise, the more often the price increases and tests the upper boundary, the more likely it is to break through the resistance level.
So, we have looked at how support and resistance levels change in terms of price movement. However, there are other types of support and resistance. Let's take a look at some of them.
Psychological levels of support and resistance
The first type is psychological levels of support and resistance. These areas do not necessarily correspond to any technical pattern, but are expressed in the attempts of the human mind to understand the surrounding reality.
We live in an amazingly complex world. And in an effort to simplify and understand it, we use various methods, for example, rounding numbers. Have you ever found yourself wanting 0.7648 apples? Or asked at the market to weigh 13,678,254 grains of rice?
A similar situation is observed in financial markets, in particular when it comes to trading cryptocurrency, which includes easily divisible digital units. Buying an asset at $8.0674 and selling it at $9.9765 is not the same as buying an asset at $8 and selling it at $10. This is why round numbers can also act as support or resistance on a price chart.
However, everything is not so simple. This phenomenon is well known and is widely used by traders to anticipate changes in support or resistance levels. Leading in this case means placing orders slightly above or below the expected support or resistance level.
Let's look at the example below. When the dollar index (DXY) approaches 100, some traders place sell orders just below this level to ensure that they will be filled. Because traders expect the trend direction to change at 100 and run ahead of that level, the market never reaches it, resulting in a bounce before reaching 100.

The US Dollar Index (DXY) is bouncing short of the 100 mark.
Trend line support and resistance levels
If you have read our article Classical Chart Patterns, you already know that patterns can also act as a price barrier. Below is an ascending triangle holding the price until the pattern breaks out to the upside.

Trend lines that act as support and resistance for the S&P 500 Index.
You can use these patterns to your advantage and identify support and resistance levels that coincide with trend lines. They can be especially helpful if you can detect them early before the pattern fully develops.
Moving Average Support and Resistance
In addition, support and resistance levels are influenced by many other indicators.
One of the simplest examples is the moving average. Many traders use it as an indicator of the overall health of the market, since the moving average acts as a support or resistance level for the price. Moving averages can also be useful for determining the point at which a trend will change direction.

The 200-week moving average for the price of Bitcoin, acting as a support level.
Are you wondering how to get started with cryptocurrencies? Buy Bitcoin on Binance!
Fibonacci support and resistance levels
The levels indicated by the Fibonacci retracement tool can also act as support and resistance.
In the example below, the 61.8% Fibonacci level acts as a support level several times, and the 23.6% level acts as resistance.
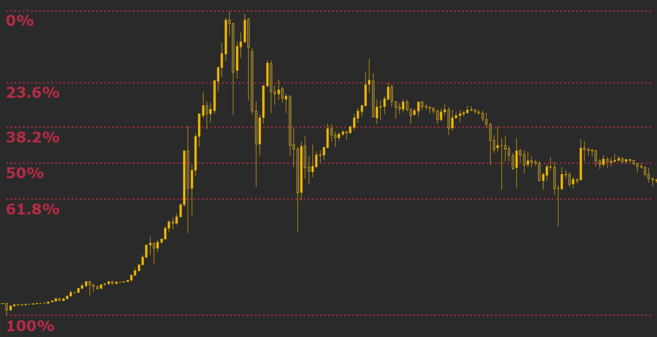
Fibonacci levels can act as support and resistance for the price of Bitcoin.
What is confluence in technical analysis?
We have already talked about what support and resistance are, and also described some types. But how can you use them to effectively select trading strategies?
The most important definition to understand is the concept of merger. Fusion refers to the creation of one strategy by using a combination of several strategies. Support and resistance levels tend to be strongest when they fall into several of the categories we've discussed.
Consider the following two examples. Which potential zone do you think is more likely to act as a support level?
Support Level 1 is the same as:
a level that previously acted as resistance;
significant moving average;
Fibonacci level 61.8%;
round number price indicator.
Support Level 2 is the same as:
a level that previously acted as resistance;
round number price indicator.
If you read the article carefully, you already guessed that “Support 1” has a higher chance of maintaining the price. However, the price may break through it. It's important to understand that this is just saying that it is more likely to become a support level than Support 2. However, there are no guarantees that the situation will develop exactly according to this scenario when it comes to trade. And although trading patterns can be very useful, it cannot be said with complete confidence that indicators will change strictly according to the pattern. Therefore, you must be prepared for any outcome.
Generally, strategies that are backed by multiple other strategies and indicators are the most reliable. Sometimes successful traders who use the concept of confluence are very careful in choosing strategies and therefore have to wait a long time for the right moment. However, when they enter trades, the likelihood of their strategy working is usually high.
However, it is always important to calculate risks and protect your capital from unfavorable price fluctuations, since even the most well-thought-out strategies with timely entry points can develop in a different scenario. It is important to consider the possibility of several possible developments so as not to encounter a false breakout pattern and not fall into bullish and bearish traps.
Summary
Whether you prefer day trading or swing trading, support and resistance are basic concepts that need to be understood to perform technical analysis. In this case, the support level represents the lower limit of the price, and the resistance acts as the upper limit.
There are different types of support and resistance, and some of them are based on the interaction of price with technical indicators. The most reliable support and resistance levels are those that are confirmed by multiple strategies.
If you want to learn more about chart analysis, check out our article 12 Popular Candlestick Patterns Used in Technical Analysis.