

Introduction
Chart patterns are one of the main methods of technical analysis. We have already talked about them in our guide to classic trading patterns and in the publication about 12 popular candlestick patterns and patterns used in technical analysis. However, there are many other technical analysis figures that can be useful for day traders, swing traders and long-term investors. Some of them are the golden cross and the death cross.
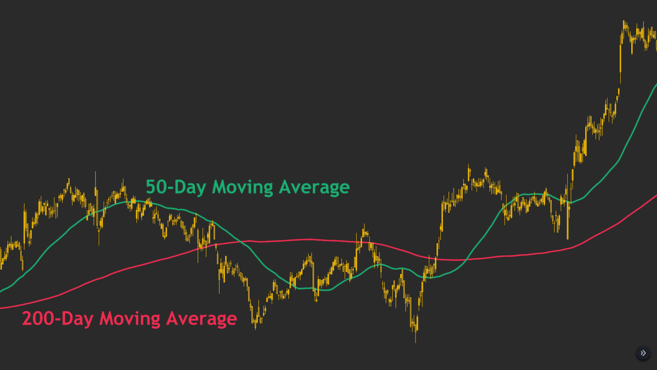
Before we move on to considering these models, it is necessary to understand what an MA (from English - Moving Average) or moving average is. In short, it is a line plotted on a chart that represents the average price of an asset over a certain period of time. For example, a 200-day MA will display the average price of an asset over the last 200 days. If you want to learn more about the moving average, see the article: Moving Average Explained.
So, what are the golden cross and death cross, and how can traders use them in their trading strategy?
What is a golden cross?
The golden cross is a graphic pattern that represents the intersection of short-term and long-term moving averages from bottom to top. Typically, the 50-day MA is used as the short-term average and the 200-day MA is used as the long-term average. But this is not the whole essence of the golden cross. A crossover can occur at any time, and the basic idea is that the short-term average crosses the long-term average, thereby generating a buy signal.
As a rule, a golden cross is formed in three stages:
The short-term moving average is below the long-term moving average during a downtrend.
The trend takes the opposite direction, and the short-term moving average crosses the long-term one.
An uptrend begins where the short-term MA rises above the long-term MA.

A golden cross indicating a new Bitcoin uptrend.
In many cases, the golden cross can be considered a bullish signal. Why is this happening? In fact, everything is very simple. We know that a moving average measures the average price of an asset over a certain period. Therefore, when the short-term moving average is lower than the long-term moving average, the short-term price change is bearish compared to the long-term price.
But still, what happens when the short-term average crosses and rises above the long-term average? When the short-term line rises above the long-term line, it indicates a potential shift in the direction of the market trend, which is why the golden cross is considered to signal the start of a bullish trend.
The basic configurations of this strategy use the 50-day MA crossing the 200-day MA. Do not forget that the basis of this model is the intersection of the short-term and long-term average lines from bottom to top. Therefore, we can also detect golden crosses occurring on other time frames (15 minutes, 1 hour, 4 hours, etc.). However, signals on a large time frame are often more reliable than on a small one.
Until now, we have looked at the golden cross from the side of a simple moving average or SMA (Simple Moving Average). However, there is another popular calculation method, and this is the exponential moving average or EMA (from the English Exponential Moving Average). In this case, a completely different formula is used, which focuses on recent price changes.
The EMA can also be used to identify bullish and bearish crossovers, including the golden cross. Because the EMA reacts more quickly to recent price changes, the reversal signals generated may be less reliable along with more noise/false signals. Despite this, EMA is a fairly popular tool among traders in determining the direction of the trend.
What is the death cross?
The death cross is the direct opposite of the golden cross. This chart assumes a short-term moving average that crosses the long-term moving average from top to bottom. For example, the 50-day MA crosses the 200-day MA from top to bottom. Typically, the death cross is considered a bearish signal.
There are three main stages in the formation of a death cross:
The short-term MA is higher than the long-term MA during an uptrend.
The trend changes its direction, as a result of which the short-term moving average crosses the long-term moving average from top to bottom
A downtrend begins when the short-term MA becomes lower than the long-term MA.

Death cross confirming Bitcoin's downward trend.
Now that we understand what a golden cross is, it is quite easy to understand why a death cross is a bearish signal. The short-term average crosses the long-term average from top to bottom, indicating possible bearish sentiment in the market.
The death cross was a bearish signal before the biggest economic declines in history, such as 1929 or 2008. However, it can also produce false signals, such as in 2016.
False death cross signal on SPX in 2016.
Based on this example, the market shows a death cross, which only activated the uptrend and then formed a golden cross.
Golden cross and death cross - what's the difference?
We have discussed both of them, so the difference is not difficult to understand. In fact, they are direct opposites of each other. The golden cross can be considered a bullish signal, while the death cross can be considered a bearish signal.
Each pattern can confirm the validity of its signal through large trading volume. In turn, some analysts use additional technical indicators to confirm the correctness of the market trend change. Common additional analysis tools are Moving Average Convergence Divergence (MACD) and Relative Strength Index (RSI).
It is also important to remember that moving averages are lagging indicators and cannot predict the future situation. This means that both crossovers tend to be strong confirmation of a change in a trend that has already arrived and is not yet expected.
➟ Do you want to start using cryptocurrency? Buy Bitcoin on Binance!
How to Use the Golden Cross and Death Cross When Trading
The basic idea of such patterns is quite simple. If you understand how traders use the MACD, you can easily spot signals like these that indicate a market reversal.
When we talk about the golden and death crosses, we pay attention to the daily chart. Based on this, a simple strategy could be to buy at the golden cross and sell at the death cross. In fact, this would have been a relatively successful strategy for Bitcoin over the past few years, despite there being many false signals along the way. Thus, blindly following one indicator is not the best trading strategy and this is why you need to consider using other additional tools when it comes to market analysis methods.
If you'd like to learn a simple strategy for building long-term positions, we encourage you to take a closer look at our next publication: "What is Dollar Cost Averaging (DCA)?"
The crossover strategy mentioned above is based on daily moving average crossovers. But what about other time periods? On smaller time frames, gold crosses and death crosses form in exactly the same way, and traders can also benefit from this.
However, as with most analysis methods, signals on larger timeframes are more reliable. The golden cross can be displayed on the weekly timeframe, at the same time as the death cross has formed on the hourly timeframe. This is why you should always zoom out on a graph and look at the bigger picture, taking into account more truthful information.
What many traders will also look for along with the golden cross and death cross is trading volume. As with other chart patterns, volume can be a powerful signal confirmation tool. Thus, when a jump in volume is accompanied by a reversal signal, many traders will be more confident that the signal is valid.
Once the golden cross appears, the long-term MA can be viewed as a potential support area. Conversely, after a death cross has formed, the long-term MA can be viewed as a potential resistance zone.
Possible crossover signals can also be cross-checked with signals from other technical indicators to find matches. Most traders combine a variety of signals and indicators in one trading strategy in an attempt to form one more reliable signal.
Conclusion
We discussed some of the most popular crossovers, the golden cross and the death cross.
The golden cross involves the crossover of the short-term moving average and the long-term moving average from bottom to top. The death cross involves the intersection of the short-term MA and the long-term MA from top to bottom. They can both be used as reliable tools to confirm long-term trend changes, be it the stock market, forex or cryptocurrency.
If you still have questions about trading trend reversal signals (crossovers), such as the golden cross and death cross, check out our Q&A platform called Ask Academy, where the Binance community will answer all your questions.