

Carefully! Lots of text.
The Hammer is one of the most used candlestick patterns in technical analysis. It is used not only in cryptocurrency, but also when trading stocks, indices, bonds, and Forex trading. Price movement traders use a hammer to identify reversal points following a bullish or bearish trend. Depending on the context and time frame, the pattern can indicate a bullish reversal at the end of a downtrend or a bearish reversal after an uptrend. When combined with other technical indicators, the hammer can help identify entry points for long and short positions.
Bullish candlestick patterns include the hammer and inverted hammer, which appear after a downtrend. Bearish patterns include the hanging man and shooting star patterns, which appear after an uptrend.
Introduction
"Hammer" works well in various financial markets. This is one of the most popular candlestick patterns that traders use to assess the market situation when analyzing price movements.
When combined with other market analysis tools such as fundamental analysis, the hammer can provide insight into trading opportunities. In this article we will talk about what the hammer candlestick pattern is and how to use it in trading.

How candles work
Each candle on the chart corresponds to a specific time interval. For example, on a daily chart, each candle represents one day of trading activity. And if you take a 4-hour chart, the candle will correspond to 4 hours of trading.
Each candle has an opening price and a closing price that form its body. Candles also have a vertical line (shadow) that indicates the highest and lowest prices for the selected period.
If you are just starting to learn candlestick charts, we recommend checking out our article on Candlestick Charts. Beginner's Guide.
What is the hammer candlestick pattern?
The Hammer looks like a candle with a small body and a long vertical line at the bottom, which should be at least twice the size of the body. A long lower vertical line indicates that sellers first lowered the price and then buyers raised it above the opening price.
Below are the opening price (1), the closing price (2), and the highs and lows that form the vertical line (3).

Bullish Hammer
Hammer candlestick pattern
A bullish hammer forms when the closing price exceeds the opening price, indicating that buyers were in control of the market until the end of the trading period.

Inverted Hammer Candlestick Pattern
An inverted hammer is formed when the opening price is lower than the closing price. A long vertical line above the body indicates that buyers tried to push the price up, but it ended up moving down. Although the inverted hammer is not as clear an example of a bullish pattern as the regular hammer, it is also a bullish reversal pattern that appears after a downtrend.

Bearish hammer
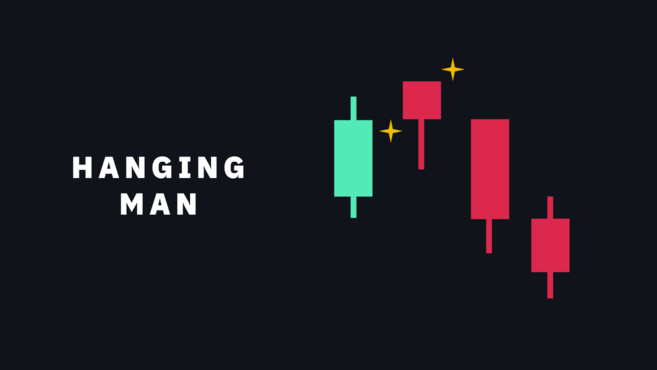
Hanging Man candlestick pattern
A bear's "hammer" is called a "hanging man." It is observed when the opening price exceeds the closing price and forms a red candle. The vertical bearish hammer line indicates selling pressure suggesting a potential downward reversal.
Shooting Star Candlestick Pattern
The bearish “inverted hammer” is called a “shooting star.” It looks like a regular "inverted hammer" but indicates a bearish reversal. In other words, the shooting star pattern acts like an inverted hammer that occurs after an uptrend. It is formed when the opening price is higher than the closing price and the vertical line indicates that the market's upward movement may be coming to an end.

How to use a hammer to identify trend reversals
A bullish hammer appears as a result of bearish trends and indicates a potential price reversal after reaching a low point. Below is a bullish hammer (image from TradingView).

A bearish hammer can be represented by a hanging man or a shooting star pattern. They appear after bullish trends and indicate a potential reversal towards a downtrend. Below is the Shooting Star pattern (image from TradingView).
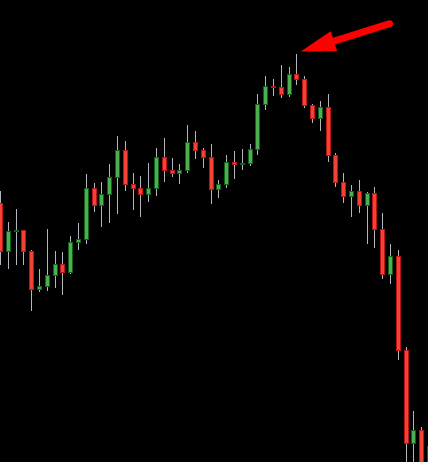
Thus, to use the hammer, you need to take into account the position of the pattern in relation to the previous and next candles. Depending on the context, the reversal pattern will be confirmed or denied. Let's look at each “hammer” in more detail.
Pros and cons of the hammer candlestick pattern
Each candlestick pattern has pros and cons. No technical analysis tool can guarantee profit in any financial market. The hammer candlestick pattern should be used in conjunction with other trading strategies such as moving averages, trendlines, RSI, MACD and Fibonacci.
pros
"Hammer" is suitable for identifying potential trend reversal points in any financial market.
Traders can apply the hammer to multiple time frames, allowing them to be used for swing trading and day trading.
Minuses
The hammer candlestick pattern depends on the context. There is no guarantee that a trend reversal will occur at the indicated points.
The Hammer itself is not very reliable. Traders need to combine it with other strategies and tools to increase their chances of success.
“Hammer” and “Doji”: what is the difference
A “Doji” looks like a “hammer” without a body: a Japanese Doji candle starts and ends at the same price. While a hammer indicates a possible trend reversal, a doji usually suggests consolidation, trend continuation, or market indecision. The Doji is often a neutral pattern, but in some situations it can indicate bullish or bearish trends.
The Dragonfly Doji looks like a hammerhead or hanging man without a body.

A “Tombstone Doji” is similar to an “inverted hammer” or a “shooting star.”

By themselves, the hammer and doji can show little. You should always consider context, such as the market trend, previous candles, trading volume, and other metrics.

Summary
While the hammer candlestick pattern is a useful tool in helping traders identify possible trend reversal points, it is not necessarily a buy or sell signal on its own. Like other trading strategies, the hammer is more effective when combined with other analysis tools and technical indicators.
Use sound risk management techniques when assessing risk versus reward. We also recommend using stop loss orders to avoid large losses during periods of high volatility.