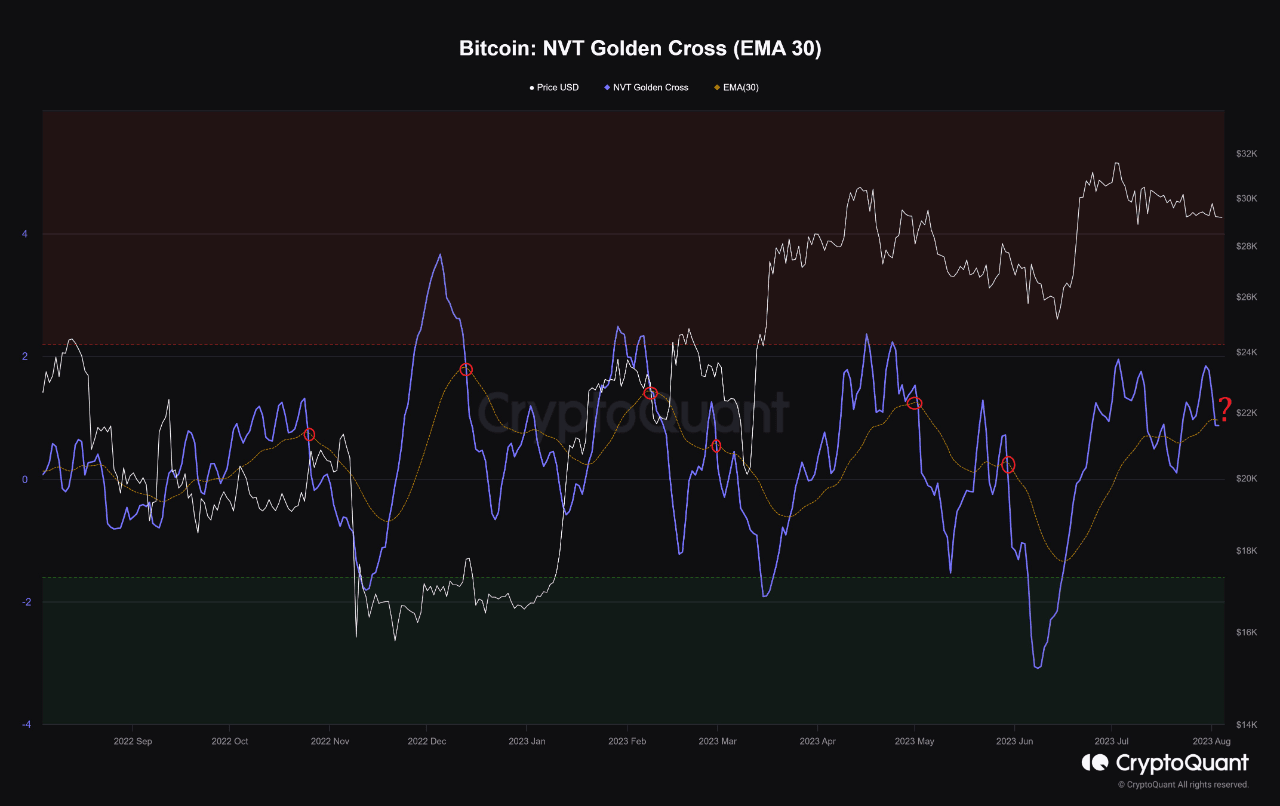

The NVT (Network Value to Transaction) Golden Cross is an indicator that compares the long-term and the short-term trends of the NVT ratio to identify local tops and local bottoms in the metric. EMA (Exponential Moving Average) is measuring trend direction over a period of time, respectively a period of 30 days in our chart. In the chart, the relation between NVT Golden Cross and EMA 30 is tighten correlated and it is showing that usually when EMA 30 has crossed the NVT line, we had a price correction. It seems the long term holders have been possibly selling recently and it might suggest that Bitcoin may soon be seeing some bearish volatility.
Written by SimonaD