
After hitting a low of 24,800 on June 15, it experienced a period of volatile consolidation, and began to rise strongly on June 20. It took only three days to break through the high of 31,000 and reach 31,431 at lightning speed.
The power of the strongest bullish trend of the daily level 2-3 merger has begun to show! From the low point of 24800 to the new high, it is just a daily upward stroke, and it has not been confirmed that this stroke has been completed. The establishment of the daily level 2-3 buy merger indicates that the future market will be controlled by bulls. As for where this period can rise, it involves prediction, but if a point must be given, this account believes that there is a chance to challenge the lower edge of the left center of the daily level near 33000.
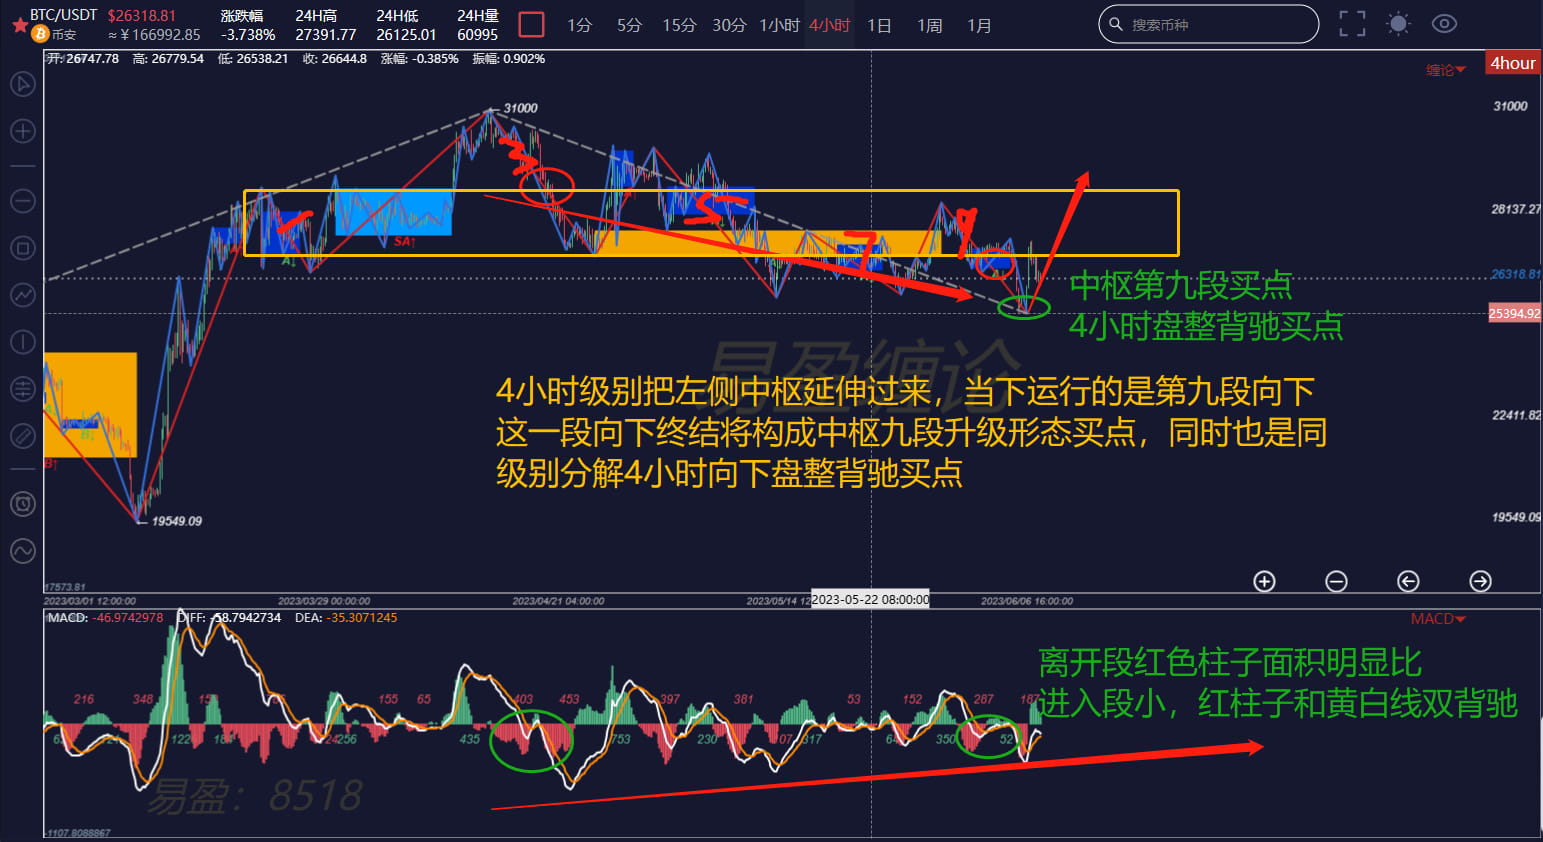
In the article on June 8, this account made a detailed deduction from the daily level and the 4-hour level, and emphasized that during the decline, the spot should be arranged in batches and at least 20-30% of the spot position must be maintained, just to prevent a sudden explosion. We can't buy at the bottom, so we can only deal with it by position management! The article on June 8 is of great guiding significance for operations. If you are interested, you can go back and review it:

The 4-hour deduction chart is even more classic. At that time, the 4-hour central nine-stage upgrade surge pattern had been made, but the strength was not expected to be so strong. The following is the deduction chart at that time:
Back to the current market, let’s look at the daily chart first:
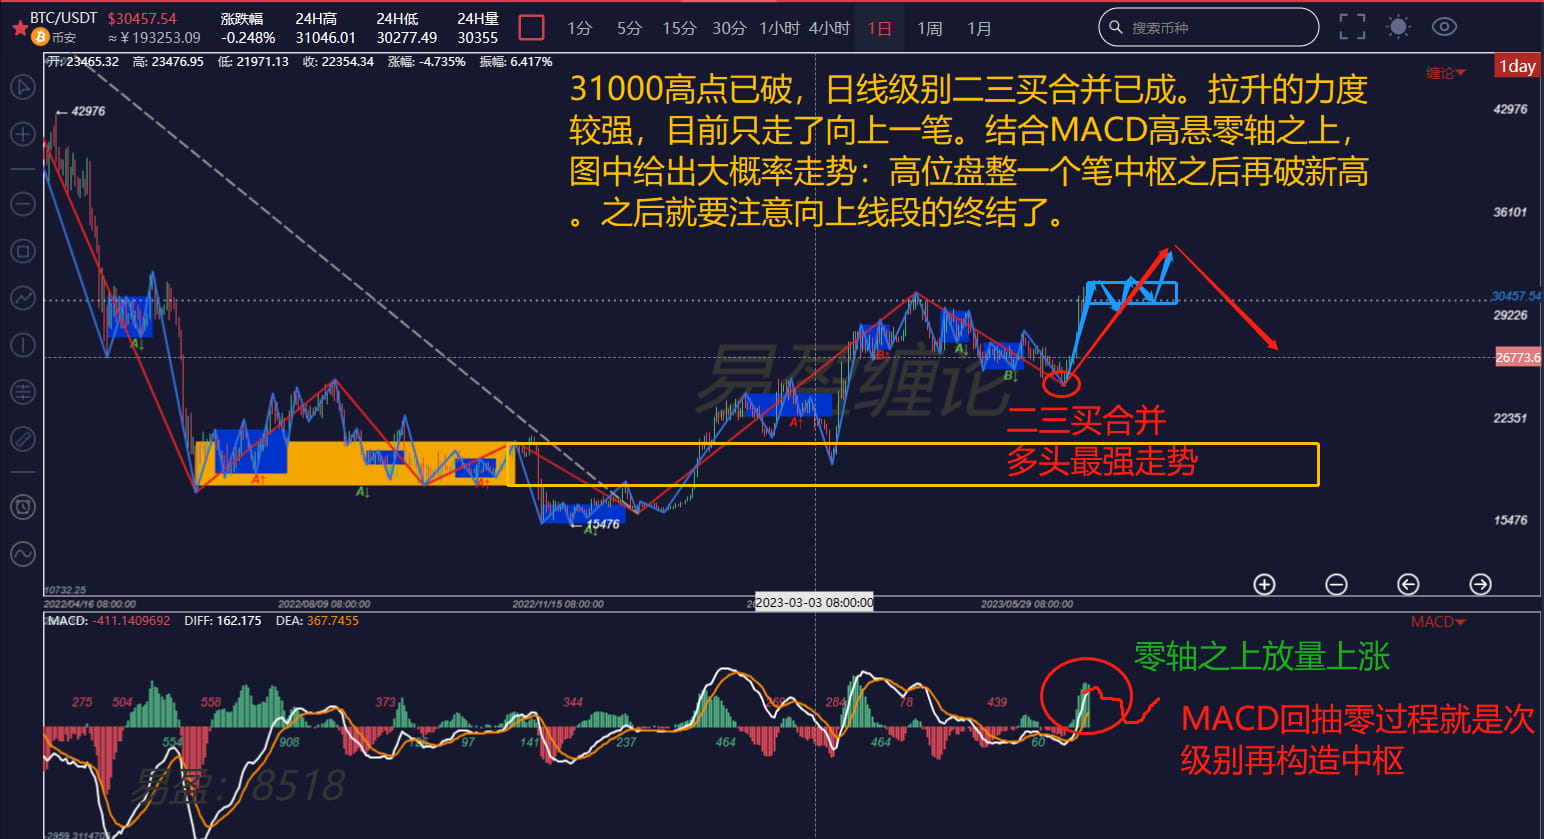
From the daily chart, the daily level 2-3 buy and sell has been confirmed after breaking the new high, and now it is just the first transaction in the daily upward segment. The figure shows the trend with high probability. Here, combined with the MACD pattern of high-level oscillation, a center will be formed and it will rise again. Once the interval set structure appears inside the upward segment, consider reducing the position.
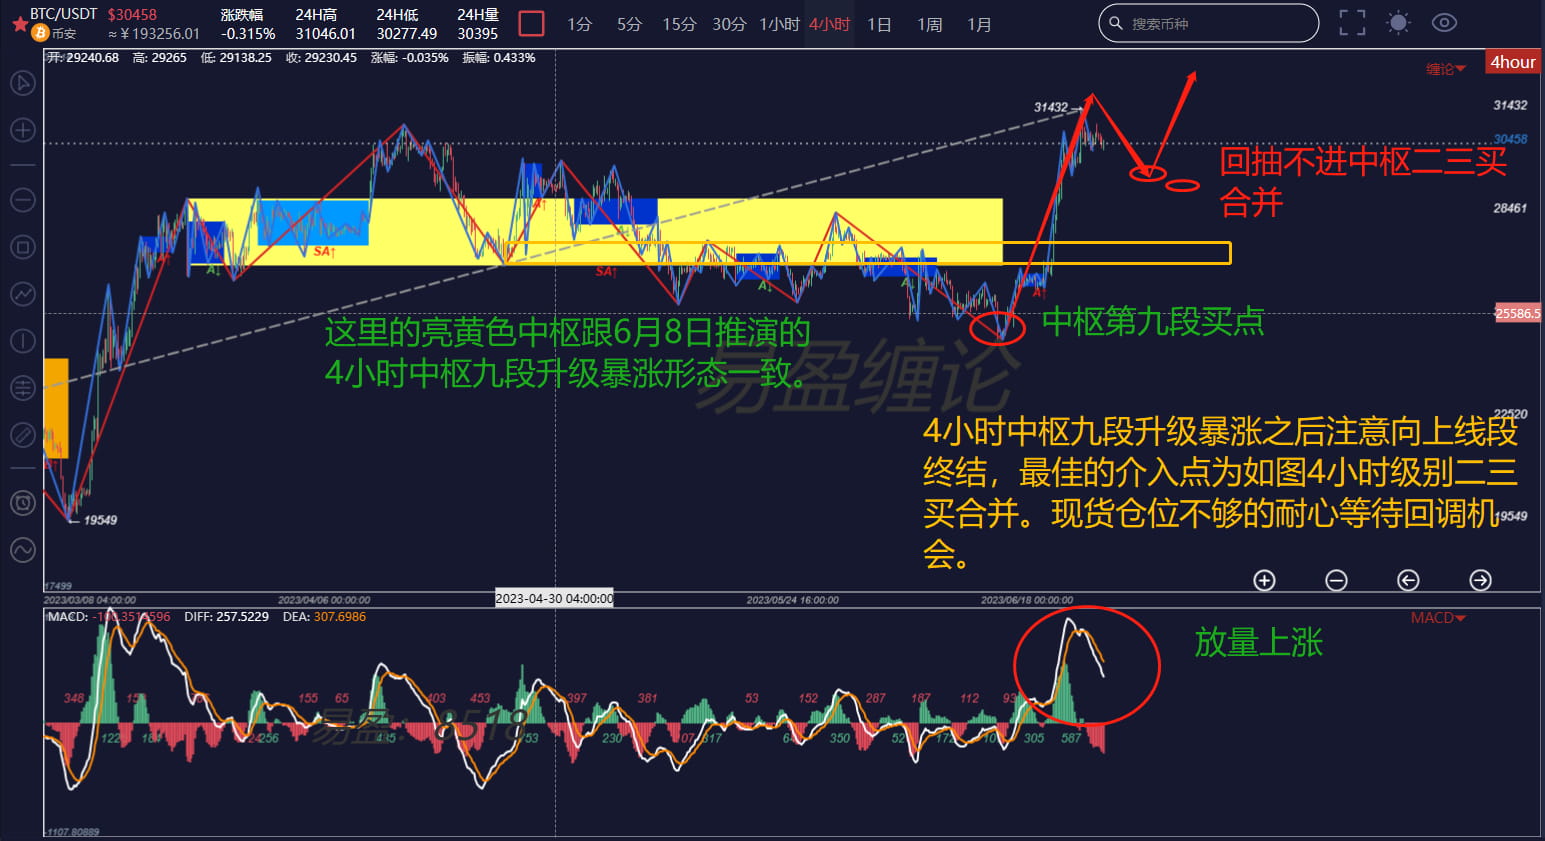
Looking at the 4-hour chart again, this chart is basically consistent with the 4-hour chart on June 8! The focus now is when the ninth upward line segment of the 4-hour chart ends. If the downward pullback fails to enter the central axis, the second and third buy mergers are the key positions we need to intervene. If you missed the opportunity or did not have enough positions before, wait patiently for this 4-hour buy point to get on the train firmly! The chips that got on the train at a low position continue to hold, and those with heavy positions can do short spreads at the 30-minute selling point, waiting for the 4-hour buy point to appear.
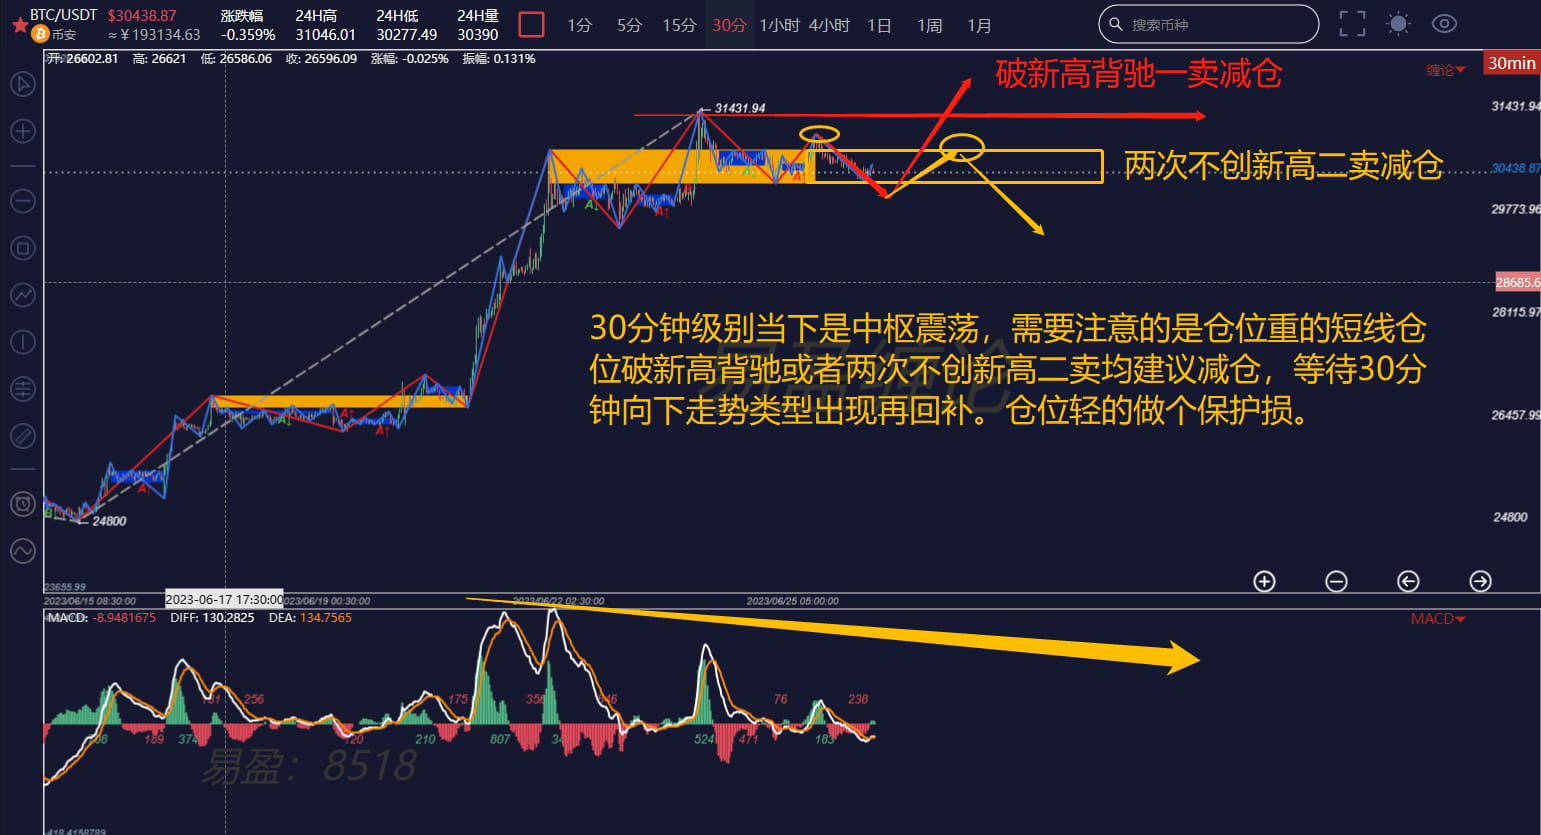
Finally, let's look at the 30-minute chart. In 30 minutes, there have been two central upward trends, which can end at any time. Pay attention to the two selling points marked in the chart. Short-term positions can use the selling points to reduce positions and wait for the 30-minute downward trend type to buy points to cover positions. Those with light positions can ignore the 30-minute selling points and wait for the 30-minute downward trend type to appear consolidation divergence to add positions.
The above analysis is for reference only and does not constitute any investment advice!