



Many of my friends seem to be confused in recent days. Some of them even left messages asking me: How much will it fall back to later? Should I sell it now?
I think it would be more helpful to ask yourself this question first: Are you planning for the long term or the short term? What is your expected goal? Do you really understand what you are buying?
As of this writing, the price of the pie is $64,000, and if you choose to sell it now:
The first case: profit understanding
If 64,000 is your expected target, then just sell it directly. If it is not your expected target, or you want to sell it first and buy it back when it retrace to 5, then you should think again, why did you choose to buy the cake in the first place? What is the basis for you to sell it at 64,000? Why do you think the cake will retrace to 5? If the cake rises from 64,000 to 100,000, do you want to buy it again?
If you can figure out the above problems, then you can sell it directly, and buy low and sell high, or choose to chase high again. These are all reasonable choices within your own cognition.
The second situation: Cut losses and leave the market
If you bought your pie at above 70,000, you seem to be standing at the top of the mountain now, and you are worried that there will be a bigger pullback in the future, so you choose to sell it first, and then buy it again when it pulls back to the lowest level.
In addition to the issues you need to consider in the first situation above, your operation also proves that you have become a "qualified" leek, and the market likes people like you who chase rising and falling prices.
The three characteristics of ordinary leeks: chasing highs when the price goes up, selling at a loss when the price goes down, and clearing out the position when the investment is recovered.
Let's go back to the current market. Since the price of the pancake reached ATH, it has entered a state of consolidation. If it rises too much, it will naturally need to stop and sort out. This is also the basis for a larger rise later. During the consolidation period, the purpose of the price range change is to make those undetermined market participants hand over their chips. Moreover, during this period, the market will also intimately create various news for you to analyze, and then hope that you will carefully analyze and find your own reasons to obediently hand over your chips.
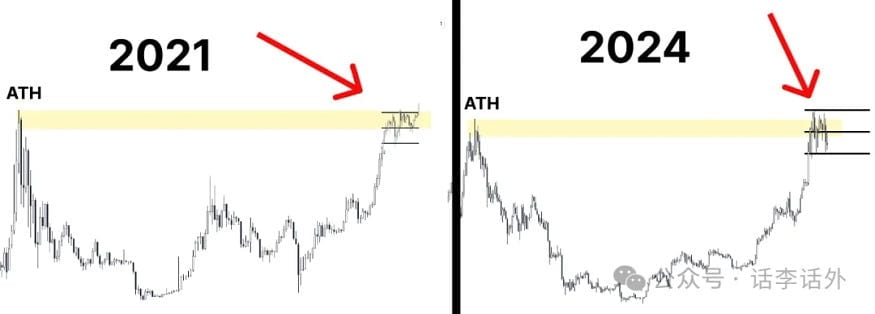
(Image from Reflection)
1. Questions about the USDT.D indicator
In addition to combining the reasons from the news, some rational people may also use other indicators to make analysis to decide whether to increase or liquidate their positions. For example, yesterday I saw a friend in the group also shared a USDT.D indicator. As shown in the figure below.
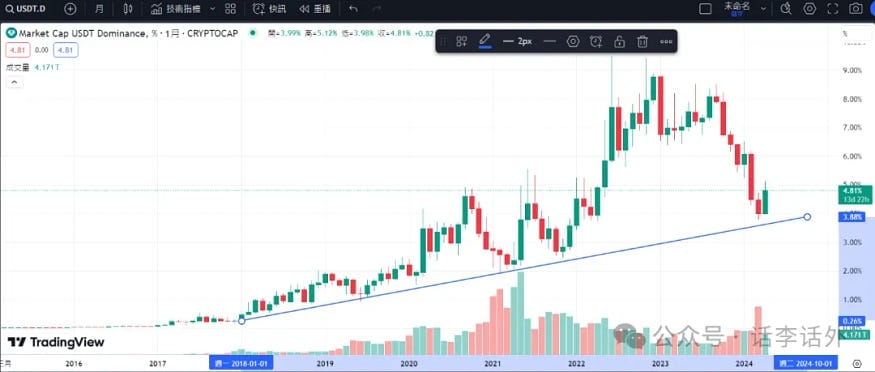
So, is this indicator useful?
Of course, it is useful. Since any indicator can exist and become popular for a long time, it must have its value and significance. We need to be tolerant of everything. For example, from the above figure, we can clearly see that USDT.D has touched the trend line several times, and the approximate time is:
USDT.D hit bottom in July 2019, when Bitcoin was around $10,000
USDT.D hit bottom in April 2021, when Bitcoin was around $60,000.
Recently, it seems that USDT.D may hit bottom again, and the current price is around $64,000.
So, now there are some opinions based on this indicator on the Internet, and I have recently seen some so-called analysts use this indicator to call for everyone to quickly clear their positions. Logically speaking, this statement seems to be correct, but you still need to consider the question at the beginning of my article: Are you planning for the long term or the short term? What is your expected goal? Do you really understand what you are buying?
If you only rely on a single indicator to guide all your trading behaviors, this approach itself cannot be said to be wrong, but I think it is somewhat limited. Especially for some large-cycle indicators, such as USDT.D or AHR999, it may be more meaningful to use them for long-term fixed investment guidance.
According to my personal operating habits, when USDT.D hits the bottom and starts to rebound, it theoretically means that people are turning to a stable preference. In other words, the market will show a bearish signal. But I am a long-term investor. Isn't this the signal I am waiting for? When USDT.D is in an upward trend, I continue to buy the targets I like in batches at a lower price and set expectations. When USDT.D starts to fall again, when others are starting to buy FOMO, I start to sell in batches. In this process, I make money from the cycle and the anti-crowd trend. In addition, I have a good understanding of the targets I like (such as Bitcoin), so I can hold on to them for a long time and ignore any short-term fluctuations (I will not be washed out during the shock process).
In fact, this idea is similar to my idea of hoarding Bitcoin: buy Bitcoin in a bear market and sell Bitcoin in batches in a bull market. Of course, the above is only theoretical, because I will not make any more transactions at this stage. After the last increase in Bitcoin in January this year, I have ended this round of fixed investment (fixed investment has lasted for 20 months since 2022, with one increase in position per month), and the 80% position previously reserved for Bitcoin is now full.
At this point, some new partners may not understand the USDT.D indicator. In fact, this indicator has been introduced in Li Huawai’s previous articles. The general idea of this indicator is:
USDT.D rises → People turn to stability → Bearish signal
USDT.D falls → people start to chase risk → bullish signal
But there are two points to consider for this indicator:
First, the basic logic of this indicator is based on the premise that "market liquidity mainly comes from Stablecoin". If you believe that ETFs funds are the main force driving market liquidity, then this indicator may not be very accurate.
The second is the issue of USDT’s own market capitalization share.
The first one is easy to understand. As for the issue of USDT's share, the total market value of stablecoins in the current crypto market is $156 billion, of which the top three USDT is $108.8 billion, USDC is $32.6 billion, and DAI is $5.3 billion. USDT accounts for 70%, USDC and DAI account for 20% and 3% respectively. So in theory, because USDT accounts for a large proportion, observing the inflow/outflow of USDT can show some trends in the crypto market to a certain extent.
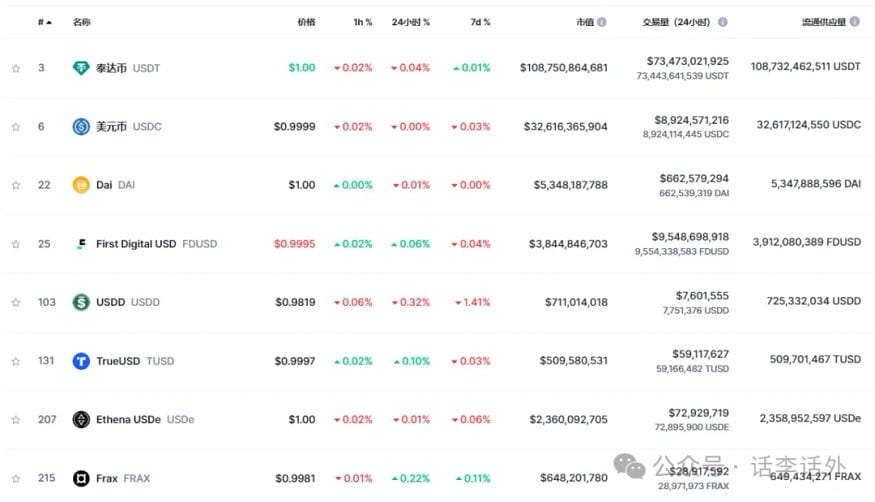
But if you want to use the category of Stablecoin to judge some possible trends in the market, then adding up the market value of major Stablecoins such as USDT + USDC and then making a judgment may be relatively better and more accurate.
There is another possible point. Why do you think that the current trend line of USDT.D will not be broken? If it is not broken, it may face further correction, which means we still need to wait for new opportunities in the bull market. If it is broken, then the crazy bull market will officially start.
2. Issues regarding Stablecoin and liquidity
The USDT.D above is the ratio of USDT market value to the total market value of the crypto market (i.e., percentage). Next, we will still use Stablecoin to compare historical data from a different perspective (only USDT + USDC is counted below) to see what we can find:
In December 2020, Bitcoin broke through the ATH and reached a new high of $29,244, when the market value of Stablecoin was about $24.3 billion. During this period, the market value of Stablecoin also rose rapidly, especially since 2020, which may also be directly related to the massive money injection after the COVID-19 pandemic. As shown in the figure below.
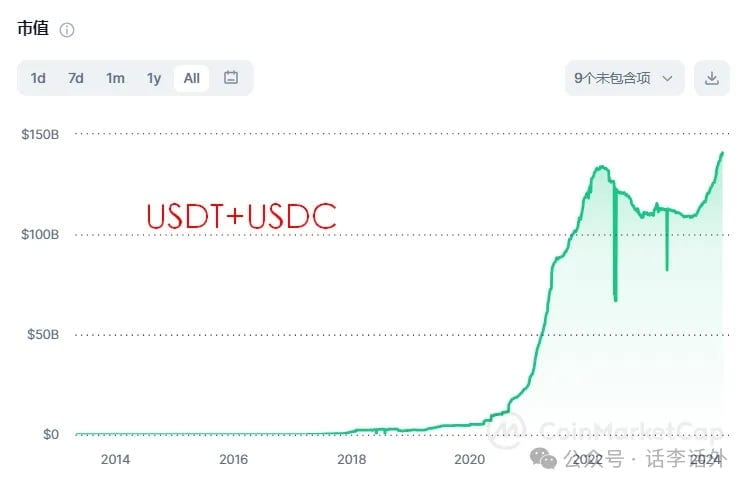
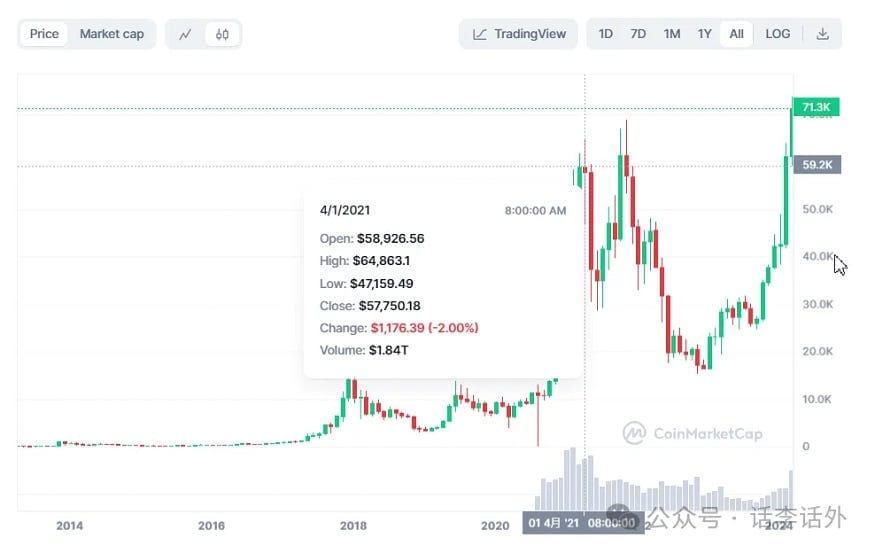
Moreover, starting from December 2020, Bitcoin also rose all the way until the top of the bull market at that time, and the price reached a new ATH of $64,863 in April 2021. As shown in the figure below. At the same time, the market value of Stablecoin also reached $60 billion.
Let’s continue looking at:
Since the Bitcoin price peaked at 68789 in November 2021, the market value of Stablecoin has also reached 110 billion US dollars. From then until today, the total market value of Stablecoin first showed a period of growth in the early stage of the bear market, from 110 billion US dollars to 133 billion US dollars, and then shrank for a relatively long time (from April 22 to September 23) after reaching the peak, from 133 billion US dollars to 109 billion US dollars. This process is also the entire bear market of this cycle.
In March of this year, Bitcoin broke through the ATH again and reached a new all-time high of $73,750. At that time, the total market value of Stablecoin was about $132 billion. In other words, compared with the highest market value of $1,330 in April 2022, it has shrunk to a certain extent.
In other words, this bull market is very different from the previous bull market in terms of Stablecoin liquidity. Bitcoin’s breakthrough to a new high is not entirely dependent on the growth of Stablecoins in the market. Bitcoin directly broke through the previous high when Stablecoin liquidity barely grew.
From the above perspective, it is not difficult for us to understand why some people say that this round of bull market is a Bitcoin bull market (ETFs bull market), because Bitcoin can directly break through the previous high without the growth of stablecoin liquidity in the market. A big factor in this should be the stimulus brought by the passage of ETFs. This stimulus includes both the inflow of ETF funds brought in by institutions and the positive market sentiment brought about by the passage of ETFs.
So how much inflow has the ETF brought in so far? Let's continue with the following chart:
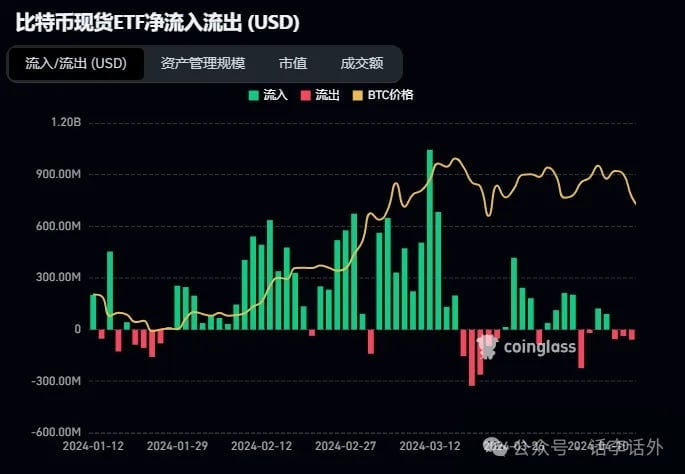
Since the spot ETF was approved in January this year, up to now, ETFs have received a total net inflow of $12.438 billion. However, if we compare this $12.438 billion with the total market value of the current crypto market (US$2.4 trillion), it only accounts for about 0.5%.
In short, the current breakthrough of Bitcoin occurred when the overall market liquidity was relatively lacking, and was more based on the stimulus brought by the passage of ETFs. In this situation where overall liquidity is already lacking, once Bitcoin faces a slightly larger correction, or there is a continuous outflow of ETFs, the phenomenon of oversold altcoins can be understood, because the root cause of the market's rise and fall is actually determined by liquidity.
Next, let’s do a simple calculation:
In the last cycle, the total market value of the crypto market was $560 billion when Bitcoin first broke through its previous high in 2020, and the total market value of the crypto market was $3 trillion at the peak of the bull market in 2021. The market value of Stablecoin increased from $24.3 billion to $110 billion, accounting for 4.3% and 3.7% of the market value respectively.
In this cycle, the total market value of the crypto market will be $2.9 trillion when Bitcoin breaks through the previous high in 2024. You think the total market value of the crypto market will reach ? trillion US dollars at the peak of the bull market in 2024/2025. The market value of Stablecoin needs to grow from $132 billion to ? trillion US dollars, accounting for 4.6% and ?% of the market value respectively.
I don't know the exact result, you can guess for yourself.
In short, the short-term market trend cannot be accurately predicted, and the so-called short-term prediction is nothing more than a guess based on personal experience or historical data. Moreover, all predictions are subjective, including any article I write. Prediction is more of a probability study. The use of any indicator is based on historical data as an auxiliary reference to increase the success probability of your operation. If you put this cycle longer, then your success probability may increase accordingly. For example, if you operate on the weekly K-line, it will definitely be easier to make money than if you operate on the minute K-line, but this process requires a longer cycle.
In the long run, long-term holders can easily outperform frequent traders. Therefore, we can completely ignore short-term fluctuations. At this stage, continue to hold on to your cake, fasten your seat belts, and enjoy the thrill of the roller coaster. The end is not yet reached, so just continue to wait patiently.
What the bull in the current market really needs is more "water". You just need to keep an eye on the source of the water, such as the growth of Stablecoins, the inflow of funds into ETFs, and the monetary policy of the US dollar.
Okay, we will share the content of this issue here for now. This is the 442nd article updated by Huali Huawai. We will continue to bring you more related sharing in the future. Those who are interested can check and learn more content through Huali Huawai.
Note: The above content is only a personal point of view and analysis, and is only for popular science learning and communication purposes. All projects mentioned in the title or text have no interest relationship with Hualihuawai, and do not constitute any investment advice. The crypto market is an extremely high-risk area, please treat it rationally, improve risk prevention awareness, and abide by the relevant laws and regulations of the country and region where you are located!