
Content
Introduction
Relative Strength Index (RSI)
Moving average (MA)
Moving Average Convergence/Divergence (MACD)
Stochastic RSI (StochRSI)
Bollinger Bands (BB)
Final thoughts
Introduction
Traders use technical indicators to gain additional information about the price movement of an asset. These indicators make it easy to spot spot buy or sell patterns and signals in the current market environment. There are many different types of indicators and they are widely used by day traders, swing traders and sometimes even long term investors. Some professional analysts and advanced traders even create their own indicators. In this article, we will provide a brief description of some of the most popular technical analysis indicators that can be useful in any trader's market analysis tools.
1. Relative Strength Index (RSI)
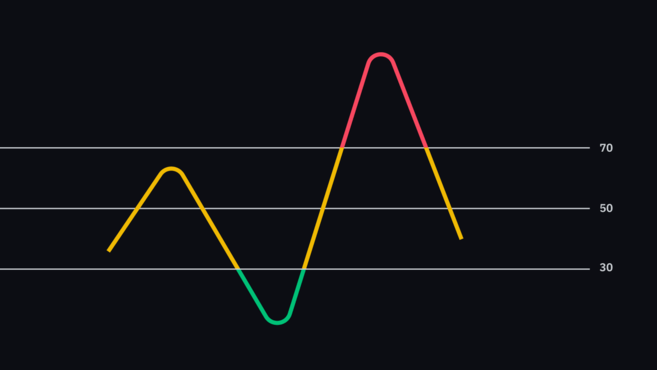
RSI is a momentum indicator that provides indicators on the basis of which you can conclude: an asset is overbought or oversold. This is achieved by measuring the magnitude of recent price changes (the default setting is 14 previous periods, 14 days, 14 hours, etc.) The data is then displayed as an oscillator that can range from 0 to 100.
Since the RSI is a momentum indicator, it shows the strength with which the price changes. This means that if the indicator is increasing when the price is rising, the uptrend is strong and more and more buyers are coming. Conversely, if the measure of the indicator is decreasing and the price is increasing, this may indicate that sellers may soon gain control of this market.
The traditional interpretation of the RSI is that when it is above 70, the asset is overbought, and when it is below 30, the asset is oversold. Thus, extreme values may indicate an approaching trend reversal or pullback. However, it is best not to think of these values as a direct buy or sell signal. Like many technical analysis (TA) techniques, the RSI can give false or misleading signals, so it's always a good idea to consider other factors before entering a trade.
Want to learn more? Check out our article on the Relative Strength Index (RSI).
2. Moving average (MA)
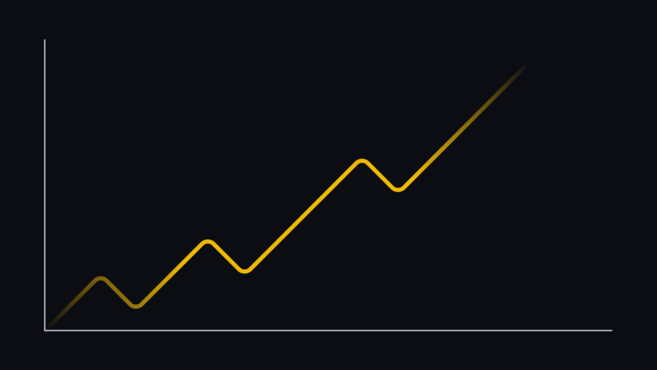
A moving average smooths out price action by filtering out market noise and highlighting the direction of the trend. Since it is based on past price data, it is a lagging indicator.
The two most commonly used moving averages are the Simple Moving Average (SMA or MA) and the Exponential Moving Average (EMA). SMA is formed on the basis of price data for a certain period and their average value. For example, a 10-day SMA is constructed by calculating the average price over the past 10 days. In turn, the EMA gives more weight to recent price data. This makes it more sensitive to recent price changes.
As already mentioned, the moving average is a lagging indicator. The longer the period, the greater the signal delay. Therefore, the 200-day SMA will react much more slowly to a recent price change than the 50-day SMA.
Traders often use the relationship of price to certain moving averages to gauge the current market trend. For example, if the price remains above the 200-day SMA for an extended period, many traders may view the asset as being in a bull market.
Traders can also use crossings or so-called crossovers of moving averages as a signal to buy or sell. For example, if the 100-day SMA crosses the 200-day SMA, it can be seen as a sell signal. But what exactly does this cross mean? This indicates that the average price of the last 100 days is now lower than the average price of the last 200 days. The selling idea here is that short-term price movements no longer follow an uptrend and in most cases the trend can reverse.
Want to learn more? Check out our article on the Moving Average
3. Convergence/divergence of moving averages (MACD)
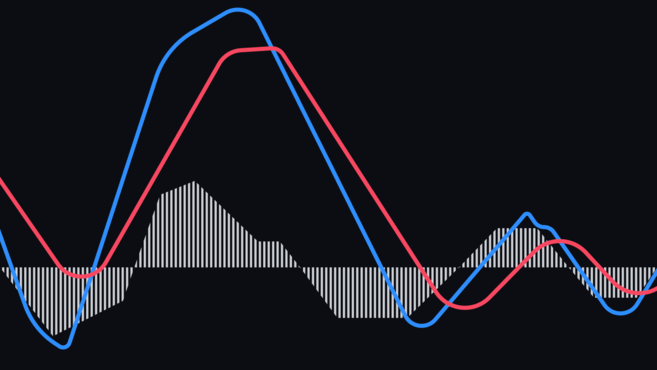
MACD is a technical indicator designed to determine the future price movement of an asset using the relationship of two moving averages. It consists of two lines: the MACD line and the signal line. The MACD line is calculated by subtracting the 26-day EMA from the 12-day EMA, after which this result is plotted on the chart of the 9-day EMA, which acts as a signal line. Many charting tools often include a histogram that shows the distance between these signal lines.
By looking for divergence between the MACD and the price movement, traders can get an idea of the strength of the current trend. For example: the price is showing a new high, while the MACD is showing very low readings, this suggests that the market may turn around soon. Thanks to these indicators, we can conclude that with such a high price and a low level of momentum, there is a high probability of a pullback or reversal.
Additionally, traders can use this indicator to look for intersections between the MACD line and its signal line. As a rule, the moment when the MACD line crosses the signal line from the bottom to the top is considered a signal to buy. Conversely, a signal to sell is the point of intersection of the signal line with the MACD line from top to bottom.
MACD is often used in conjunction with RSI because both indicators measure momentum, but do so based on different data. It is assumed that together they can give a more complete technical overview of the market.
Want to learn more? Check out our article on MACD.
Want to start trading cryptocurrency? Buy Bitcoin on Binance!
4. Stochastic RSI (StochRSI)
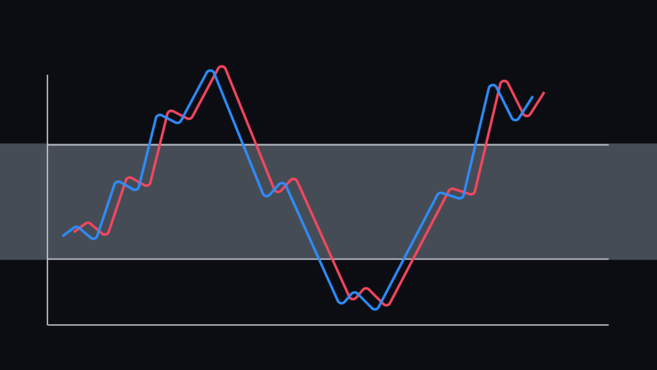
Stochastic RSI is an oscillator that tracks price movements to determine whether an asset is overbought or oversold. As the name suggests, stochastic is a derivative of the regular RSI that is generated based on fundamentals instead of price data. The indicator is calculated by applying the stochastic RSI formula to the normal RSI values. Standard indicator settings range from 0 to 1 (or 0 to 100).
Due to its high speed and sensitivity, the RSI stochastic can generate many complex trading signals that are difficult to interpret. Generally, it tends to be most useful when the indicators are near the upper or lower end of their range.
If the RSI stochastic indicator is above 0.8, it is considered overbought, and a value below 0.2 may indicate oversold. A value of 0 means that the RSI has the lowest value in the measured period (the default setting is usually 14). Otherwise, a value of 1 means that the RSI has the highest value for the measured period.
Similar to standard indicator settings, RSI stochastic overbought or oversold signals do not mean that the price will go in the exact direction the indicator is pointing. In this case, it simply indicates that the RSI values (on the basis of which the RSI stochastic values were derived) are close to extreme indicators. It is important to remember that the RSI stochastic is more sensitive than its predecessor, so it generates more false or misleading signals.
Want to learn more? Check out our article on Stochastic RSI.
5. Bollinger lines (BB)
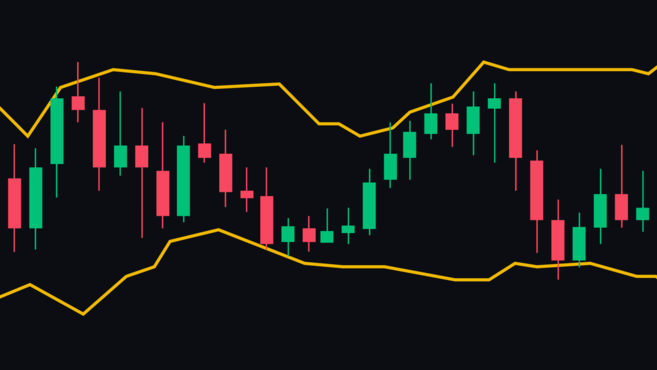
Bollinger Bands measure market volatility as well as overbought and oversold conditions. The indicator consists of three bands - the SMA (average line), as well as the upper and lower lines. Settings can vary, but usually the upper and lower lines are two standard deviations from the mean line. As volatility increases and decreases, the distance between the lines increases and decreases.
As a rule, the closer the price is to the upper line, the higher the overbought of the selected asset. In the opposite situation, the closer the price is to the lower line, the closer it is to being oversold. In most cases, the price does not go beyond the lines, but it is possible that it may break above or below them. Although this variant of the development of events cannot be a trading signal, it serves as an indicator of extreme market conditions.
The other most important concept of BB is called squeeze. Such a case refers to a period of low volatility, when all lines are very close to each other. In this situation, the indicator can signal potential volatility in the future, otherwise, if the lines are at a large distance from each other, it can indicate a possible decrease in price fluctuations.
Want to learn more? Check out our article on Bollinger Bands.
Final thoughts
Despite the fact that technical indicators provide data with the help of which it will be easier for you to navigate the market, it is important to consider that the interpretation of such data is extremely subjective. Therefore, before creating your agreements, you need to make sure that your personal biases do not influence your decision-making in any way. What may be a direct buy or sell signal to one trader may seem like mere market noise to another.
As with most market analysis techniques, indicators work best in combination with each other or with other techniques such as fundamental analysis (FA).
The best way to learn technical analysis (TA) is to practice a lot. Go to Binance and test your new knowledge!