
Moving Average Convergence/Divergence (MACD) is an oscillator-type indicator widely used by traders for technical analysis (TA). MACD is a trend-following tool that uses moving averages to determine the momentum of a stock, cryptocurrency, or other trading asset.
Developed by Gerald Appel in the late 1970s, the Moving Average Convergence/Divergence indicator tracks price events that have already occurred and thus falls into the category of lagging indicators (which provide signals based on past price action or data). MACD can be useful for measuring market momentum and possible price trends and is used by many traders to identify potential entry and exit points.
Before diving into the mechanics of MACD, it is important to understand the concept of moving averages. A moving average (MA) is simply a line representing the average of past data over a given period. In the context of financial markets, moving averages are among the most popular technical analysis (TA) indicators and can be divided into two different types: simple moving averages (SMA) and exponential moving averages (EMA). While SMAs weigh all inputs equally, EMAs place more emphasis on recent data values (newer price points).
How MACD works
The MACD indicator is created by subtracting two exponential moving averages (EMAs) to create a base line (the MACD line), which is then used to calculate another EMA representing the signal line.
Additionally, there is a MACD histogram which is calculated based on the difference between these two lines. The histogram, along with two other lines, oscillates above and below the center line, also known as the zero line.
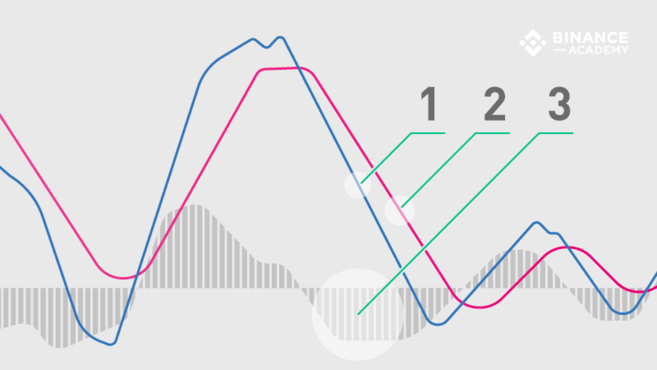
Thus, the MACD indicator consists of three elements moving around the zero line:
MACD line (1): helps to identify an upward or downward momentum (market trend). It is calculated by subtracting two exponential moving averages (EMA).
Signal line (2): EMA of the MACD line (usually a 9-period EMA). Combined analysis of the signal line with the MACD line can be useful for identifying potential reversals or entry and exit points.
Histogram (3): graphical representation of the divergence and convergence of the MACD line and the signal line. In other words, the histogram is calculated taking into account the differences between the two lines.
MACD line
Generally, exponential moving averages are measured according to the closing prices of the asset, and the periods used to calculate the two EMAs are usually set as 12 periods (faster) and 26 periods (slower). The period can be configured in different ways (minutes, hours, days, weeks, months), but this article will focus on daily settings. However, the MACD indicator can be customized to work with different trading strategies.
Assuming standard time ranges, the MACD line itself is calculated by subtracting the 26-day EMA from the 12-day EMA.
MACD line = 12-day EMA - 26-day EMAAs mentioned, the MACD line oscillates above and below the zero line, and this is what signals the crossing of the central line, telling traders when the 12-day and 26-day EMAs change their relative positions.
Signal line
By default, the signal line is calculated based on the 9-day EMA of the main line, which provides additional information about its previous movements.
Signal line = 9-day EMA of the MACD lineAlthough this data is not always accurate, when the MACD line and the signal line cross, these events are usually seen as trend reversal signals, especially when they occur at the extremes of the MACD chart (much above or below the zero line).
MACD histogram
A histogram is nothing more than a visual record of the relative movements of the MACD line and the signal line. It is calculated by simply subtracting one value from another:
MACD histogram = MACD line - signal lineHowever, instead of adding a third moving line, the histogram consists of bars, making it visually easier to read and interpret. Note that the bars of the histogram have nothing to do with the trading volume of the asset.
MACD settings
As already mentioned, the MACD settings are based on 12-, 26-, and 9-period EMAs by default, which is why the MACD parameters (12, 26, 9) are indicated. However, some technical analysts change the periods to create a more sensitive indicator. For example, MACD (5, 35, 5) is often used in traditional financial markets along with longer timeframes such as weekly or monthly charts.
It is worth noting that due to the high volatility of cryptocurrency markets, increasing the sensitivity of the MACD indicator can be risky, as it is likely to lead to more false signals and misleading information.
How to read MACD charts
As the name suggests, the moving average convergence/divergence indicator tracks the relationship between the moving averages, and the correlation between the two lines can be described as converging or diverging. Convergent when the lines are attracted to each other, and divergent when they diverge.
However, the corresponding signals of the MACD indicator are associated with so-called crossings, which occur when the MACD line crosses the central line above or below (crossing central lines), or the MACD line crosses the signal line above or below (crossing signal lines).
Be aware that the intersection of the central and signal lines can happen several times, creating many false and misleading signals, especially for volatile assets such as cryptocurrencies. Therefore, you should not rely only on the MACD indicator.
Intersections of the central line
A crossing of the central line occurs when the MACD line moves either in the positive or negative region. When it crosses the center line, a positive MACD value indicates that the 12-day EMA is higher than the 26-day EMA. Conversely, a negative MACD is displayed when the MACD line crosses the average line below the center line, which means that the 26-day average is higher than the 12-day average. In other words, a positive MACD line suggests stronger upward momentum, while a negative MACD line may indicate stronger downward movement.
Signal line crossing
When the MACD line crosses the signal line, traders often interpret this as a potential buying opportunity (entry point). On the other hand, when the MACD line crosses the signal line below, traders tend to see it as a selling opportunity (exit point).
Although crossing signals can be useful, they are not always reliable. It is also worth considering where they are located on the chart to minimize risks. For example, if the crossing calls for a buy, but the MACD line indicator is below the center line (negative), market conditions can still be considered bearish. Conversely, if a signal line crossing indicates a potential sell point, but the MACD line indicator is positive (above the zero line), market conditions are still likely to be bullish. In such a scenario, following a sell signal can be very risky (given the general trend).
MACD and price divergence
Along with the intersection of the central and signal lines, MACD charts can also show a divergence between the MACD chart and the price action of the asset.
For example, if the price action of a cryptocurrency makes a higher high while the MACD forms a lower high, we will have a bearish divergence, which indicates that despite the increase in price, the upward momentum (buying pressure) is not as strong as it was. Bearish divergences are usually interpreted as selling opportunities because they usually precede price reversals.
Conversely, if the MACD line forms two rising lows that coincide with two falling lows in the asset's price, this is considered a bullish divergence, suggesting that despite the decline in price, buying pressure is stronger. Bullish divergences usually precede price reversals, potentially indicating a near-term bottom (downtrend to uptrend).
Results
When it comes to technical analysis, the moving average convergence/divergence (MACD) oscillator is one of the most useful tools available. Not only because it is relatively easy to use, but also because it is quite effective in identifying both market trends and market momentum.
However, like most TA indicators, the MACD is not always accurate and can give numerous false and misleading signals, especially for volatile assets or during a weak trend or sideways price movement. Therefore, many traders use MACD with other indicators, such as the RSI indicator, to reduce risks and further confirm signals.