
Content
What is the Wyckoff Method?
Wyckoff's three laws
The Law of Supply and Demand
The Law of Cause and Effect
The Law of Effort vs. Result
O Composite Man
Accumulation
Uptrend
Distribution
Downtrend
Wyckoff diagrams
Accumulation Diagram
Distribution Diagram
Does Wyckoff's method work?
Wyckoff's five-step approach
Final considerations
What is the Wyckoff Method?
The Wyckoff Method was developed by Richard Wyckoff in the early 1930s. It consists of a series of principles and strategies initially designed for traders and investors. Wyckoff spent much of his life teaching, and his work has had a major impact on the use of modern technical analysis (TA). The Wyckoff Method was originally created with a focus on the stock market, but currently has application in all types of financial markets.
Much of Wyckoff's work was inspired by the trading methods of other successful traders (especially Jesse L. Livermore). Currently, Wyckoff has the same recognition as other greats such as Charles H. Dow and Ralph N. Elliott.
Wyckoff has carried out extensive research, which has led to the creation of several trading theories and techniques. This article provides an overview of his work, including:
Three fundamental laws;
The concept of Composite Man;
A methodology for analyzing graphs (Wyckoff Diagrams);
A five-step approach to market.
Wyckoff also developed specific Buy and Sell Tests as well as a unique charting method based on Point and Figure (P&F) charts. While testing helps traders identify better entry points, the P&F method is used to set trading goals. However, this article will not cover these two topics.
Wyckoff's three laws
The Law of Supply and Demand
The first law states that prices rise when demand is greater than supply and fall when the opposite happens. This is one of the most basic principles of financial markets and is clearly not unique to Wyckoff's work. We can represent the first law with three simple equations:
Demand > Supply = Price increase
Demand < Supply = Price drop
Demand = Supply = No significant price change (low volatility)
In other words, Wyckoff's first law suggests that an excess of demand over supply causes prices to rise because there are more people buying than selling. However, in a situation where there are more sales than purchases, supply exceeds demand, causing the price to fall.
Many investors who follow the Wyckoff Method compare price action to volume bars as a way to better visualize the relationship between supply and demand. This often provides information about upcoming market movements.
The Law of Cause and Effect
The second law states that differences between supply and demand are not random. Instead, they appear after periods of preparation, as a result of specific events. In Wyckoff's terms, a period of accumulation (cause) eventually leads to an uptrend (effect). On the other hand, a period of distribution (cause) eventually results in a downtrend (effect).
Wyckoff applied a unique graphing technique to estimate the potential effects of a cause. That is, he created methods for setting trading goals based on accumulation and distribution periods. This allowed him to estimate the likely extent of a market trend after breaking through a consolidation zone or trading range (TR).
The Law of Effort vs. Result
Wyckoff's third law states that changes in the price of a good are the result of effort, which is represented by trading volume. If price action is in harmony with volume, there is a good chance the trend will continue. On the other hand, if volume and price diverge significantly, the market trend is likely to break or change direction.
For example, imagine that the Bitcoin market starts to consolidate with very high volume after a long bearish trend. High volume indicates a large effort, but sideways movement (low volatility) suggests a small result. Therefore, there is a lot of Bitcoin changing hands, but no significant price drops occur. This situation could indicate that the downtrend is ending and a reversal is near.
O Composite Man
Wyckoff created the idea of Composite Man (or Composite Operator) as an imaginary market identity. He proposed that investors and traders study the stock market as if a single entity were controlling it. This would make it easier to monitor market trends.
Essentially, Composite Man represents the biggest players (market makers), such as the richest individuals and institutional investors. He always acts in his own interest to ensure he can buy low and sell high.
Composite Man's behavior is opposite to that of most smaller investors, whom Wyckoff frequently observed losing money. But according to Wyckoff, Composite Man uses a somewhat predictable strategy that investors can learn from.
Let's use the concept of Composite Man to illustrate a simplified market cycle. This cycle consists of four main phases: accumulation, uptrend, distribution, and downtrend.
Accumulation
Composite Man accumulates assets before most investors. This phase is usually marked by a lateral movement. Accumulation is done gradually to prevent the price from changing significantly.
Uptrend
When Composite Man has enough assets and the selling force is exhausted, he begins to drive the market. Naturally, the new emerging trend attracts more investors and increases demand.
It is evident that there can be several phases of accumulation during an uptrend. We can call these phases of reaccumulation, where the main trend stops and consolidates for a while, before continuing its upward movement.
As the market rises, other investors are encouraged to buy. Eventually, even the general public becomes excited enough to get involved. At this point, demand is already excessively greater than supply.
Distribution
Next, Composite Man begins distributing his holdings. He sells his profitable positions to those who enter the market at a late stage. Typically, the distribution phase is marked by a lateral movement that absorbs demand until it is exhausted.
Downtrend
Shortly after the distribution phase, the market begins to revert to the downtrend. In other words, after Composite Man finishes selling most of his assets, he starts pushing the market lower. Eventually, supply becomes much greater than demand and the downtrend is established.
Similar to the uptrend, the downtrend can also have redistribution phases. This is basically the short-term consolidation of large price drops. These phases can also include Dead Cat Bounces or so-called bull traps, where some buyers get trapped, waiting for a trend reversal that does not happen. When the downtrend finally ends, a new accumulation phase begins.
Wyckoff diagrams
Accumulation and Distribution Diagrams are probably the most popular part of Wyckoff's work - at least within the cryptocurrency community. These models divide the Accumulation and Distribution stages into smaller sections. The sections are divided into five phases (A through E), along with several Wyckoff Events, briefly described below.
Accumulation Diagram
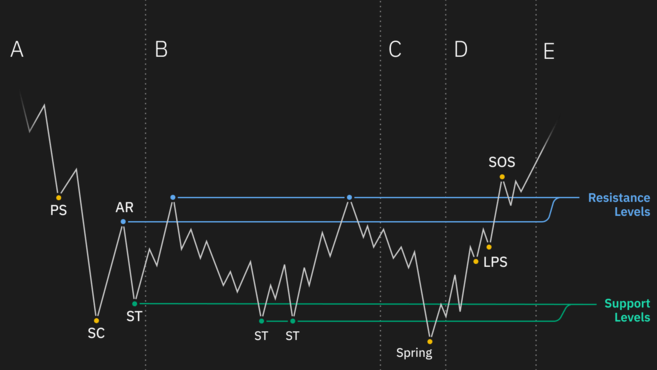
Phase A
The sales force dwindles and the downtrend begins to slow. This phase is usually marked by an increase in trading volume. The Preliminary Support (PS) indicates that some buyers are emerging, but not enough yet to stop the downtrend.
The Sales Climax (Selling Climax, SC) is formed by intense sales activity, when investors capitulate. This is usually a point of high volatility where panicked investor selling creates large candles and shadows. The sharp drop quickly reverses into a bounce or Automatic Rally (AR) as the excess supply is absorbed by buyers. Generally speaking, the trading range (TR) of an Accumulation Diagram is defined by the space between the SC low and the AR high.
As the name suggests, the Secondary Test (ST) takes place when the market falls and is close to the SC region, testing whether the downtrend has actually ended or not. At this point, trading volume and market volatility tend to be lower. The ST often forms a steeper low against the CS, but this is not always the case.
Fase B
According to Wyckoff's Law of Cause and Effect, Phase B can be seen as the Cause that leads to an Effect.
Essentially, Phase B is the consolidation phase, in which Composite Man accumulates the largest number of assets. During this phase, the market tends to test both the resistance and support levels of the trading ranges.
There may be several Secondary Tests (ST) during Phase B. In some cases, they may indicate more pronounced highs (bull traps) or lows (bear traps) relative to the SC and AR of Phase A.
Phase C
A typical Accumulation Phase C contains what we call a Spring. It often acts as the last bear trap before the market shows steeper declines. During Phase C, Composite Man ensures that there is little supply on the market, that is, the offers that were available have already been sold.
Spring frequently breaks support levels to disrupt traders and mislead investors. We can describe it as a final attempt to buy assets at a lower price before the uptrend begins. The bear trap induces investors to give up their holdings.
In some cases, however, support levels manage to hold and Spring simply doesn't happen. That is, there may be Accumulation Diagrams that present all the other elements, but not Spring. Still, the general diagram remains valid.
Phase D
Phase D represents the transition between Cause and Effect. It lies between the Accumulation zone (Phase C) and the breakout of the trading range (Phase E).
Typically, Phase D shows a significant increase in trading volume and volatility. Generally, it has a Last Point Support (LPS), showing a steeper drop before the market rises. LPS often precedes a break of resistance levels, which in turn creates higher highs. This indicates Signs of Strength (SOS), as resistances become new supports.
Despite the somewhat confusing terminology, there may be more than one LPS during Phase D. They generally increase trading volume while testing new support lines. In some cases, the price may create a small consolidation zone before actually breaking out of the main trading range and moving into Phase E.
Phase E
Phase E is the last step of an Accumulation Diagram. It is marked by an obvious break in the trading range, caused by increased market demand. This is when the trading range is effectively broken, starting the uptrend.
Distribution Diagram
Essentially, Distribution Diagrams work in the opposite way to Accumulation, but with some differences in terminology.

Phase A
The first phase occurs when an established uptrend begins to slow due to decreasing demand. Preliminary Supply (PSY) suggests that selling strength is emerging, although it is not yet strong enough to stop the upward movement. The Buying Climax (BC) is then formed by intense buying activity. This effect is usually caused by inexperienced traders who buy under the influence of their emotions.
Then, the strong rise causes an Automatic Reaction (RA), as the excessive demand is absorbed by the market makers. In other words, Composite Man begins distributing his holdings to late buyers. The Secondary Test (ST) occurs when the market returns to the BC region, generally causing a less pronounced rise.
Fase B
Phase B of a Distribution acts as the consolidation zone (Cause) that precedes a downtrend (Effect). During this phase, Composite Man gradually sells his assets, absorbing and weakening market demand.
Generally, the upper and lower bands of the trading range are tested several times, which may, in the short term, include bear traps and bull traps. Sometimes the market moves above the resistance level created by the BC, resulting in a ST which can also be called an Upthrust (UT).
Phase C
In some cases, the market will experience one last bull trap after consolidation. It’s called UTAD or Upthrust After Distribution. It's basically the opposite of a Spring Accumulation.
Phase D
The D phase of a Distribution is practically a mirror image of the Accumulation phase. It usually has a Last Point of Supply (LPSY) in the middle of the range, creating a less sharp rally. From this point, new LPSYs are created - around or below the support zone. An obvious Sign of Weakness (SOW) appears when the market breaks below support lines.
Phase E
The last stage of a Distribution marks the beginning of a downtrend, with an evident break below the trading range, caused by the strong dominance of supply over demand.
Does Wyckoff's method work?
Of course, the market does not always follow these models precisely. In practice, Accumulation and Distribution Diagrams can occur in several ways. For example, some situations may have a B phase lasting much longer than expected. Or else, Spring and UTAD tests may be missing entirely.
Still, Wyckoff's work offers a wide variety of reliable techniques based on his many theories and principles. Your work is certainly of great value to thousands of investors, traders and analysts around the world. For example, the Accumulation and Distribution schemes can be useful when trying to understand common cycles in financial markets.
Wyckoff's five-step approach
Wyckoff also developed a five-step approach to marketing, based on his many principles and techniques. In short, this approach can be seen as a way of putting his teachings into practice.
Step 1: Set the trend.
What is the current trend and where is it likely to go? How is the relationship between supply and demand?
Step 2: Define the strength of the asset.
How strong is the asset relative to the market? Are they moving in similar or opposite ways?
Step 3: Search for assets with sufficient “Cause”.
Are there enough reasons to enter a position? Is the Cause strong enough to make the potential rewards (Effect) worth the risks?
Step 4: Define the probability of change.
Is the asset value about to move? Where do you stand considering the biggest trend? What do the price and volume suggest? This step usually involves using the Wyckoff Buy and Sell Tests.
Step 5: Plan your entry time.
The last step is purely time related. It generally involves analyzing an asset in comparison to the overall market.
For example, a trader can compare a stock's price action against the S&P 500 index. Depending on your position considering your individual Wyckoff Diagram, this analysis can provide information about the asset's next movements. This generally makes it easier to establish good entry timing.
It is worth noting that this method works best with assets that move along with the market or general index. In cryptocurrency markets, this correlation does not always exist.
Final considerations
It has been almost a century since its creation, but the Wyckoff Method is still widely used today. It is certainly much more than a TA indicator, as it encompasses many trading principles, theories and techniques.
Essentially, the Wyckoff Method allows investors to make more logical decisions, rather than simply acting on emotions. Wyckoff's extensive work provides traders and investors with a series of tools to reduce risk and increase their chances of success. Still, there is no foolproof technique when it comes to investing. One should always be careful about risks, especially in cryptocurrency markets, which have high volatility.


