
Summary
Cryptocurrency fundamental analysis delves into existing information about a financial asset. For example, you can research the use cases for a financial asset, the number of people using it, or the team behind the project.
The goal of conducting research is to determine whether an asset is overvalued or undervalued. Afterwards, positions can be traded based on personal insights.
Introduction
Trading highly volatile assets like cryptocurrencies requires certain skills. Choosing strategies, understanding the overall picture of trading, and mastering technical analysis and fundamental analysis are all practical means to continuously accumulate experience.
Technical analysis can draw on certain expertise from traditional financial markets. Many cryptocurrency traders use the same technical indicators used for forex, stock, and commodity trading. No matter which asset is traded, tools such as the Relative Strength Index (RSI), Exponential Moving Average (MACD), and Bollinger Bands can be used to predict market behavior. Therefore, these technical analysis tools are also extremely popular in the cryptocurrency space.
While cryptocurrency fundamental analysis uses similar methods to traditional markets, these tried-and-true tools are not necessarily ideal for evaluating cryptocurrency assets. In order to implement sound fundamental analysis (FA) in the cryptocurrency space, we should understand where its value lies.
In this article, we’ll explain how to carefully pick an indicator that’s right for you.
What is fundamental analysis (FA)?
Fundamental analysis (FA) is a method for investors to determine the "intrinsic value" of an asset or business. By studying a range of internal and external factors, an investor's primary goal is to determine whether an asset or business is overvalued or undervalued, and then develop a buying and selling strategy based on this information.
Technical analysis can also provide extremely valuable trading data, but its analysis results vary from person to person. Technical analysis (TA) users believe that future price movements can be predicted based on an asset's past performance. They mainly achieve their goals by observing K-line charts and studying common indicators.
Traditional fundamental analysts typically rely on business metrics to determine what they see as true value. Metrics used include earnings per share (i.e. how much profit a company can earn per share issued), or price-to-book ratio (how investors value a company based on its book value). For example: Analysts will analyze and compare multiple companies in a certain niche market to select which company has more investment prospects.
For a comprehensive understanding of fundamental analysis, please read "What is Fundamental Analysis?" 》
Problems with Cryptocurrency Fundamental Analysis
We cannot accurately evaluate cryptocurrency networks through the lens of looking at traditional businesses. Products like Bitcoin (BTC) that focus on decentralization are closer to commodities. However, even for centralized cryptocurrencies (such as those issued by organizations), traditional fundamental analysis (FA) indicators do not provide sufficient information.
Therefore, we should turn our attention to other frameworks. The first step is to identify strong indicators. "Strong" means that the indicator is not easily manipulated. For example, Twitter followers or Telegram/Reddit users are not good indicators, after all, it is easy to create fake accounts or buy followers on social media.
It is important to note that one measurement alone cannot provide a complete picture of the network being assessed. We can look to see if the number of active addresses on the blockchain continues to surge, but that by itself doesn’t provide much valuable information. For all we know, it's likely the same person sending money back and forth to themselves using a new address each time.
In the following chapters, we will explore three categories of cryptocurrency fundamental analysis (FA) indicators: on-chain indicators, project indicators, and financial indicators. The indicators listed above are not comprehensive, but they are enough to lay a solid foundation for subsequent creation of indicators.
On-chain indicators

On-chain metrics are metrics that are observable based on data provided by the blockchain. We could run nodes ourselves for the desired network and then export the data, but this process can be expensive and time-consuming. If you only consider investment and are unwilling to waste time or resources, the above method is even more inappropriate.
A more direct solution is to extract information from professional investment decision-making information websites or APIs. For example, CoinMarketCap’s Bitcoin on-chain analysis provides a wealth of information. Other sources of information include data charts from Coinmetrics or project reports from Binance Research.
Number of transactions
The number of transactions is a good way to measure network activity. You can see how activity changes over time by graphing the quantities over a specified period of time (or using a moving average).
However, it should be noted that caution should be used when referring to this indicator. As with active addresses, we cannot be sure if it is just the same group of people transferring funds to each other between wallets, causing the amount of activity on the chain to be skewed.
transaction value
Not to be confused with transaction volume, transaction value represents the total value of transactions over a period of time. For example: if a total of 10 Ethereum transactions are sent on the same day, each worth $50, the daily trading volume is $500. The unit of measurement can be a legal currency such as the US dollar, or the protocol's native unit - Ethereum (ETH).
active address
Active addresses are blockchain addresses that remain active within a specified time frame. There are many ways to calculate active addresses. The common method is to calculate the number of senders and receivers of each transaction within a set period of time (such as days, weeks, or months). Some methods track the entire time range, meaning they calculate cumulative values over time.
Fee paid
In contrast, the paid handling fees of some cryptocurrency assets are more telling, which can show the user's demand for block space. We can think of this as auction bidding: users bid against each other to get their transactions into the block in time. Transactions with higher bids will be confirmed (mined) first, while those with lower bids need to wait.
For a cryptocurrency whose issuance continues to decline as planned, this is a metric worth studying. Mainstream Proof of Work (PoW) blockchains will provide block rewards. Part of the block reward consists of block subsidies and transaction fees. Block subsidies decline periodically (e.g. events such as the Bitcoin halving).
As time goes by, mining costs continue to increase, and block subsidies gradually decrease, so transaction fees increase as a matter of course. Otherwise, miners will exit the network due to operating losses, which will also affect the security of the blockchain.
Hashrate vs. Staking Amount
Today, blockchains use various consensus algorithms, each with its own proprietary mechanism. These algorithms play an indispensable role in ensuring network security, and in-depth study of relevant data can optimize the results of fundamental analysis.
In proof-of-work cryptocurrencies, hash rate is often used to measure whether the network is functioning properly. The higher the hash rate, the more difficult it is to launch a 51% attack. Attracted by low overhead and high returns, miners flock to mining. Over time, the hash rate continues to increase. Conversely, if it becomes unprofitable to secure the network, miners will go offline ("miner surrender"), causing the hash rate to drop.
Factors that affect the total cost of mining include the current price of the asset, the number of transactions processed, and the fees paid. Of course, the direct costs of mining (electricity and computing power) are also key considerations.
Staking (such as in Proof of Stake) is another game theory related concept similar to Proof of Work (PoW) mining. However, the two mechanisms work differently. The basic idea of staking is that users participate in block verification by staking their assets. Therefore, we can study the number of pledges in a given period of time to determine whether investment interest is high (or lack thereof).
Project indicators

On-chain metrics focus on observable blockchain data, while project metrics take a qualitative approach, looking at factors such as the performance of the team (if any), whitepapers, and upcoming roadmaps.
white paper
It is strongly recommended that you read the project white paper before investing. This technical document gives us an overview of the cryptocurrency project. A good white paper will clarify the goals of the network and, ideally, provide insight into:
Technology used (Is it open source?)
Use cases designed to satisfy
Roadmap for upgrades and new features
Currency or Token Supply and Distribution Plan
In addition to referencing this information, it's a good idea to have discussions around the project. What do others think? Are there any red flags? Are the goals realistic?
team
If there is a specific team behind a cryptocurrency network, the track record of its members can reveal whether the team has the necessary skills to carry out the project. Have the members previously participated in successful investment projects in the industry? Is their expertise sufficient to achieve the stated goals? Have they been involved in any questionable projects or scams?
What would the developer community be like without a team? If the project has a public GitHub, check its number of contributors and activity. A coin that continues to evolve is definitely more attractive than a coin that hasn’t updated its repository in two years.
competitors
A detailed and authoritative white paper can provide insight into the target use cases of a cryptocurrency asset. An important task at this stage is to identify the project's competitors and the legacy infrastructure it seeks to replace.
Ideally, fundamental analysis should be applied to this information carefully and thoughtfully. Some assets appear to be extremely attractive, but if measured by the same metrics as similar crypto assets, are likely to reveal shortcomings compared to other assets.
Token Economics and Initial Distribution
Some projects create tokens with the goal of finding solutions to problems. This does not mean that the project itself is not viable, just that the tokens associated with it may be useless. Therefore, it is important to be clear about the actual utility of the token. Questions raised by this include whether this utility can be widely recognized by the market, and how valuable the market thinks this utility is.
In this regard, another important factor to consider is how the funds will be initially distributed: will it be distributed through an Initial Coin Offering (ICO) or Initial Exchange Offering (IEO), or will it be earned through user mining? If the former, the white paper should clarify how much capital is retained by the founders and team, and how much is available to investors. If it’s the latter, we can look at evidence of pre-mining (mining the asset in the network before it comes out) by the asset’s creator.
Paying attention to how funds are allocated can tell you whether there are risks. For example: If the vast majority of funds come from only a very small number of individuals and organizations, we may determine that these individuals and organizations will eventually manipulate the market, and therefore determine that the investment is risky.

financial indicator
In fundamental analysis, information such as the asset's current trading method, past transaction prices, and liquidity can all be used as a basis. However, there may be other metrics worth watching in this category that relate to the economics and incentives of crypto asset protocols.
Market value
Market cap (or network value) is equal to the circulating supply multiplied by the current price. Market capitalization essentially represents the hypothetical cost of purchasing each unit of a cryptocurrency asset (assuming there is no slippage).
Market capitalization itself is somewhat misleading. In theory, it is very easy to issue 10 million units of useless tokens. If one of the tokens traded for $1, the market value would be as high as $10 million. This valuation method is obviously distorted. Without a strong value proposition, a token simply cannot gain widespread market acceptance.
It should also be noted that we are unable to determine the actual circulating volume of a particular cryptocurrency or token. Tokens are destroyed, keys are lost, and funds are forgotten. On the contrary, if you can filter out tokens that are no longer in circulation, you can roughly estimate the circulating supply.
Even so, market capitalization is still a widely used indicator of network growth potential. Some cryptocurrency investors believe that “small-cap” tokens have better growth potential than “large-cap” tokens. Other investors believe that large-cap tokens have stronger network effects and have a higher chance of success than smaller-cap tokens that are less established.
Liquidity and Volume
Liquidity is a measure of the difficulty of buying and selling an asset. Liquid assets can be easily sold at the desired trading price. A related concept is liquid markets, which are markets where numerous ask and offer prices compete fiercely (resulting in extremely tight bid-ask spreads).
In illiquid markets, we may not be able to sell our assets at a “fair” price. This shows that no buyer is willing to trade at present and can only face two options: lower the asking price or wait for market liquidity to increase.
Volume is an indicator that helps determine liquidity. This metric can be measured in a number of ways, showing the value of transactions over a specific period of time. Charts typically show daily volume (in native currency units or USD).
It is helpful to be familiar with the concept of liquidity in fundamental analysis. Ultimately, liquidity serves as a measure of market interest in potential investments.
supply mechanism
From an investment perspective, the supply mechanism of a currency or token is a very interesting property in the eyes of some. Models like the Stock-to-Flow (S2F) ratio are indeed becoming increasingly popular among Bitcoin enthusiasts.
Maximum supply, circulating supply, and inflation rate can all be used as a basis for decision-making. Over time, some tokens will reduce the production of new coins, further attracting investors who believe that demand for new coins will exceed supply.
On the other hand, many investors believe that strictly capping supply will actually do more harm than good in the long run. They are worried about users hoarding tokens and hindering the circulation and use of tokens. Another critical voice believes that the reward ratio for early users is unbalanced. After all, only a stable inflation policy can protect the rights and interests of new users.
Fundamental Analysis Indicators, Metrics and Tools
We think of metrics as quantitative data in fundamental analysis and sometimes as qualitative data. Using these metrics alone often doesn't tell the full story of the problem. To gain a deeper understanding of the coin’s fundamentals, one should also look into the indicators.
Indicators usually refer to the combination of multiple measurement indicators through statistical formulas in order to analyze the relationship between each item. However, there is a lot of overlap between metrics and indicators, so the definitions of the two are not rigorous.
While the number of active wallets has data value, it needs to be combined with other data to gain deeper insights. You can calculate the percentage of the total number of wallets based on the number of active wallets, or divide the token market value by the number of active wallets. The calculated value is the average amount held by each active wallet. Both data reflect network activity and user confidence in holding assets. We will explore this issue in depth in the next chapter.
Fundamental analysis tools can easily combine metrics and indicators. While raw data can be viewed using a blockchain explorer, an aggregator or dashboard can help save query time. Some tools allow users to select the required metrics and create their own metrics.
Combine metrics and create fundamental analysis (FA) indicators
Now that we understand the difference between metrics and indicators, let's explore how to combine the two to gain a deeper understanding of the financial health of the asset under study. Why did you do this? As discussed in previous chapters, every metric has shortcomings. Furthermore, if you only focus on a series of numbers behind each cryptocurrency project, you are likely to miss a lot of key information. Consider the following situation:
Token A | Token B | |
Market value | US$100 million | US$5 million |
Number of transactions (6 months) | 20 million | 40 million |
Average transaction value (6 months) | 50 U.S. dollars | 100 dollars |
Active address (6 months) | 30,000 | 2,000 |
Taken individually, comparing the active addresses of the two products does not reveal anything substantive. We can only assume that Token A has had more active addresses than Token B over the past six months, but this is not a comprehensive analysis at all. How does this number relate to market cap or number of transactions?
A more rigorous approach would be to create some ratio, apply it to some statistics of Token A, and then compare to Token B's statistics with the same ratio applied. This way, instead of blindly comparing a single metric for each token, we create a set of criteria for independently evaluating tokens.
For example, studying the relationship between market capitalization and transaction volume can yield more information than looking at market capitalization alone. We divide the market cap by the number of transactions, which gives us a ratio of 5 for Token A and 0.125 for Token B.
Looking at the ratio alone, Token B has a lower value and appears to have a higher intrinsic value than Token A. This means that, using market capitalization as a reference, the number of transactions for Token B is much higher. Therefore, Token B seems to have greater utility, or Token A is overvalued.
Please note: The above observations are simply examples of how to use the details to determine the big picture and should not be relied upon as investment advice. Without understanding the goals of the project and the functionality of the token, it is difficult to judge whether the low number of transactions for Token A is a positive development or a negative development.
Another similar ratio commonly used in the cryptocurrency market is the NVT ratio. The network value to transaction volume ratio was proposed by analyst Willy Woo and is considered the “price-to-earnings ratio of the cryptocurrency world.” Simply put, it is calculated as market cap (or network value) divided by the number of transactions (usually represented on the daily chart).
Here is just a brief introduction to the various practical indicators. Fundamental analysis should be a complete system for comprehensively evaluating a project. The more detailed data used, the more reliable the findings will be.
Key indicators and metrics of fundamental analysis (FA)
The market is filled with numerous indicators and metrics that can be used for analysis. For beginners, we have selected a few of the most popular indicators for introduction. Each indicator can reflect limited problems, so multiple indicators should be combined for comprehensive analysis.
Network Value to Transaction Volume Ratio (NVT)
If you've heard of the stock analysis metric Price-to-Earnings ratio, it's easy to understand the ratio of network value to number of transactions (daily), which provides similar analysis. The calculation is as simple as dividing the token’s market capitalization by its daily trading volume.
We use daily trading volume to represent the underlying intrinsic value of a token. The concept is based on the assumption that an item appreciates in value if the volume of liquid transactions in the market increases. If a token’s market capitalization rises while daily trading volume is low, the market may enter a bubble stage. Prices rise without a corresponding increase in underlying value. Conversely, if the coin price remains stable while daily trading volume increases, this situation signals a potential buying opportunity.
The higher the value of this ratio, the greater the chance of creating a bubble. When NVT is higher than 90-95, it is the critical point for bubbles to appear. If the ratio decreases, it indicates that the cryptocurrency is becoming less overvalued.
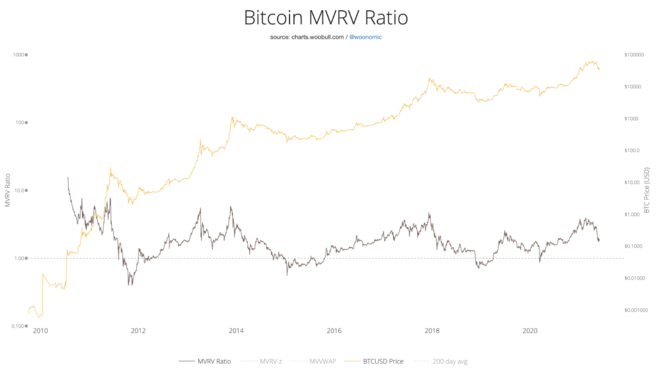
Market Value to Realized Market Value Ratio (MVRV)
Before delving into this statistic, it’s important to first understand what a cryptoasset’s realized value is. Market value (also known as "market cap") is equal to the total supply of a token multiplied by its current market price. The realized market is minus tokens lost due to wallet inaccessibility.
Tokens stored in the wallet are valued based on the market price at the time of the last transfer. For example: If one Bitcoin was lost in a wallet in February 2016, its value would be approximately $400.
Simply divide market capitalization by realized market capitalization to calculate the market value to realized market capitalization (MVRV) metric. If the market capitalization is much higher than the realized market capitalization, the ratio is relatively high. A ratio above 3.7 indicates that the token is overvalued and traders can profit from trading, possibly triggering a sell-off.
This number indicates that the coin may be overvalued at the moment. The two large-scale Bitcoin sell-offs in 2014 (MRVR value is about 6) and 2018 (MRVR value is about 5) are the best evidence. If the value falls below 1, the market is undervalued. This is a good buying opportunity. Once the buying pressure increases, it will push the price up.
Inventory to flow ratio model
The stock-to-flow ratio indicator is a popular metric for measuring cryptocurrency prices and is often used when supply is limited. The model treats each cryptocurrency as a fixed scarce resource, similar to precious metals or gems. Investors use assets to save value when supply is known to be limited and no new sources have been discovered.
该指标等于全球总流通供应量除以每年的新币产量。以比特币为例,其流通量和新挖出币的数据随处可见,可以轻松计算出比率。挖矿收益下降导致反映稀缺度的比率增高,推动资产升值。由于比特币定期发生奖励减半,我们可以在新币入市期间看到上述情况。
As you can see, the stock-to-flow ratio is an excellent indicator of Bitcoin price. Bitcoin’s price highly overlaps with the ratio’s 365-day average, showing a good match. Of course, this model also has some flaws.
For example: the current stock-to-flow ratio of gold is about 60, that is, based on the current flow, it will take 60 years to mine the current supply of gold. In about 20 years, Bitcoin's ratio is expected to reach 1,600. This price prediction and market value will far exceed the current value of all the wealth in the world.
After deflation, prices become negative and the inventory-to-flow ratio model will also be in trouble. The ratio is negative when the wallet key is lost and no new Bitcoins are produced. If observed in the graph, the stock-to-flow ratio first goes to infinity and then becomes negative.
To learn more about this model, read our guide to the Bitcoin to Stock-to-Flow Ratio Model.
Fundamental analysis tool examples
Base rank
Baserank is a cryptocurrency asset research platform that aggregates various information and comments from analysts and investors. Each review scores the cryptocurrency, and the platform takes the average to give the cryptocurrency an overall score (0 to 100). While some of the platform's premium reviews are only available to subscribers, free users can still view a comprehensive overview of reviews divided into sections, including team, utility, and investment risk. If you have limited time and want to get a quick overview of a project or token, an aggregation platform like Baserank is ideal. However, before investing, you must do in-depth research on the project that interests you.

Crypto Fees
As you can guess from the name, this tool lists the fee information for each network in the past 24 hours or 7 days. This information serves as a simple indicator for analyzing blockchain network traffic and usage. Networks that are expensive are often in high demand.
However, we cannot take this indicator at face value. To compete with other networks, some blockchains are initially built with low fees. In this case, it is recommended to combine this data with the number of transactions or other indicators to conduct a comprehensive analysis. For example: Coins with higher market capitalizations such as Dogecoin or Cardano have low transaction fees, so they rank lower in the overall rankings.

Glassnode Studio
Glassnode Studio presents a large number of on-chain indicators and data in the operation panel. Like most other tools, the platform offers a subscription service. However, the free on-chain data it provides is detailed enough for amateur investors. You can easily find various information here, which is much more convenient than manually collecting information using a blockchain browser. The main advantage of Glassnode is that it provides a large number of indicator categories and subcategories for users to browse and review. Of course, if you are interested in the Binance Smart Chain project, the information provided here is very limited.
In order to easily combine metrics with technical analysis, Glassnode Studio also has built-in TradingView and all its charting tools. Investors and traders often consider a variety of analytical tools when making decisions. Glassnode’s one-stop service is indeed a plus and attracts many users.

Summarize
When done correctly, fundamental analysis can provide insights into cryptocurrencies that technical analysis cannot match. When trading, accurately distinguishing market prices from the "true" value of a network is an excellent skill. Of course, technical analysis (TA) also has its advantages, providing information that fundamental analysis (FA) cannot predict. Therefore, many traders now use a combination of both methods.
Like many strategies, fundamental analysis (FA) is not one-size-fits-all. I hope you found this article informative and learned some of the factors you need to consider before buying or selling crypto assets.