

Summary
The Hammer candlestick is one of the most commonly used patterns in technical analysis and is widely used in cryptocurrency, stock, index, bond and forex trading. Price action traders use the Hammer candlestick to effectively identify potential reversals after a bullish or bearish trend. Depending on the context and time frame, these candlestick patterns may indicate a bullish reversal at the end of a downtrend or a bearish reversal after an uptrend. Combining the Hammer candlestick with other technical indicators, traders can choose the right time to operate long and short positions.
Bullish hammer candlestick patterns include the hammer and inverted hammer after a downtrend, while bearish hammer candlestick patterns include the hanging man and shooting star after an uptrend.
Introduction
The Hammer candlestick pattern is widely used in various financial markets and is the most commonly used candlestick pattern by traders to measure the probability of results when analyzing price trends.
Combined with trading methods such as fundamental analysis and other market analysis tools, the Hammer candlestick pattern can provide new ideas about trading opportunities. This article will explain what the Hammer candlestick pattern is and how to read it.

How do candlestick charts work?
Depending on the time frame selected, each candlestick in the candlestick chart represents a cycle. Each candlestick on the daily chart represents one day's trading activity. Each candlestick on the 4-hour candlestick chart represents 4 hours of trading.
The opening and closing prices of each candlestick chart form the body of the candle, while the wick (or shadow) represents the highest and lowest prices during that time period.
If you are not familiar with candlestick charts, it is recommended that you read our Beginner's Guide to Candlestick Charts first.
What is the Hammer Candlestick Pattern?
A candlestick with a small body and a long wick at the bottom is a hammer candlestick. The wick (or shadow) should be at least twice as long as the body. The long shadow at the bottom indicates that sellers pushed the price down before buyers pushed it up to the opening price.
The following figure shows: the opening price (1), the closing price (2) and the wick or shadow formed between the high and low prices (3).

Bullish Hammer
Hammer candlestick pattern
A bullish hammer candlestick pattern forms when the closing price is higher than the opening price, indicating that buyers have taken control of the market before the end of the trading cycle.

Inverted Hammer Candlestick Pattern
An inverted hammer candlestick pattern forms when the opening price is lower than the closing price. The long wick above the body of the candlestick indicates buying pressure that attempted to push prices higher, but was ultimately pulled lower by the close of the candlestick. Although not as bullish as a regular hammer candlestick, the inverted hammer is also a bullish reversal pattern that occurs after a downtrend.

Bearish Hammer
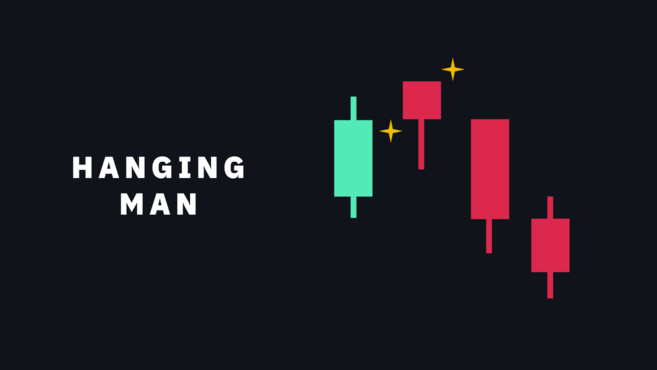
Hanging Line K-line chart
The bearish hammer candlestick pattern is called a "hanging man's neck line". A hanging man's neck line appears when the opening price is higher than the closing price, and is displayed as a red candle. The wick on the bearish hammer line indicates that the market has experienced selling pressure, showing a possible downside reversal.
Shooting Star K-line chart
The bearish inverted hammer is called a "shooting star candlestick" and is almost identical to a regular inverted hammer, but signals a potential bearish reversal rather than a bullish one. In other words, a shooting star candlestick is an inverted hammer after an uptrend. A shooting star candlestick forms when the opening price is higher than the closing price, and the wick indicates that the upward market move is coming to an end.

How to Use the Hammer Candlestick Chart to Spot Potential Trend Reversals
A bullish hammer candlestick appears during a bearish trend, signaling that the price is about to reverse, marking the bottom of the downtrend. The example below is a bullish hammer candlestick chart (Image source: TradingView).

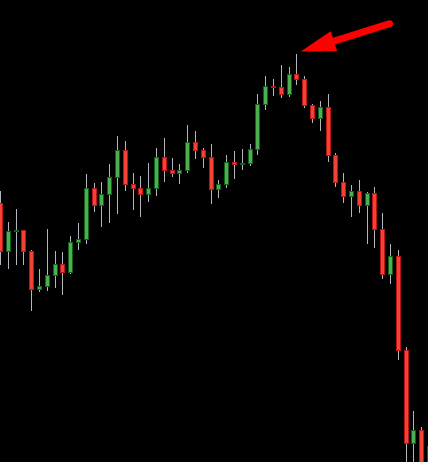
The bearish hammer candlestick chart is displayed as a hanging man, or shooting star. Both appear after a bullish trend and indicate a potential downside reversal. The example below shows a shooting star (Image source: TradingView).
Therefore, if you want to use the hammer candlestick pattern in your trading, you need to consider its position in relation to the candles before and after it. Depending on the specific circumstances before and after, a reversal pattern can either be ruled out or confirmed. Let's take a look at the various types of hammer lines.
Advantages and Disadvantages of the Hammer Candlestick Pattern
Each candlestick chart pattern has its pros and cons. After all, no technical analysis tool or indicator can guarantee that traders will win money in every financial market. When used in conjunction with trading strategies such as moving averages, trend lines, relative strength index (RSI), MACD and Fibonacci retracements, the hammer candlestick chart pattern can often achieve twice the result with half the effort.
Advantage
The Hammer candlestick chart pattern is useful for identifying trend reversals in all financial markets.
Traders can use the hammer pattern on multiple time frames and it can be effective in both swing and day trading.
Disadvantages
The hammer candlestick chart pattern is subject to the specific circumstances before and after, and a trend reversal is not necessarily a sure thing.
The Hammer candlestick pattern is not completely reliable on its own. Traders should always use it in conjunction with other strategies and tools to increase their chances of success.
What is the difference between a hammer candlestick and a doji?
The Doji is similar to the Hammer without the body. The open and close prices of the Doji candlestick are the same. While the Hammer candlestick signals a potential price reversal, the Doji usually represents sideways movement, consolidation, or an undecided market. The Doji candlestick is generally a neutral formation, but in some cases, it can precede a bullish or bearish trend.
The Dragonfly Doji pattern is similar to a Hammer or Hanging Man without the body.

The gravestone doji is similar in shape to an inverted hammer or shooting star.

However, hammers and dojis by themselves do not tell you anything. They should always be viewed in context, such as the market trend, preceding and following candlesticks, volume, and other indicators.

Summarize
The Hammer candlestick chart pattern is an effective tool for traders to identify potential trend reversals. However, these patterns themselves are not necessarily a signal to buy or sell. Similar to other trading strategies, the Hammer candlestick should be used in conjunction with other analysis tools and technical indicators to be most effective.
Traders should also adopt appropriate risk management and evaluate the return on their trades. When the market fluctuates drastically, they should also set stop-loss orders to avoid significant losses.