
Summary
TradingView is a browser-based charting platform and filter for cryptocurrencies and other financial assets. Its charting tools can also be integrated into Binance’s trading user interface. In addition to charts, you can also share personal trading strategies and live analysis and interpretation.
TradingView's free features are powerful and suitable for users of any experience level. Its basic functionality is sufficient to meet the needs of most traders. However, caution must be exercised when reading the advice of other users and watching live streams. You need to filter out the information that will help you optimize your trading strategy and refuse to blindly follow other people's opinions.
Introduction
For traders who love technical analysis, powerful charting tools are essential. TradingView is ideal for both beginners and experienced traders. It offers a variety of trading and charting tools, and also has a free membership option. Let’s be honest, not everyone can afford a Bloomberg Terminal subscription, and not everyone has the need for one.
If you have ever participated in trading on Binance, you may have noticed that we offer TradingView. But it can be intimidating if you don’t know anything about these tools. TradingView has a ton of tools to try out, so where should you start? Read our beginner's guide to learn more about TradingView's features.
是否期待将所学知识付诸实践?
What features does TradingView have?
TradingView is a platform that supports custom technical indicators, creating charts and analyzing financial assets. These indicators are patterns, trendlines, and formations used daily by millions of traders. TradingView runs entirely on a browser and does not require downloading a client. If you prefer a mobile experience, you can also download the iOS and Android versions of the app.
Launched in 2011 in Westerville, Ohio, TradingView has built a massive user base, adding 8 million new accounts in 2020 alone. Users can use free or paid accounts to analyze various stocks, commodities and cryptocurrencies such as Bitcoin through charts. After formulating a strategy and creating a template, you can publish your personal analysis results to the community, so that you can get feedback from other TradingView members and improve your trading skills during the interaction.
Using TradingView on Binance
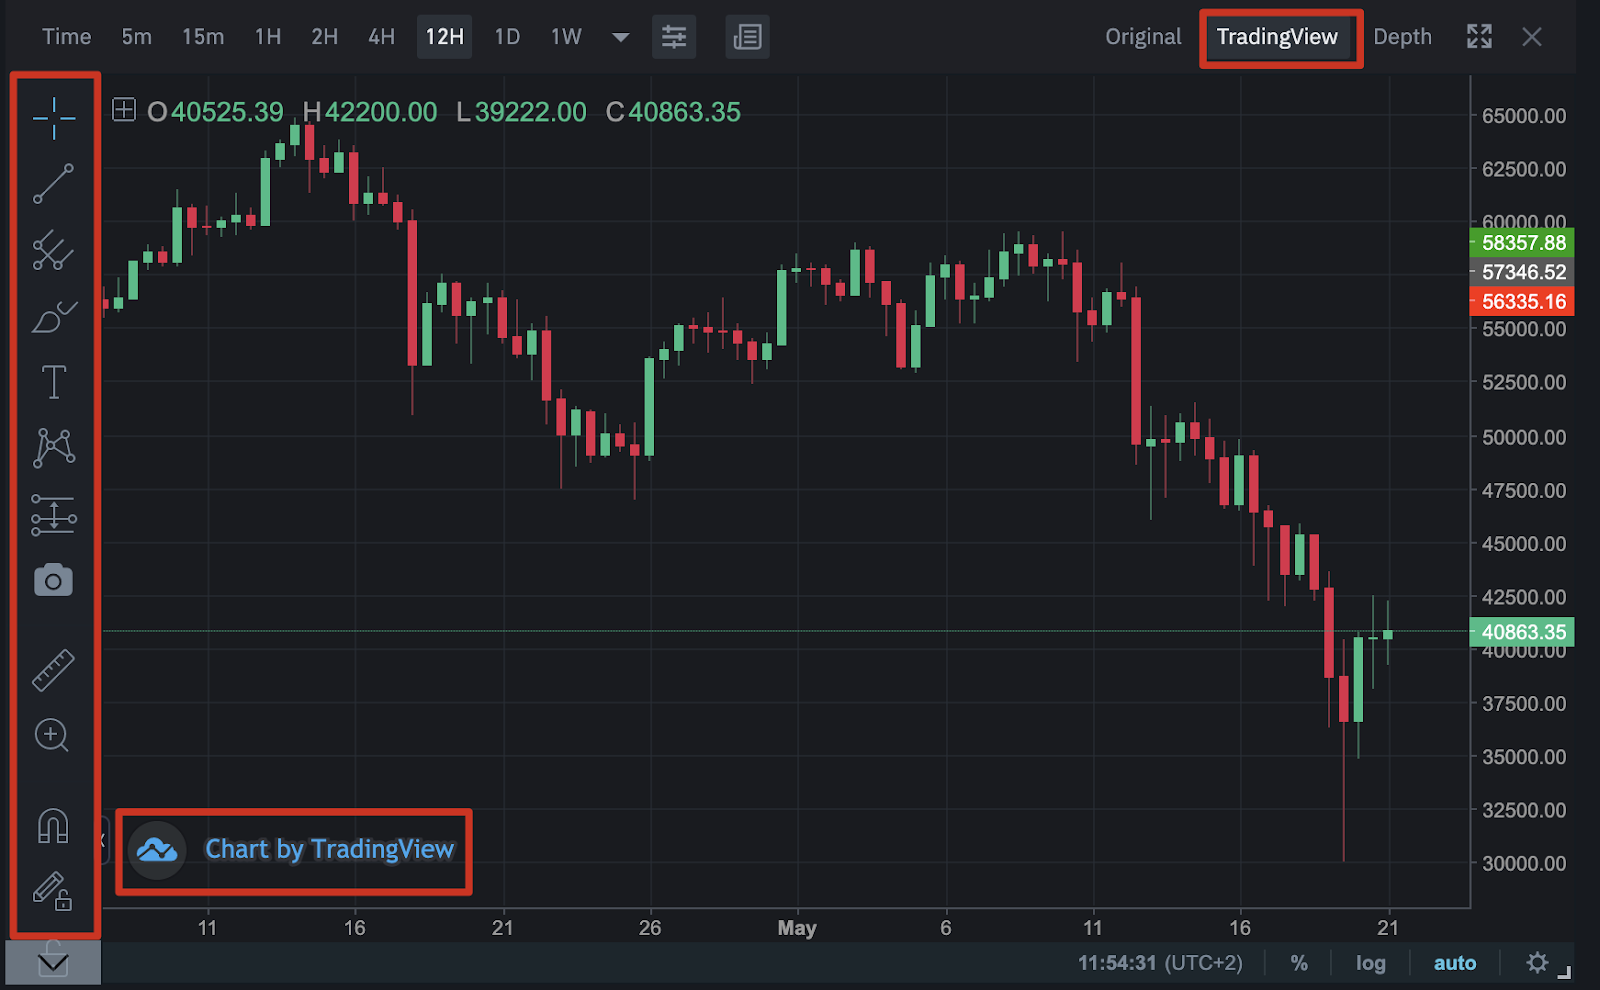
Binance has a TradingView tool built into the trading platform user interface, allowing users to create charts and conduct transactions at the same time. The tools shown on the left are just a small selection and the user experience is very similar to the TradingView website.
If you want to quickly understand the interface, please read "How to Use the TradingView Tool of Binance Webpage".
How much does TradingView cost?
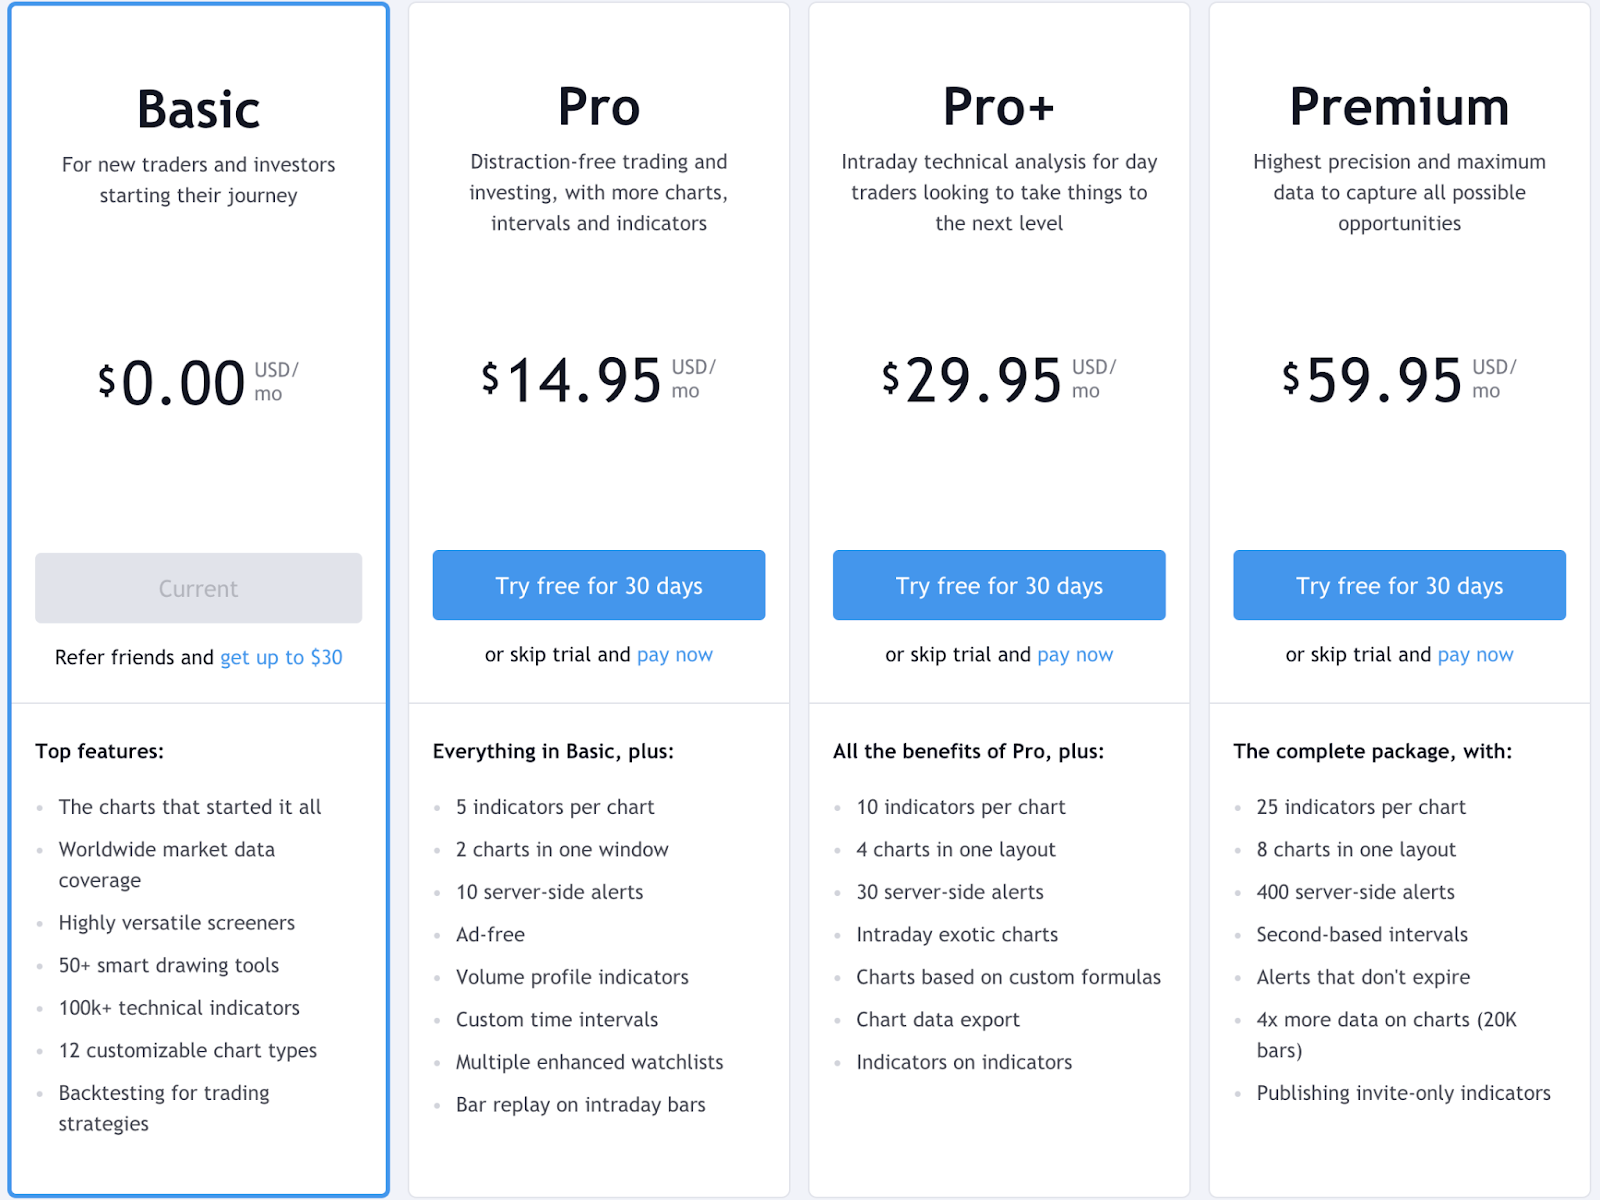
As mentioned above, TradingView is free and open to everyone. Users can also choose a premium subscription version to increase the indicators and charts displayed on the interface. For beginners, the free account provides one chart and three indicators, which is enough to get started. Although I have to endure the advertising push, it is not too frequent. The image below shows the details of the various packages:
What is TradingView Social Network?
TradingView has a like function similar to Instagram for sharing and showcasing trading strategies. The Views and Live pages of the website provide you with the opportunity to receive suggestions and feedback. Visit the Views page to view charts, videos, and comments posted by other users. Community members can also participate in discussions or join chat rooms. Please note that all users have the right to speak, but each trader's style and strategy is different, so personal opinions should not be construed as financial advice.
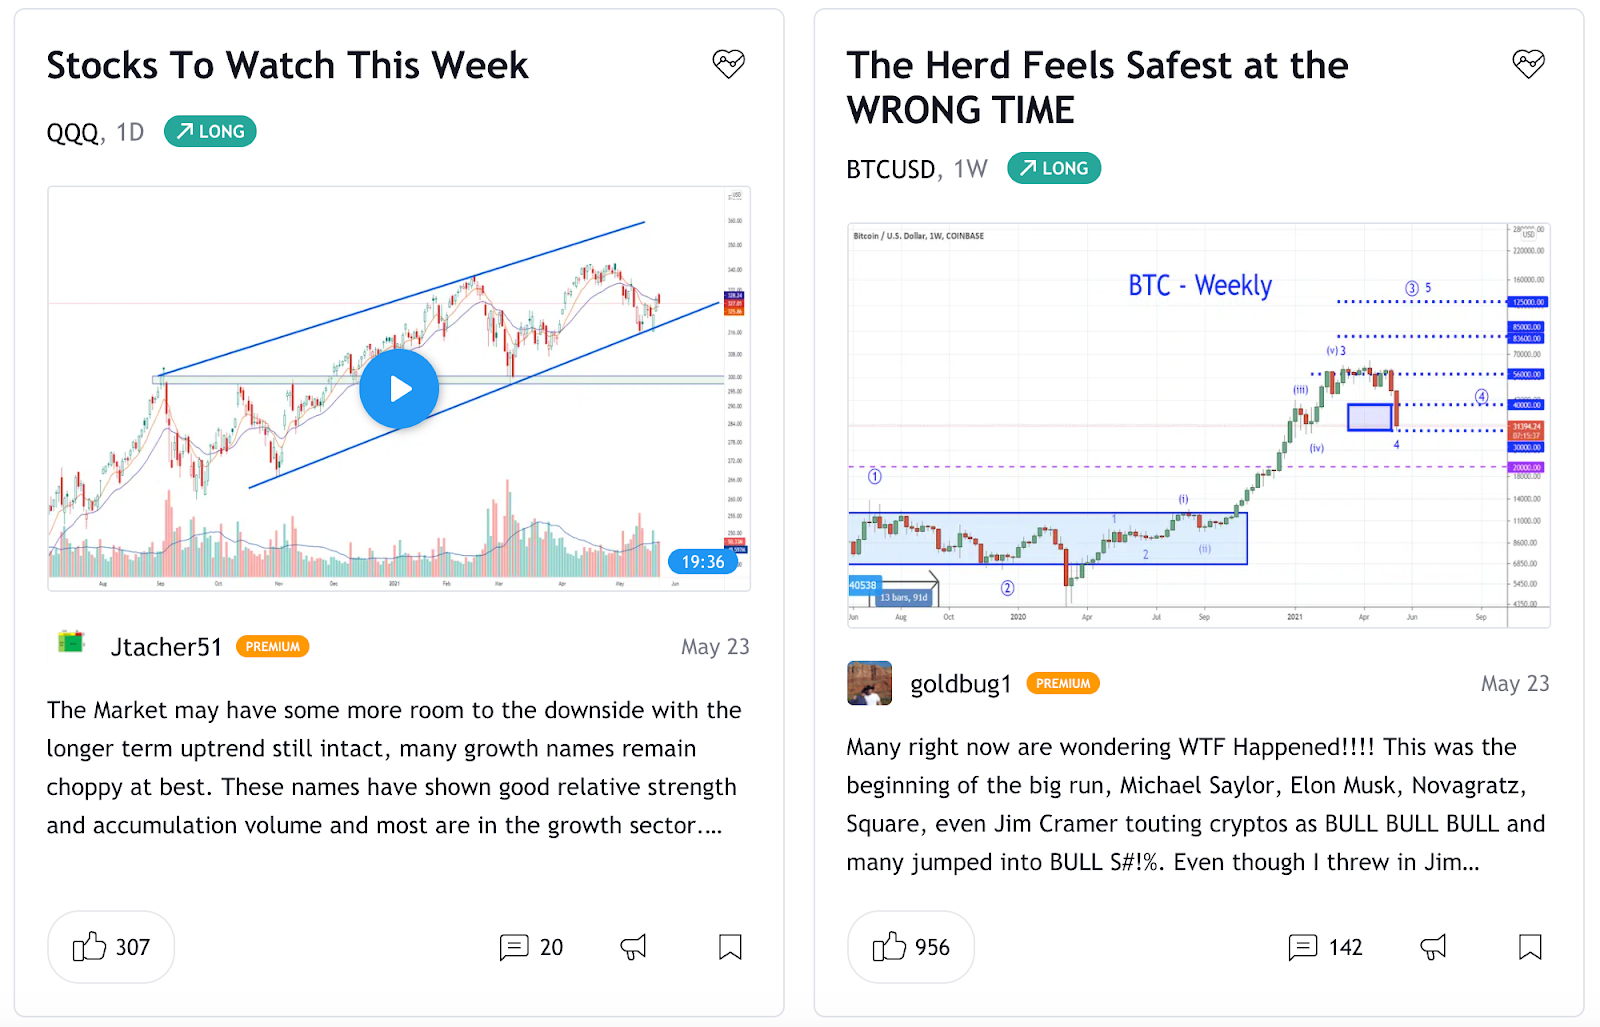
Just like watching your favorite gamers live on the Twitch platform, TradingView Live shows users charts created by other traders in real time. This interesting add-on feature is still in beta and has relatively little content.
Understanding TradingView’s User Interface
If you have never used any charting tools, you may think that TradingView is difficult to operate. For ease of understanding, we divide the interface into different areas.
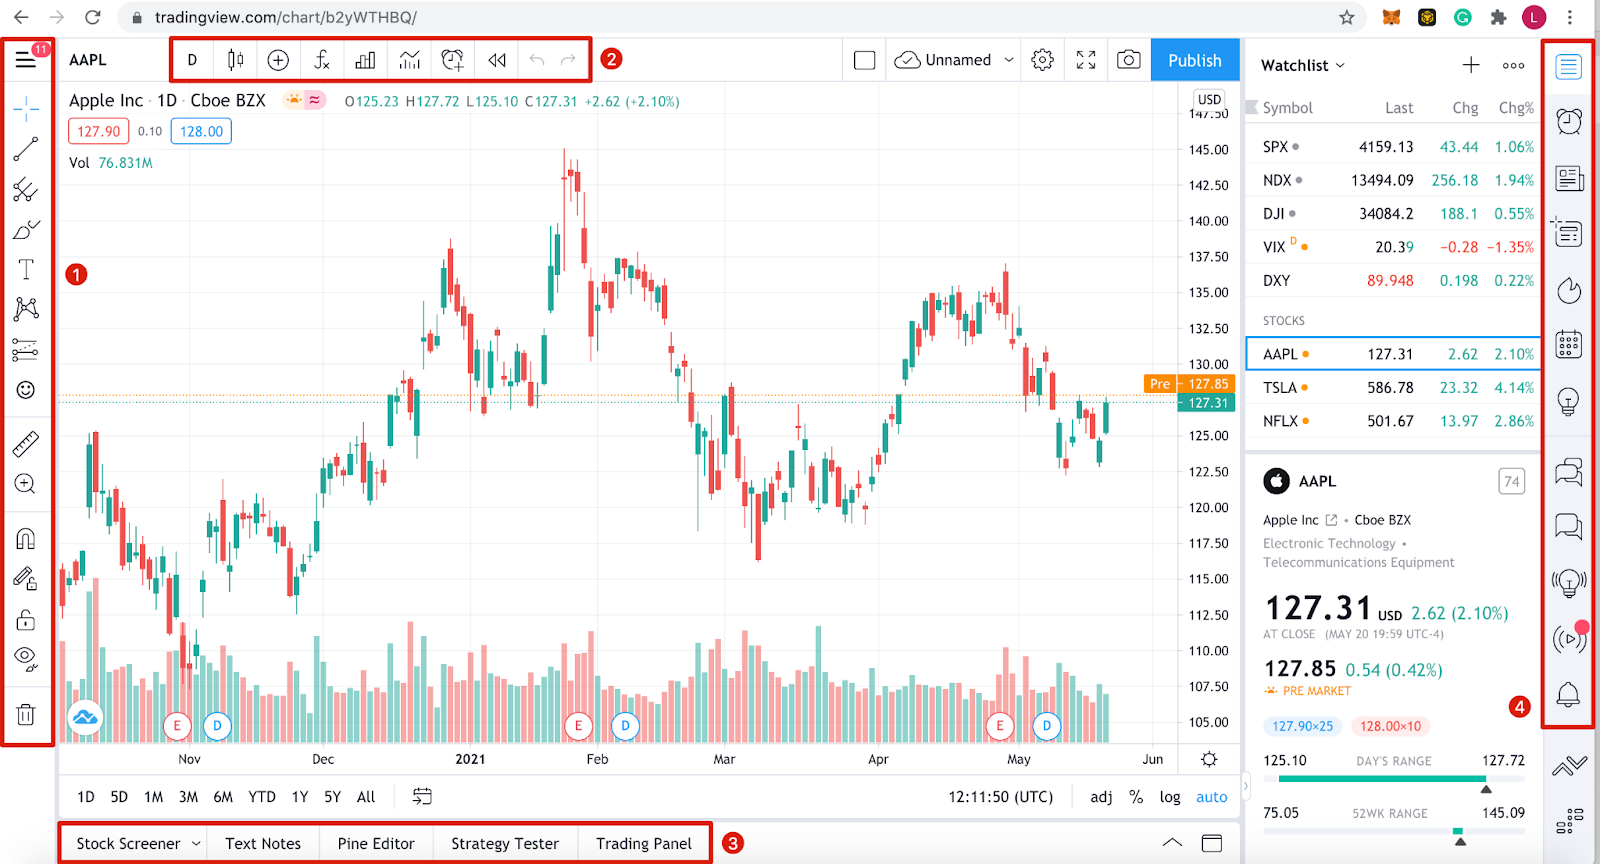
Toolbar 1
This toolbar lists all charting and drawing tools that can be used directly in the chart area. From simple data lines to long/short positions, there are tons of tools to call upon. You can also right-click on various tools to view extension options. Some options are more advanced, but the default functionality is sufficient for basic users.
Toolbar 2
Options for changing the appearance of the chart are listed here. You can choose to use K-line charts, line charts, area charts, etc. There is also a search bar on the left to change the assets displayed. Another tool to note is the Indicators & Strategies button, which is used to insert pre-made analysis patterns such as moving averages.
Toolbar 3
TradingView does not provide broker services, but allows trading within the website using the [Trading Panel] tab. A list of TradingView’s trading partners can be found here. Of course, you must open an account with the corresponding company. You can also use the [Strategy Tester] function to backtest your own strategies.
Toolbar 4
This section mainly covers news and the social elements of TradingView. Here you can customize your watchlist, send private messages to other users, browse views and live streams, and view a personalized calendar. Data, lists or information can also be viewed here.
chart area
To change the asset you are viewing, use any tools, or place indicators, go to the main chart area where they are located. You can customize almost anything, which we'll cover in the next section.
准备好试试交易了吗?
How to personalize TradingView charts?
Everyone has their own preference for chart layout. You can customize the colors, lines, and axes to make interpreting the chart easy and fast. Right-click the chart area and click [Settings] to find all options.
Through the [Settings] menu, you can reset chaotic charts and customize price reminder emails.
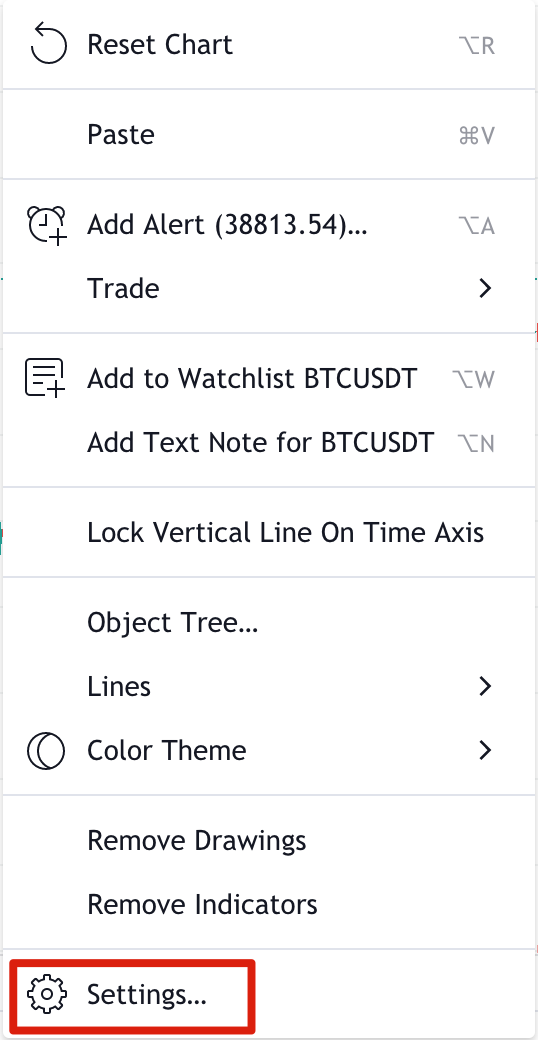
After clicking [Settings], you can enter the [Chart Settings] window, where there are many different options. Let’s take a quick look at the basic options.
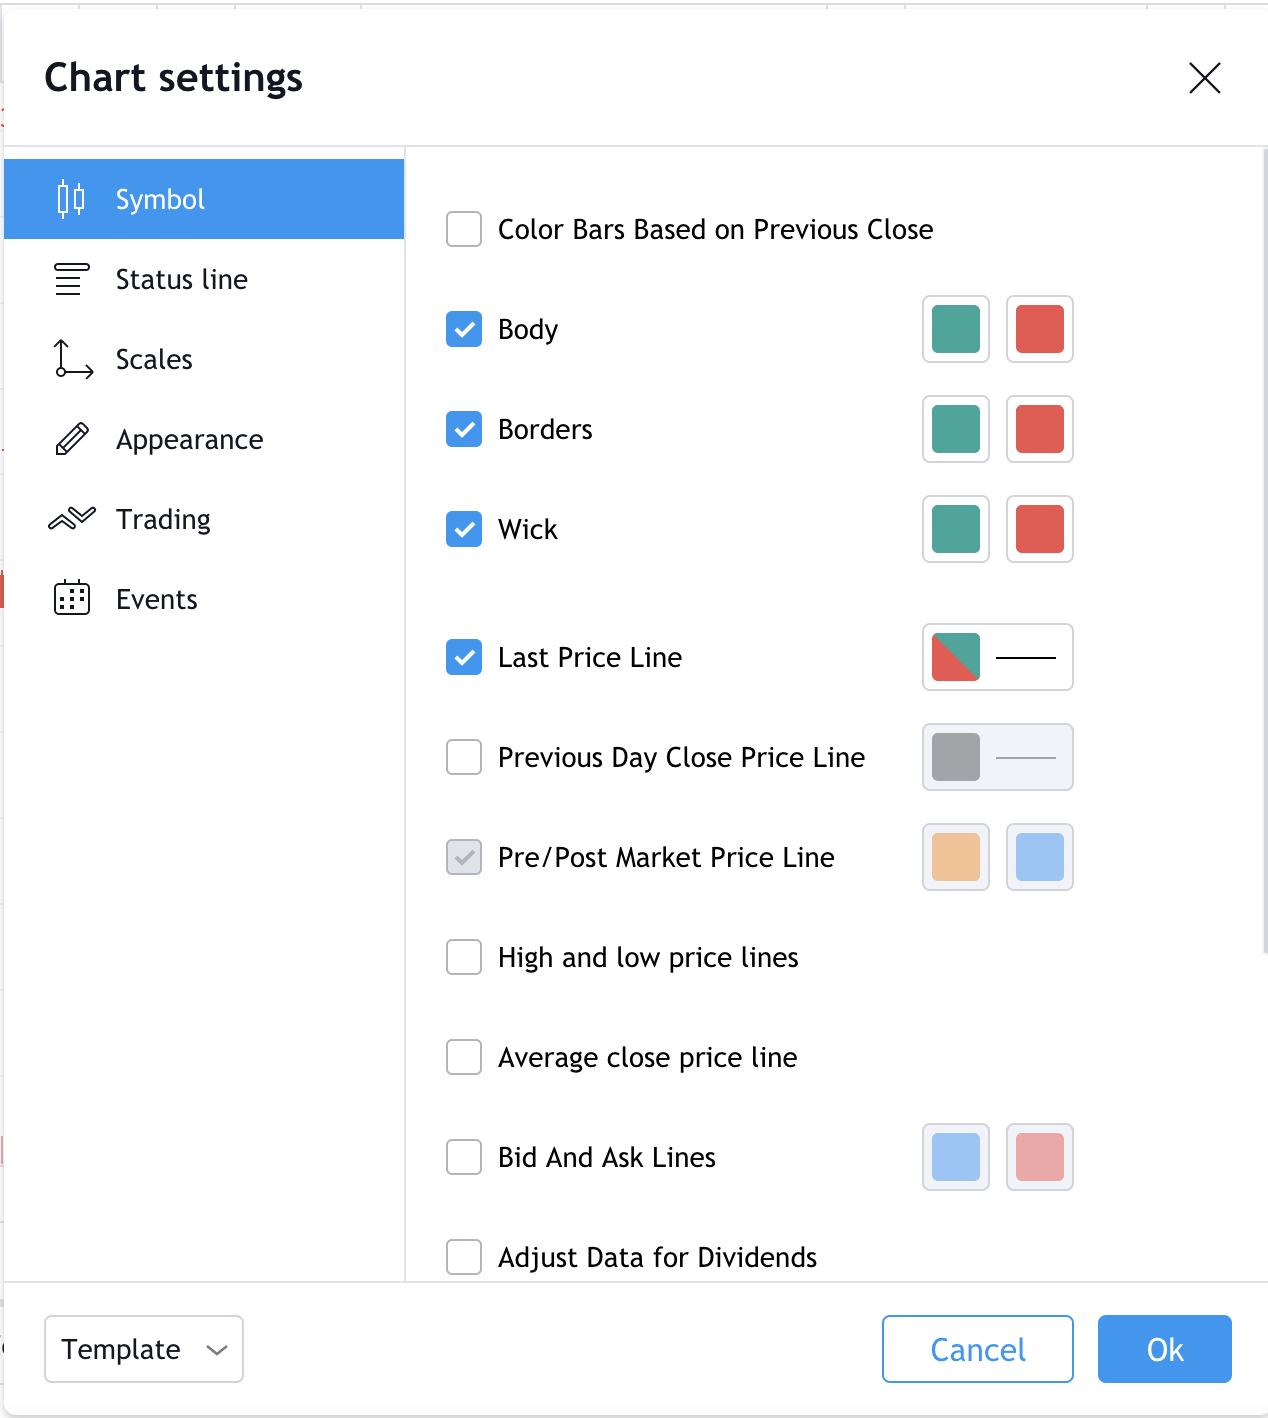
1. [Product Code] - Change the appearance of the K-line chart. All parts of the K-line chart can be colored.
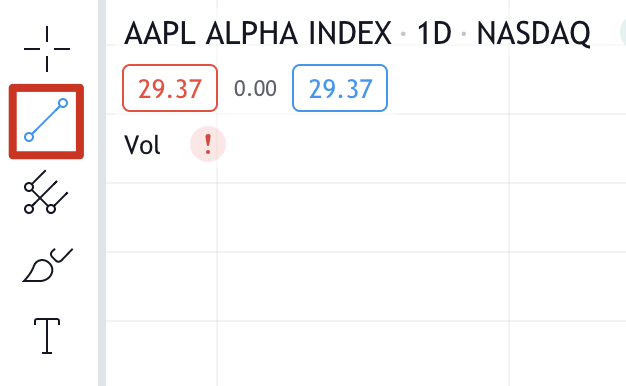
2. [Status Row] - Option to change the information in the upper left corner of the chart, such as OHLC (opening, high, low and closing) data and buy and sell buttons. The red box shows the lowest asking price (38,345.96), and the blue box shows the highest offer (38,345.97). The difference between the two is the bid-ask spread (0.01).

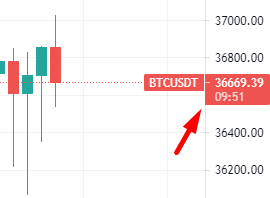
3. [Coordinates] - Change the tracking indicator of the right axis. For example, you can add the day's high and low prices or a bar close countdown.
4. [Appearance] - Change grid lines, background color, coordinate axes and other appearance features.
5. [Trading] - If you are logged in to your brokerage account, you can customize the visual elements through this option.
6. [Events] - Options to display dividends, splits and other events in the chart area.
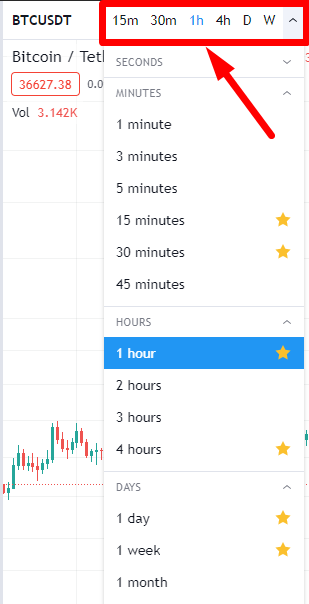
In addition to setting up the chart view, you may also need to change the intervals of candlestick charts or other commodity symbols. To do this, click the button on the far left of the top bar. You'll find a list of different time intervals ranging from seconds to months. You can also favorite intervals and they will appear on the top bar.
No need to save custom charts manually. TradingView will save all edited content in real time, and it will not be affected if you log out and log in again.
Draw trend lines
The first chart should definitely start with the trend line. This is a price action modeling method for beginners and is the most commonly used chart pattern for day trading and swing trading.
1. To draw a trend line, select the line tool from the left toolbar.
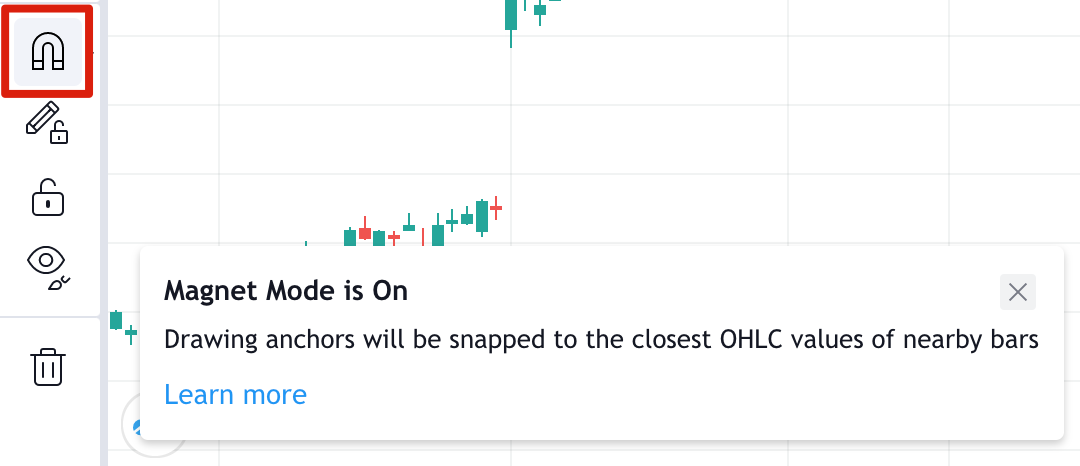
2. You may also want to activate the magnet tool. Lines snap to any nearby OHLC points, helping improve accuracy.
3. For a downtrend, start from the local high (point 1) just before the price fell, which is called the "swing high". Click to select the starting point of the line, covering as many high points as possible. Click again to complete the trend line drawing.
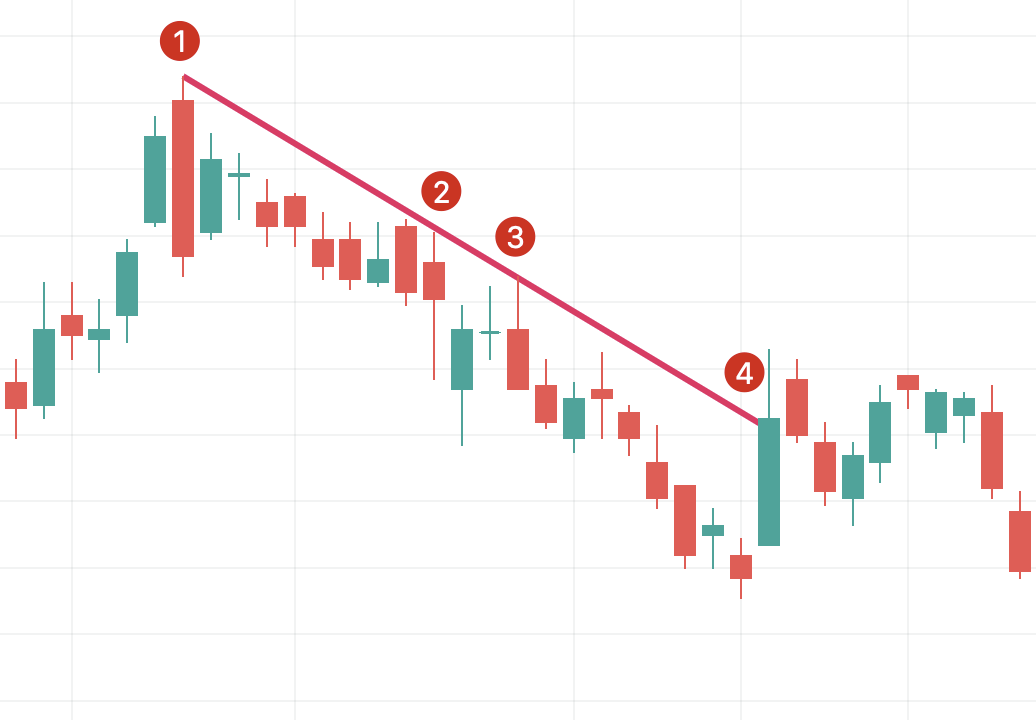
Points 1, 2 and 3 indicate resistance points. It is recommended to use at least three points to test a trend line, two points may just be a coincidence. Point 4 is a trend breakout point and indicates that it is best to draw a new trend line.
Once a downtrend has been identified, one potential response strategy is to sell when price hits and tests the trendline. If you decide to draw an uptrend, you must choose a low price point as the starting point of the line so that the line is below the K-line chart.
For more information, please read "Detailed Explanation of the Basic Principles of Support and Resistance".
Draw bifurcation lines
Bifurcation lines are a higher-end chart version of the extended trendline concept. This technical indicator was created by Alan Andrew, a famous American investor and educator in the 20th century. Drawing a bifurcation line is simple and provides more insights than a simple trend line. Let’s take a look at it step by step.
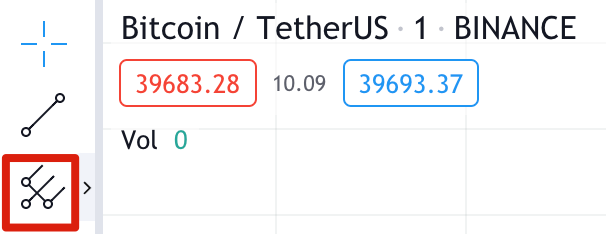
1. First, select the Split Line tool under Line Tools.
2. We select three points to draw bifurcation lines at the starting point and end point of the trend.
3. As shown in the example below, we start at point 1, which is the swing low of the downtrend. Then click on point 2, the swing high of the uptrend, followed by point 3, the swing low of the next downtrend.
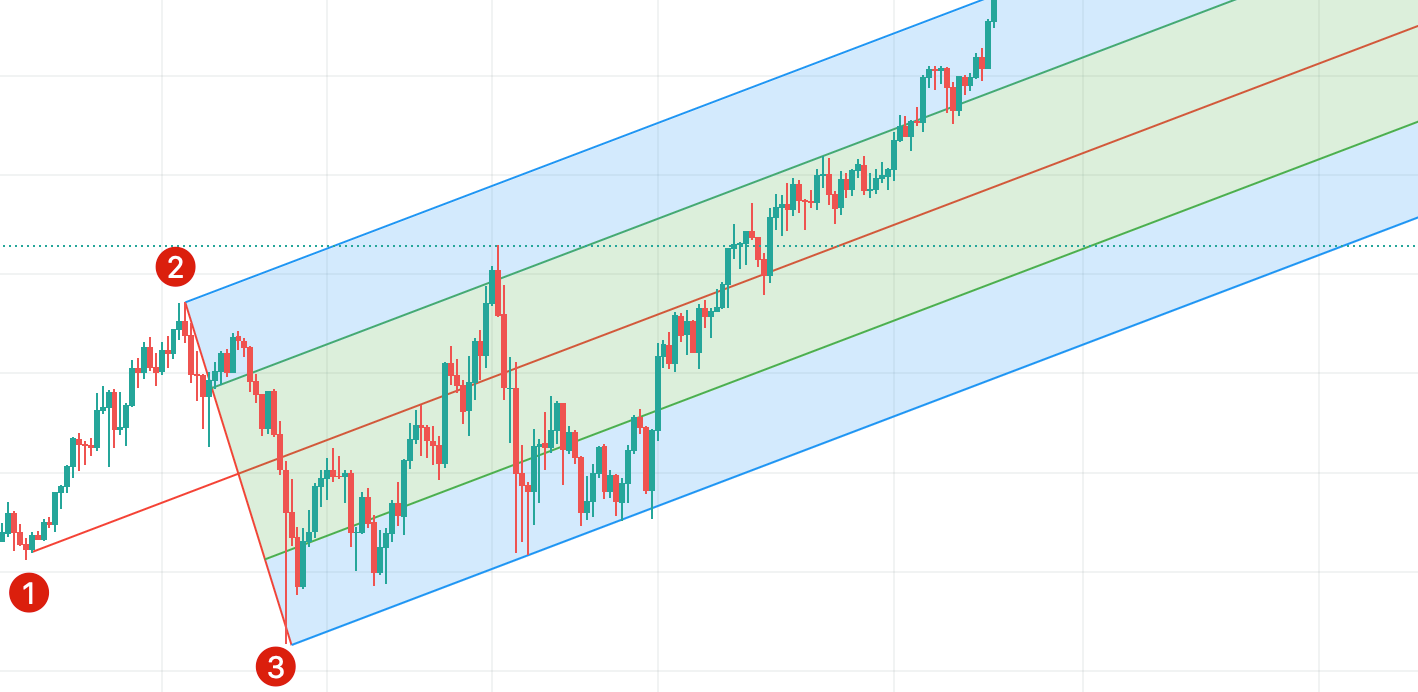
4. These points form a bifurcated pattern, with the top line extending from point 2 showing resistance and the bottom line extending from point 3 showing support. The midline is where price is expected to trend.
5. Similar to the trendline example, support lines show areas to buy and resistance lines to sell. Stop-loss orders can also be set below the bottom trend line to implement risk management. Please note that bifurcation lines, like other indicators, may not necessarily work. It is recommended to use it in conjunction with other tools and strategies to reduce overall risk.
If you are interested in learning more, please read "How to Create Technical Analysis Indicators in TradingView".
Advantages and Disadvantages of TradingView
There are various asset screeners in the market, and TradingView is just one of them. Their charts and trading tools are similar, let’s take a look at the main features. Some of TradingView's features are really great, but there are still things that could be improved.
advantage
HTML5 Charts - TradingView is available on all devices with a web browser. Charts can be viewed anytime, anywhere without installing any software.
Free - Most features are free and available to everyone.
Server-side alert system - If you set an alert, TradingView will track relevant developments in the server. You can receive alert notifications even if TradingView is not open.
Compatible with Binance - Although you cannot log into Binance on the TradingView website, you can use TradingView through Binance’s trading interface. You can easily buy and sell cryptocurrencies on Binance and create charts instantly.
Scripts - Advanced users can create custom indicators that are saved to the TradingView server. This feature is provided by Pine Script, TradingView’s custom coding language that is simple and easy to use.
Asset Screening - A wide range of stocks, securities, commodities and forex information can be viewed via charts. TradingView is certainly not limited to cryptocurrencies!
Backtesting – Once you’ve developed your strategy, easily implement backtesting using TradingView’s built-in functionality.
shortcoming
Community Issues - While the concept of live streaming and views is attractive, the quality of the content varies. Many of the suggestions are highly speculative and not very helpful to new users. Controversial opinions occasionally appear in the comments section.
Customer Service – The TradingView community often complains about TradingView’s customer service. Only paid users can report issues, free users don't get any support.
Broker Integration – TradingView integrates with several brokers and trading platforms, but the selection is still quite limited.
Cboe BZX Data - The U.S. stock prices displayed by TradingView are not direct data on the underlying stock market. For example, the Nasdaq stock price comes from the Cboe BZX trading platform and may deviate slightly from the actual price. Real-time data from the trading platform is available for a fee.
交易未必困难重重
Summarize
For a free solution with tons of built-in tools, TradingView is a solid and reliable choice. It provides free educational resources that provide a comprehensive and detailed introduction to the basics of charting and technical indicators.
However, its social functions are less than satisfactory. Chat rooms are filled with speculative propositions that serve no purpose. Therefore, TradingView’s social features are difficult to attract beginners. After all, it takes a lot of time and energy to identify the pros and cons of suggestions.
Even so, TradingView's charting capabilities are powerful, and this alone is worth a try. Moreover, it is also an ideal platform for backtesting trading strategies. Technical analysis is a complex subject, and you can explore it in depth simply by signing up for a free account.
Disclaimer: The content presented in this article is for educational purposes only. This article does not constitute an endorsement or recommendation, nor should the information provided be considered financial advice. All screenshots are from TradingView’s official website and comply with the corresponding terms of use.