

What is a trend line?
In financial markets, a trendline is a diagonal line drawn on a chart. Trendlines connect specific data points, making it easy for chartists and traders to understand price movements and understand market trends.
Trendlines are considered one of the most fundamental tools in the field of technical analysis (TA) and are widely used in the stock, fiat, derivatives and cryptocurrency markets.
In essence, trend lines work like support and resistance levels, but they are made up of diagonal lines rather than straight horizontal lines. Therefore, trend lines have positive and negative slopes. Generally, the larger the slope, the more obvious the trend.
We can divide trend lines into two basic categories: up (uptrend) and down (downtrend). As the name suggests, an uptrend line is drawn from the low to the high of the chart. This line connects two or more points, as shown in the figure below.

A downtrend line, on the other hand, is drawn from the high to the low on the chart. The line connects two or more points.
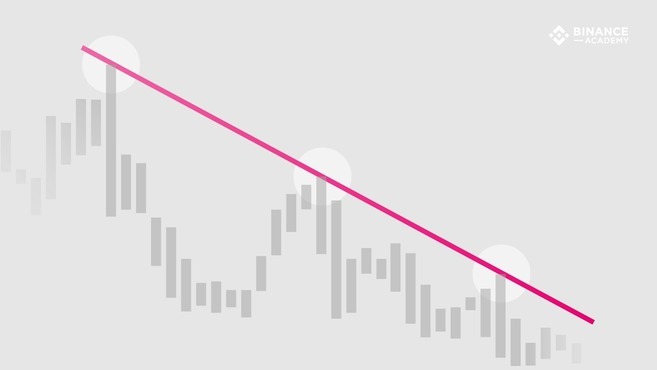
Therefore, the difference between the two trend lines is reflected in the point selection of drawing the trend line. In an uptrend, a trendline is drawn using the lowest point on the chart (such as a candlestick bottom forming a higher low). On the other hand, a downtrend line is drawn using the highest values (i.e. the top of the candlestick forms a lower highest price).
How to use trend lines
Looking at the highs and lows on the chart, the trend lines will show where price briefly impacted the main trend, tested it, and then moved back into its favor. Trend lines can be extended and used to predict various key levels in the future. Trend lines can withstand several tests and have analytical value as long as they do not break through the critical point.
Although trend lines can be used in various types of data charts, they are actually most widely used in financial charts (based on market prices) because trend lines can provide insight into market supply and demand. There is no doubt that an upward trend line represents rising purchasing power (supply exceeds demand), while in a downward trend line, prices will continue to fall, indicating that purchasing power continues to decrease (supply exceeds demand).
However, transaction volume must also be taken into account when analyzing. For example, if prices rise but trading volume declines or is relatively low, this could create the appearance of artificially high demand.
As mentioned earlier, trend lines can be used to grasp the specifics of support and resistance levels, two basic concepts that are very important in the field of technical analysis. An ascending trendline would show support, and it is unlikely that the price will fall below the support level. Conversely, a downtrend line would show resistance above which price is unlikely to rise.
In other words, if a stock price breaks through a support or resistance level, either downward (for an uptrend) or upward (for a downtrend), the market trend is no longer of analytical interest. In many cases, if these key levels fail to stabilize the trend, the market will tend to change direction.
That being said, technical analysis is a more subjective realm, as everyone tends to draw trend lines in a different way. Therefore, a variety of technical analysis methods and basic analysis methods must be combined to effectively reduce risks.
Draw analytical trend lines
Technically speaking, a trendline can connect just two points on a chart. However, most charting experts agree that a trend line must connect three or more points to be of analytical value. In some cases, the first two points can be used to show potential trends, while the third point (extended in the future) can test validity.
Therefore, if the price touches the trend line three or more times without breaking through the critical point, then the trend can be considered of analytical value. If a trend line is tested multiple times, it is a sign that the trend may not be just a coincidence caused by price movements.
Gauge settings
When drawing a trend line, in addition to selecting enough points to make the trend line analytically meaningful, it is also necessary to consider appropriate setup factors. Among them, the most important chart setting is the scale setting.
In financial charts, the specific scale may depend on how the price shown is changing. Two of the most commonly used scales are the arithmetic scale and the semi-log scale. In an arithmetic chart, variables are clearly displayed as price moves up and down the Y-axis. Semi-logarithmic charts, on the other hand, express fluctuations in percentage terms.
For example, in an arithmetic chart, the price movement from $5 to $10 is equidistant from the line segment from $120 to $125. Whereas on a semi-log chart, a 100% gain ($5 to $10) would occupy a larger area of the chart, a move from $120 to $125 would represent only a 4% increase.
When drawing a trend line, be sure to consider it in conjunction with the scale settings. Because various types of charts may produce different highs and lows, the trend lines may differ slightly.
Summarize
Although trend lines are a powerful tool in the world of technical analysis, they are not foolproof. The points selected for drawing trend lines may affect the accuracy of their representation of market cycles and true trends, and are, to a certain extent, subjective.
For example, when drawing trend lines, some graphic experts only consider the main body of the candlestick chart and ignore its shadow lines. Others draw trend lines based on the highest and lowest prices of shadow lines.
Therefore, when drawing trend lines, it is important to consider them in conjunction with other charting tools and indicators. Some of the more famous technical analysis indicators include Ichimoku Clouds, Bollinger Bands (BB), MACD, Stochastic RSI, RSI, and Moving Averages.