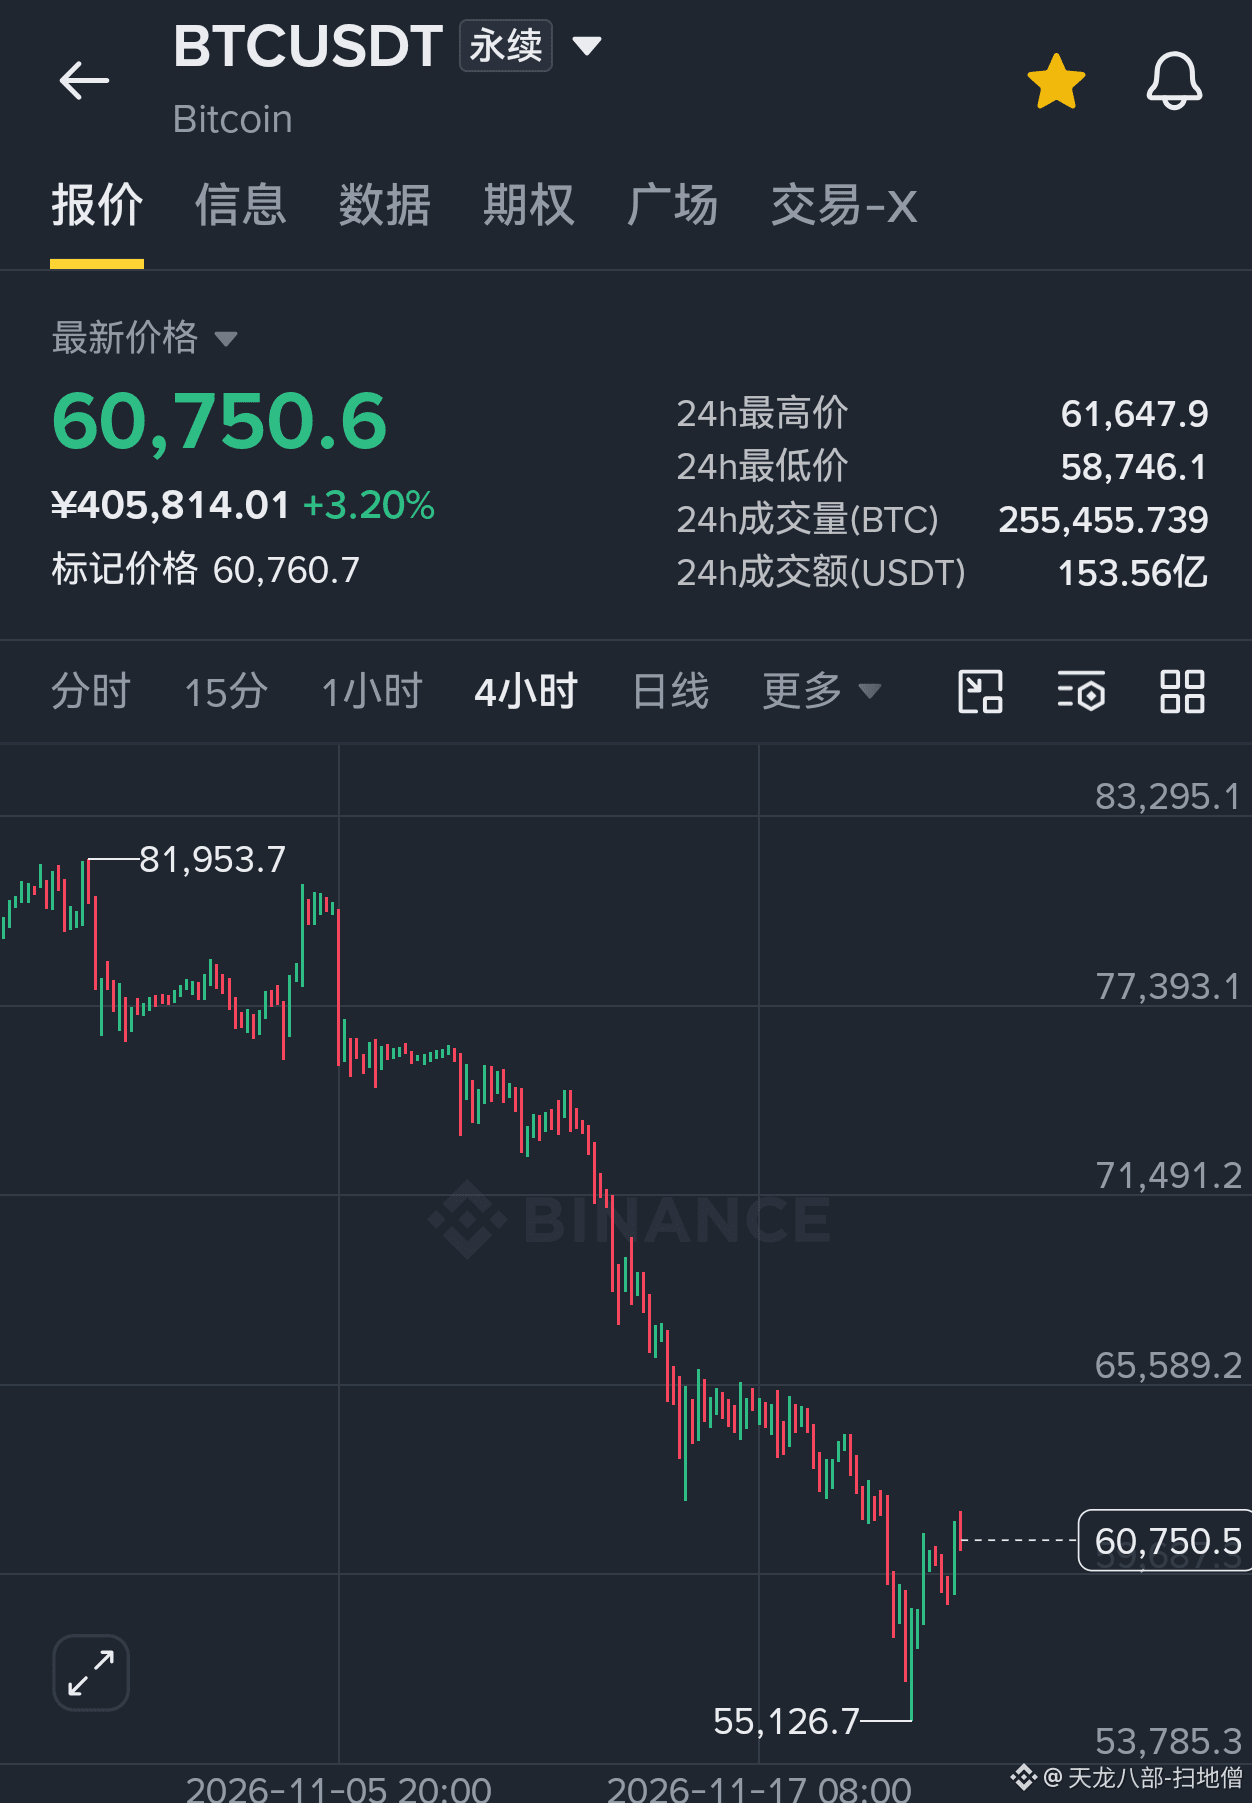
$BTC How does this trend look like it’s heading to 64100, 65400? The medium-term indicators are lagging, but it is still bullish for now. The question now is whether the short-term bearish signal will lead to a large drop, whether it will be sideways decline or a straight fall. If it keeps ranging, there is a high probability it will rise later.
First, yesterday’s price action rallied to around 68600 and then ranged. Later, it moved toward the strong resistance at 61000. Today’s pullback support is around 68600, which is enough to show that the support level is moving upward. Don’t keep thinking that after such a big rally, the bottom has to be built first. If it breaks below 68600 again, then where exactly is the high point of this pullback? Is it 62300, 64100, or 65400? Nobody knows; it all depends on the big players’ preference. Different highs can make futures traders’ trend strategies collapse, so only swing trading is an option.
If the strong resistance at 61000 is broken, anything can happen. Of course, whether the big players will use a seductive move is also unknown. Focus mainly on swing trading, remember to set stop losses, and move profits to breakeven stops. Don’t try to eat the whole cake in one bite at this critical point.
I said before that the weekly KDJ indicators have bottomed and turned up, and MACD is in a three-line flat pattern. MACD is in the phase of a death cross breaking below the zero axis. Just these three major indicators alone show that the market can rise, but it can also tug at the bottom or even enter a downtrend. The daily and 12-hour indicators are not perfect enough, which makes the subsequent overall market trend equally foggy.
Still the same: be stable with swing trading, and don’t chase trends.
First, yesterday’s price action rallied to around 68600 and then ranged. Later, it moved toward the strong resistance at 61000. Today’s pullback support is around 68600, which is enough to show that the support level is moving upward. Don’t keep thinking that after such a big rally, the bottom has to be built first. If it breaks below 68600 again, then where exactly is the high point of this pullback? Is it 62300, 64100, or 65400? Nobody knows; it all depends on the big players’ preference. Different highs can make futures traders’ trend strategies collapse, so only swing trading is an option.
If the strong resistance at 61000 is broken, anything can happen. Of course, whether the big players will use a seductive move is also unknown. Focus mainly on swing trading, remember to set stop losses, and move profits to breakeven stops. Don’t try to eat the whole cake in one bite at this critical point.
I said before that the weekly KDJ indicators have bottomed and turned up, and MACD is in a three-line flat pattern. MACD is in the phase of a death cross breaking below the zero axis. Just these three major indicators alone show that the market can rise, but it can also tug at the bottom or even enter a downtrend. The daily and 12-hour indicators are not perfect enough, which makes the subsequent overall market trend equally foggy.
Still the same: be stable with swing trading, and don’t chase trends.